Zebra

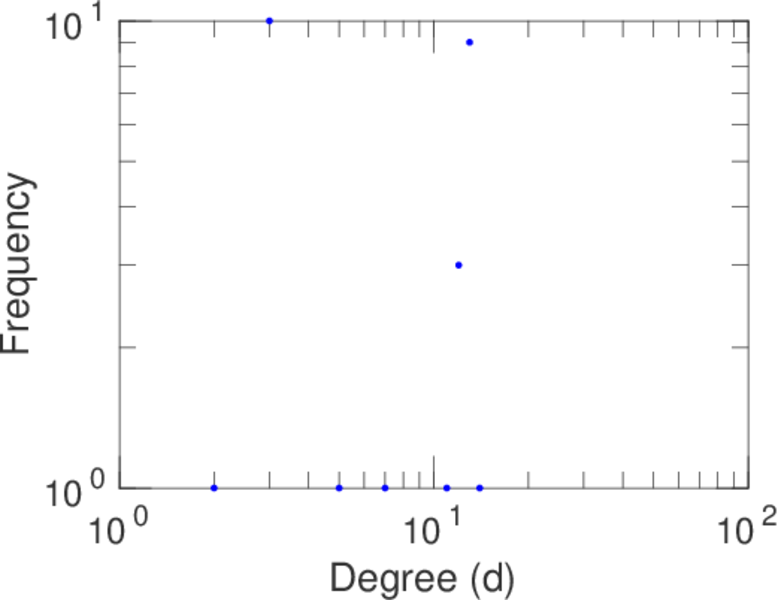
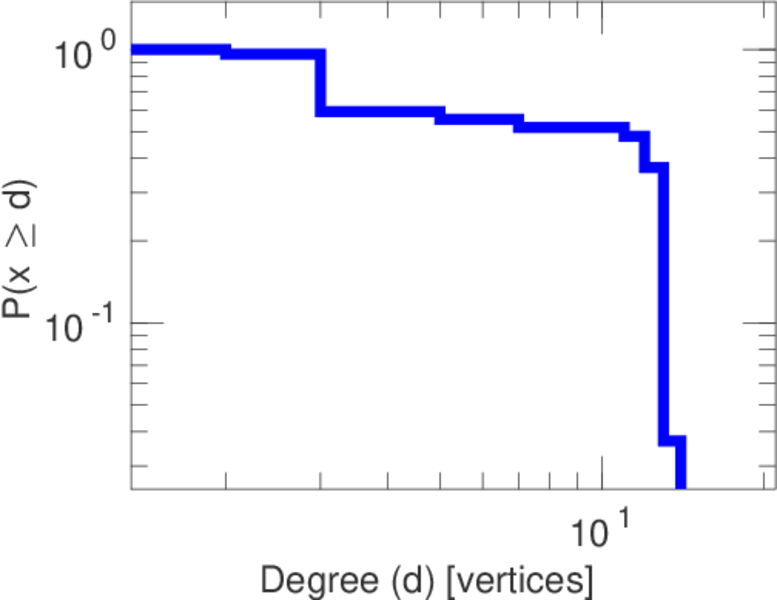
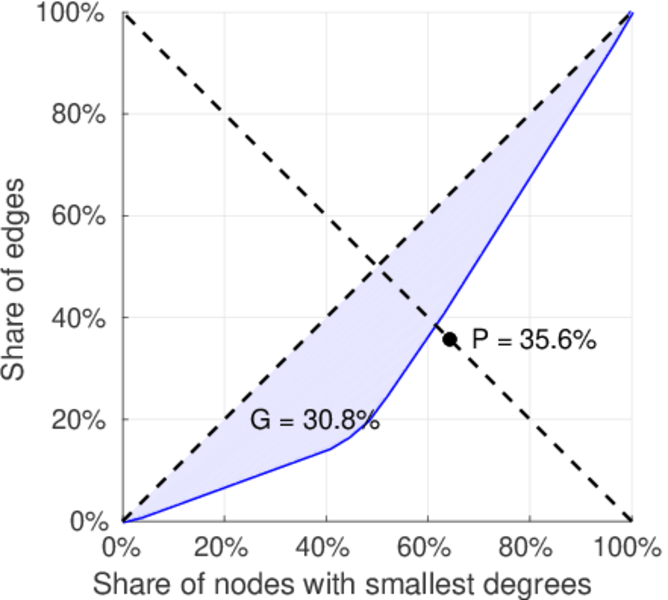
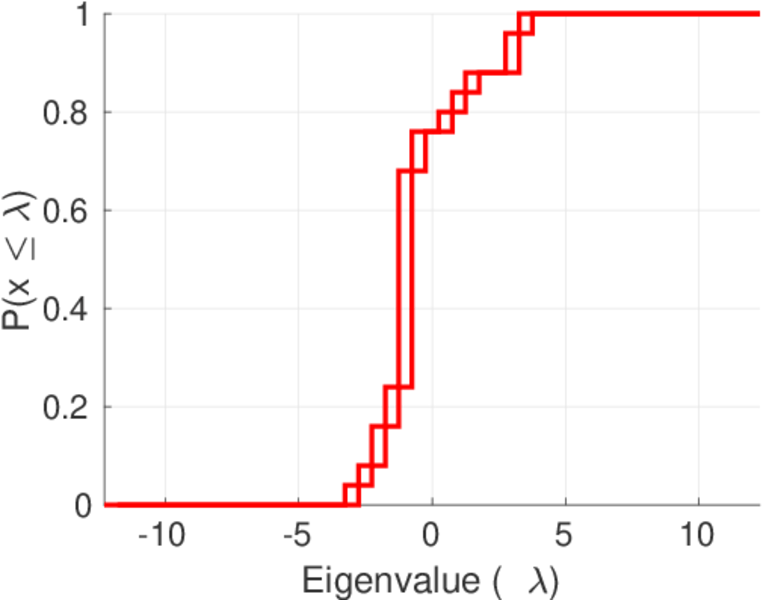
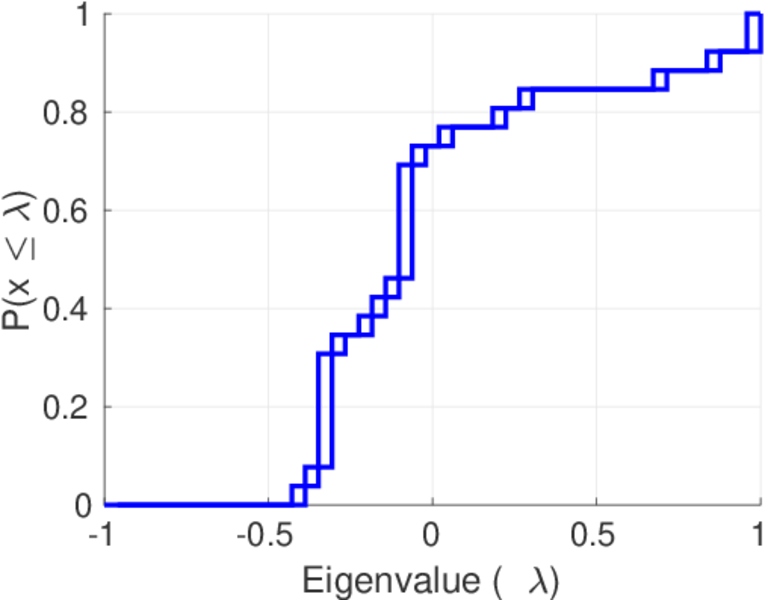
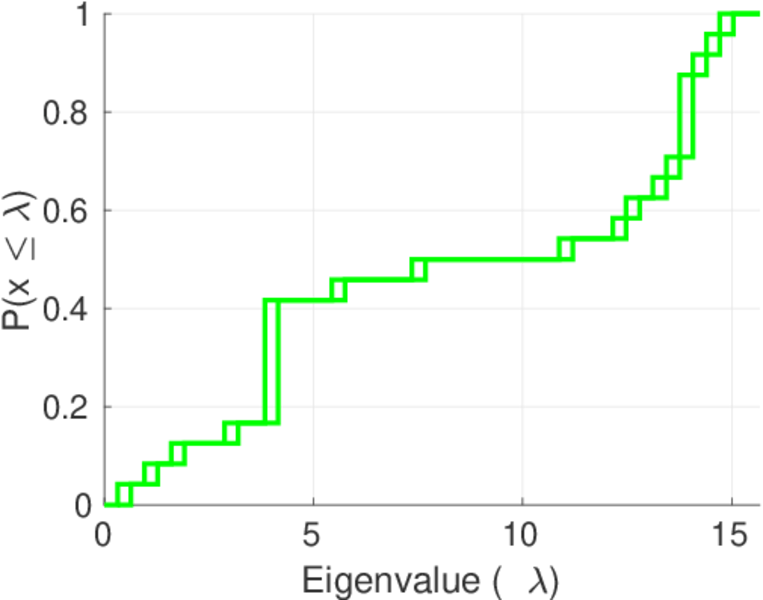
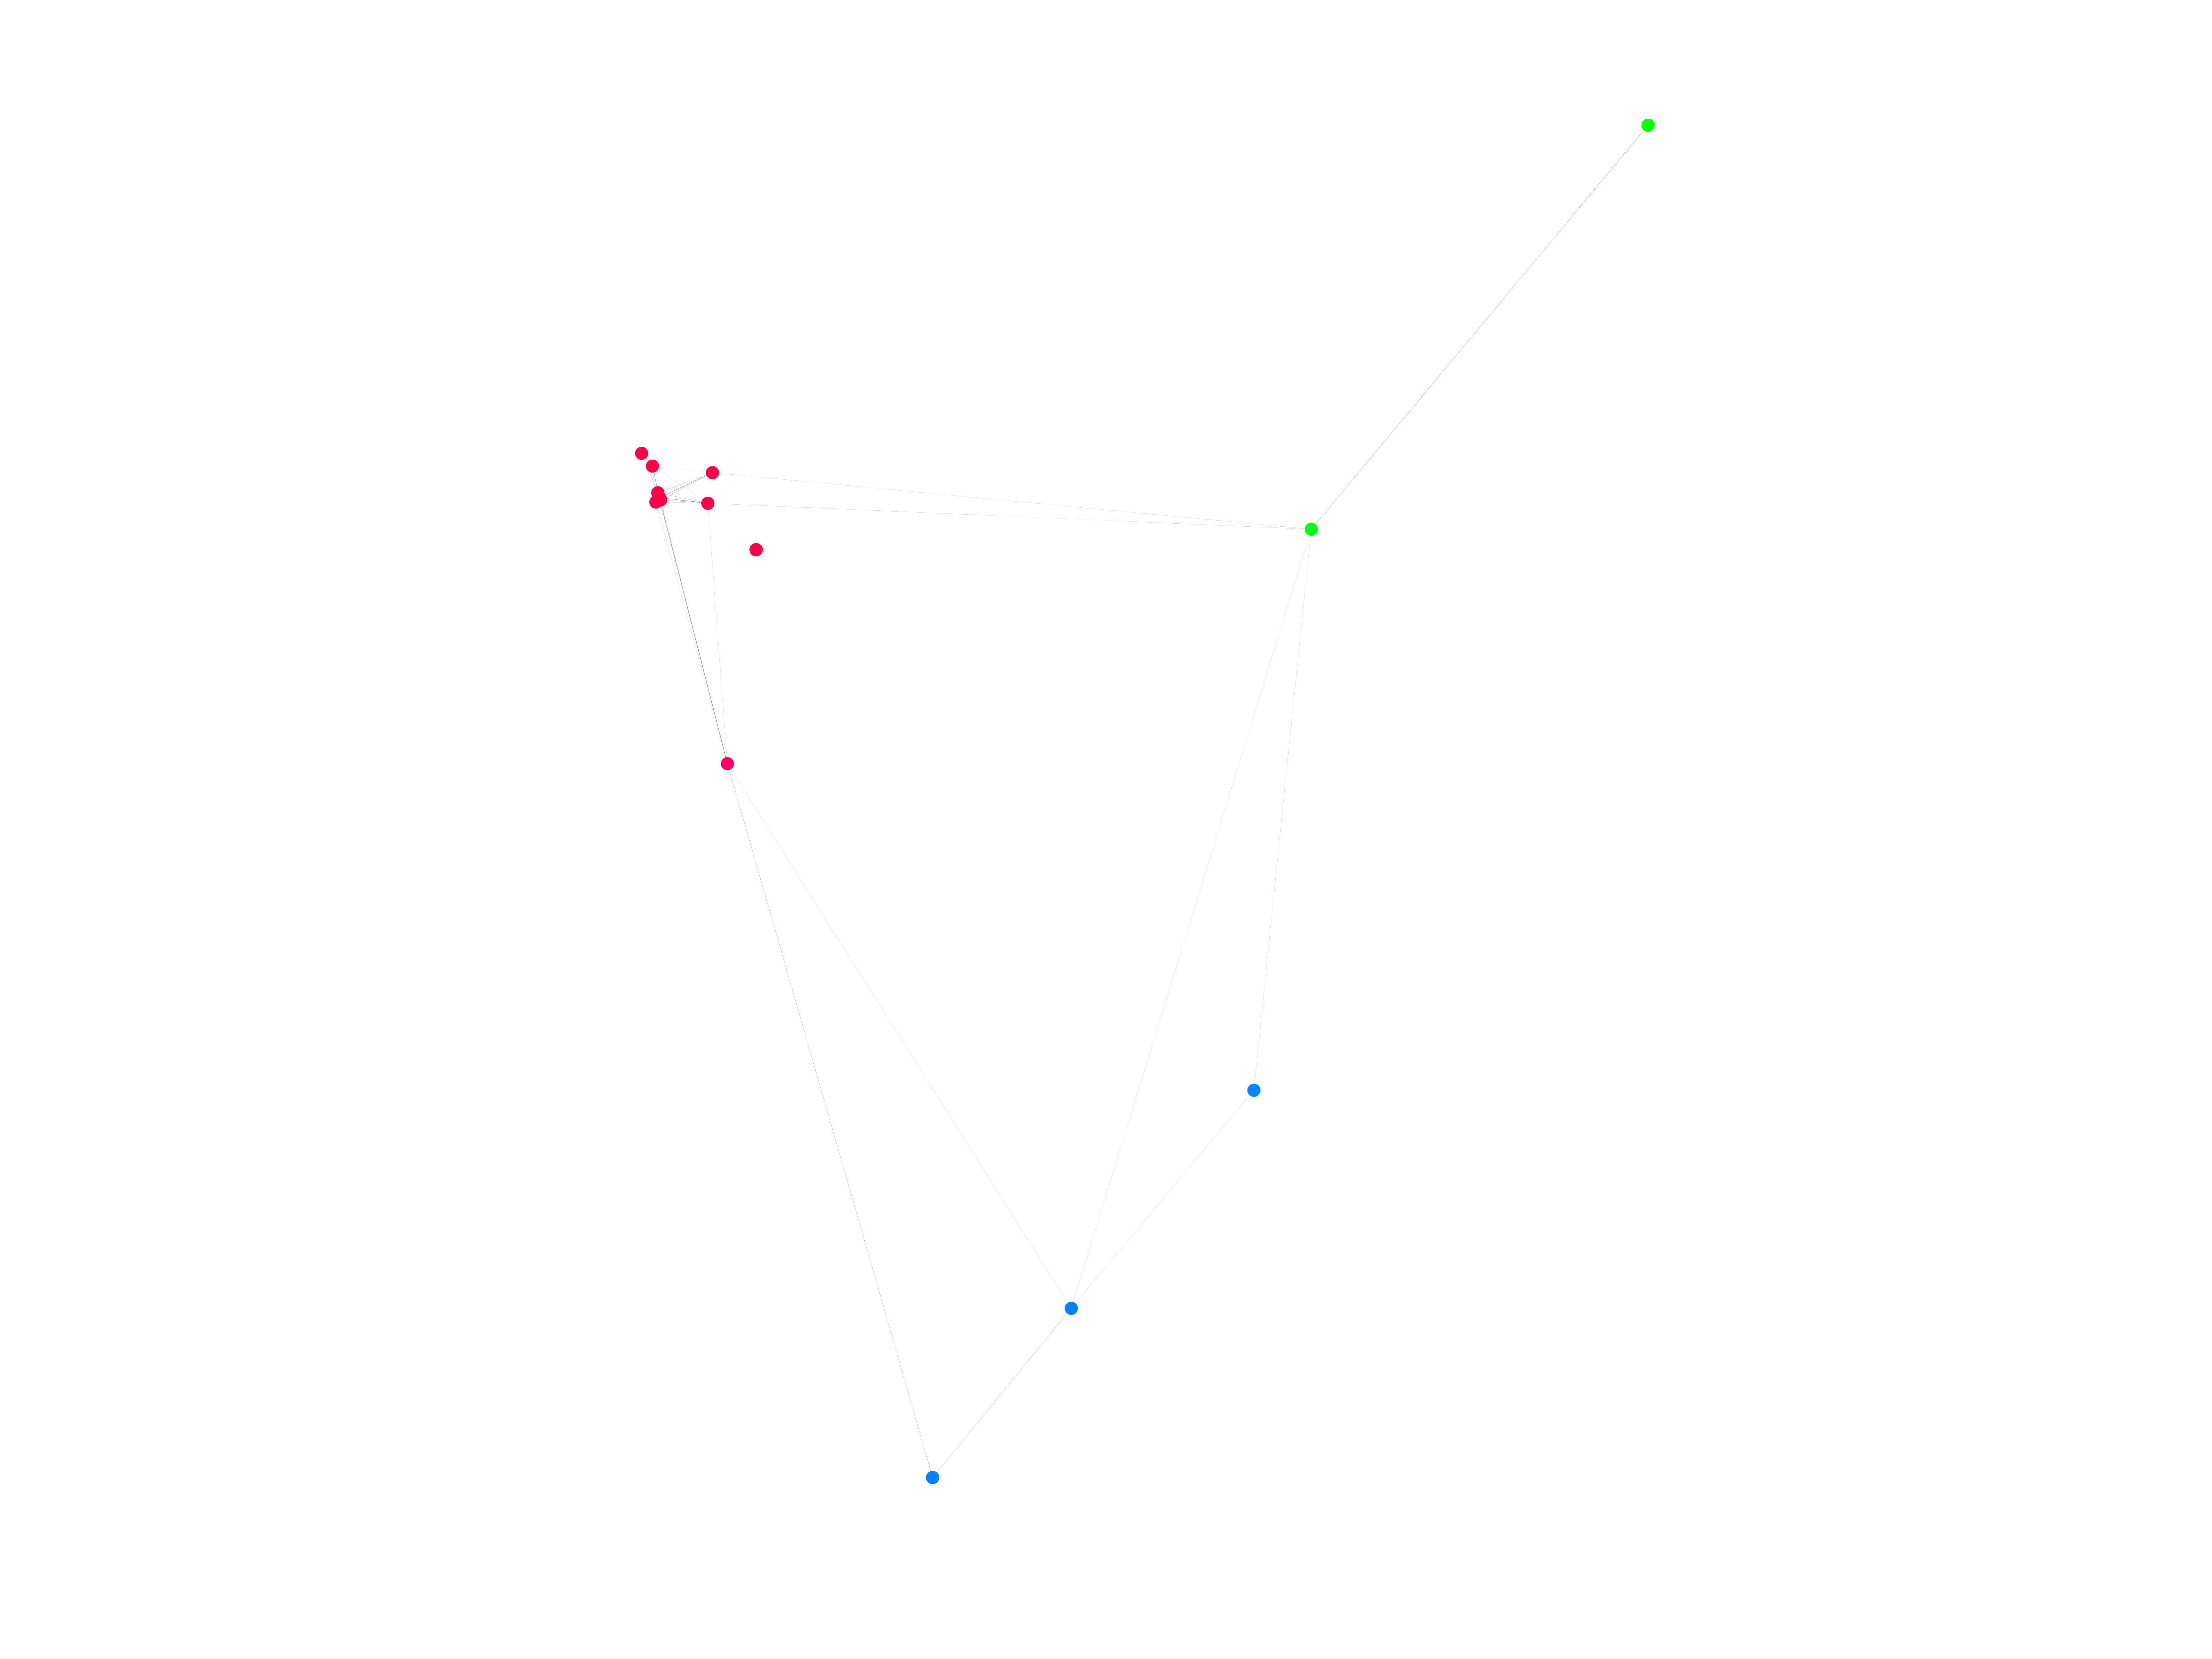
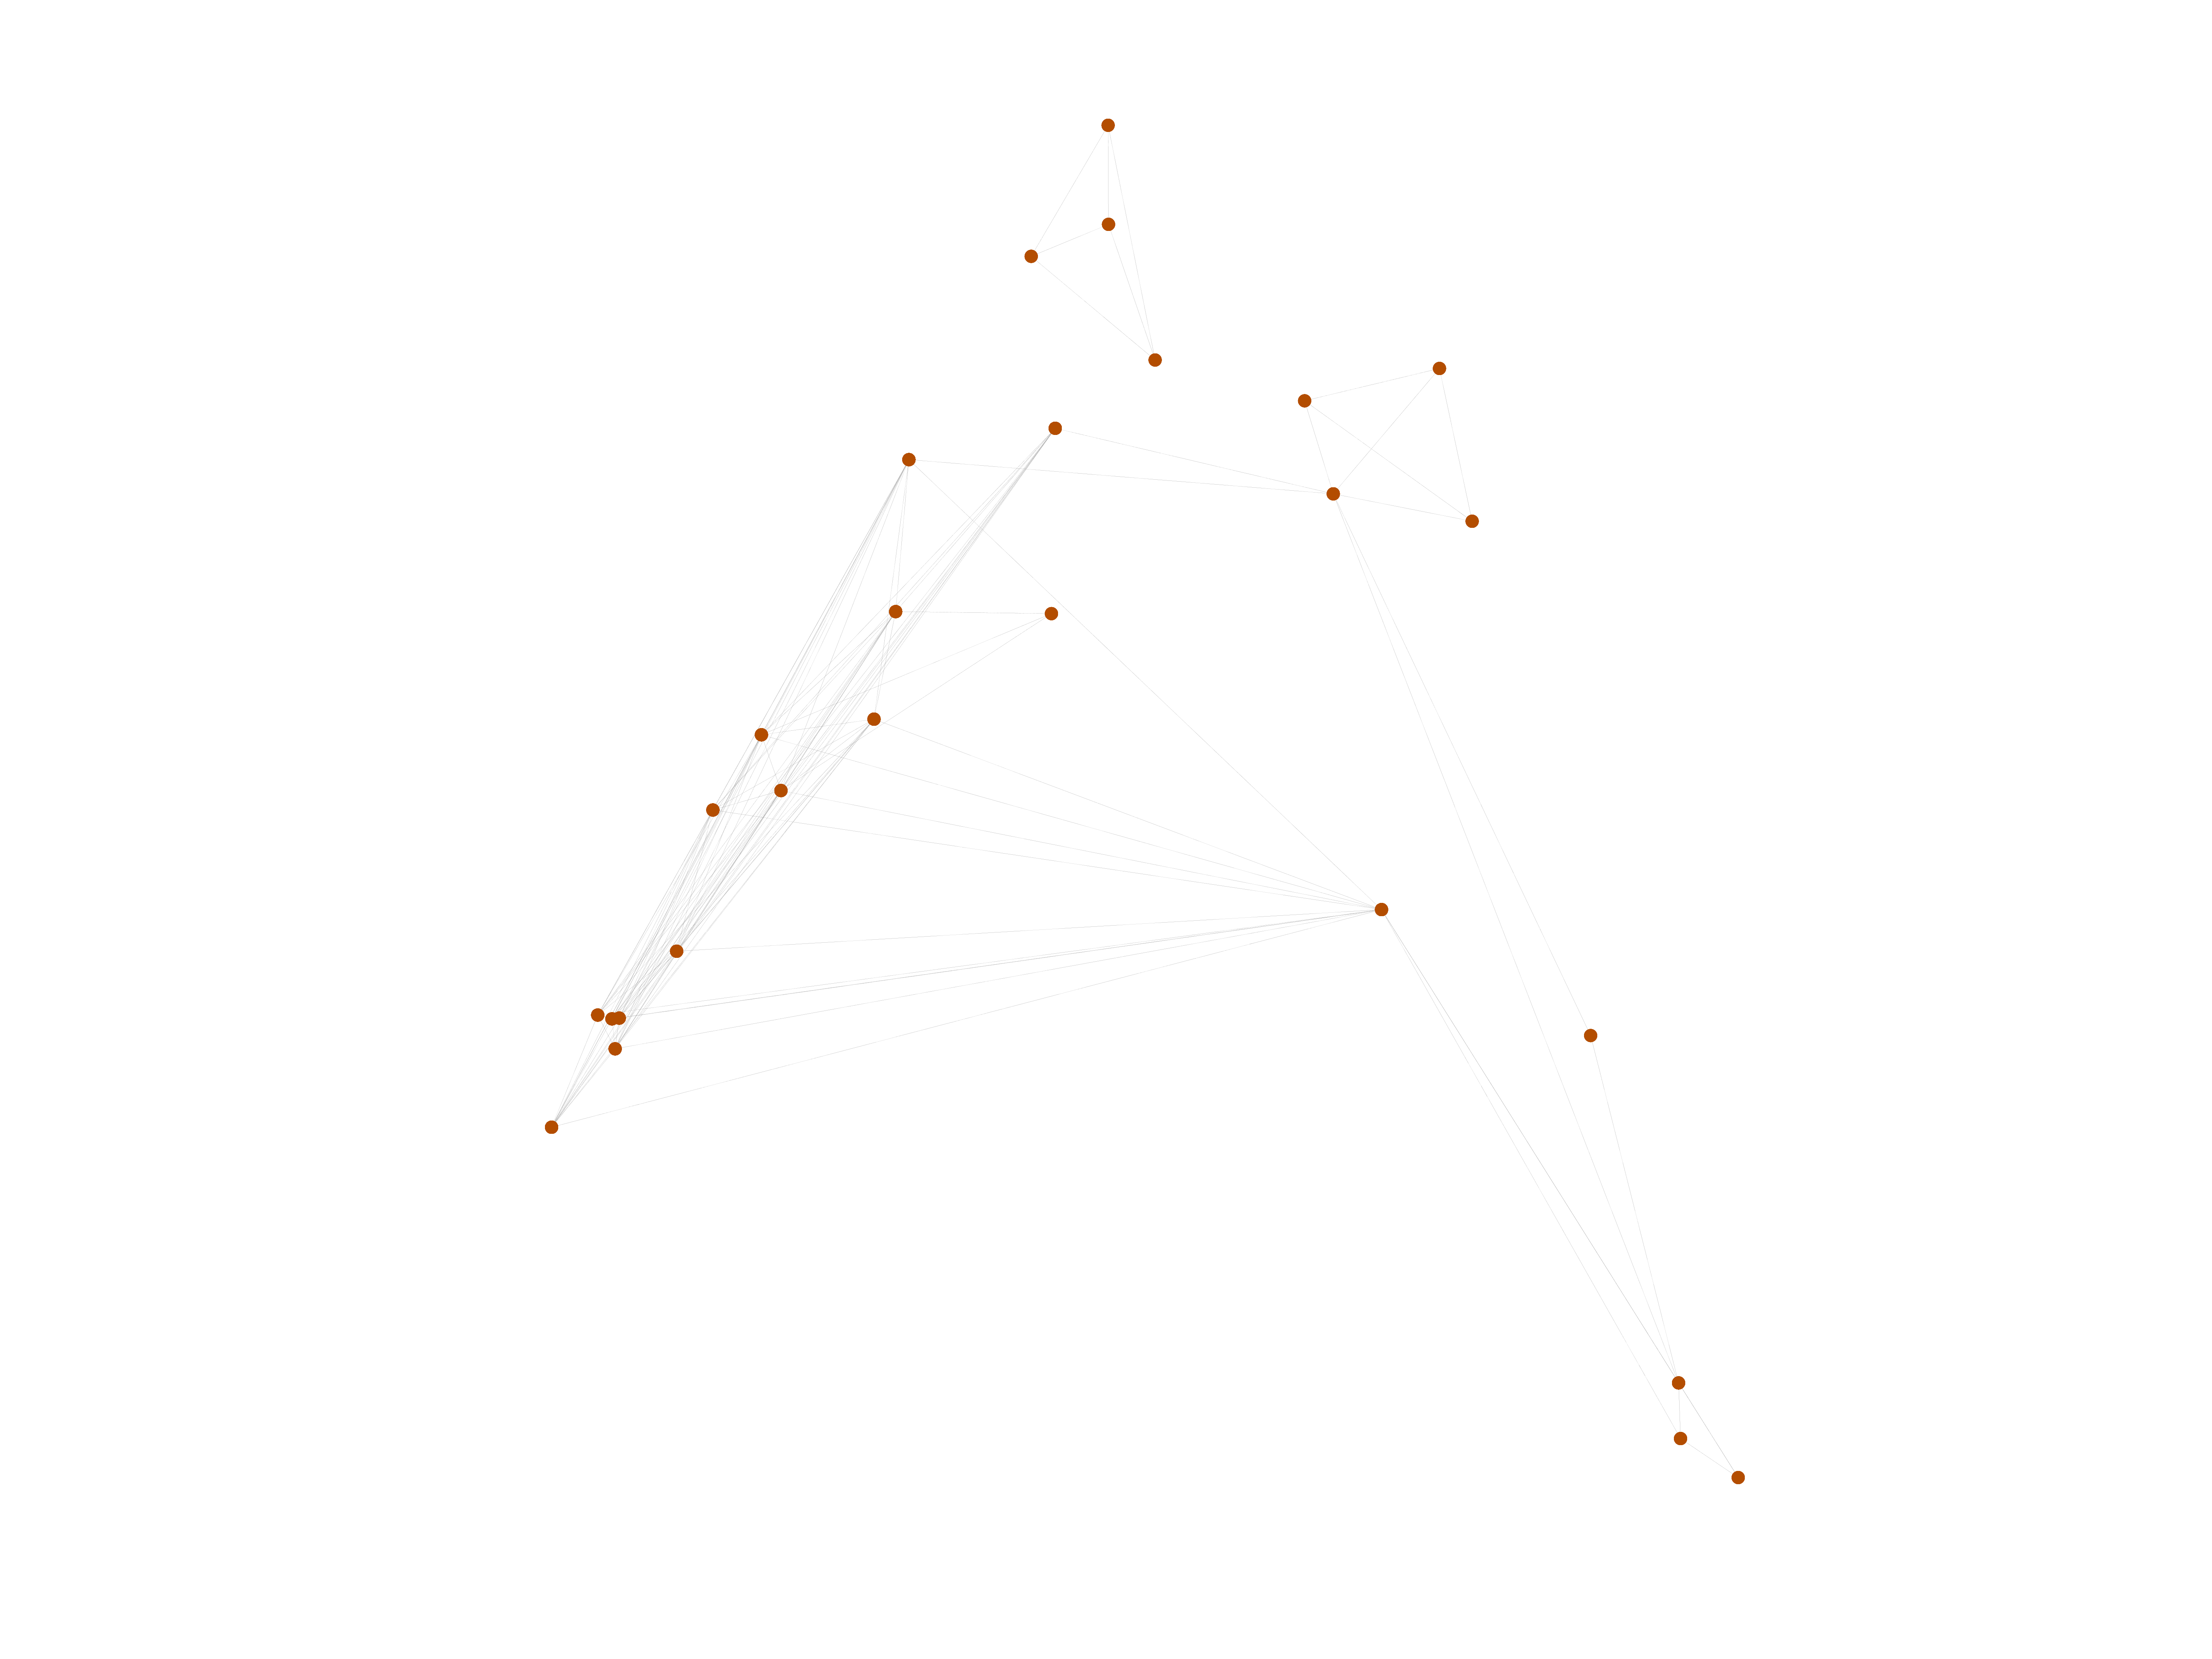
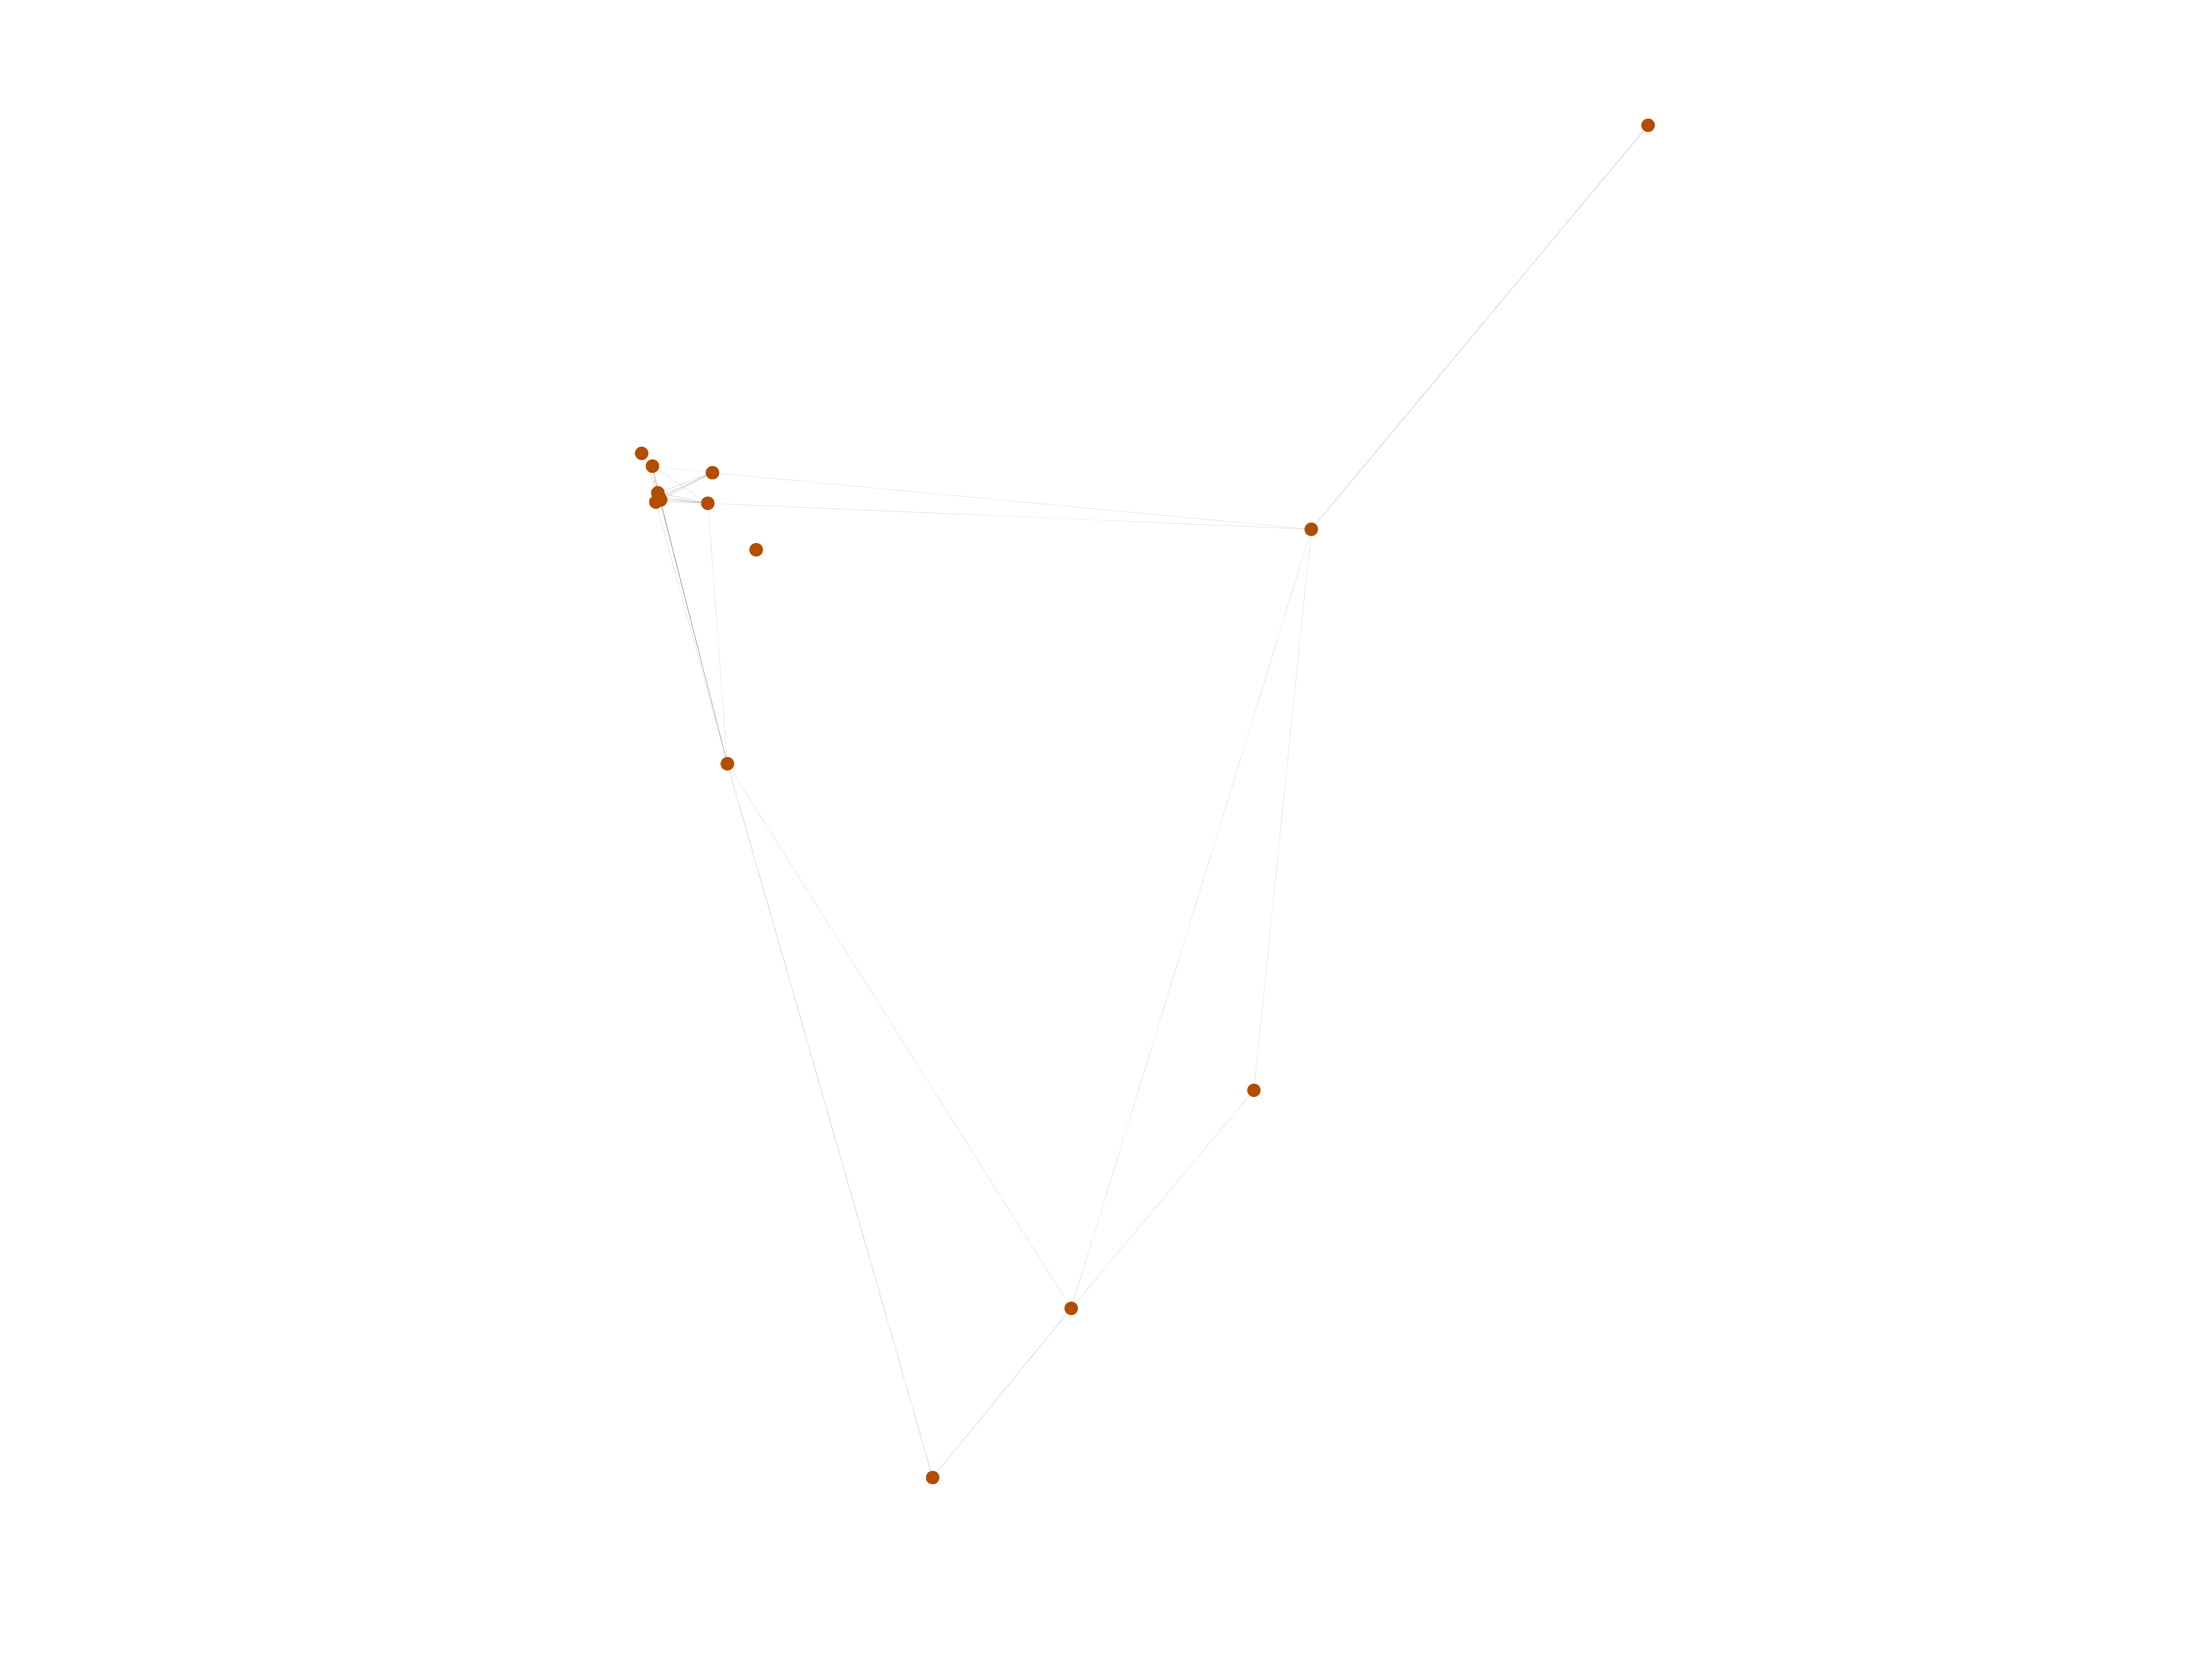
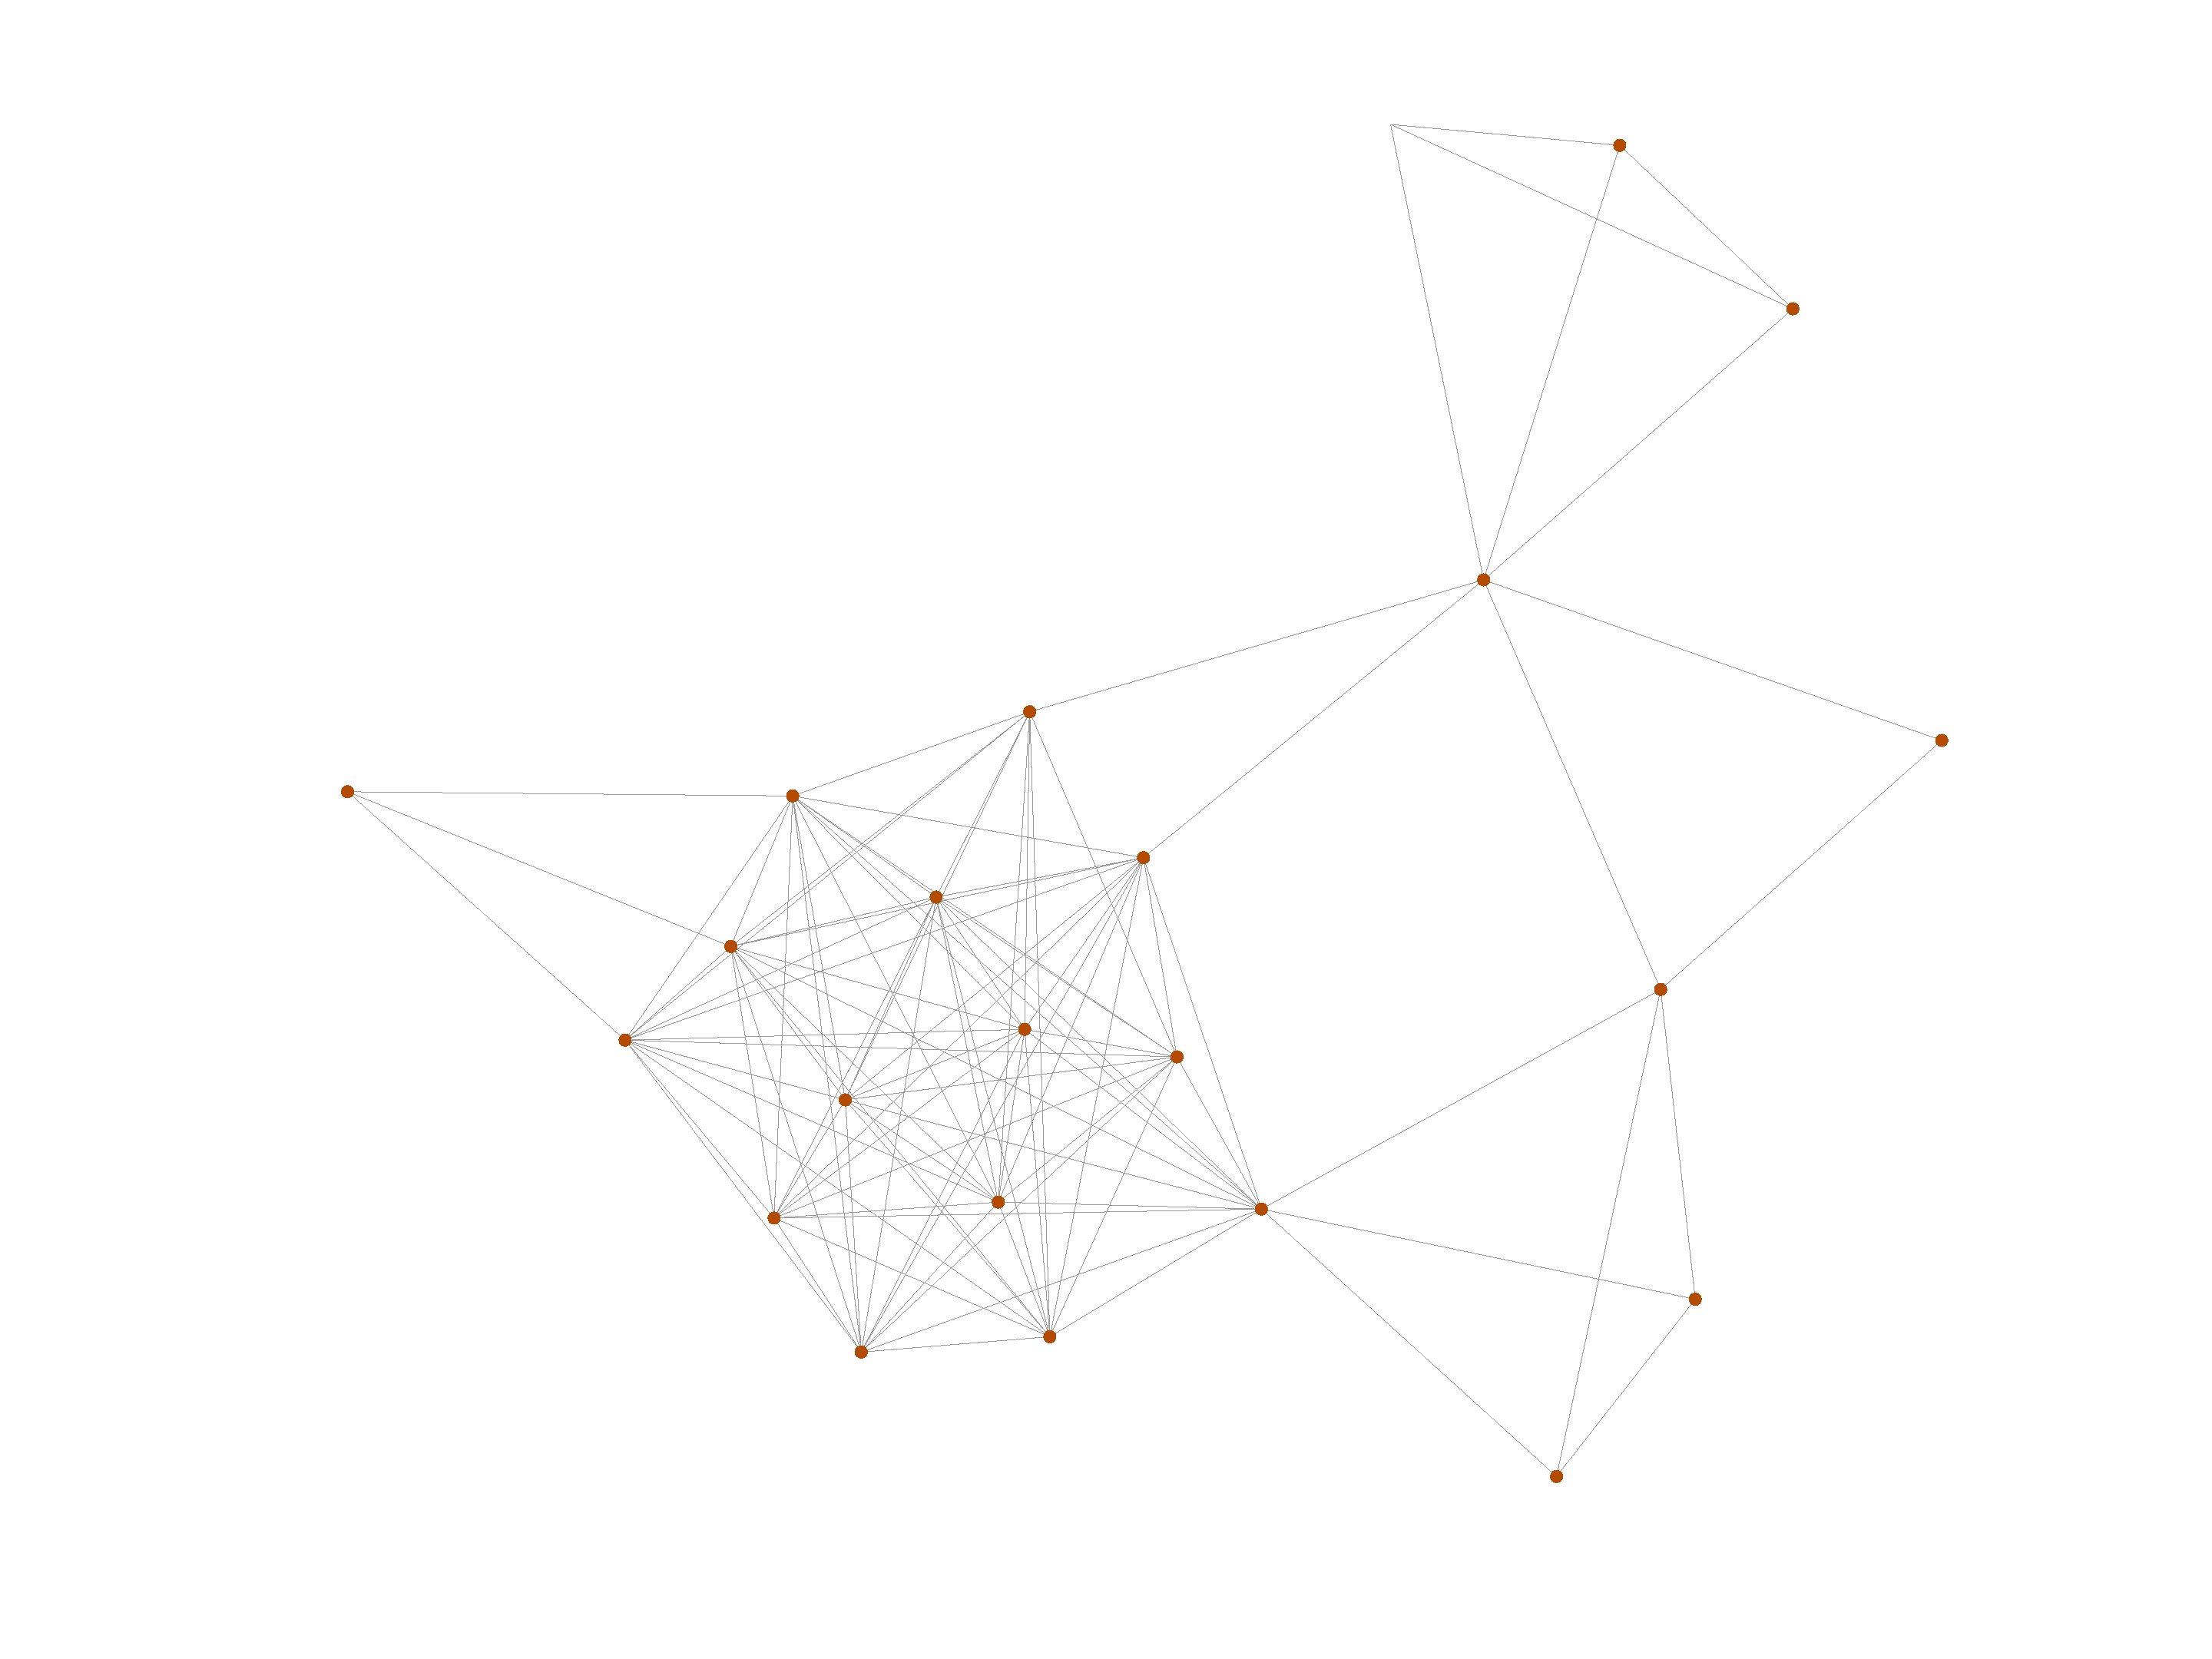
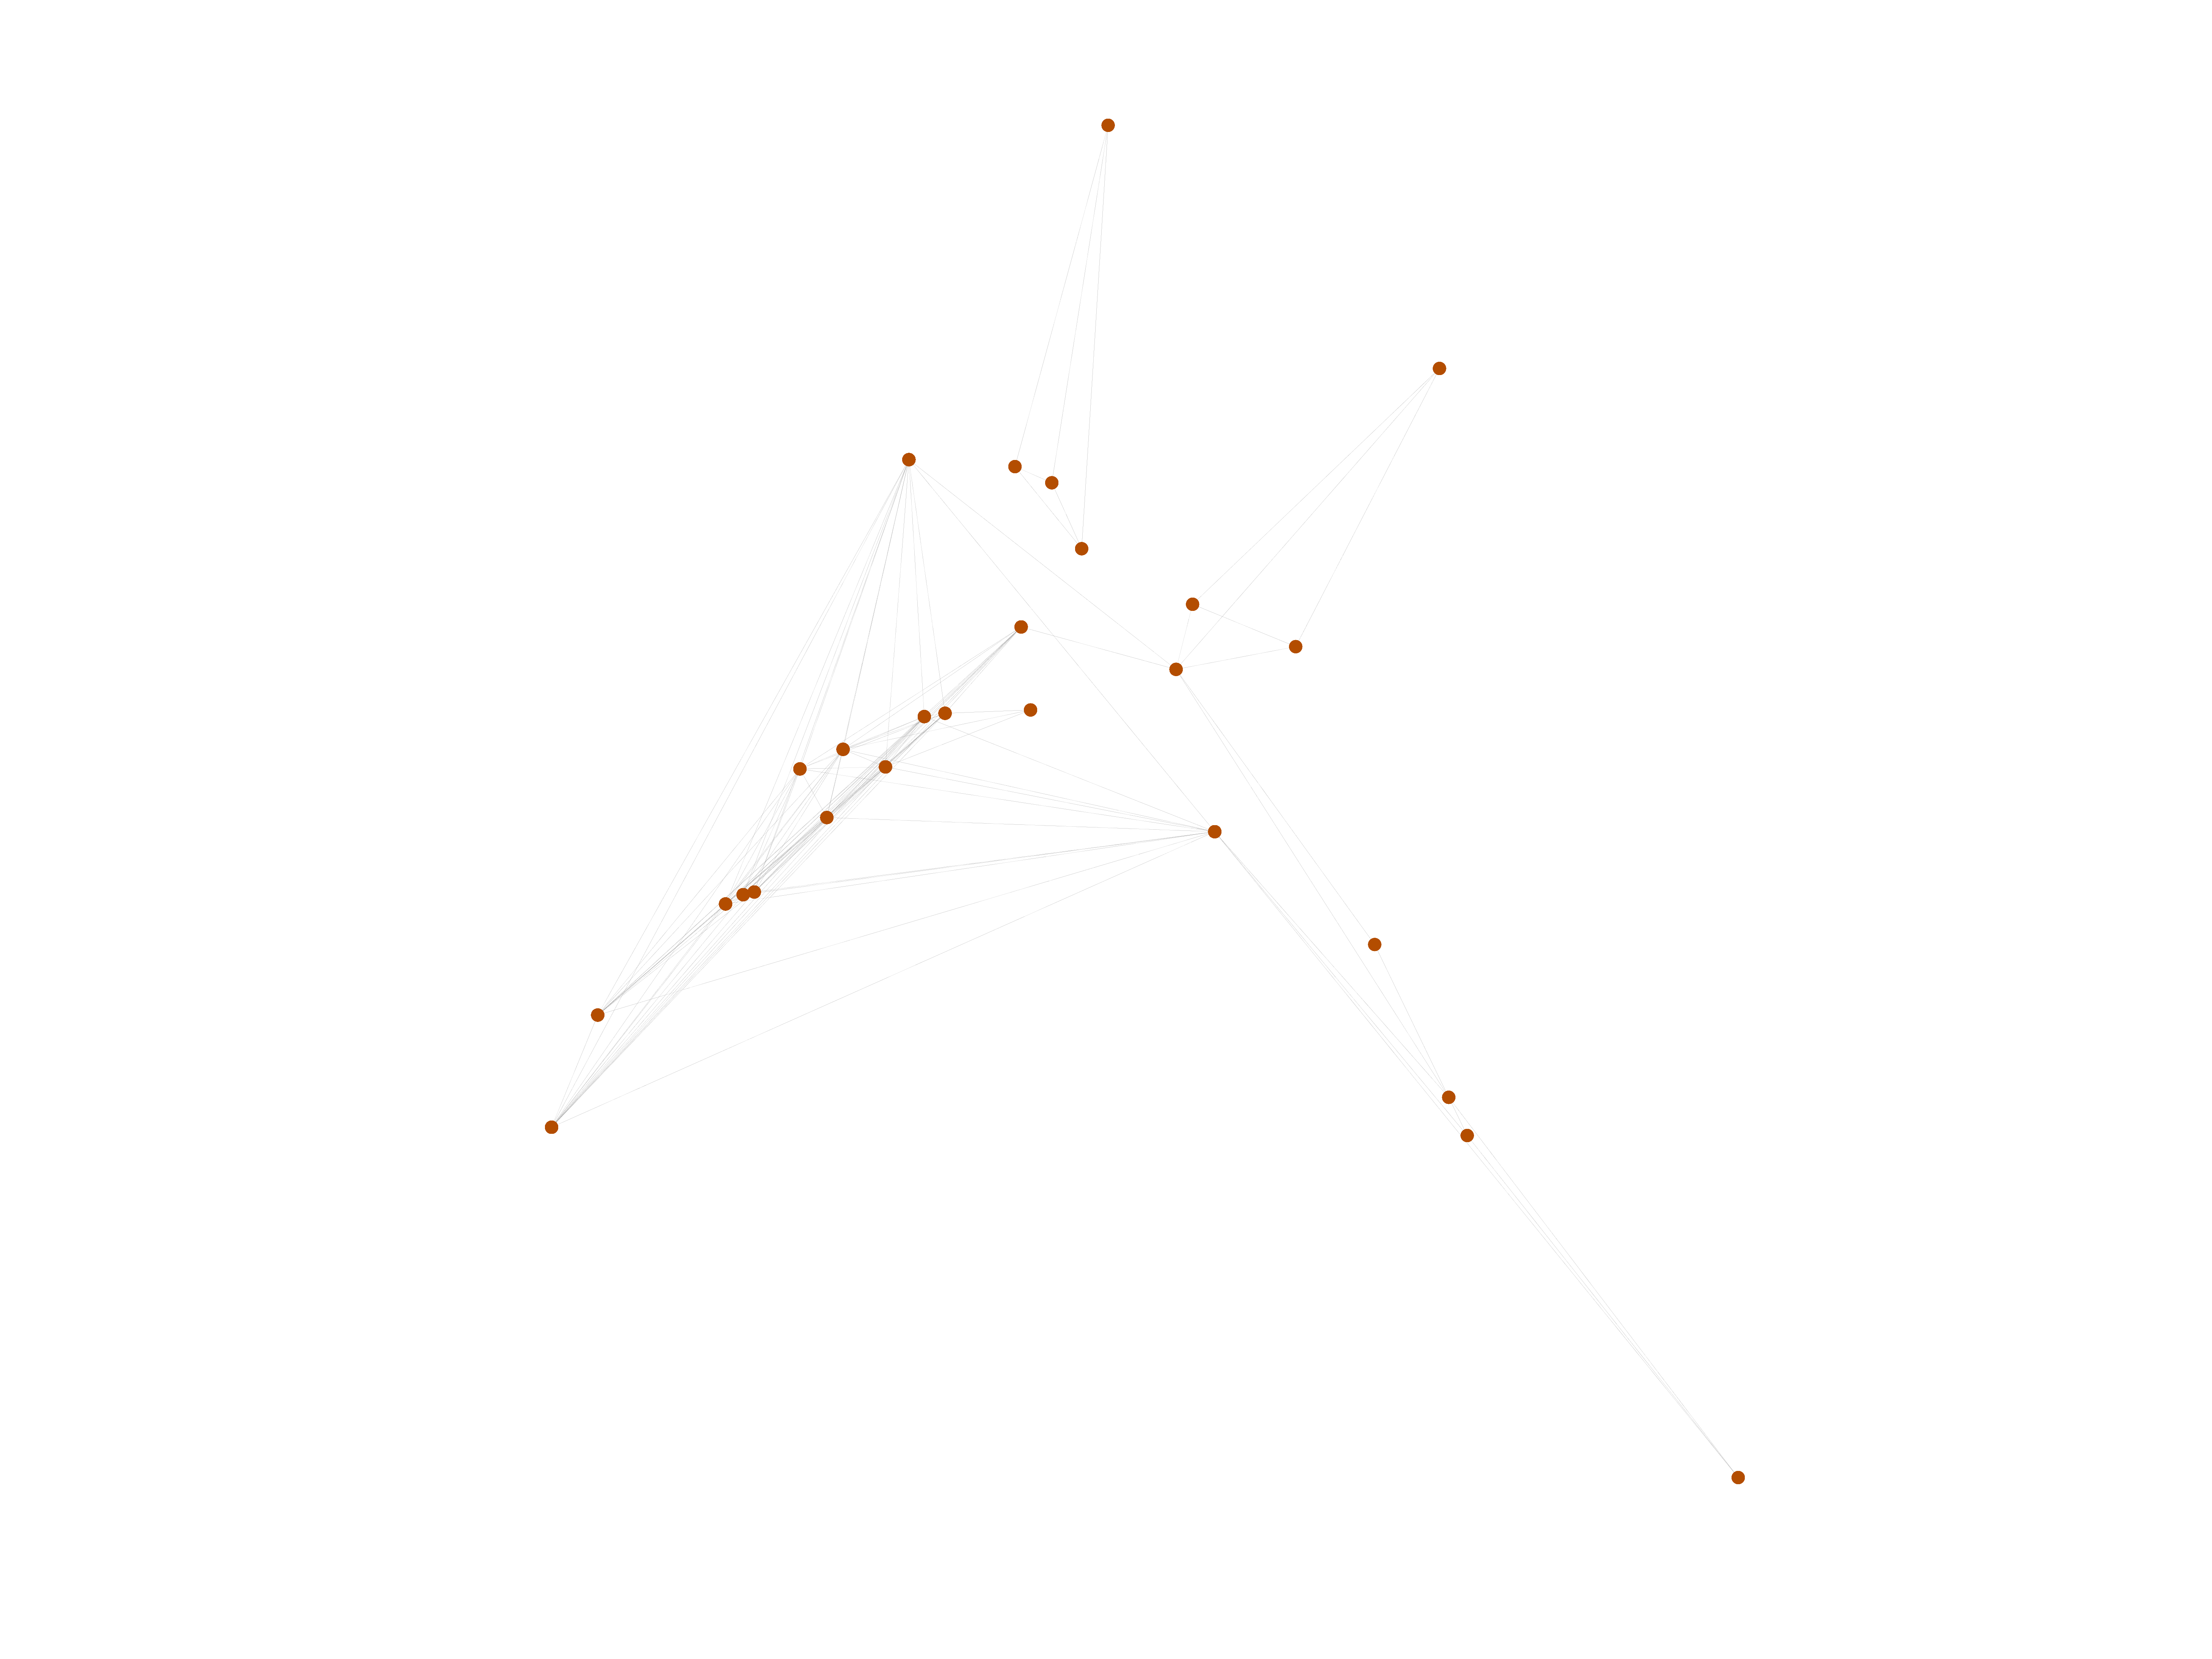
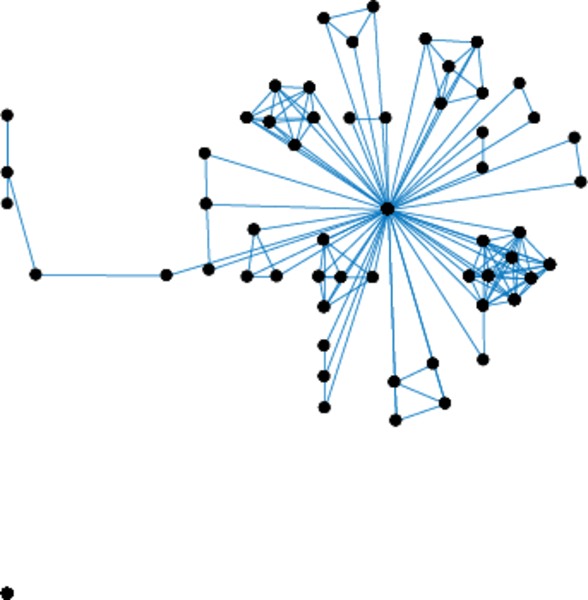
This undirected network contains interactions between 28 Grévy's zebras (Equus grevyi) in Kenya. A node represents a zebra and an edge between two zebras shows that there was an interaction between them during the study.

Metadata

CodeMZ
Internal namemoreno_zebra
NameZebra
Data sourcehttp://moreno.ss.uci.edu/data.html#zebra
AvailabilityDataset is available for download
Consistency checkDataset passed all tests
Category
Animal network
Dataset timestamp 2007
Node meaningZebra
Edge meaningInteraction
Network formatUnipartite, undirected
Edge typeUnweighted, no multiple edges
LoopsDoes not contain loops

Statistics

Size n =27
Volume m =111
Loop count l =0
Wedge count s =1,108
Claw count z =3,818
Cross count x =9,291
Triangle count t =312
Square count q =2,325
4-Tour count T4 =23,254
Maximum degree dmax =14
Average degree d =8.222 22
Fill p =0.316 239
Size of LCC N =23
Diameter δ =4
50-Percentile effective diameter δ0.5 =1.197 06
90-Percentile effective diameter δ0.9 =2.650 39
Median distance δM =2
Mean distance δm =1.789 47
Gini coefficient G =0.307 641
Balanced inequality ratio P =0.355 856
Relative edge distribution entropy Her =0.943 726
Power law exponent γ =1.841 23
Tail power law exponent γt =1.691 00
Tail power law exponent with p γ3 =1.691 00
p-value p =0.000 00
Degree assortativity ρ =+0.717 703
Degree assortativity p-value pρ =1.969 94 × 10−36
Clustering coefficient c =0.844 765
Spectral norm α =12.285 3
Algebraic connectivity a =0.519 981
Spectral separation 1[A] / λ2[A]| =3.514 66
Non-bipartivity bA =0.748 511
Normalized non-bipartivity bN =0.572 364
Algebraic non-bipartivity χ =1.527 21
Spectral bipartite frustration bK =0.041 816 5
Controllability C =1
Relative controllability Cr =0.037 037 0

Plots

Fruchterman–Reingold graph drawing

Degree distribution

Cumulative degree distribution

Lorenz curve

Spectral distribution of the adjacency matrix

Spectral distribution of the normalized adjacency matrix

Spectral distribution of the Laplacian

Spectral graph drawing based on the adjacency matrix

Spectral graph drawing based on the Laplacian

Spectral graph drawing based on the normalized adjacency matrix

Degree assortativity

Zipf plot

Hop distribution

Double Laplacian graph drawing

Delaunay graph drawing

Clustering coefficient distribution

Average neighbor degree distribution

SynGraphy

Matrix decompositions plots

Downloads

References

[1] Jérôme Kunegis. KONECT – The Koblenz Network Collection. In Proc. Int. Conf. on World Wide Web Companion, pages 1343–1350, 2013. [ http ]
[2] Siva R Sundaresan, Ilya R Fischhoff, Jonathan Dushoff, and Daniel I Rubenstein. Network metrics reveal differences in social organization between two fission–fusion species, Grevy's zebra and onager. Oecologia, 151(1):140–149, 2007.