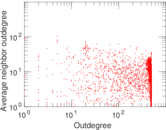
Twitter (ICWSM)
This is the directed network containing information about who follows whom on
Twitter. Nodes represent users and an edge shows that the left user follows the
right one.
Metadata
Statistics
| Size | n = | 465,017
|
| Volume | m = | 834,797
|
| Loop count | l = | 0
|
| Wedge count | s = | 187,988,707
|
| Claw count | z = | 28,887,087,190
|
| Cross count | x = | 3,417,980,886,457
|
| Triangle count | t = | 38,389
|
| Square count | q = | 21,828,900
|
| 4-Tour count | T4 = | 928,253,108
|
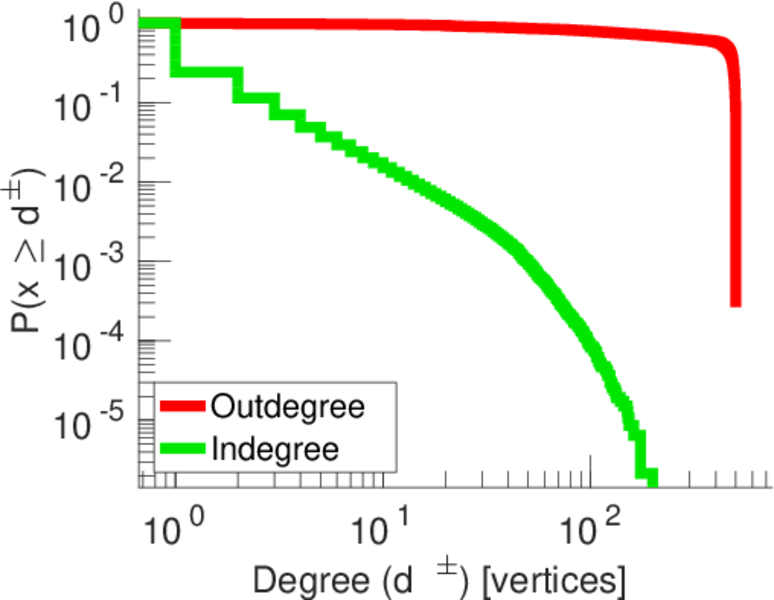
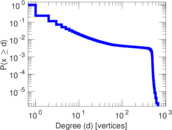
| Maximum degree | dmax = | 678
|
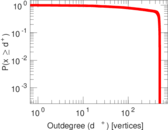
| Maximum outdegree | d+max = | 500
|
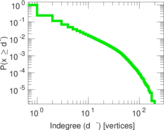
| Maximum indegree | d−max = | 199
|
| Average degree | d = | 3.590 39
|
| Fill | p = | 3.860 51 × 10−6
|
| Size of LCC | N = | 465,017
|
| Size of LSCC | Ns = | 1,726
|
| Relative size of LSCC | Nrs = | 0.003 711 69
|
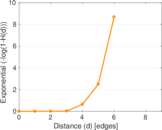
| Diameter | δ = | 8
|
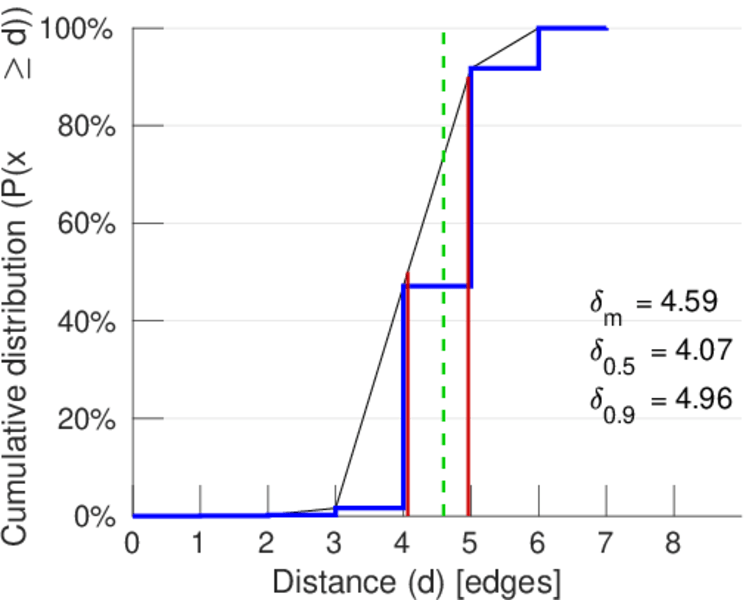
| 50-Percentile effective diameter | δ0.5 = | 4.065 65
|
| 90-Percentile effective diameter | δ0.9 = | 4.962 07
|
| Median distance | δM = | 5
|
| Mean distance | δm = | 4.594 85
|
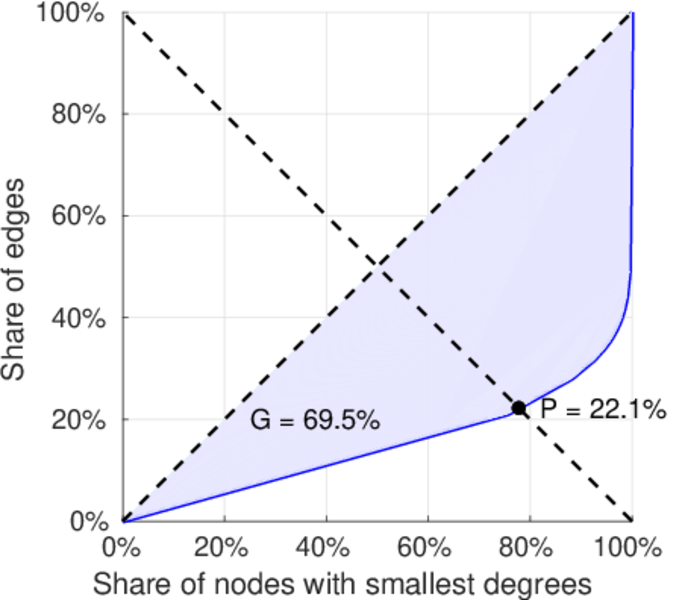
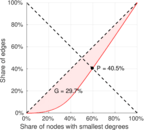
| Gini coefficient | G = | 0.694 849
|
| Balanced inequality ratio | P = | 0.220 847
|
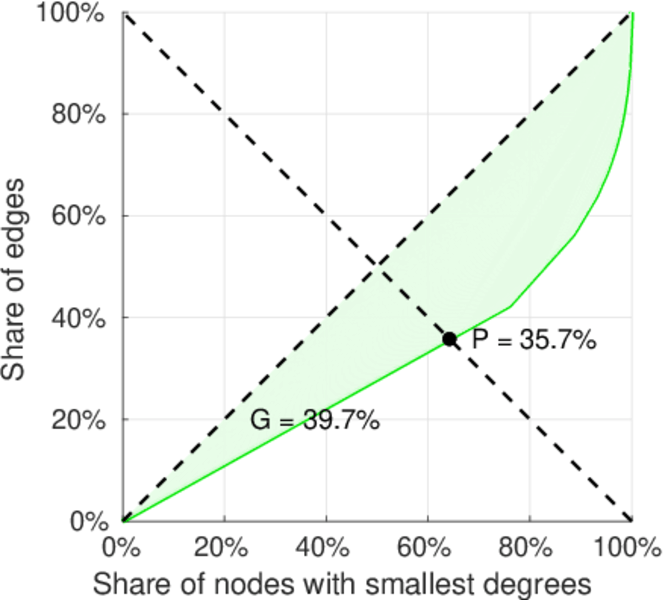
| Outdegree balanced inequality ratio | P+ = | 0.404 595
|
| Indegree balanced inequality ratio | P− = | 0.356 506
|
| Relative edge distribution entropy | Her = | 0.822 520
|
| Power law exponent | γ = | 4.358 34
|
| Tail power law exponent | γt = | 2.471 00
|
| Tail power law exponent with p | γ3 = | 2.471 00
|
| p-value | p = | 0.000 00
|
| Outdegree tail power law exponent with p | γ3,o = | 1.361 00
|
| Outdegree p-value | po = | 0.000 00
|
| Indegree tail power law exponent with p | γ3,i = | 2.551 00
|
| Indegree p-value | pi = | 0.000 00
|
| Degree assortativity | ρ = | −0.877 715
|
| Degree assortativity p-value | pρ = | 0.000 00
|
| In/outdegree correlation | ρ± = | +0.059 352 6
|
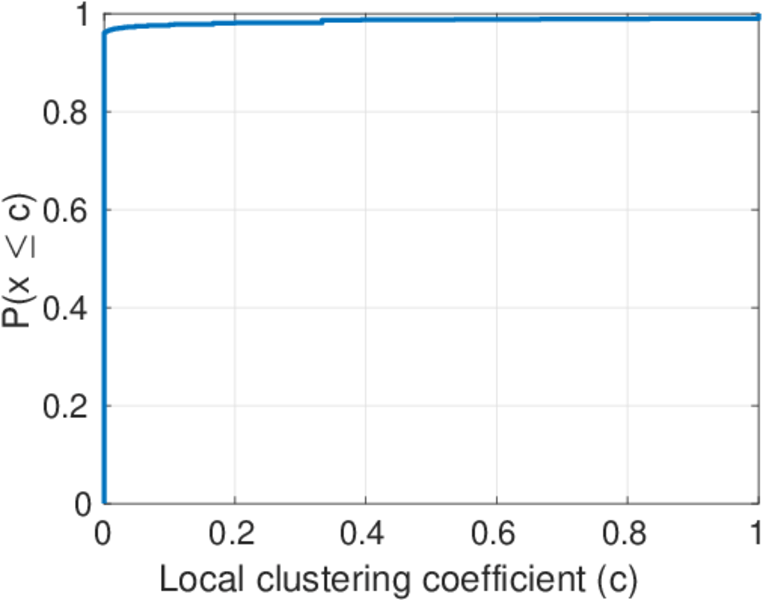
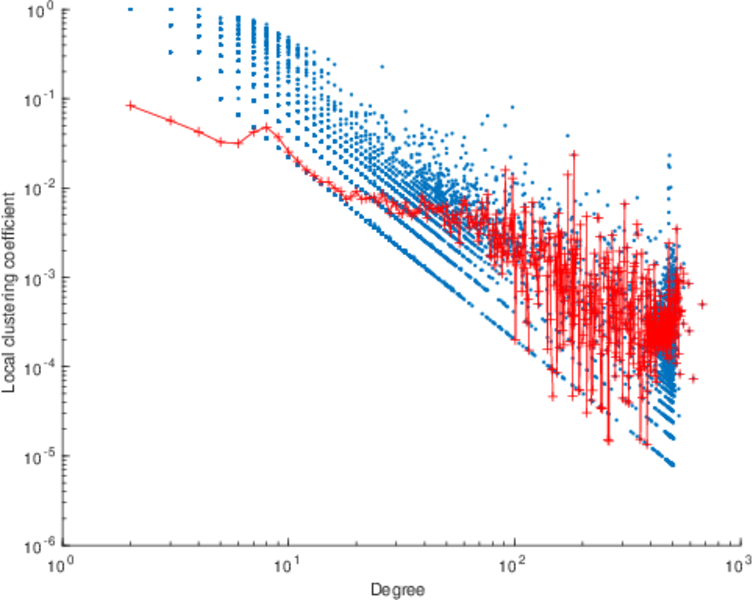
| Clustering coefficient | c = | 0.000 612 627
|
| Directed clustering coefficient | c± = | 0.013 224 2
|
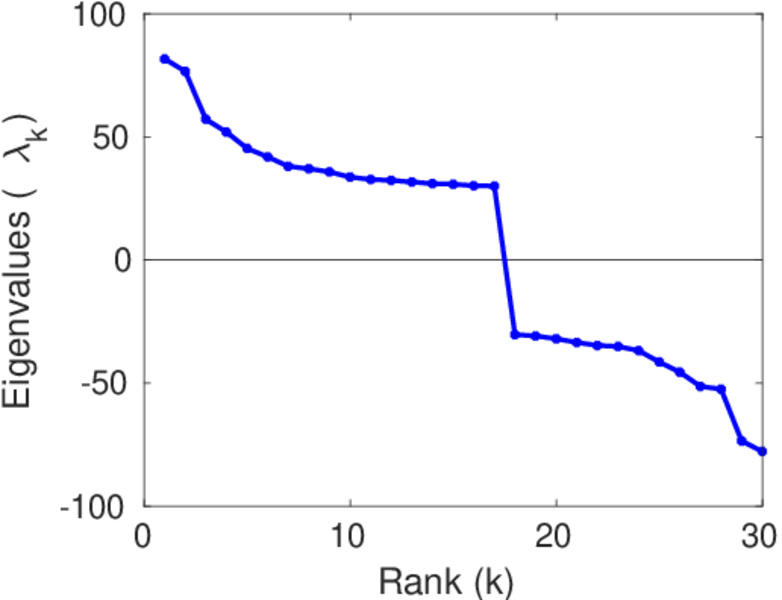
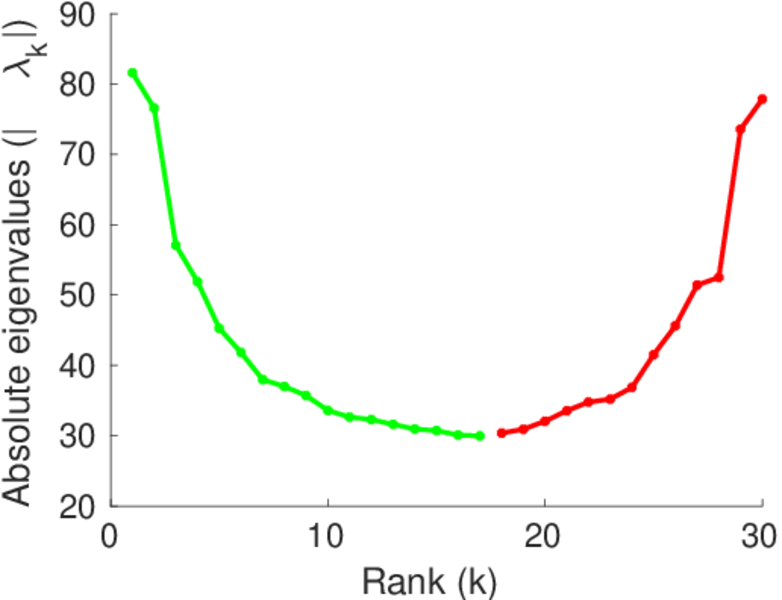
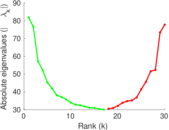
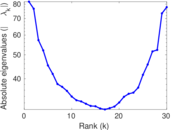
| Spectral norm | α = | 81.599 7
|
| Operator 2-norm | ν = | 79.115 0
|
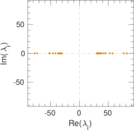
| Cyclic eigenvalue | π = | 6.178 14
|
| Algebraic connectivity | a = | 0.007 317 00
|
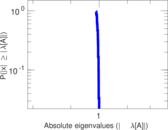
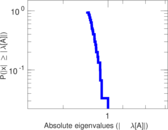
| Spectral separation | |λ1[A] / λ2[A]| = | 1.048 28
|
| Reciprocity | y = | 0.003 011 51
|
| Non-bipartivity | bA = | 0.046 055 0
|
| Normalized non-bipartivity | bN = | 0.003 658 47
|
| Algebraic non-bipartivity | χ = | 0.007 307 68
|
| Spectral bipartite frustration | bK = | 0.000 509 603
|
| Controllability | C = | 462,515
|
| Relative controllability | Cr = | 0.994 620
|
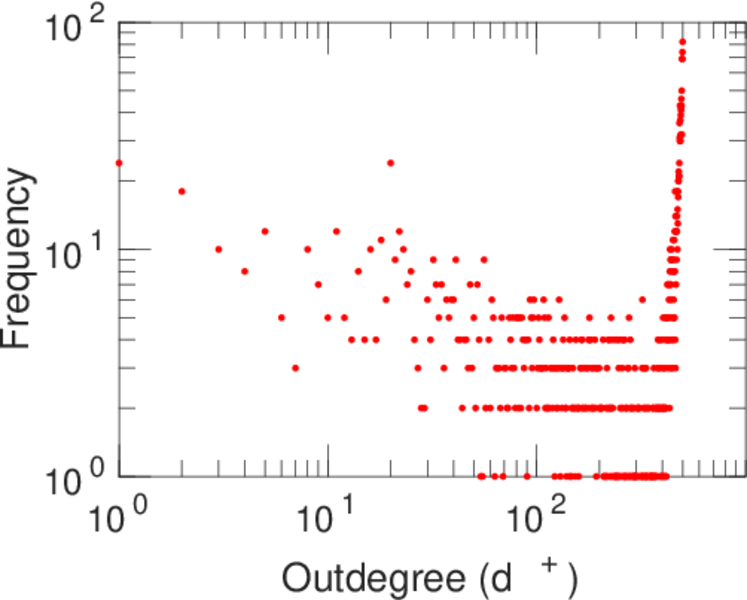
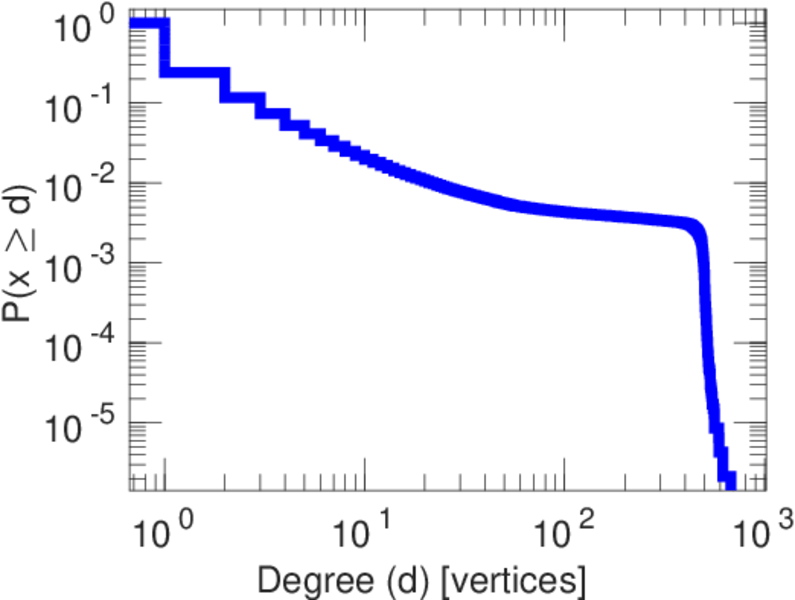
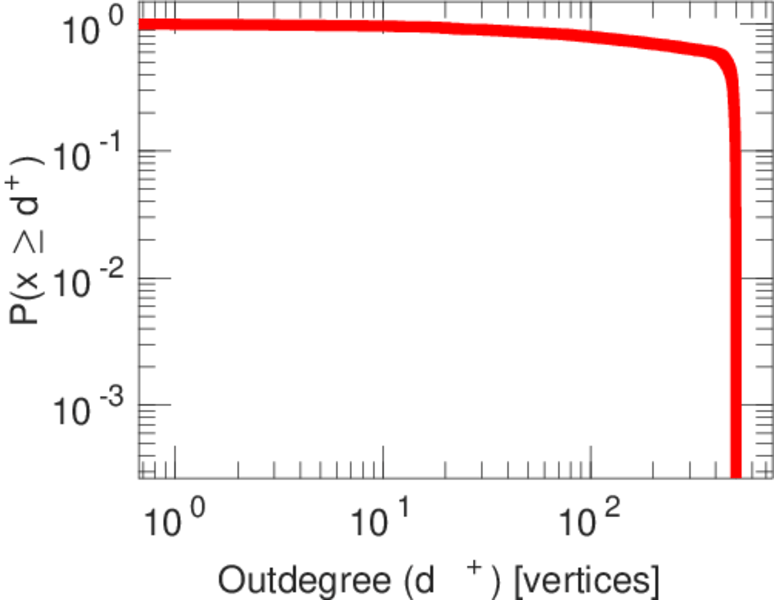
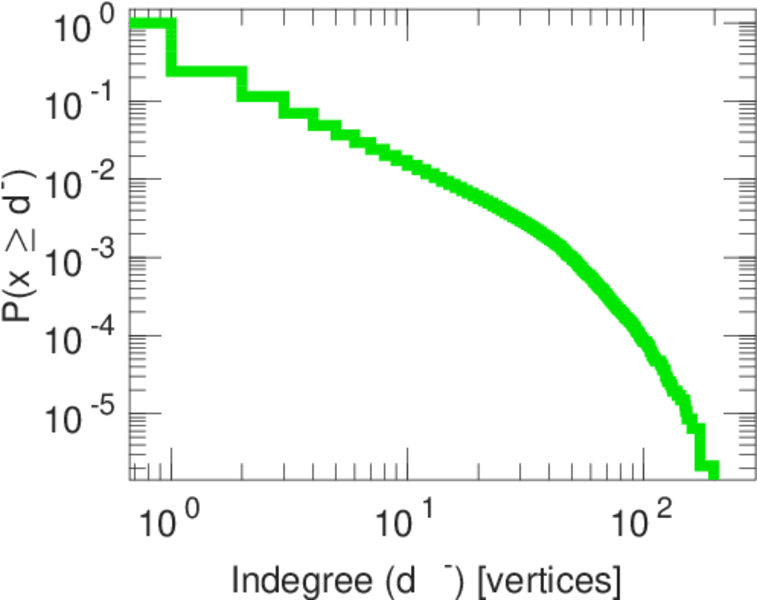
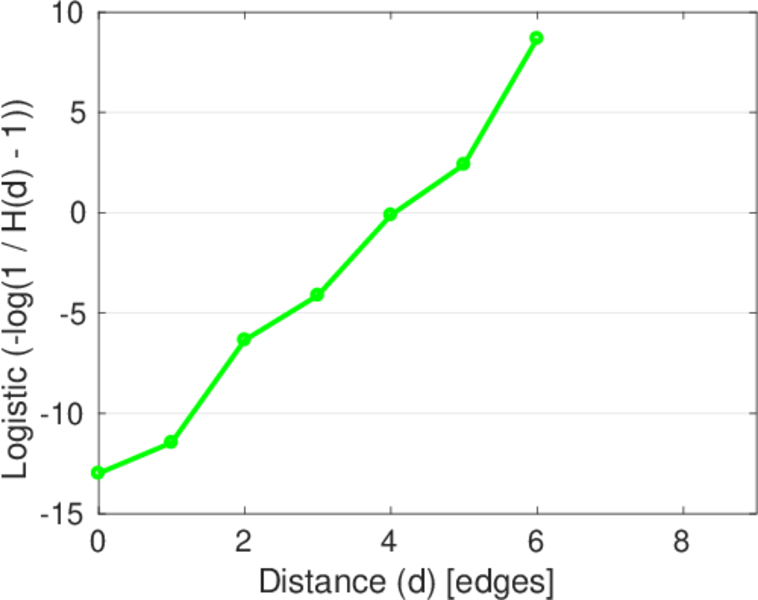
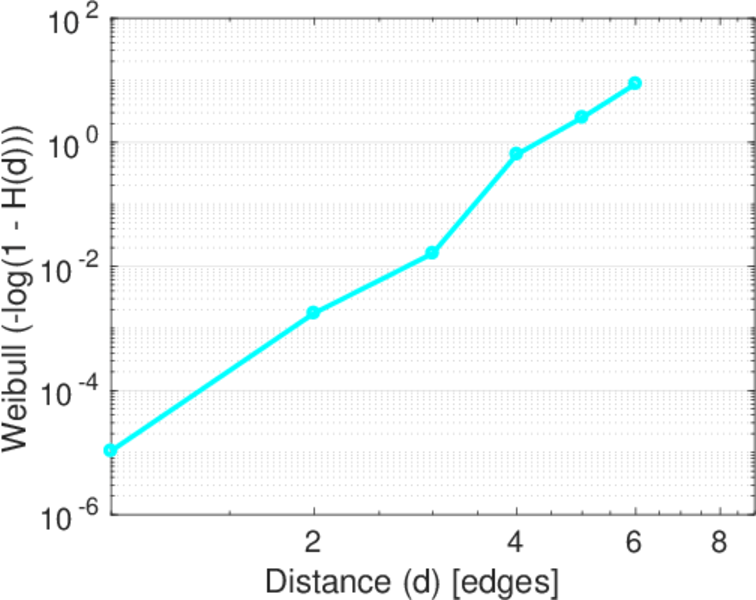
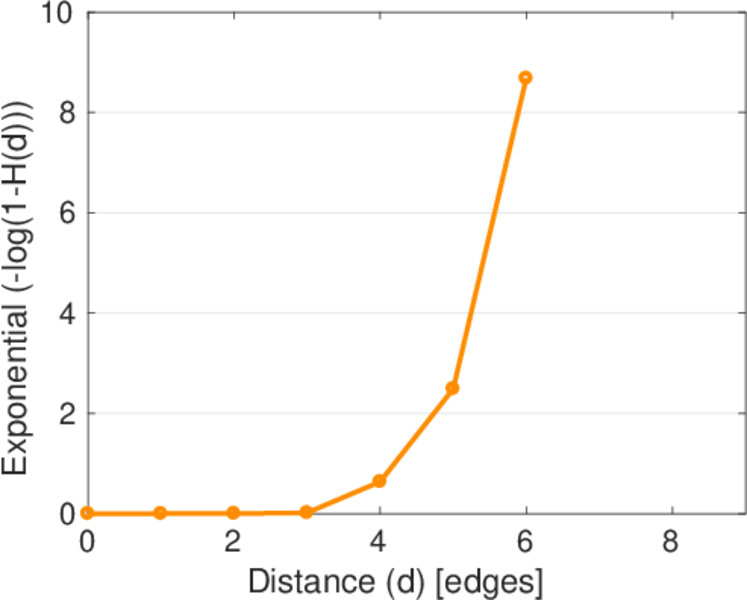
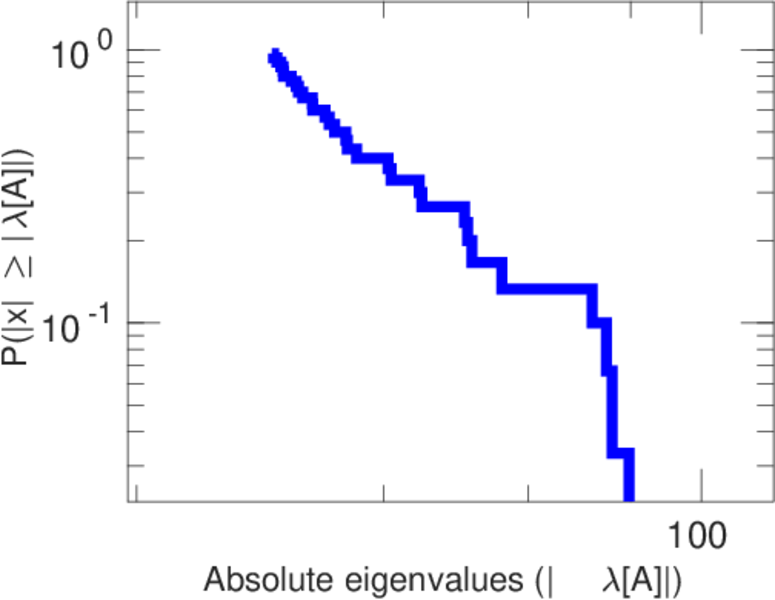
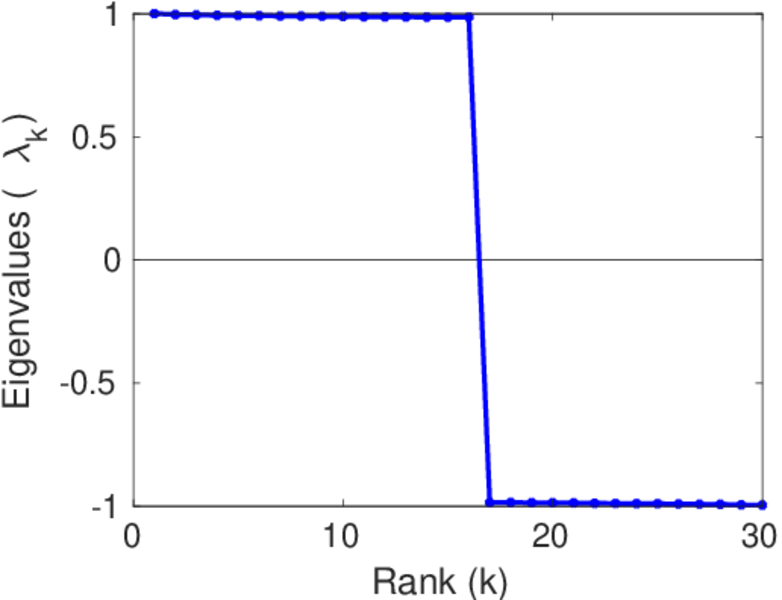
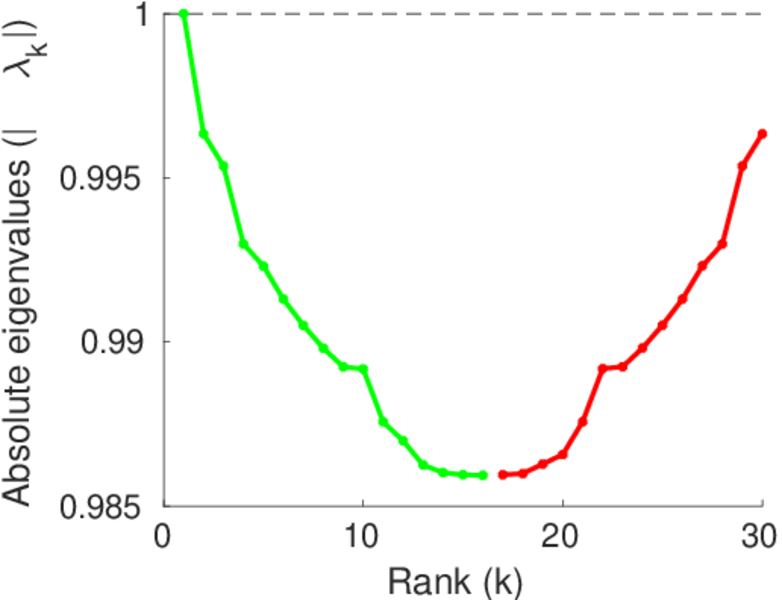
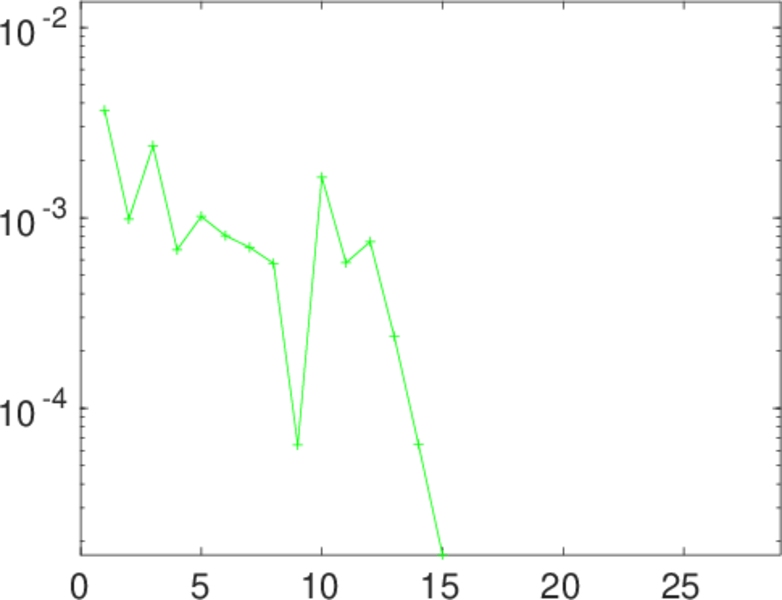
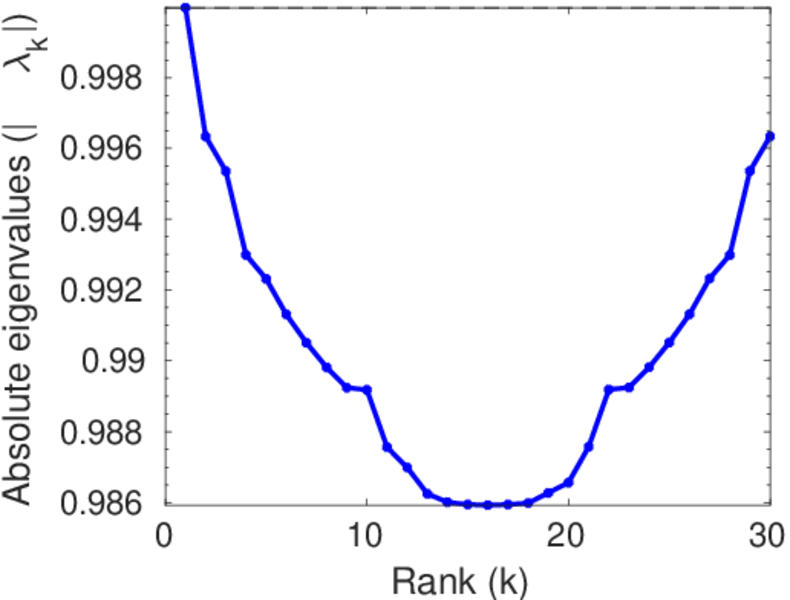
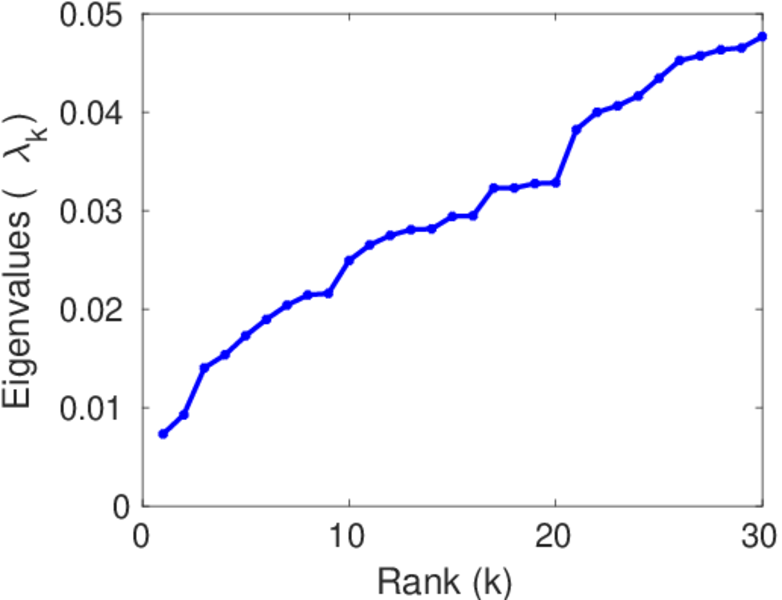
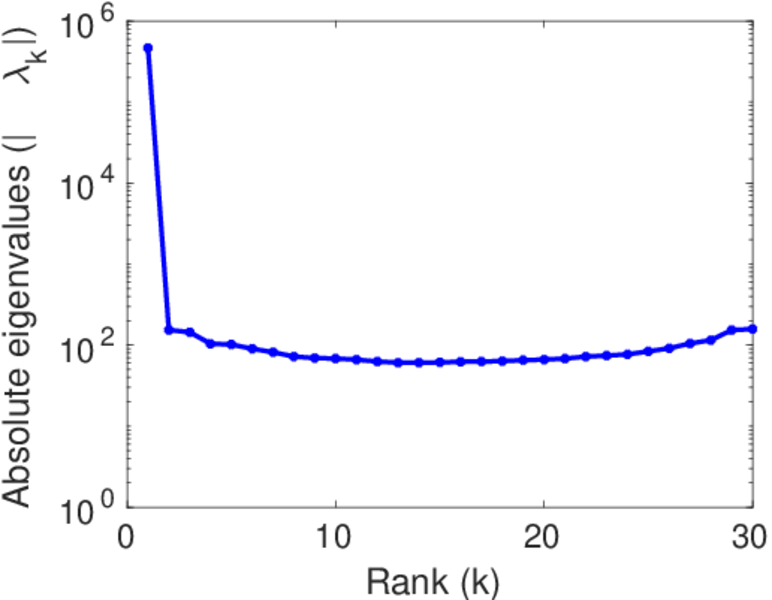
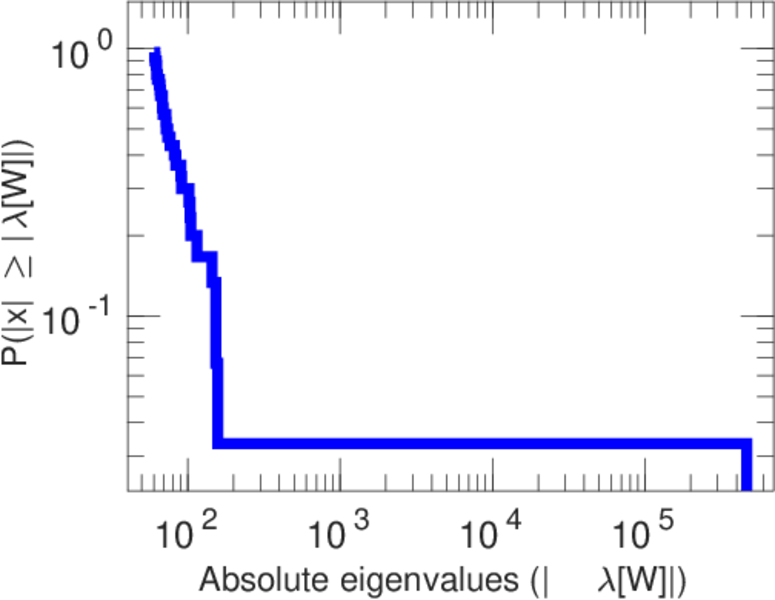
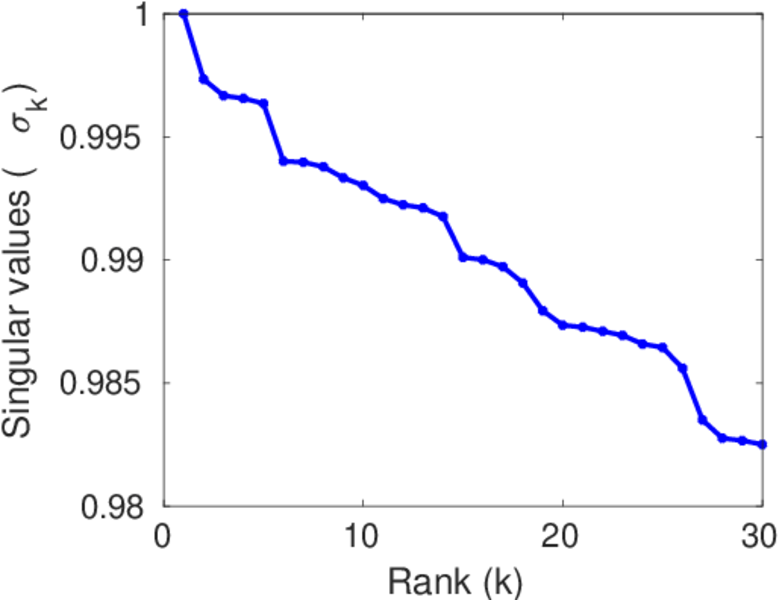
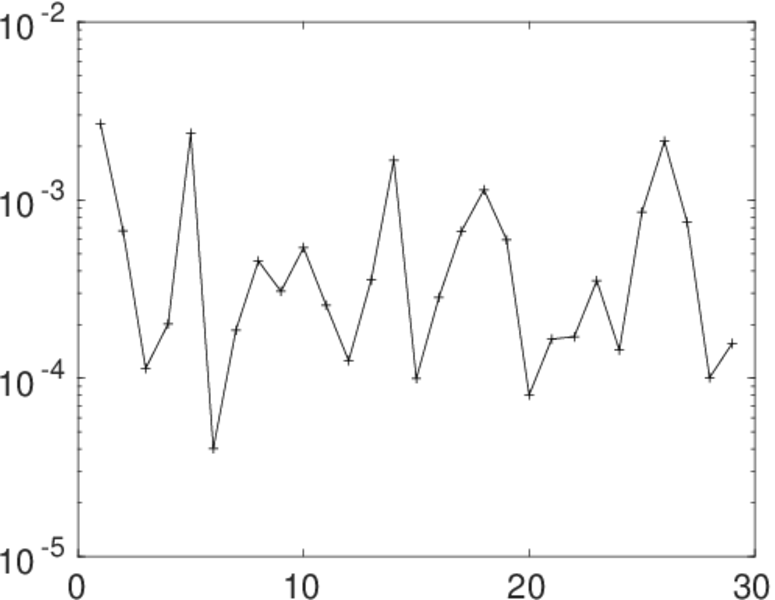
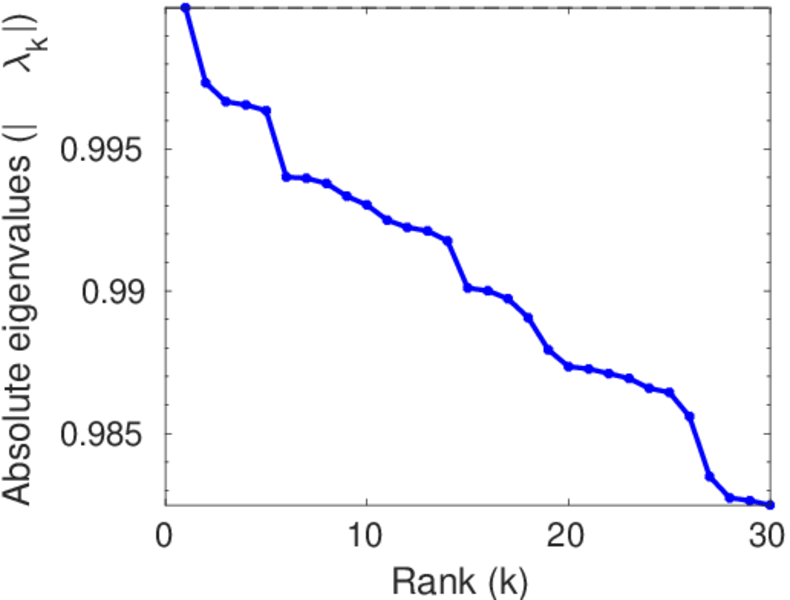
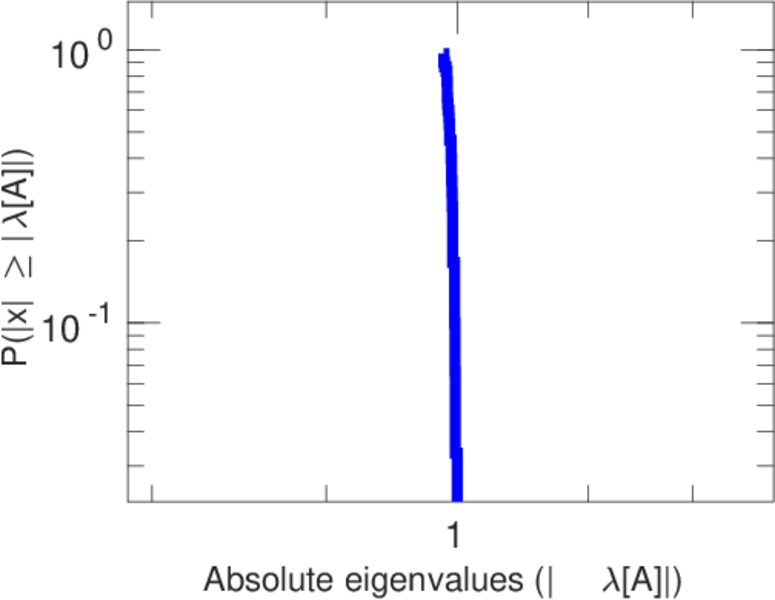
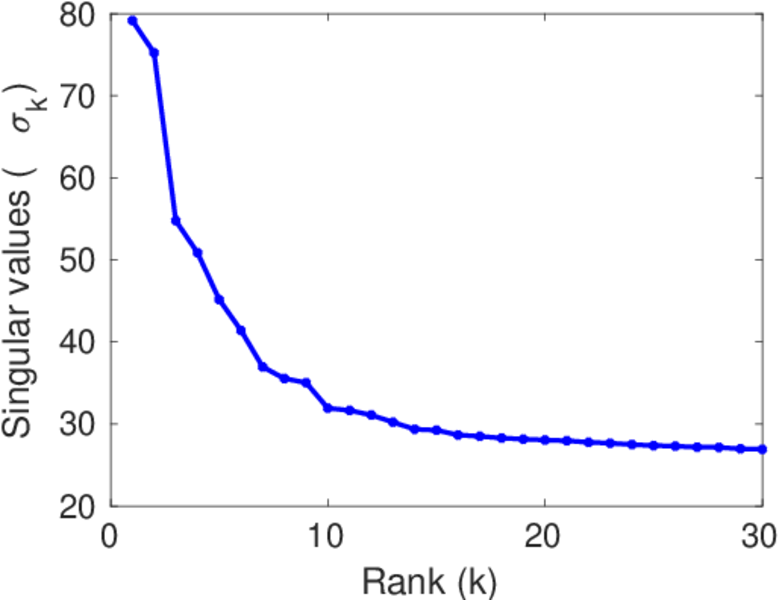
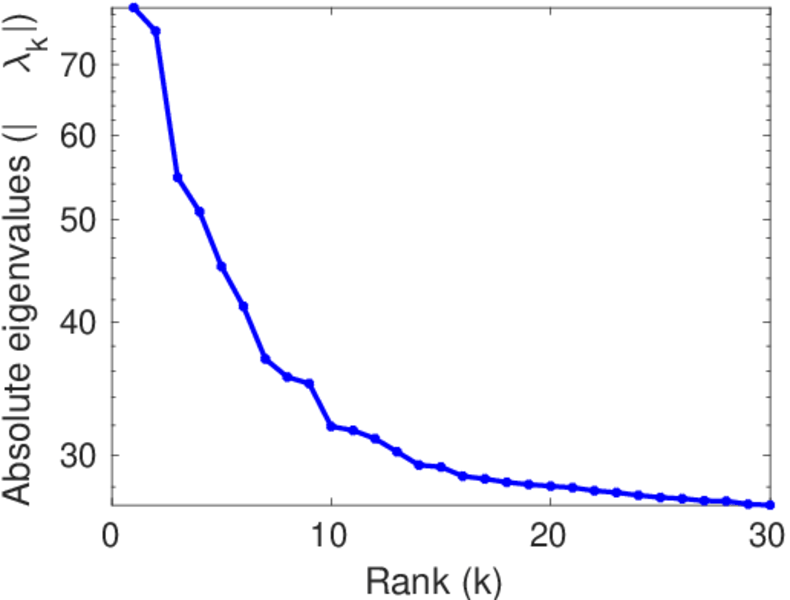
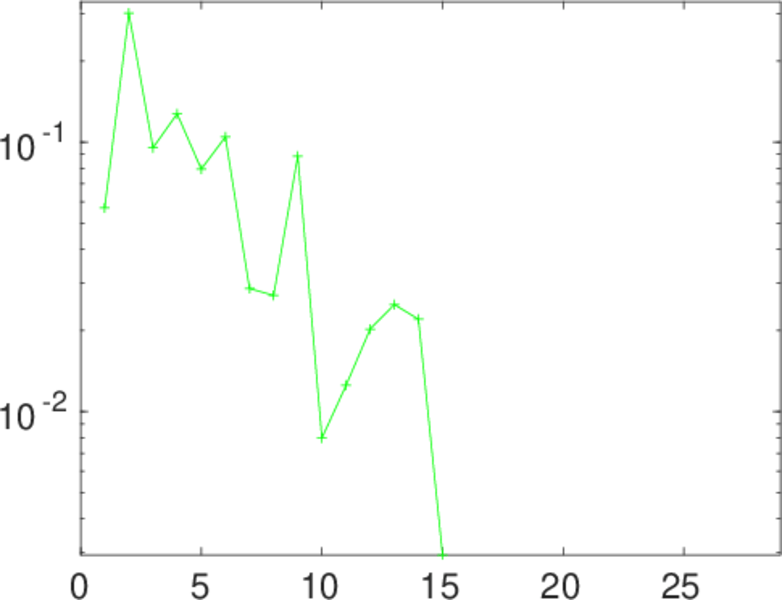
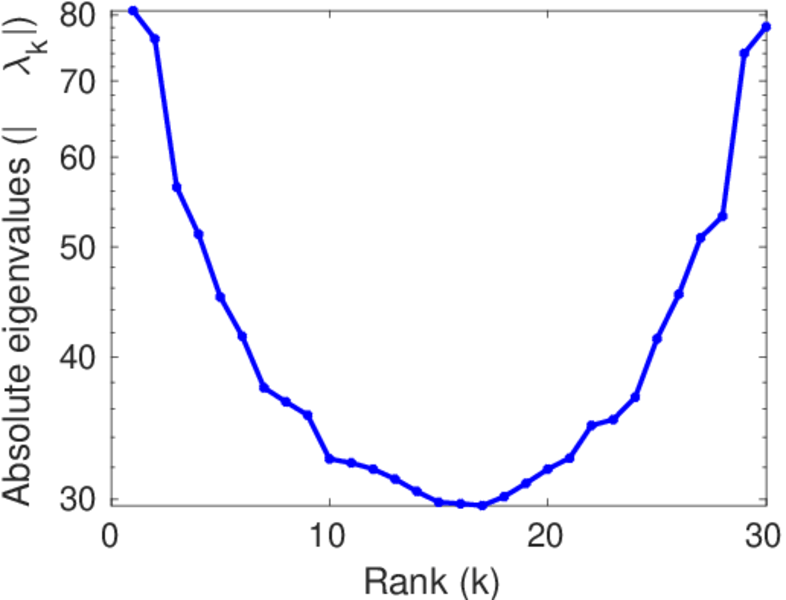
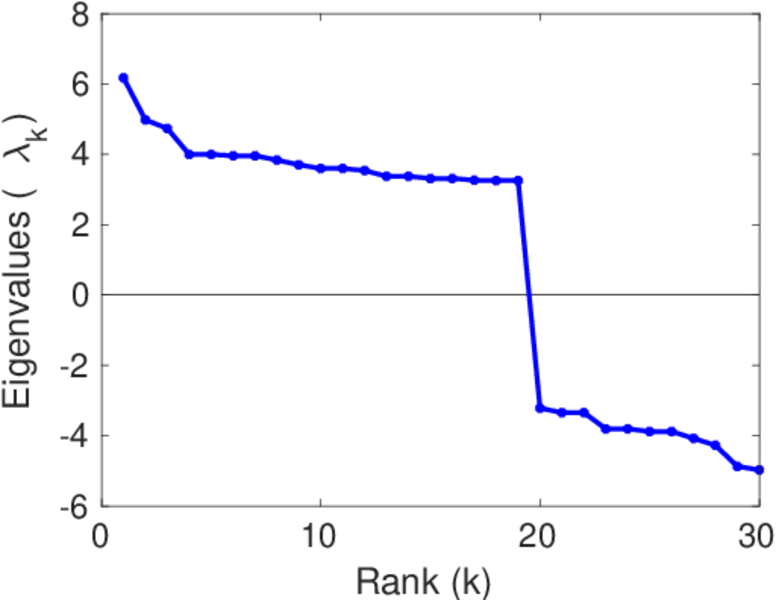
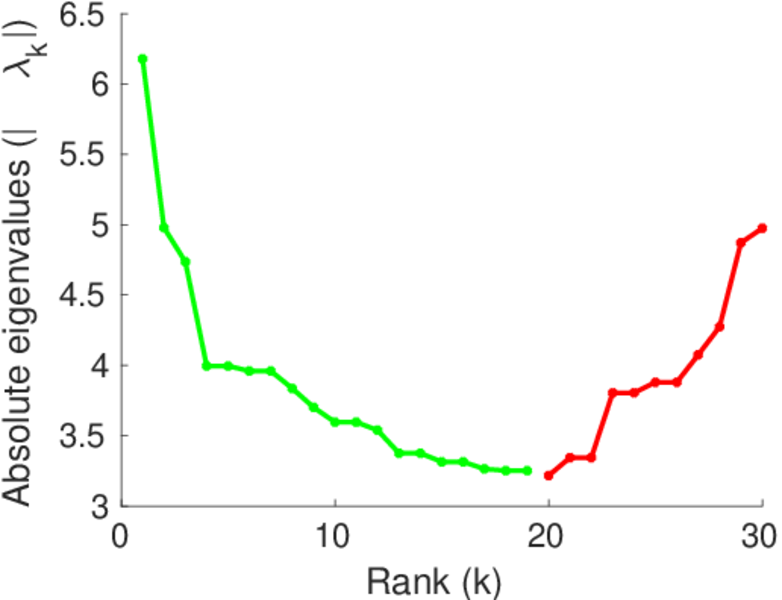
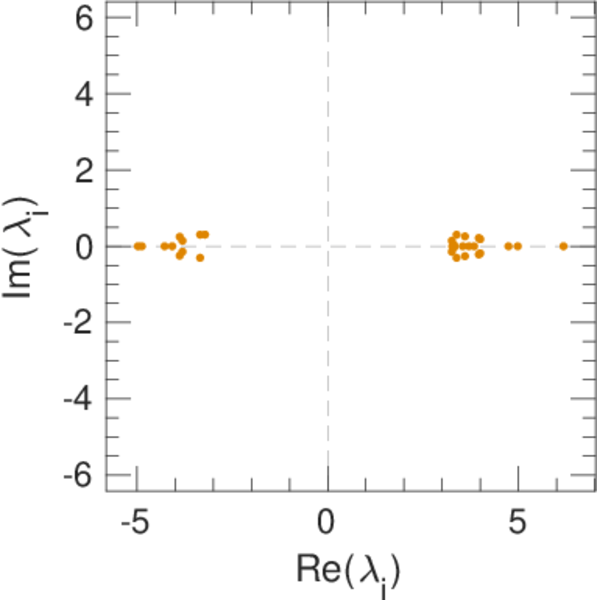
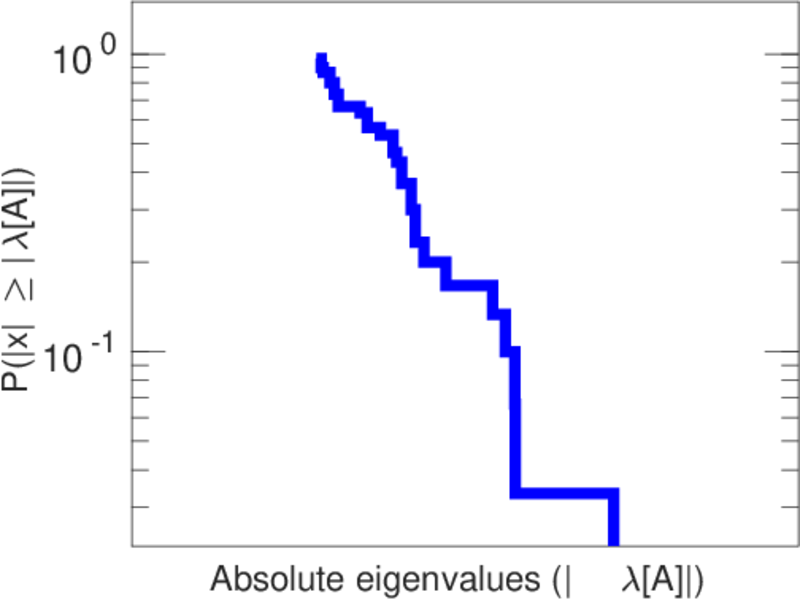
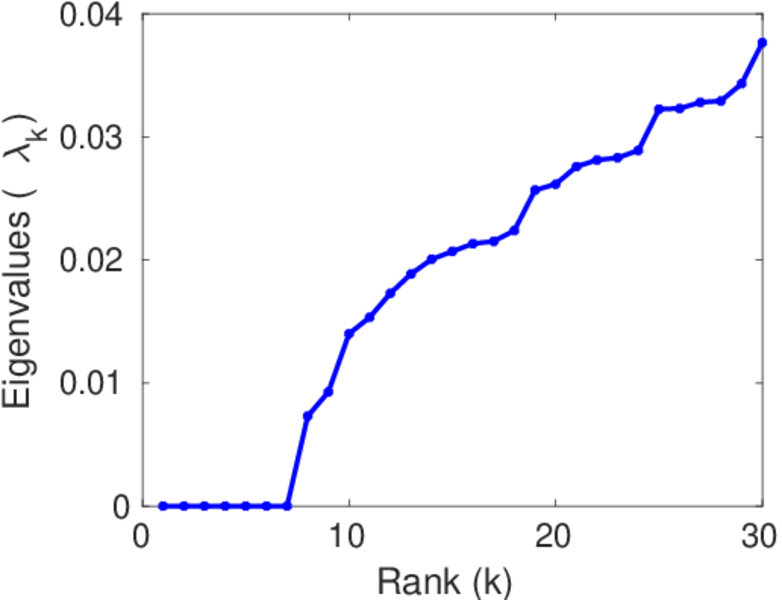
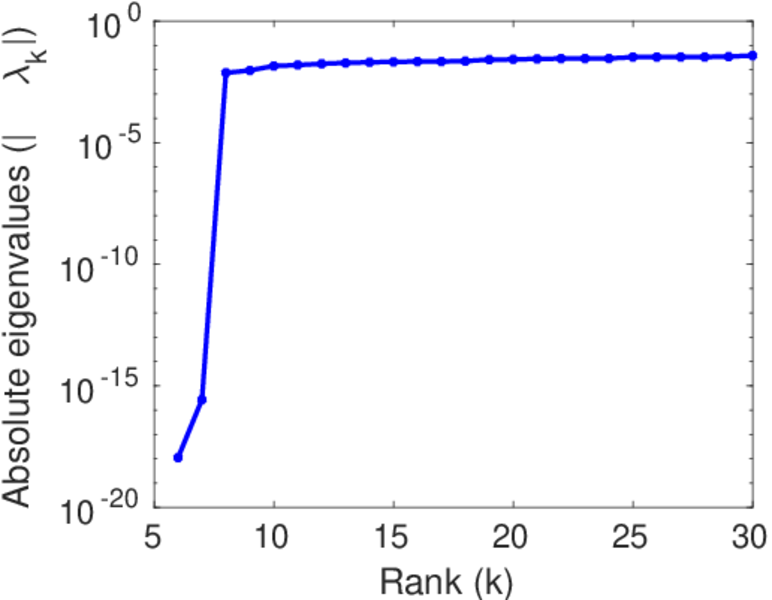
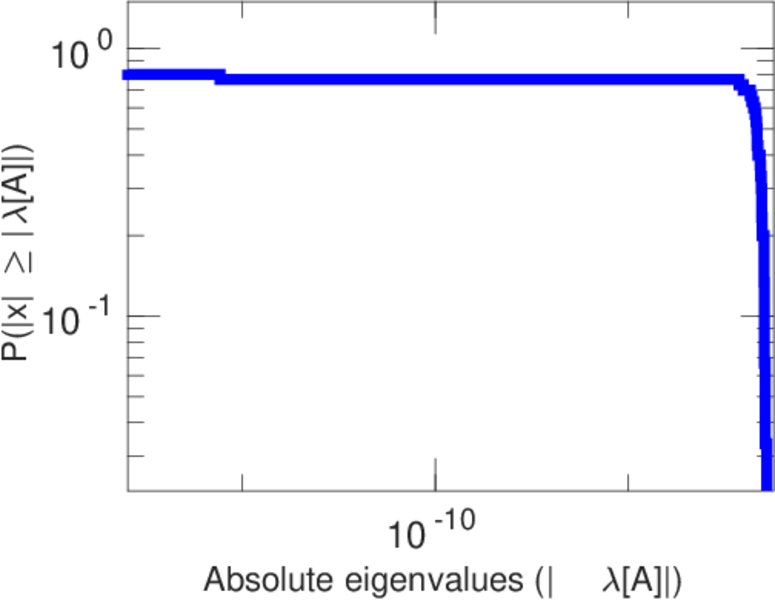
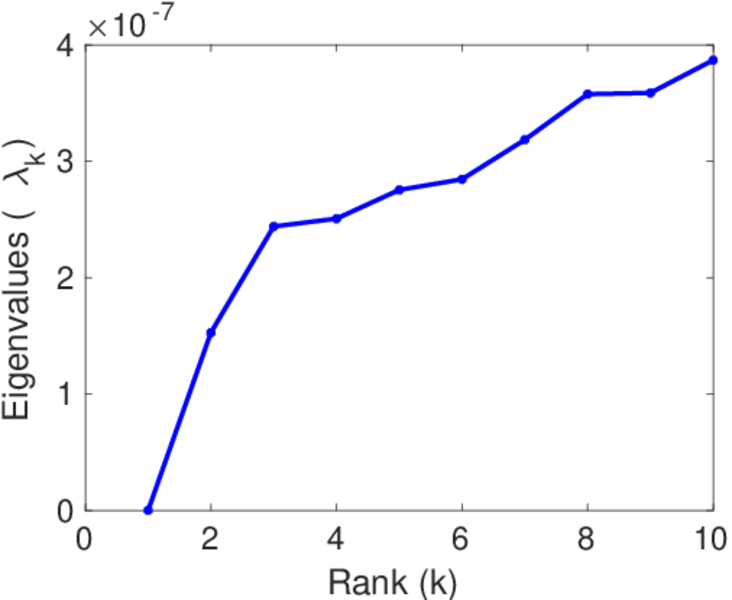
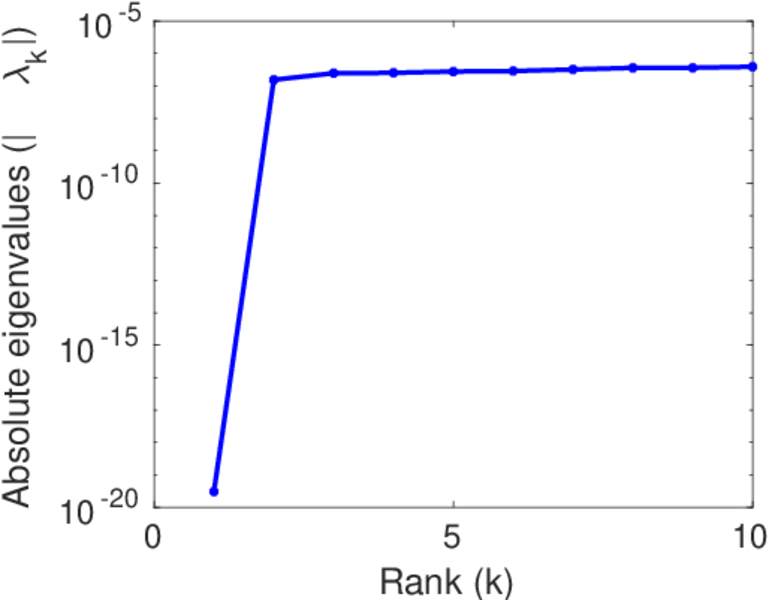
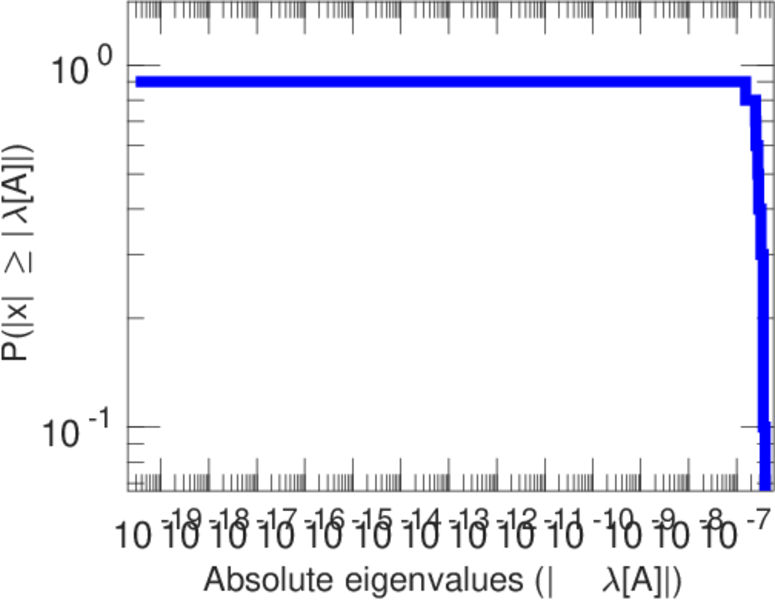
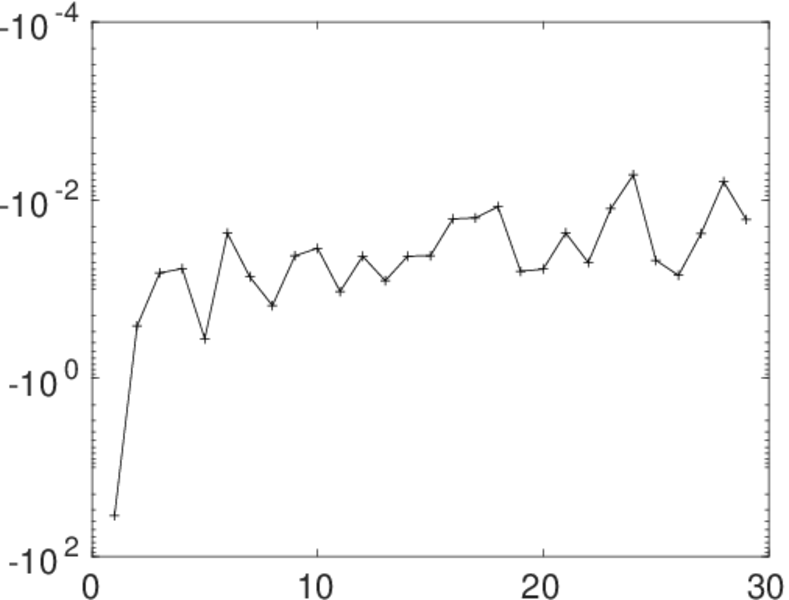
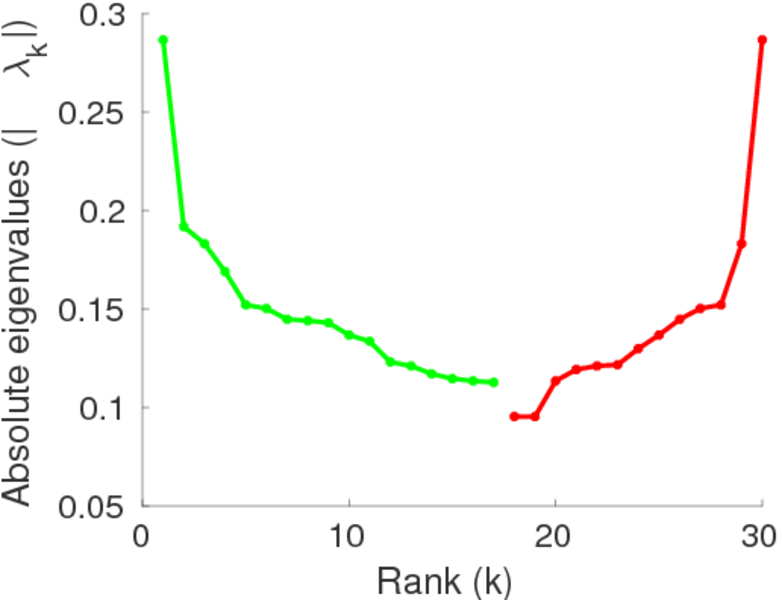
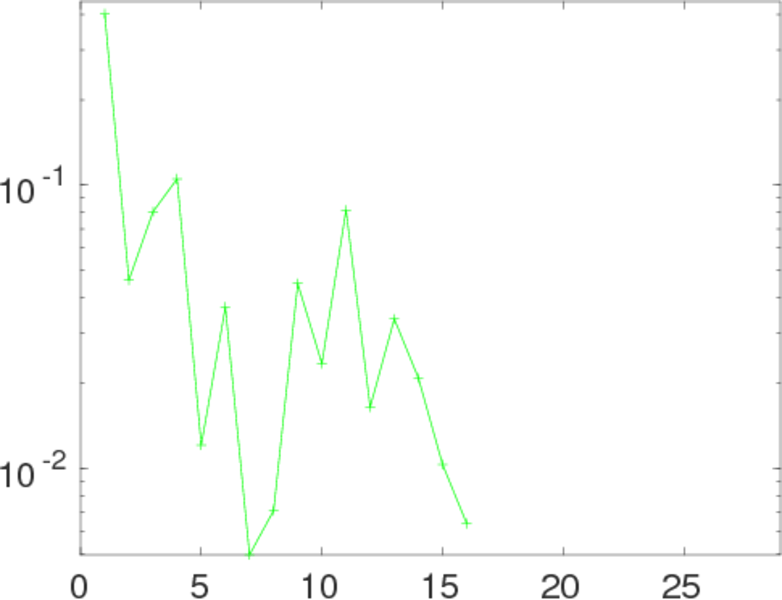
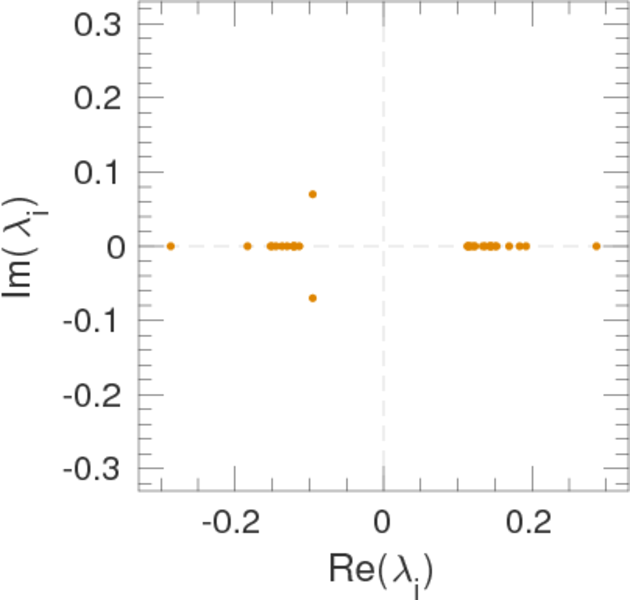
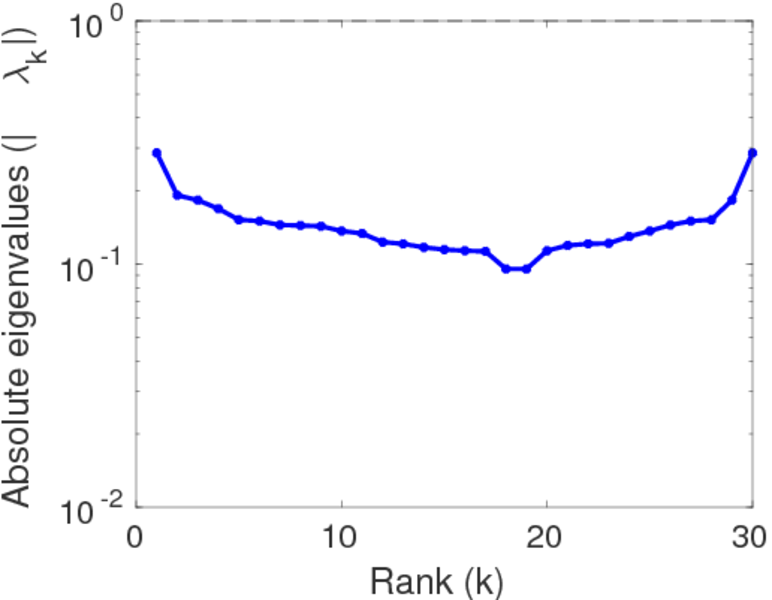
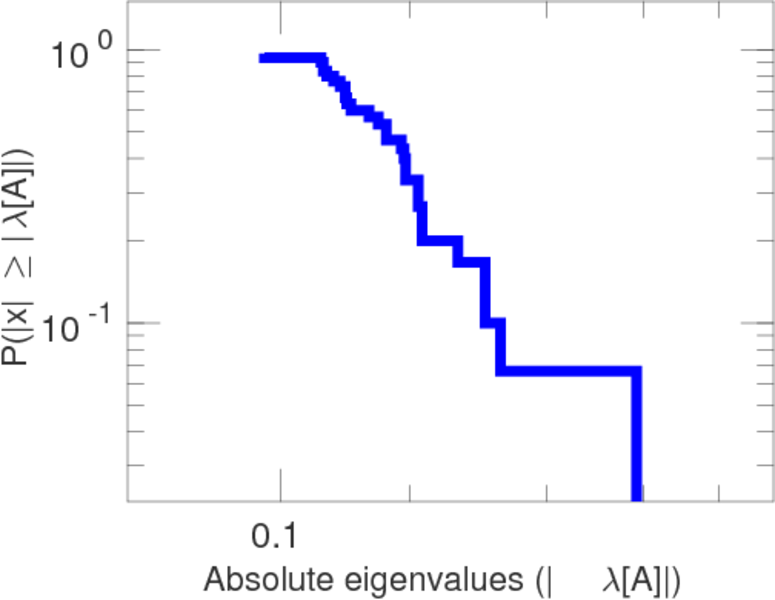
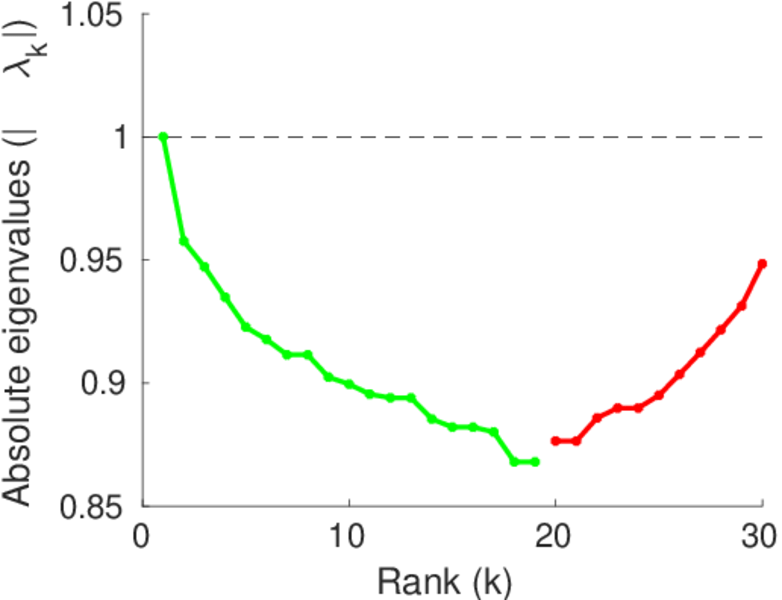
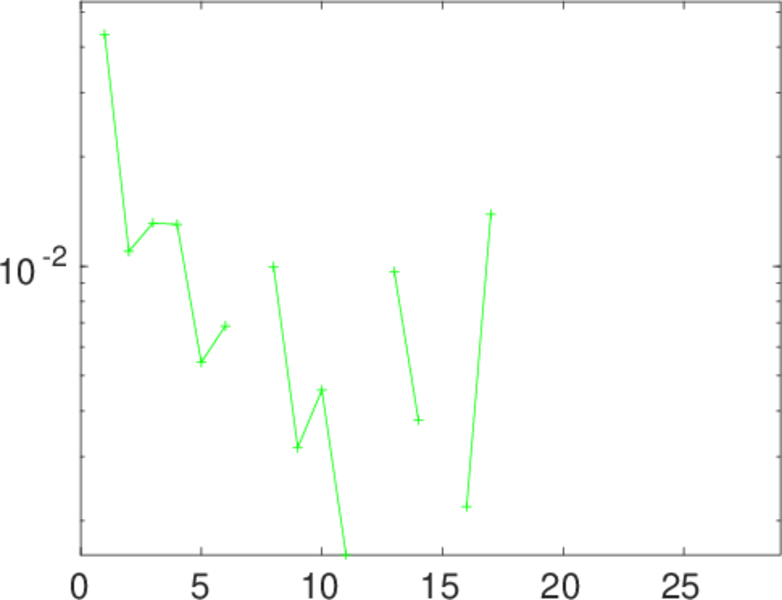
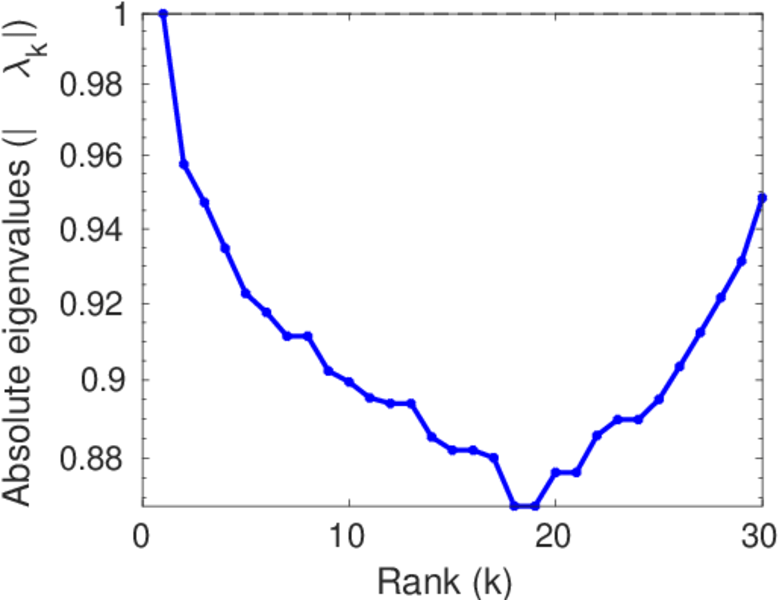
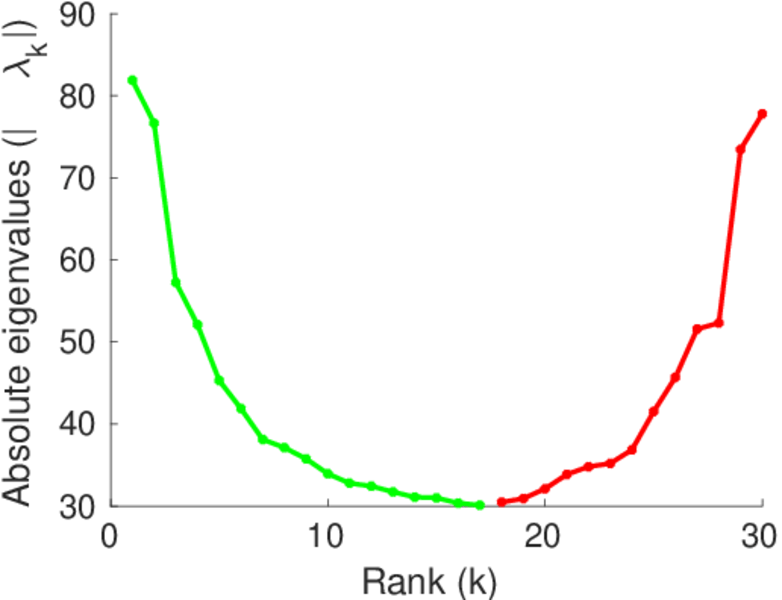
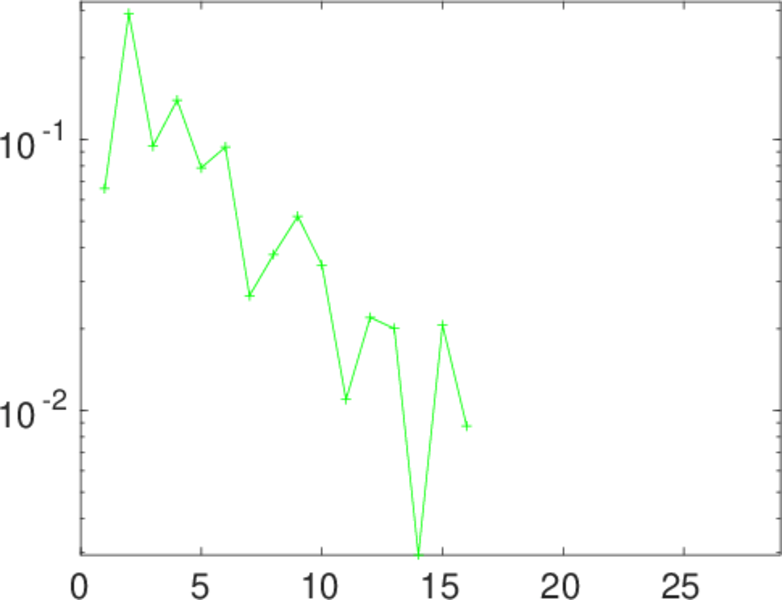
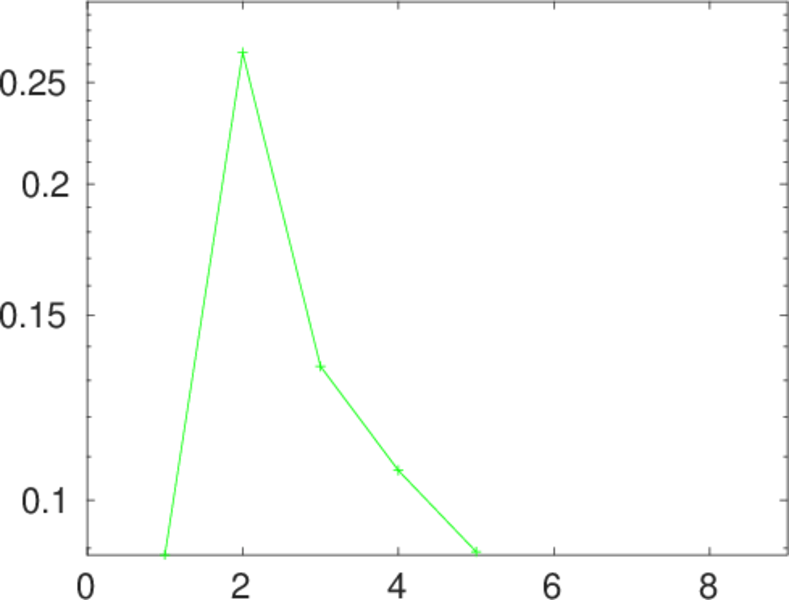
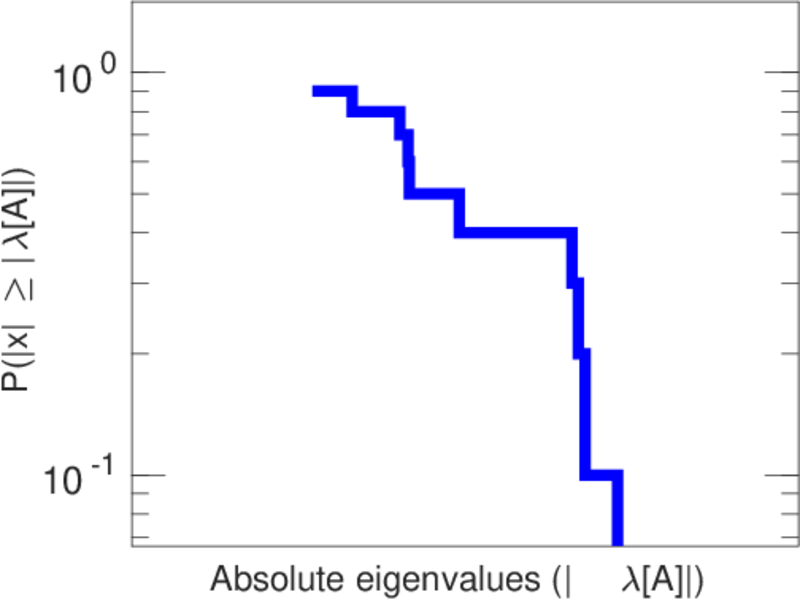
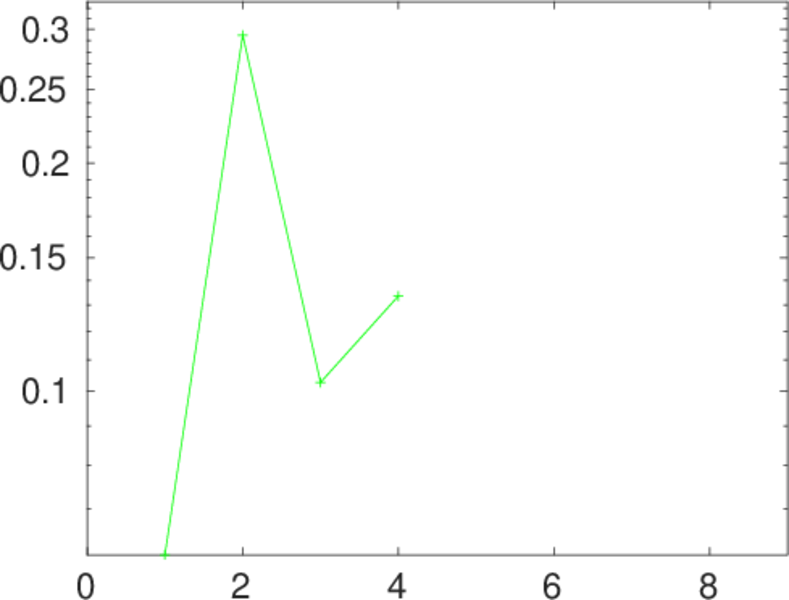
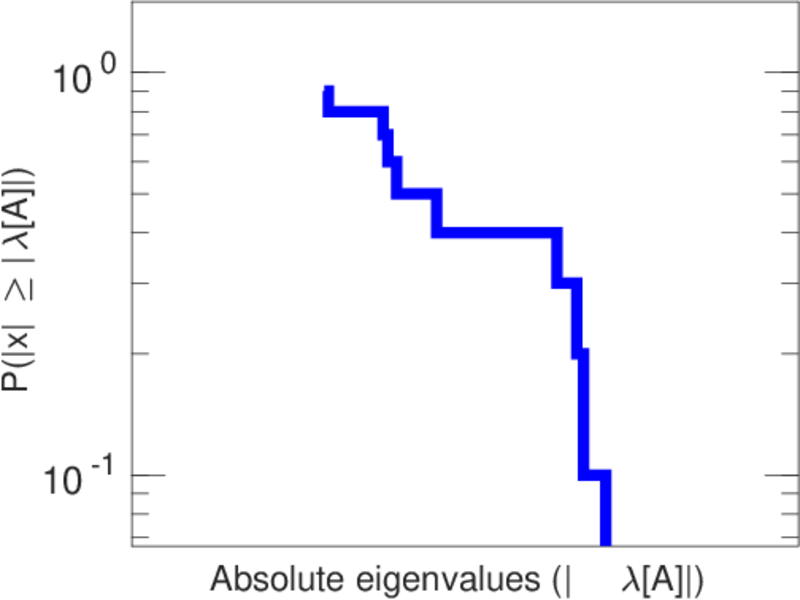
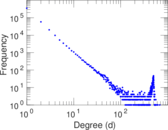
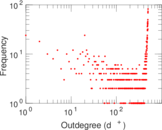
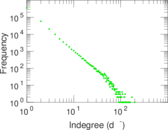
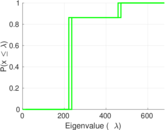
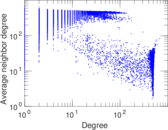
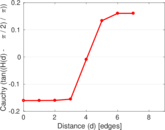
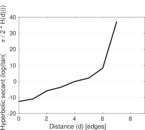
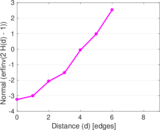
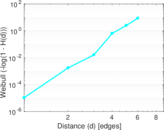
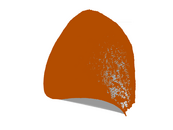
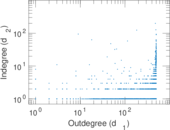
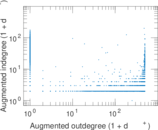
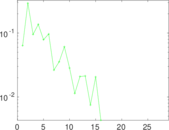
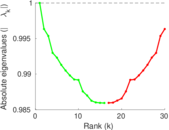
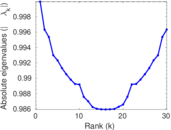
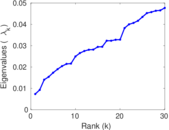
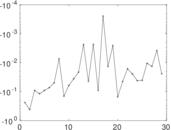
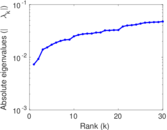
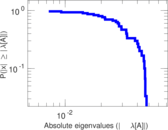
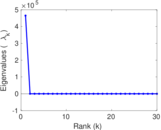
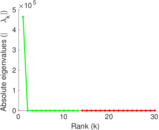
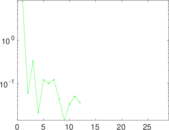
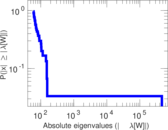
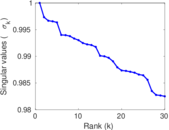
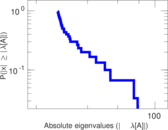
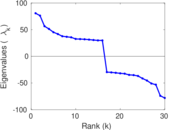
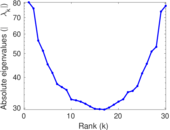
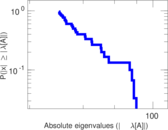
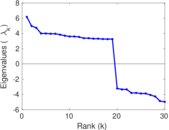
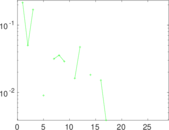
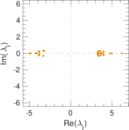
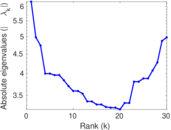
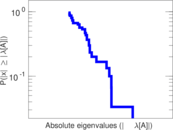
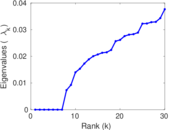
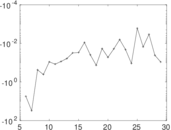
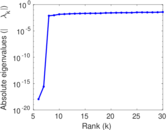
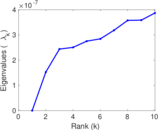
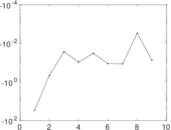
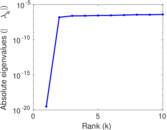
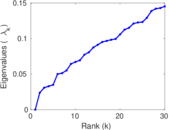
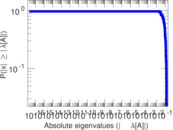
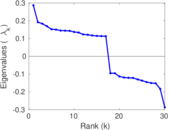
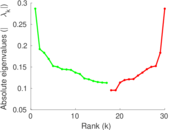
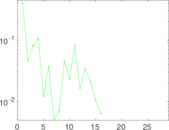
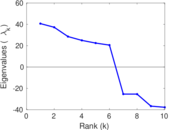
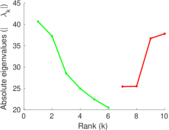
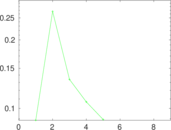
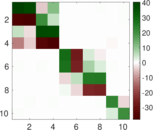
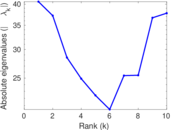
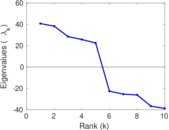
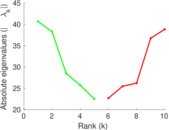
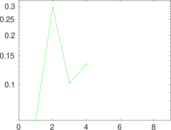
Plots


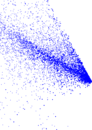


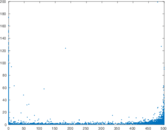


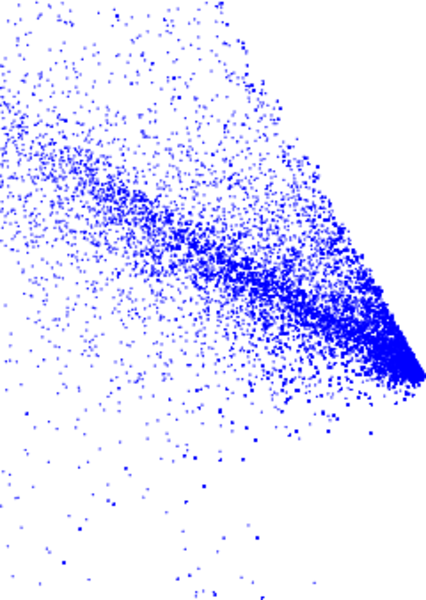
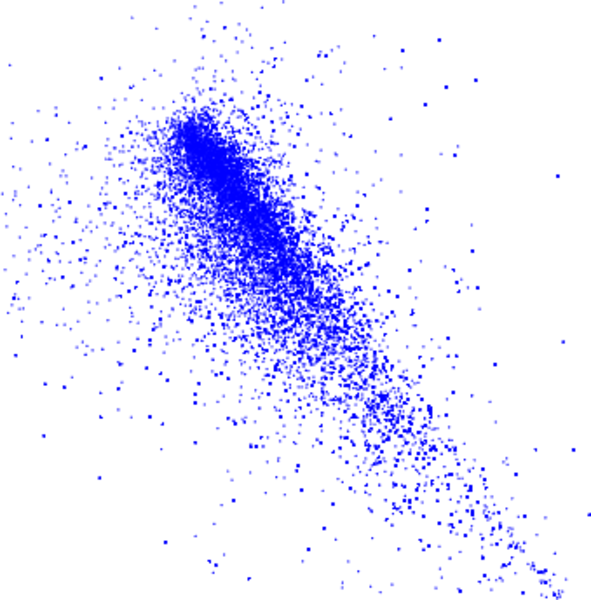
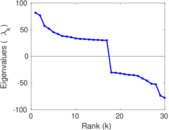
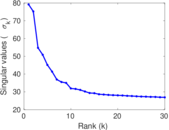
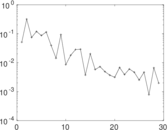
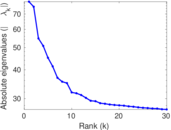
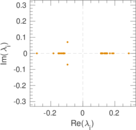
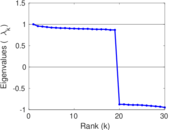
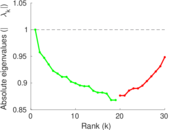
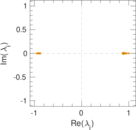
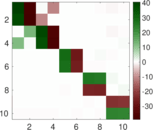
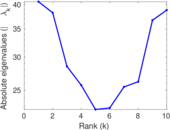
Matrix decompositions plots


Downloads
References
|
[1]
|
Jérôme Kunegis.
KONECT – The Koblenz Network Collection.
In Proc. Int. Conf. on World Wide Web Companion, pages
1343–1350, 2013.
[ http ]
|
|
[2]
|
Munmun De Choudhury, Yu-Ru Lin, Hari Sundaram, K. Selçuk Candan, Lexing Xie,
and Aisling Kelliher.
How does the data sampling strategy impact the discovery of
information diffusion in social media?
In ICWSM, pages 34–41, 2010.
|
 KONECT ‣ Networks ‣
Buy Me a Coffee
KONECT ‣ Networks ‣
Buy Me a Coffee