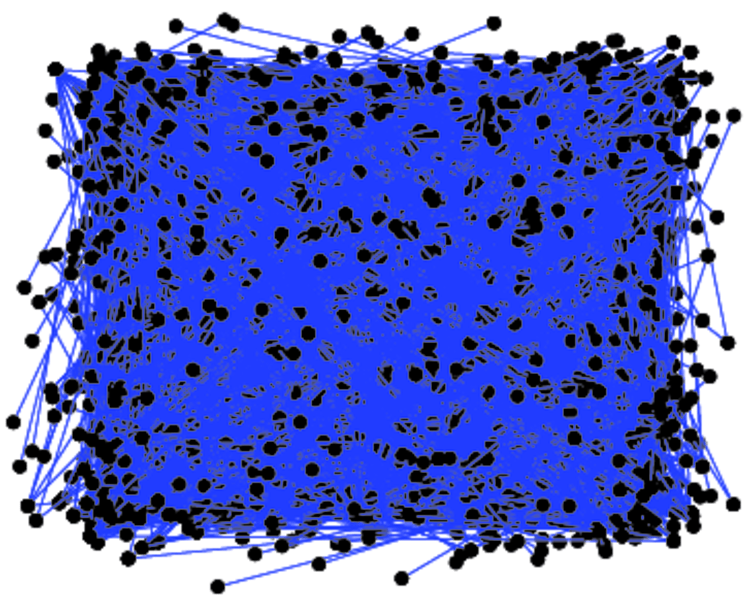
OpenFlights (Patokallio)
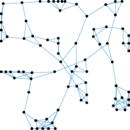
These are flights collected by the OpenFlights.org project. Each node is an
airport, and a directed edge represents one flight by one airline. A flight in
this dataset is defined as a normally regularly occuring flight identified by
its flight number (e.g., AF331), not individual flights (e.g., AF331 on June 14
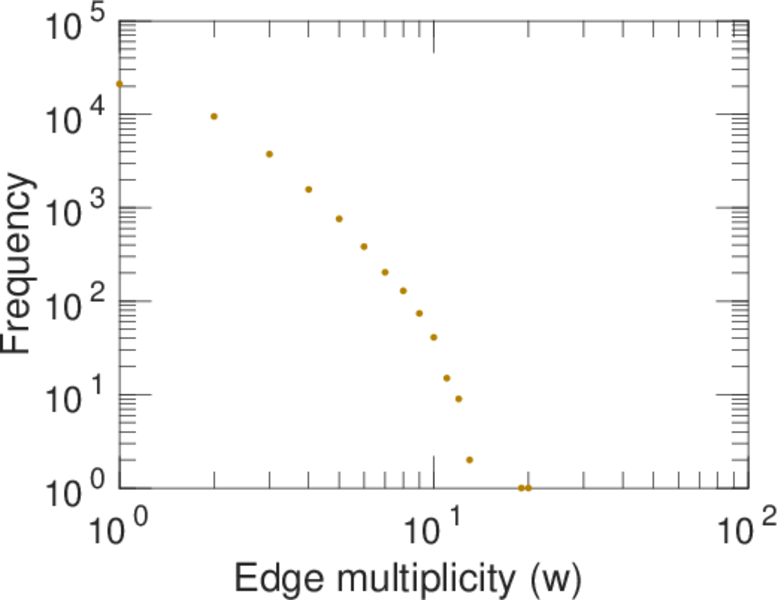
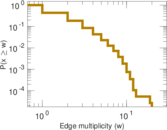
2015). In the network, multiple edges may connect the same nodes, because
multiple airlines may connect the same airports, and a single airline may have
multiple flights connecting the same airports (usually, at different time of
days). Thus, the multiplicity of an edge gives a rough estimate of the traffic
between two airports. The dataset in the version available contains at least
one loop: A flight by Trigana Air Service (IATA code IL) from and to Iskandar
Airport (IATA code PKN) in Indonesia. We do not know whether such entries are
errors, or whether they represent legitimate flights, used e.g. for sightseeing.
Metadata
Statistics
| Size | n = | 3,425
|
| Volume | m = | 67,663
|
| Unique edge count | m̿ = | 37,595
|
| Loop count | l = | 1
|
| Wedge count | s = | 1,221,697
|
| Claw count | z = | 383,135,844
|
| Cross count | x = | 29,224,814,720
|
| Triangle count | t = | 101,117
|
| Square count | q = | 4,243,727
|
| 4-Tour count | T4 = | 38,875,116
|
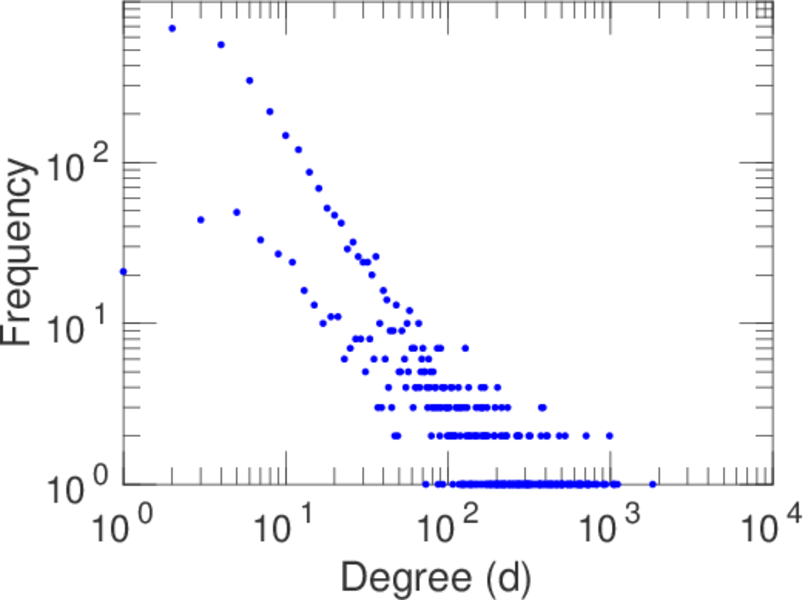
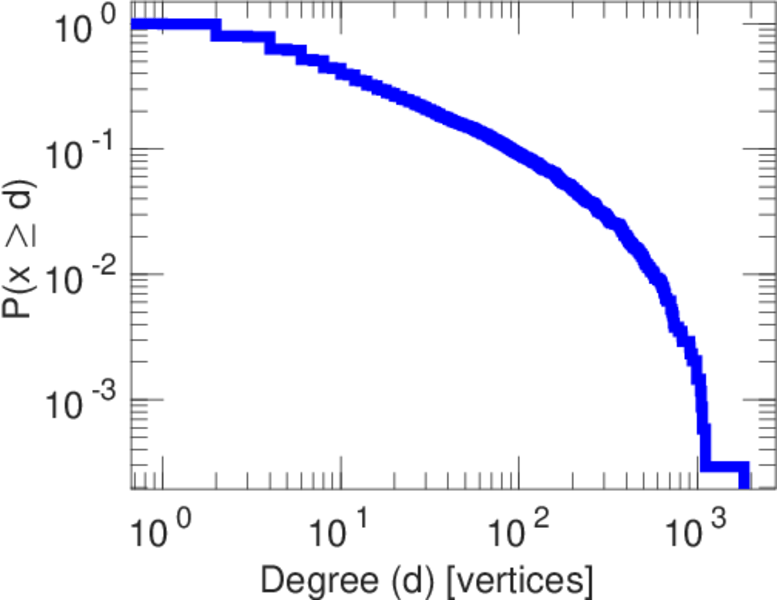
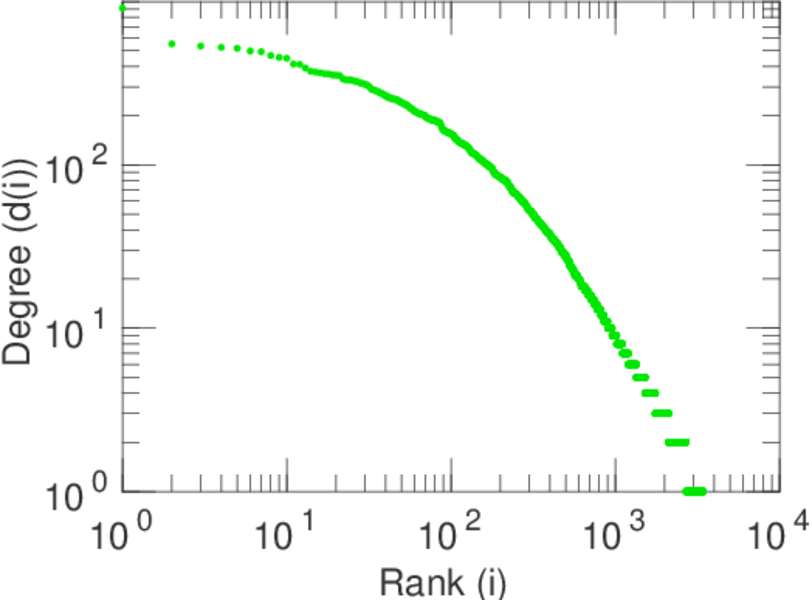
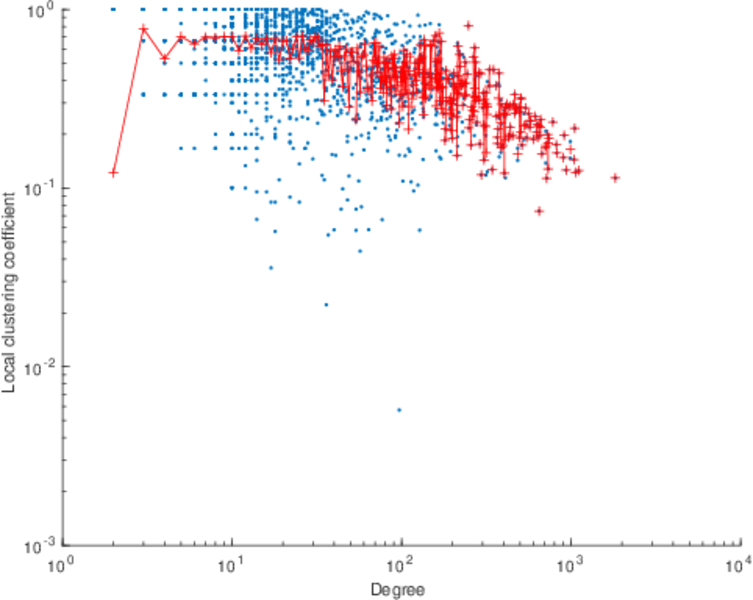
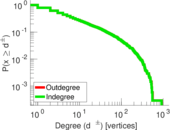
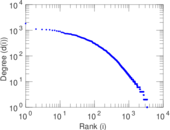
| Maximum degree | dmax = | 1,826
|
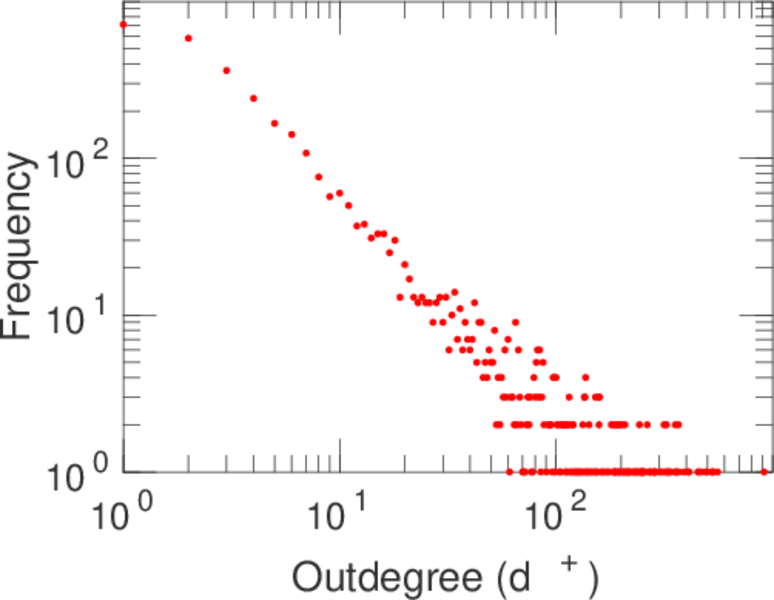
| Maximum outdegree | d+max = | 915
|
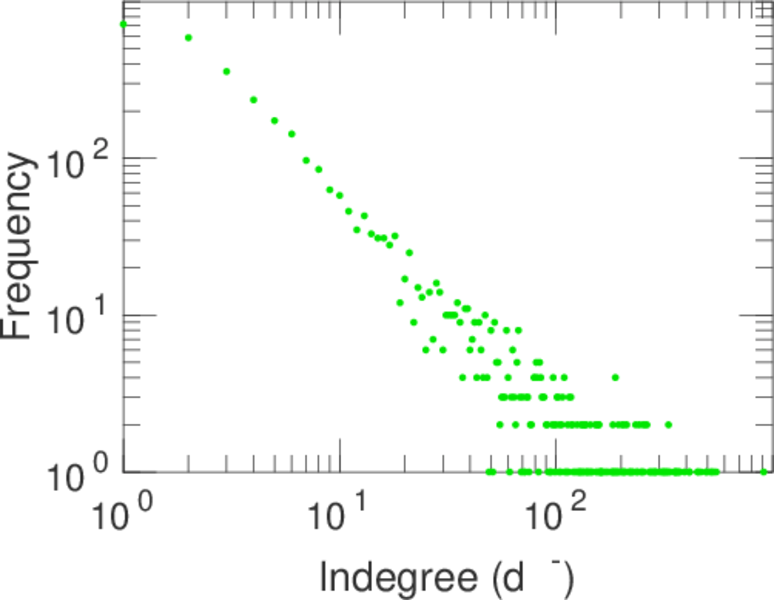
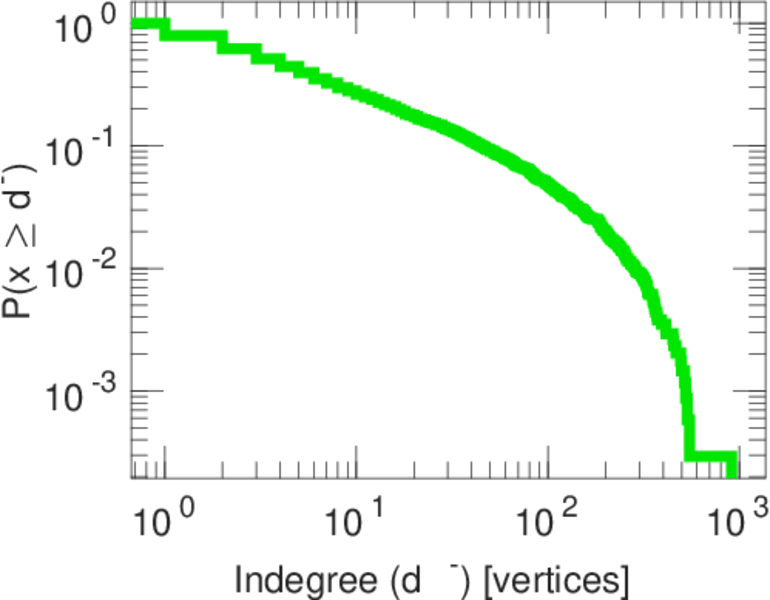
| Maximum indegree | d−max = | 911
|
| Average degree | d = | 39.511 2
|
| Fill | p = | 0.003 204 86
|
| Average edge multiplicity | m̃ = | 1.799 79
|
| Size of LCC | N = | 3,397
|
| Size of LSCC | Ns = | 3,354
|
| Relative size of LSCC | Nrs = | 0.979 270
|
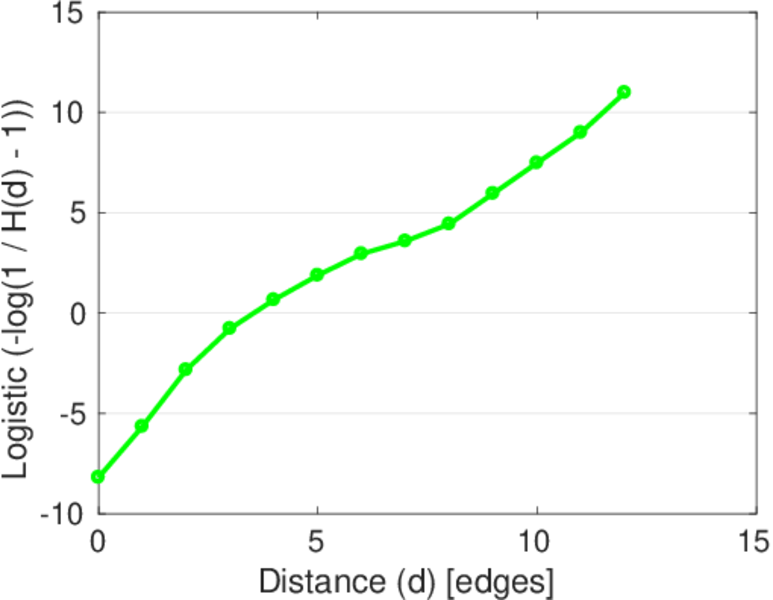
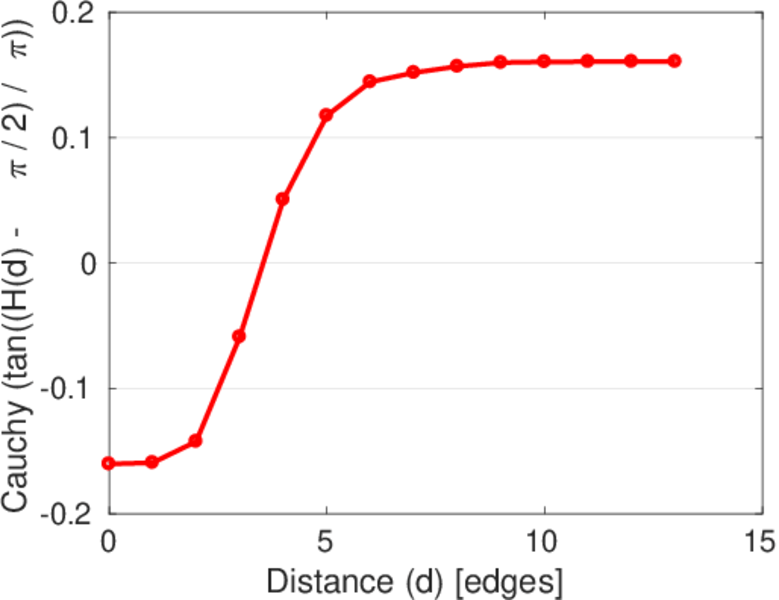
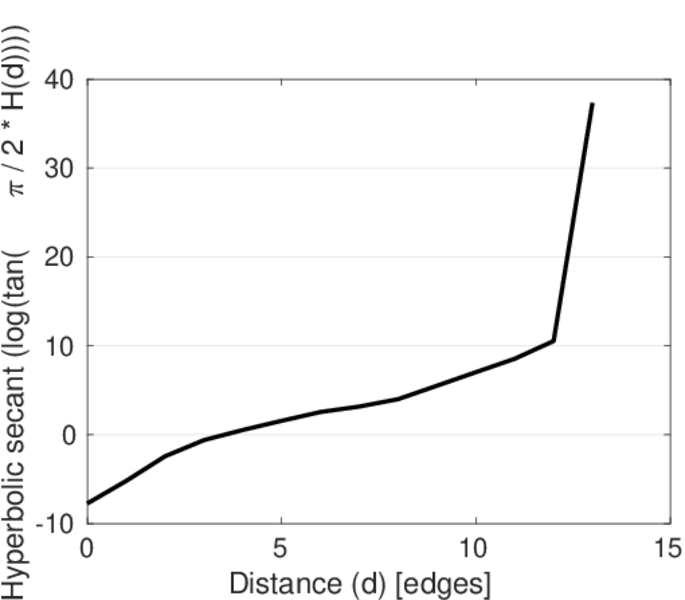
| Diameter | δ = | 13
|
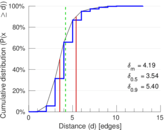
| 50-Percentile effective diameter | δ0.5 = | 3.539 75
|
| 90-Percentile effective diameter | δ0.9 = | 5.395 08
|
| Median distance | δM = | 4
|
| Mean distance | δm = | 4.192 98
|
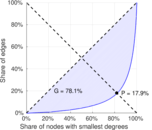
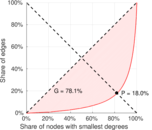
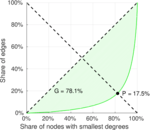
| Gini coefficient | G = | 0.781 382
|
| Balanced inequality ratio | P = | 0.179 330
|
| Outdegree balanced inequality ratio | P+ = | 0.179 685
|
| Indegree balanced inequality ratio | P− = | 0.175 443
|
| Relative edge distribution entropy | Her = | 0.863 738
|
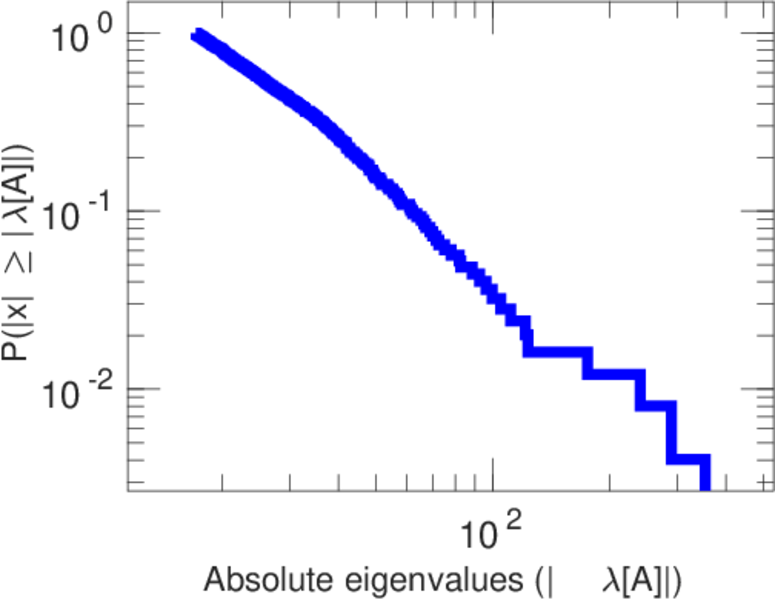
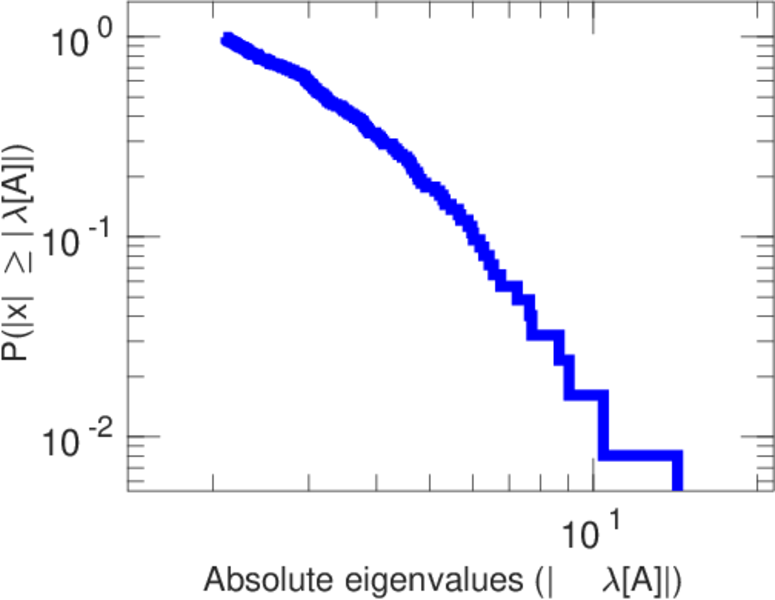
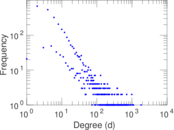
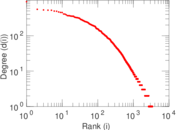
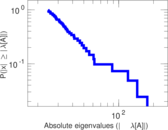
| Power law exponent | γ = | 1.715 88
|
| Tail power law exponent | γt = | 1.741 00
|
| Tail power law exponent with p | γ3 = | 1.741 00
|
| p-value | p = | 0.000 00
|
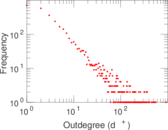
| Outdegree tail power law exponent with p | γ3,o = | 1.721 00
|
| Outdegree p-value | po = | 0.000 00
|
| Indegree tail power law exponent with p | γ3,i = | 1.721 00
|
| Indegree p-value | pi = | 0.000 00
|
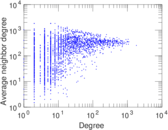
| Degree assortativity | ρ = | −0.006 455 52
|
| Degree assortativity p-value | pρ = | 0.205 214
|
| In/outdegree correlation | ρ± = | +0.995 878
|
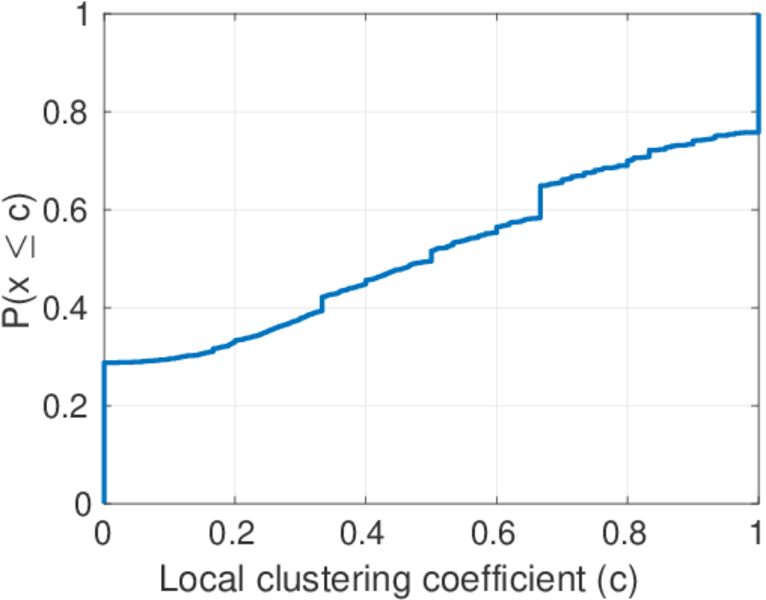
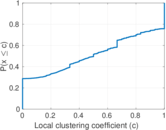
| Clustering coefficient | c = | 0.248 303
|
| Directed clustering coefficient | c± = | 0.249 277
|
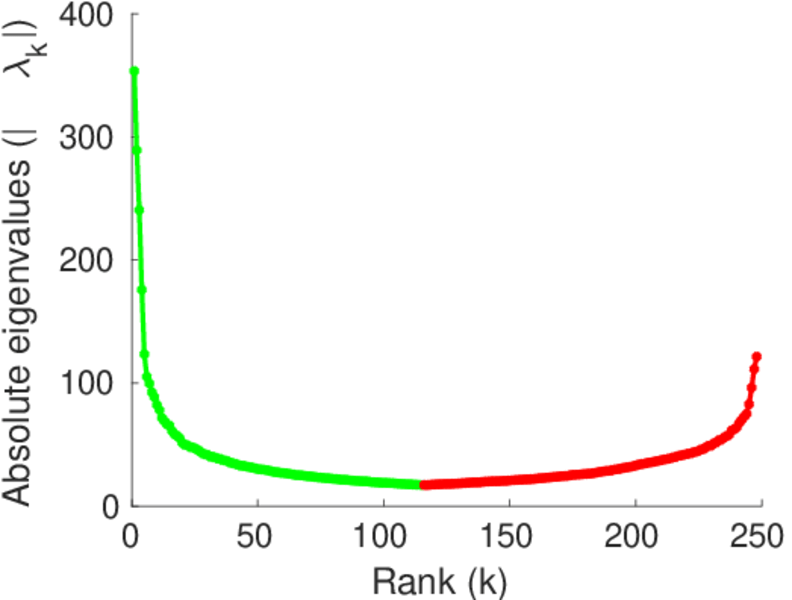
| Spectral norm | α = | 353.415
|
| Operator 2-norm | ν = | 176.748
|
| Cyclic eigenvalue | π = | 176.668
|
| Algebraic connectivity | a = | 0.047 360 0
|
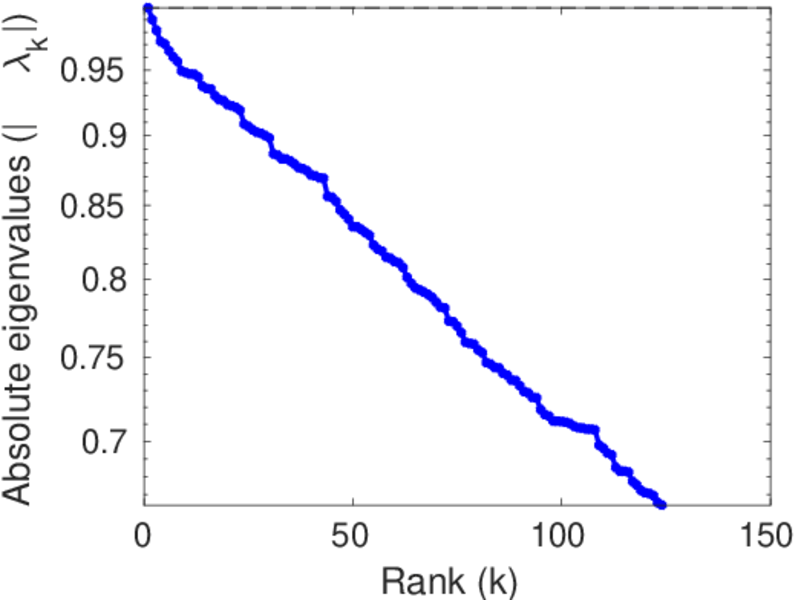
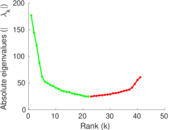
| Spectral separation | |λ1[A] / λ2[A]| = | 1.222 61
|
| Reciprocity | y = | 0.975 582
|
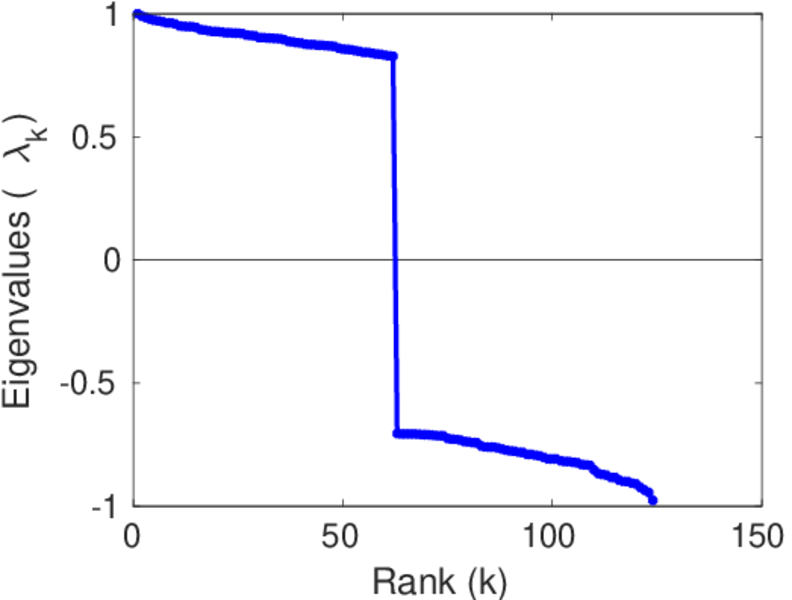
| Non-bipartivity | bA = | 0.656 663
|
| Normalized non-bipartivity | bN = | 0.032 163 5
|
| Algebraic non-bipartivity | χ = | 0.055 356 7
|
| Spectral bipartite frustration | bK = | 0.001 222 29
|
| Controllability | C = | 1,186
|
| Relative controllability | Cr = | 0.346 277
|
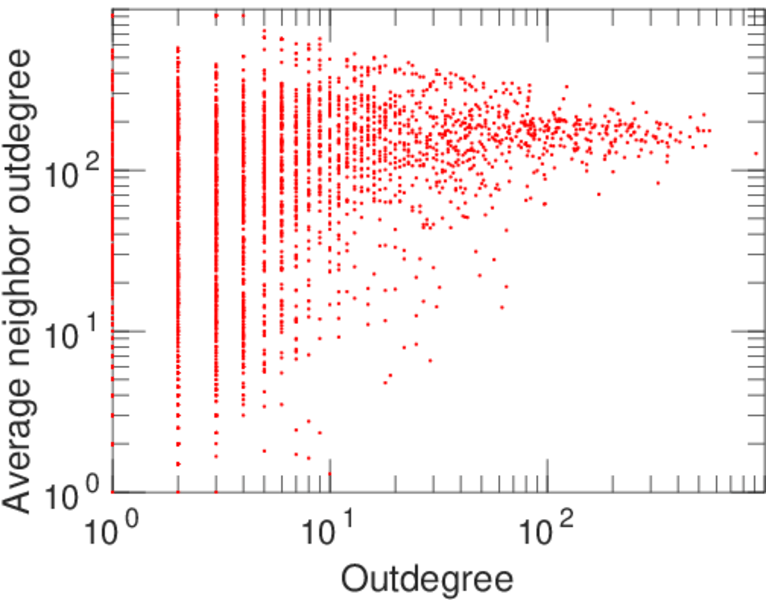
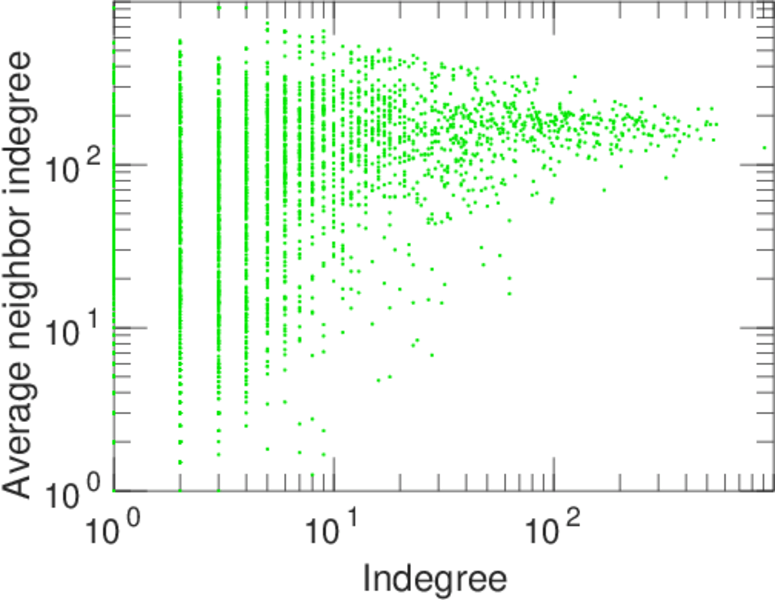
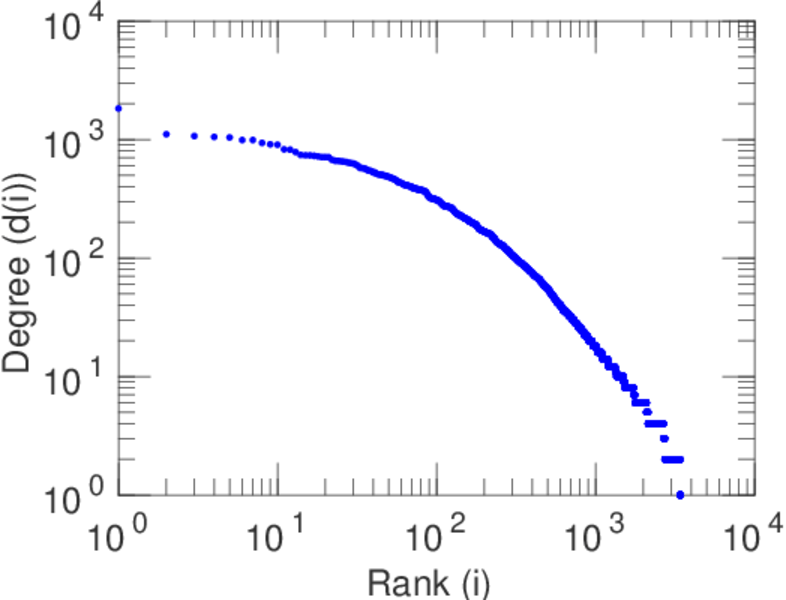
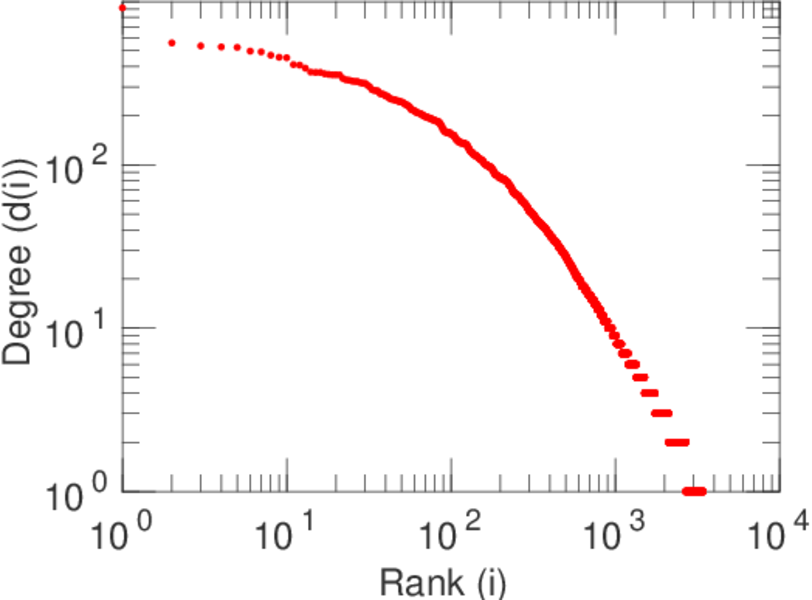
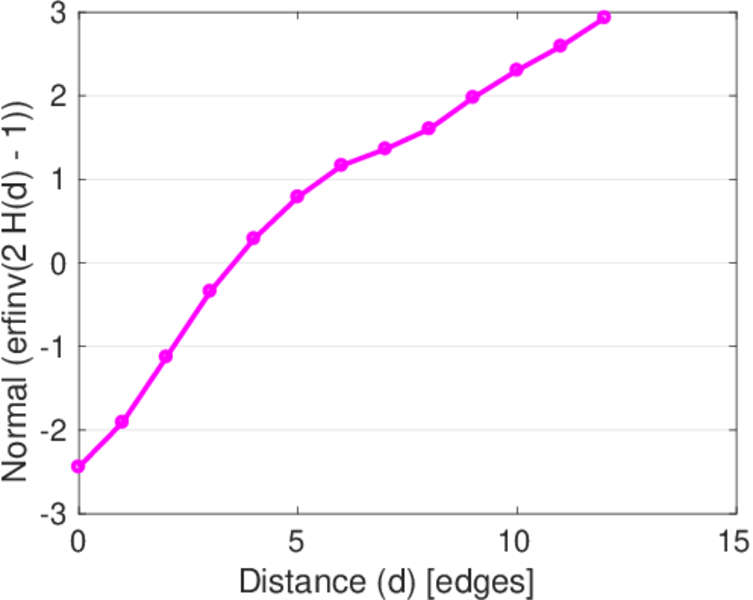
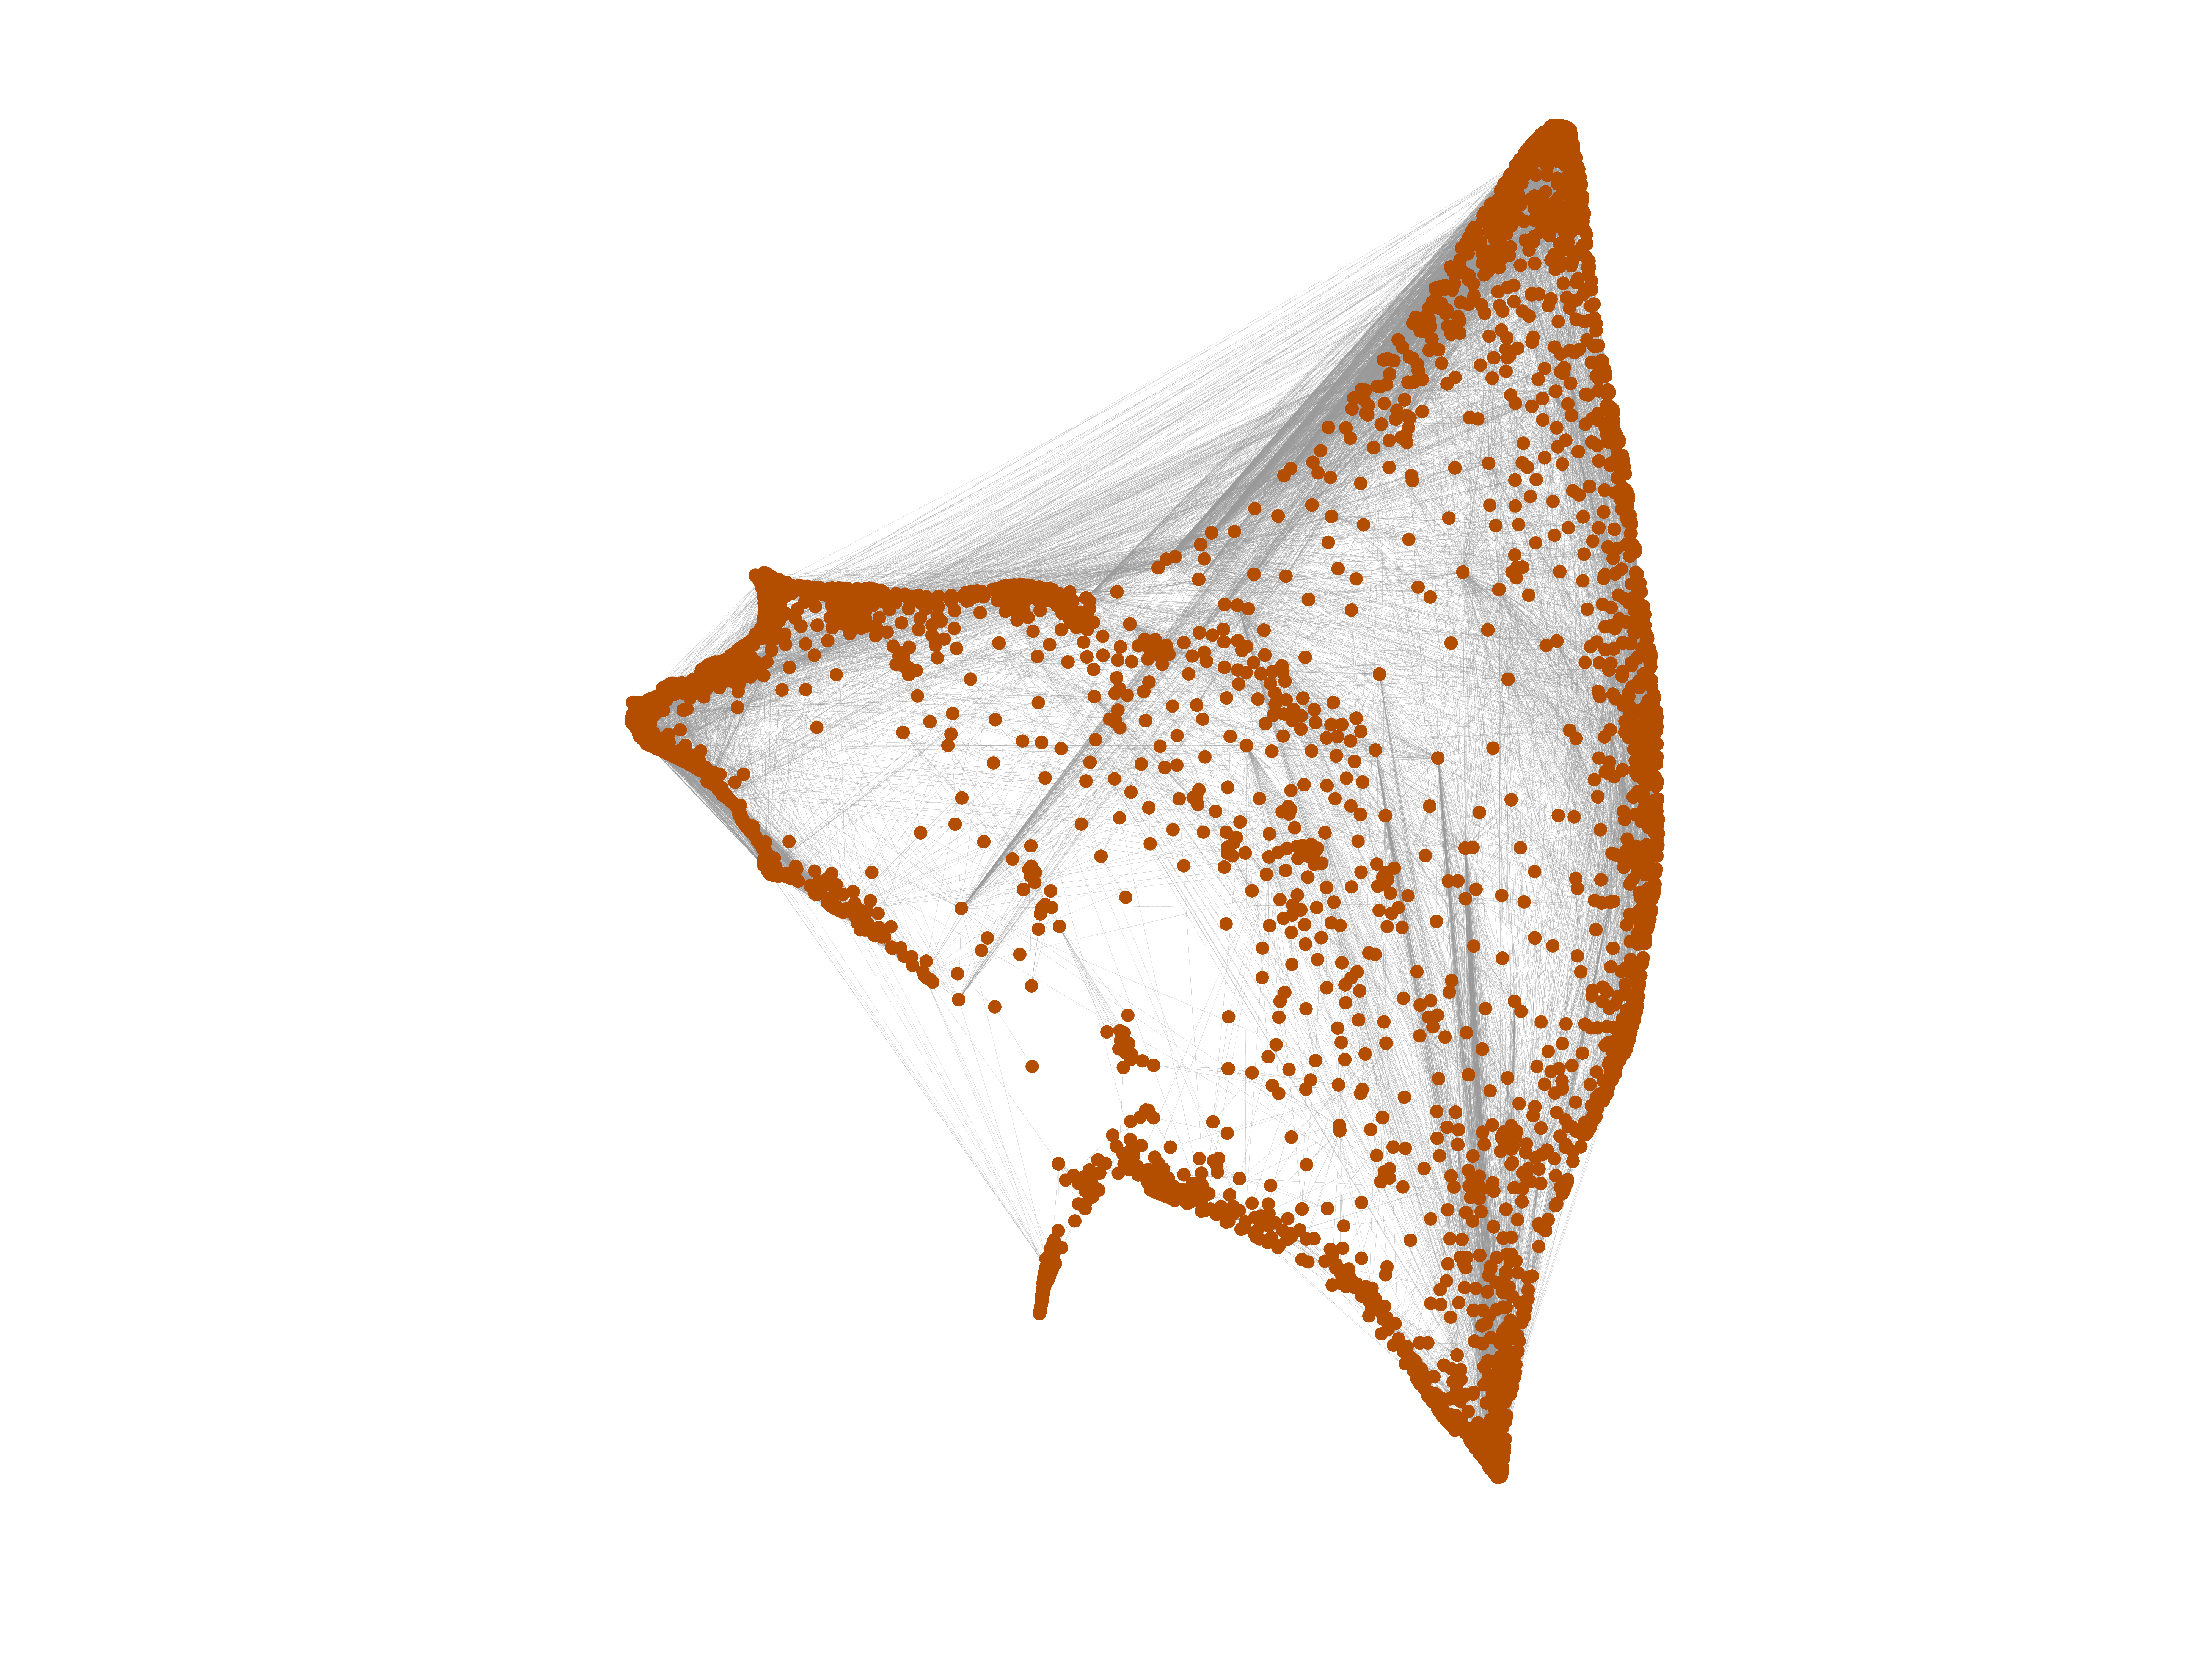
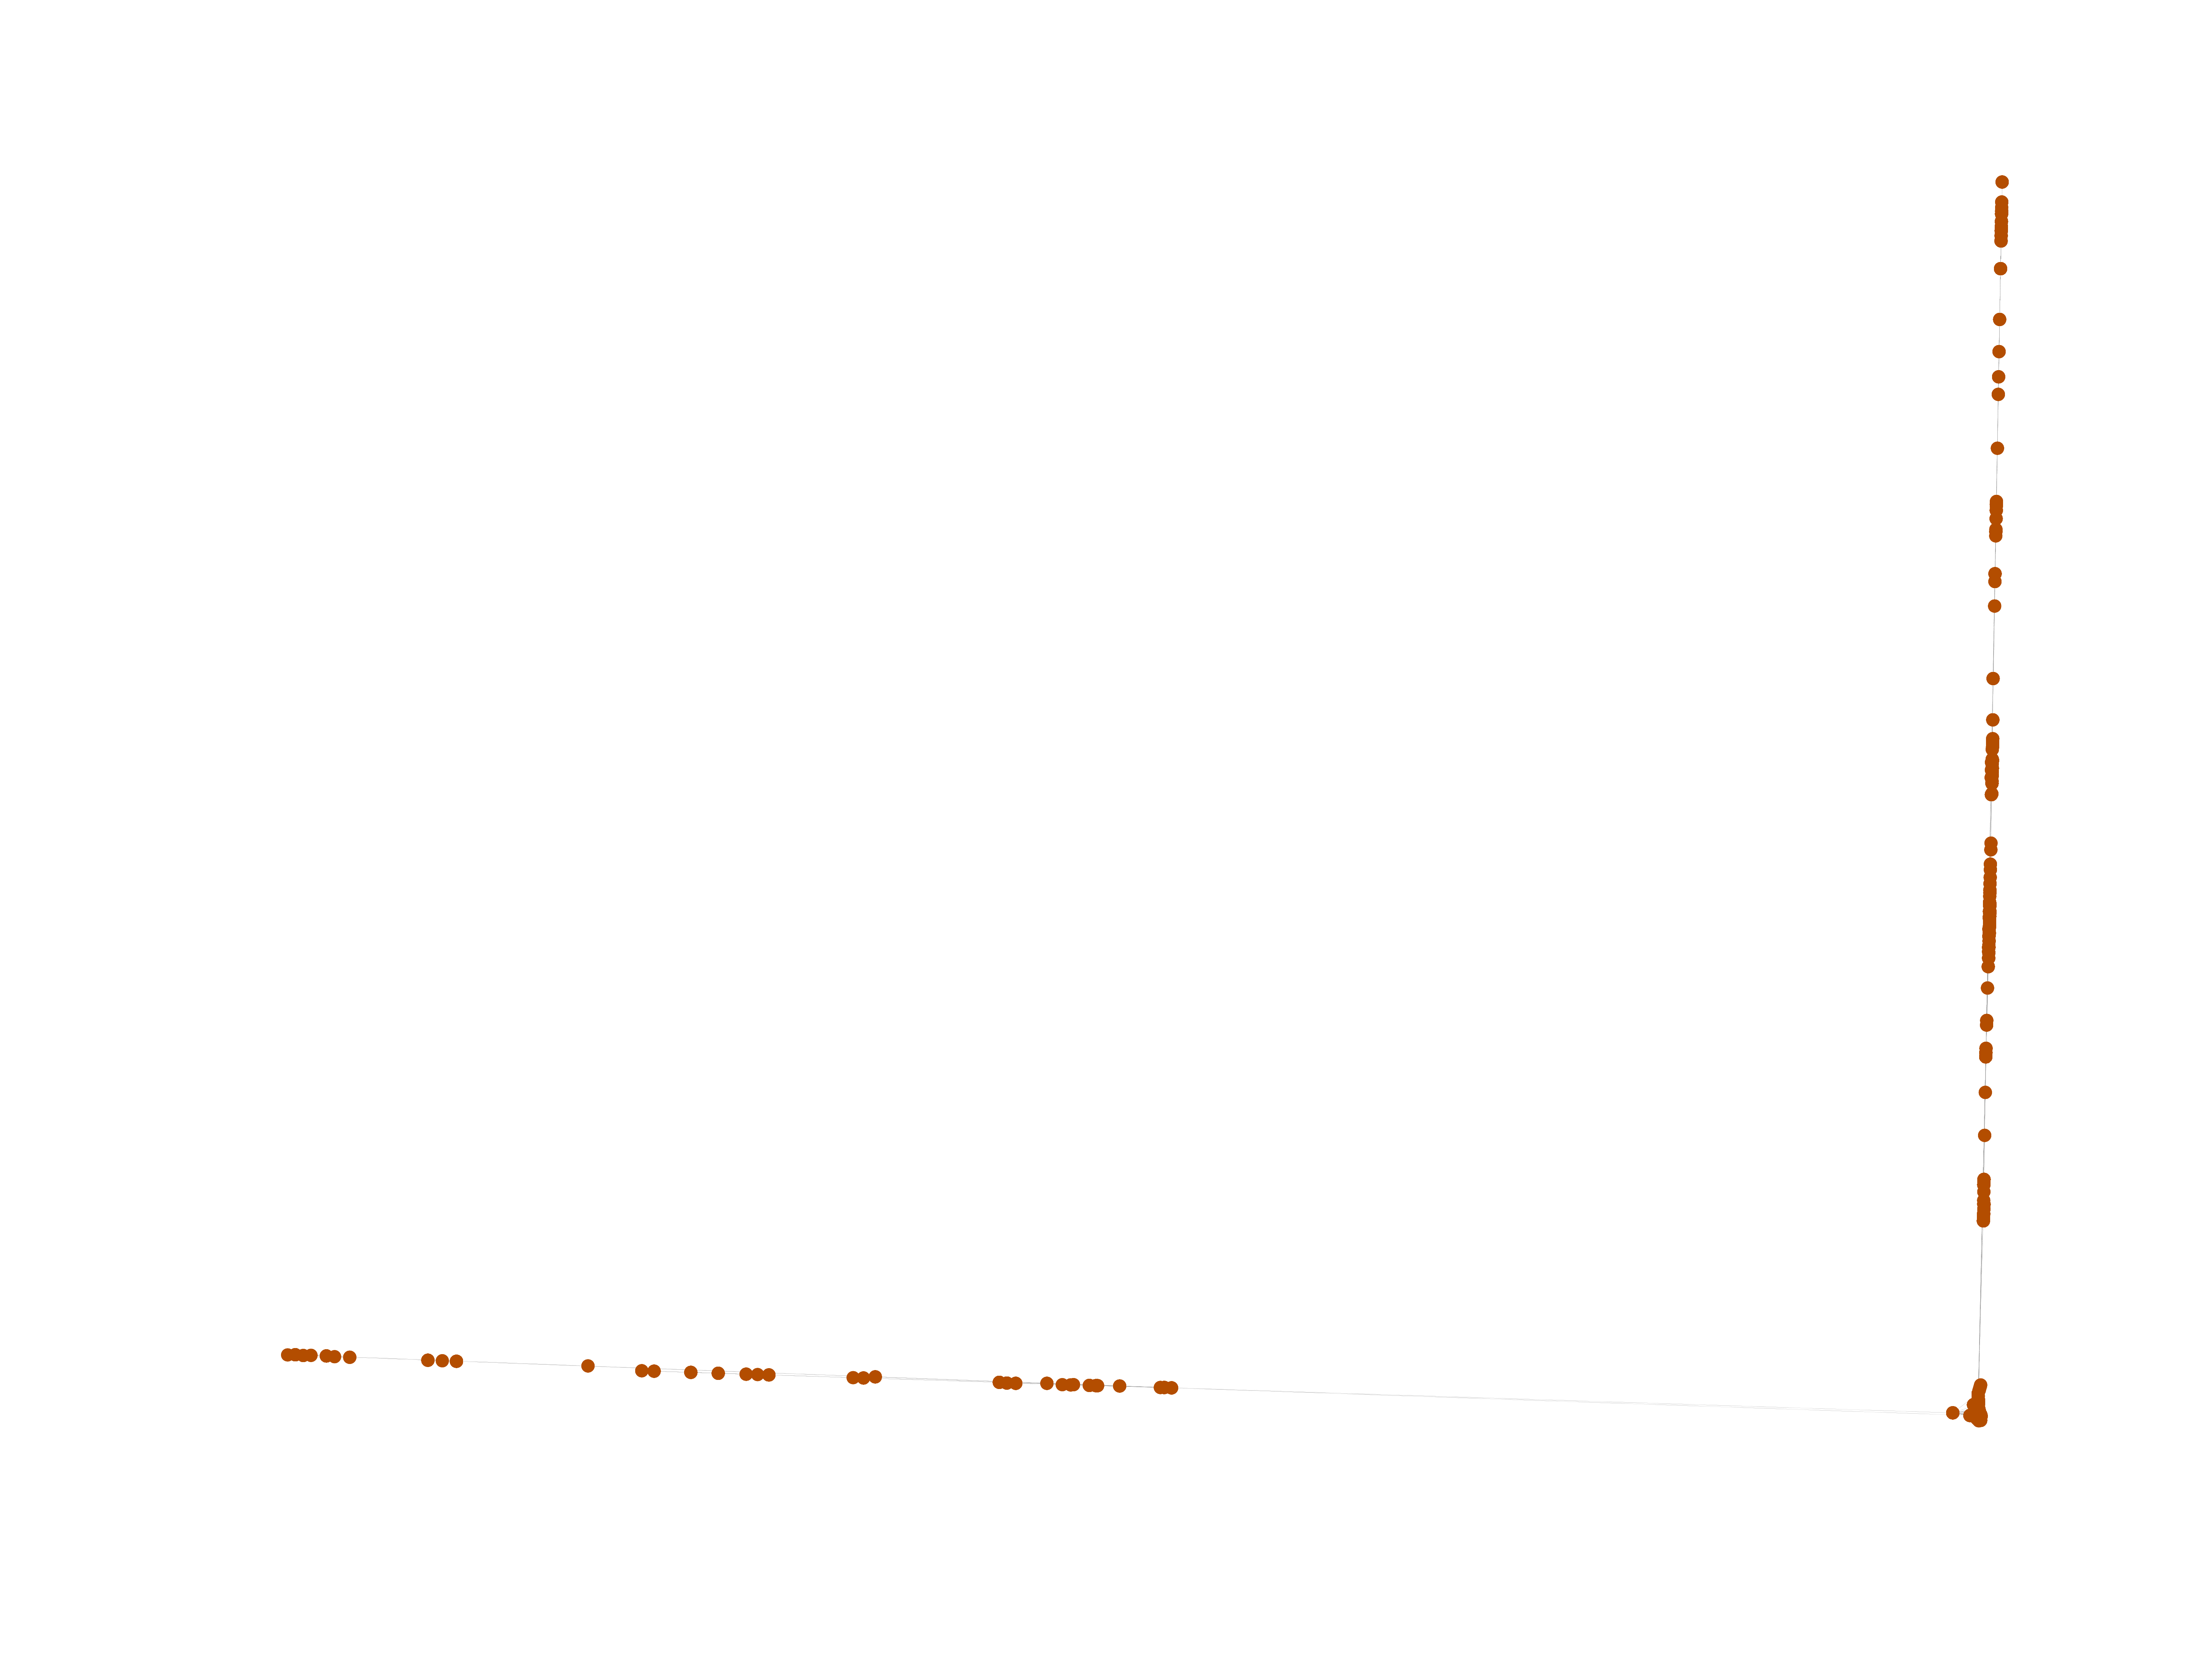
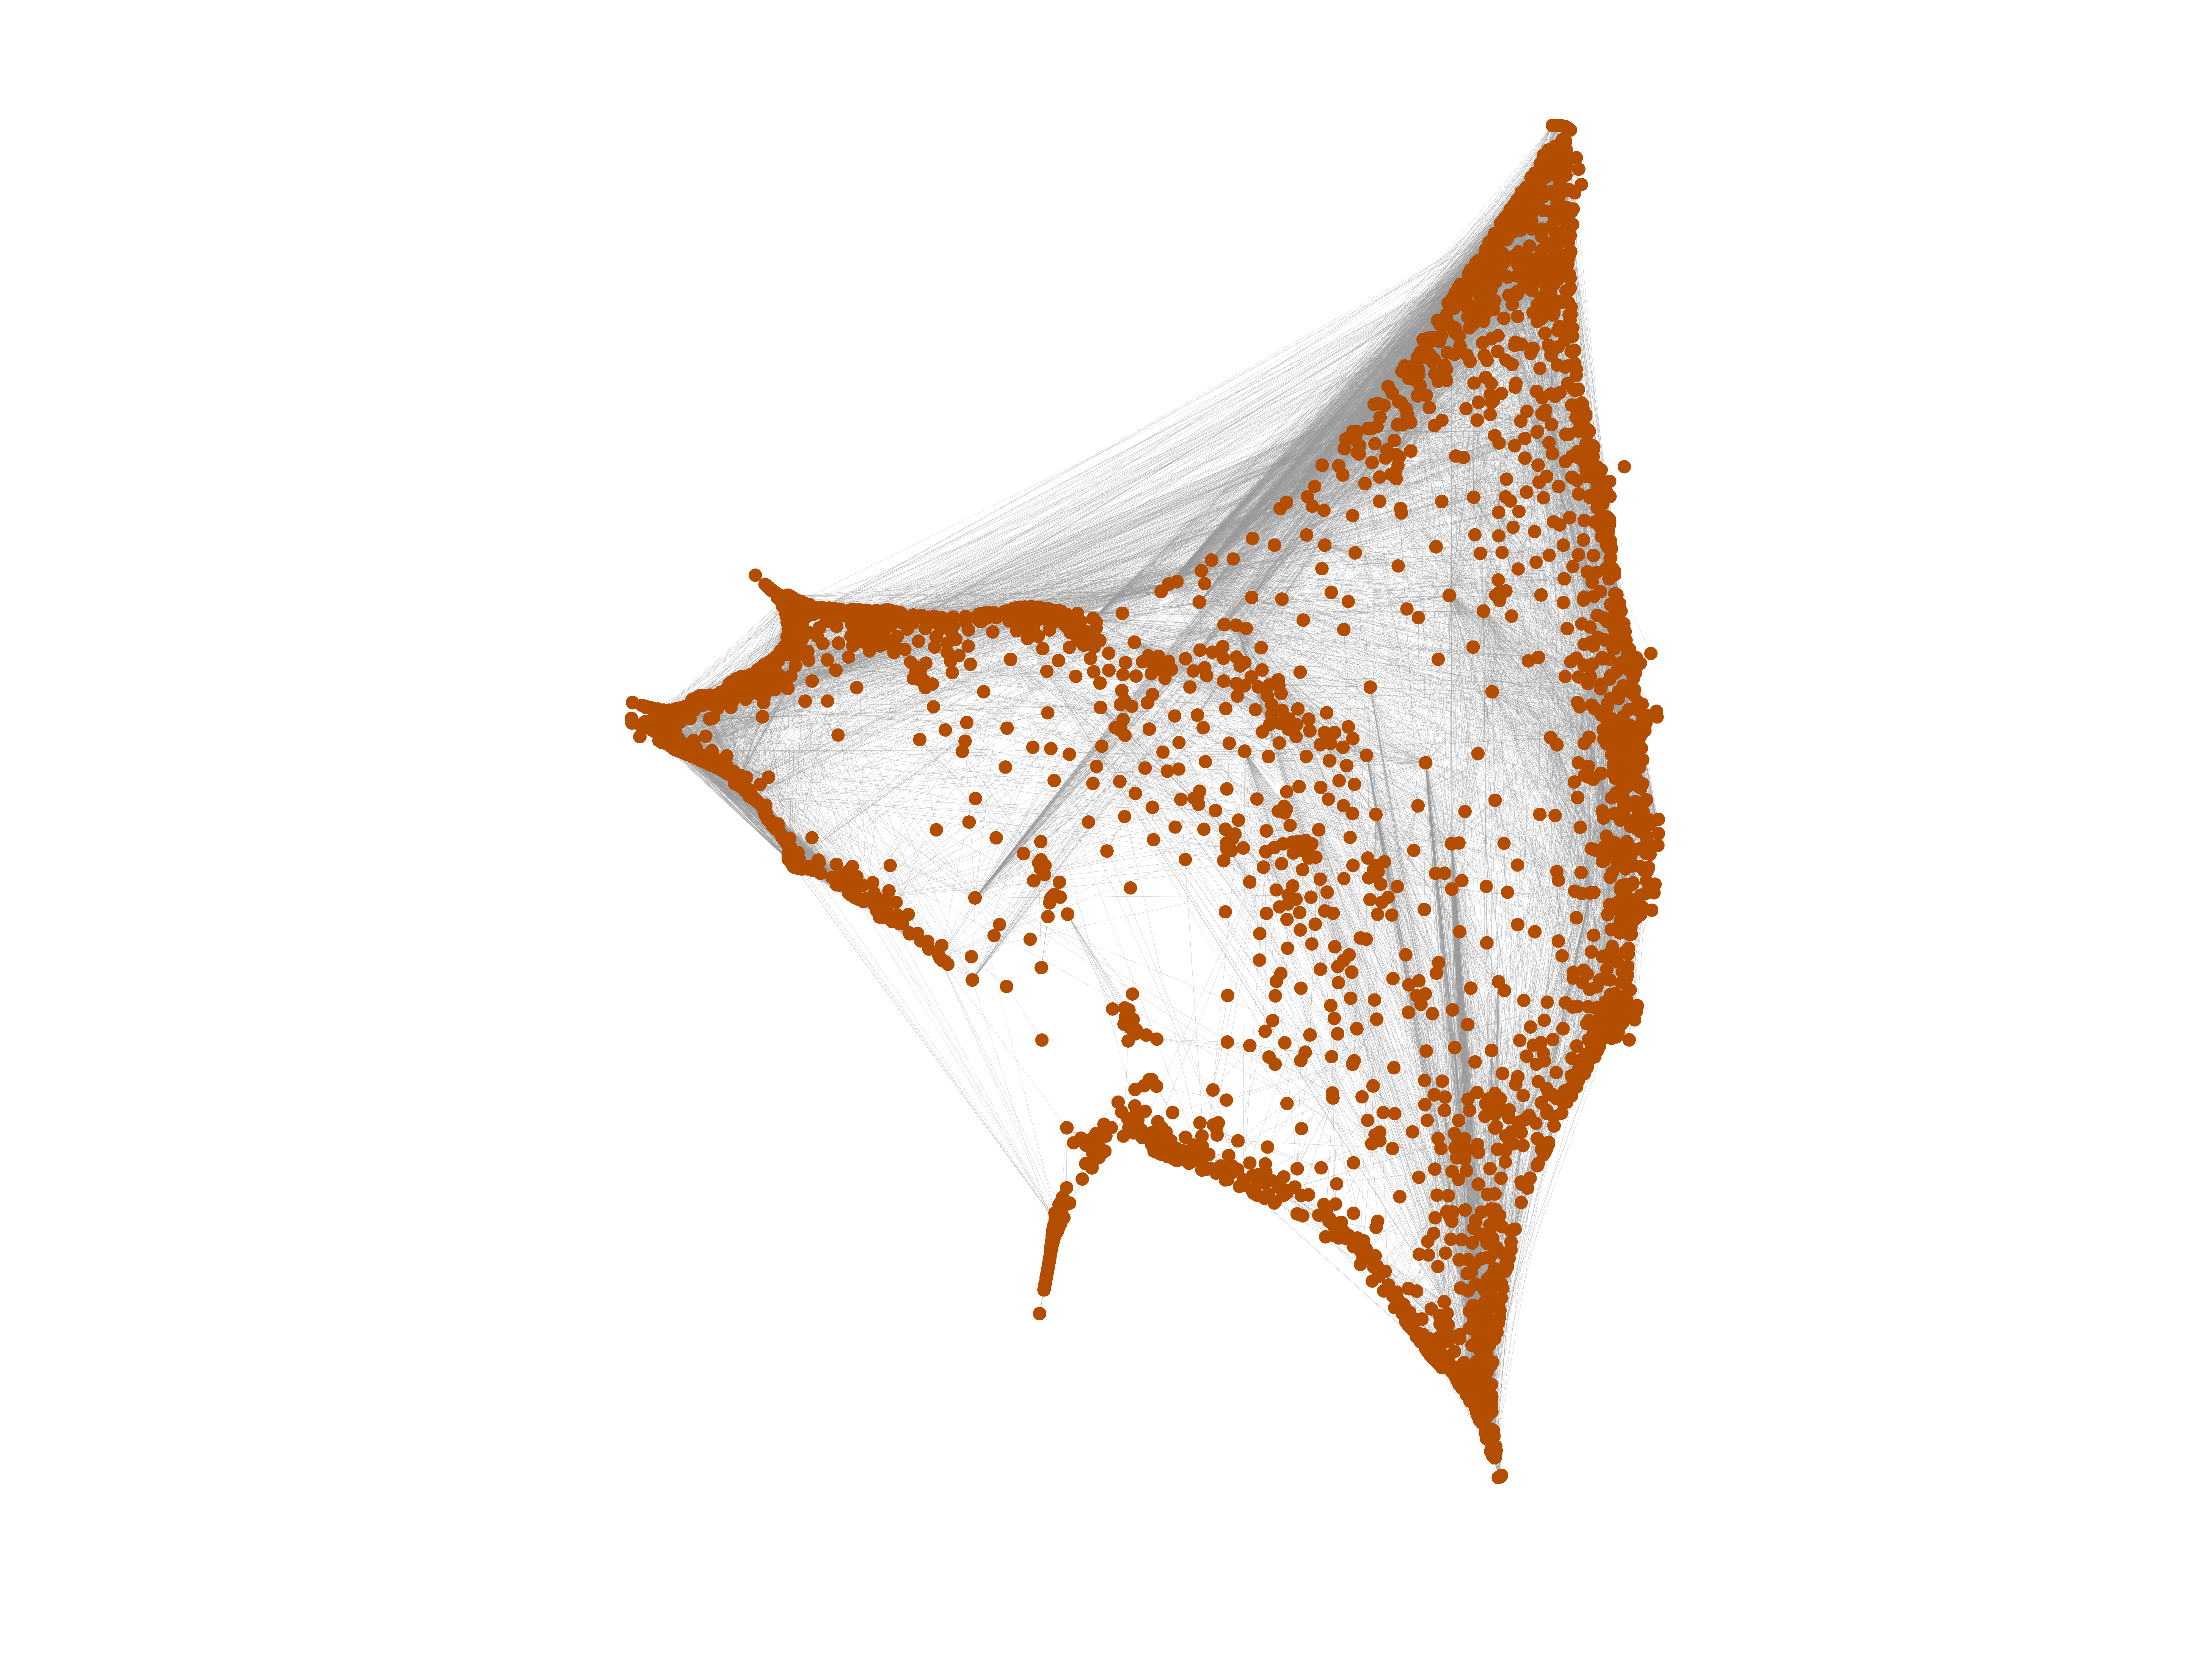
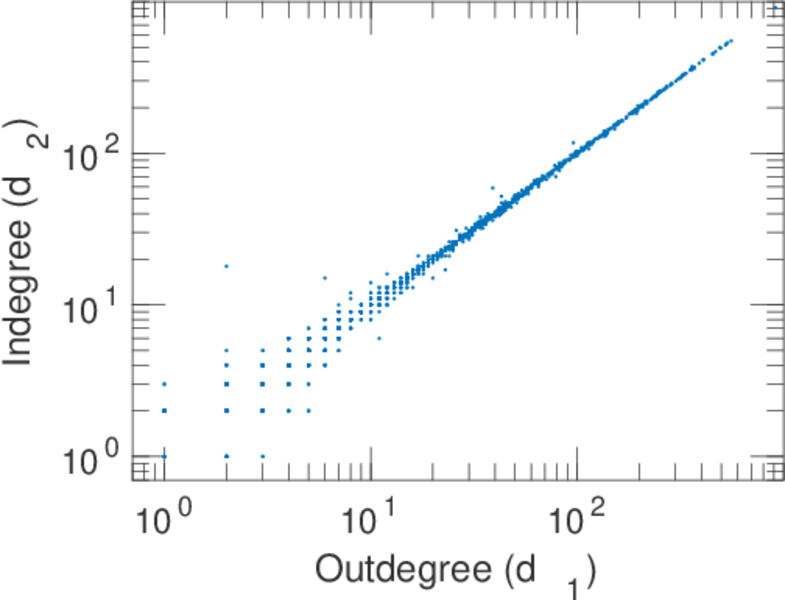
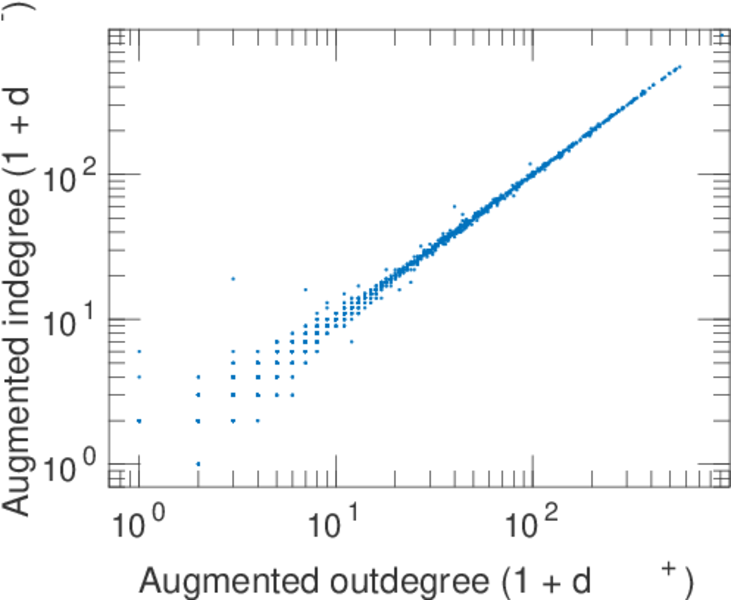
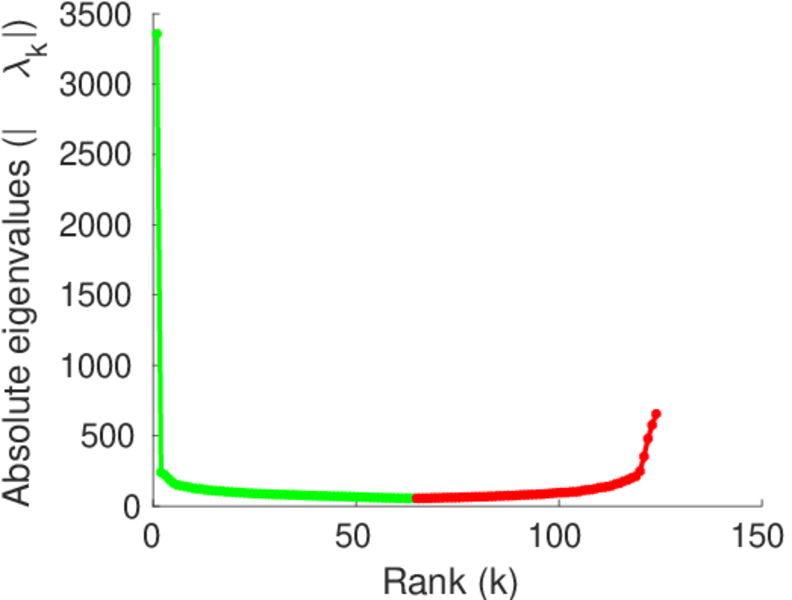
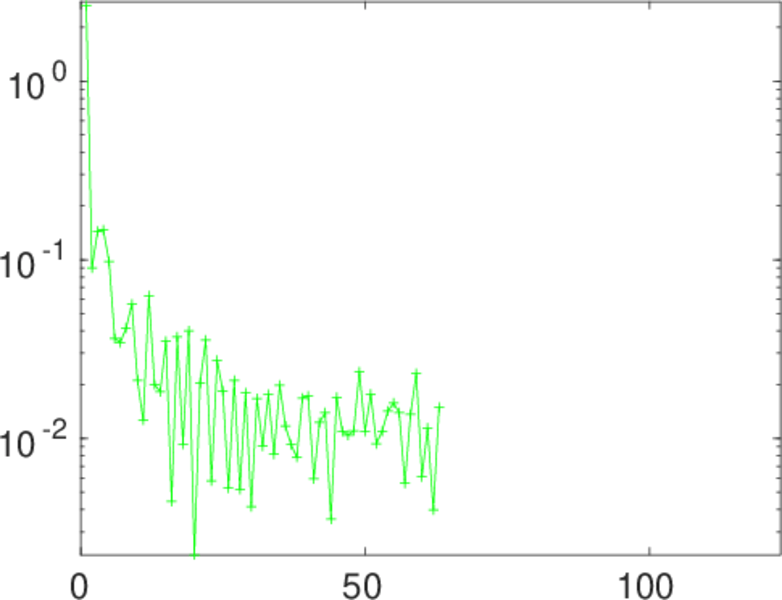
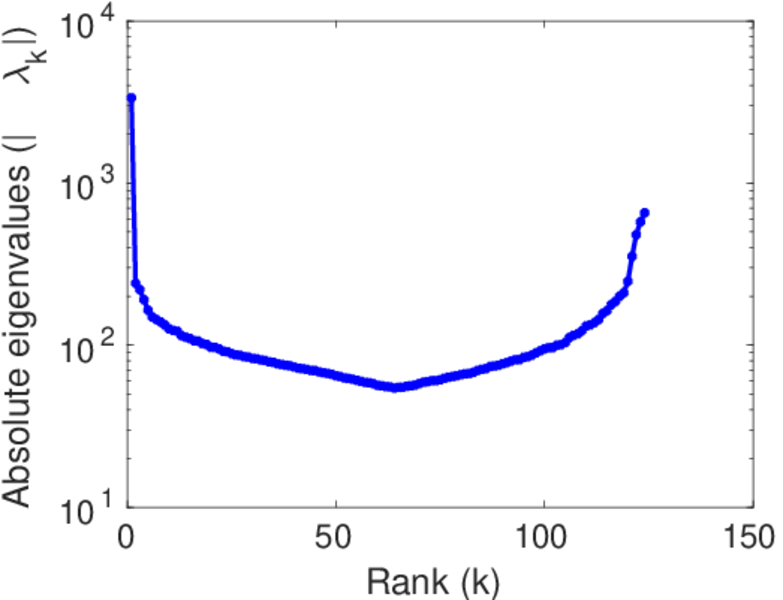
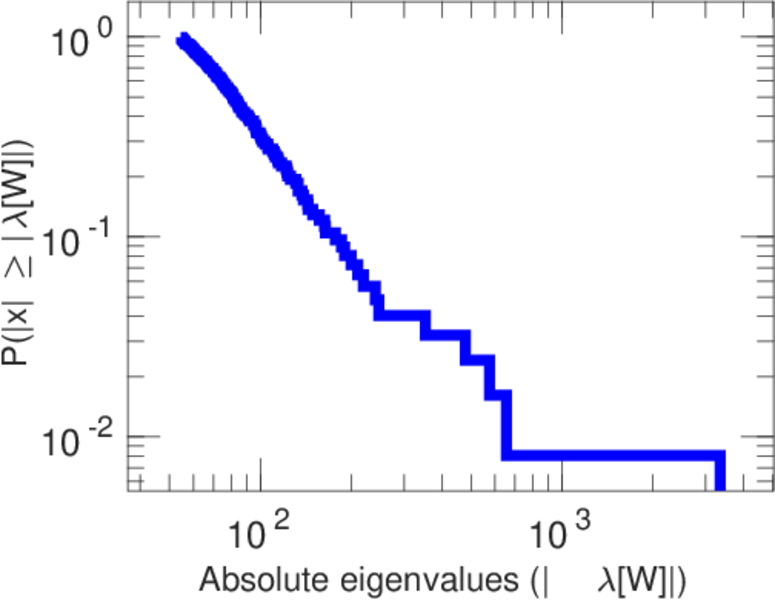
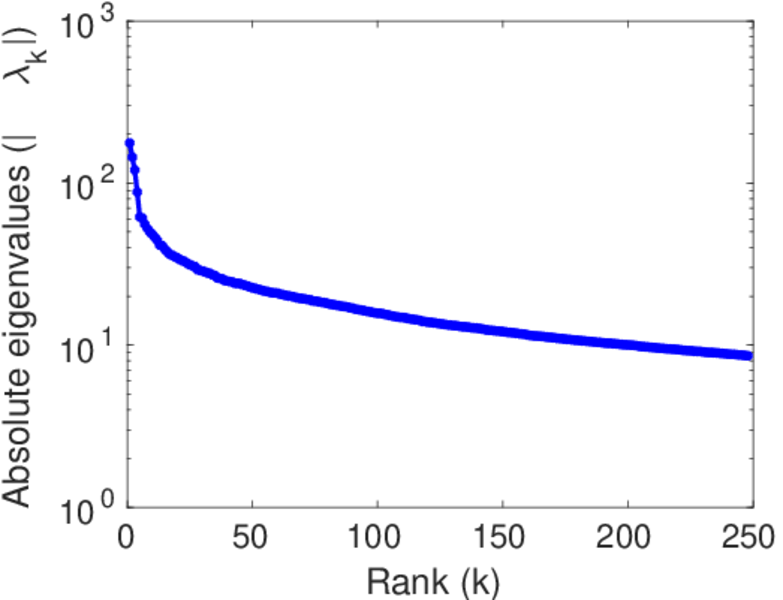
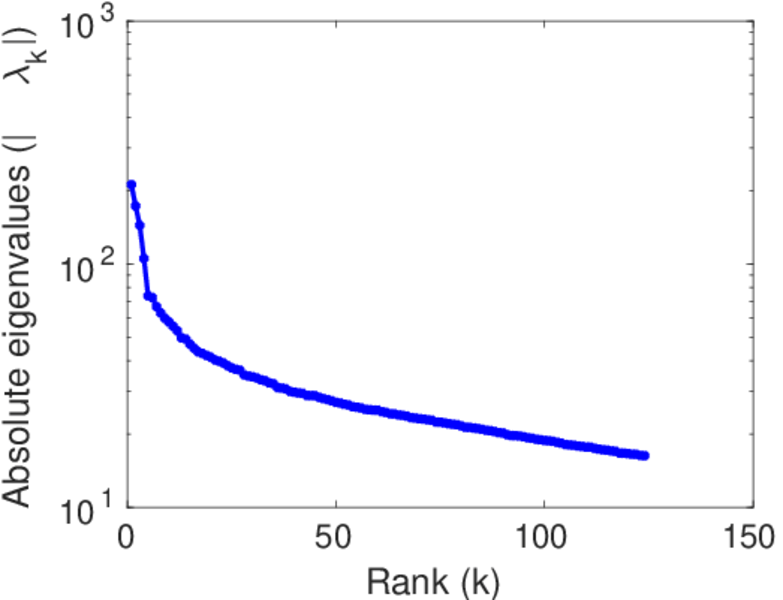
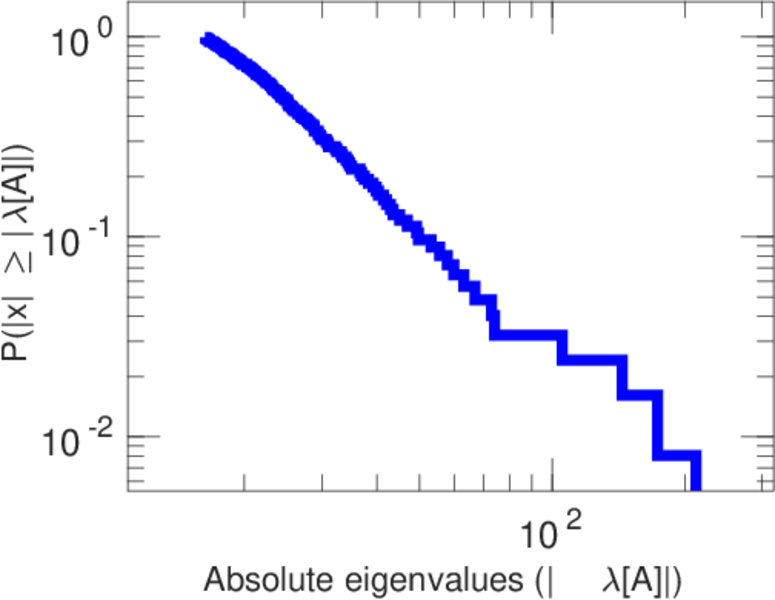
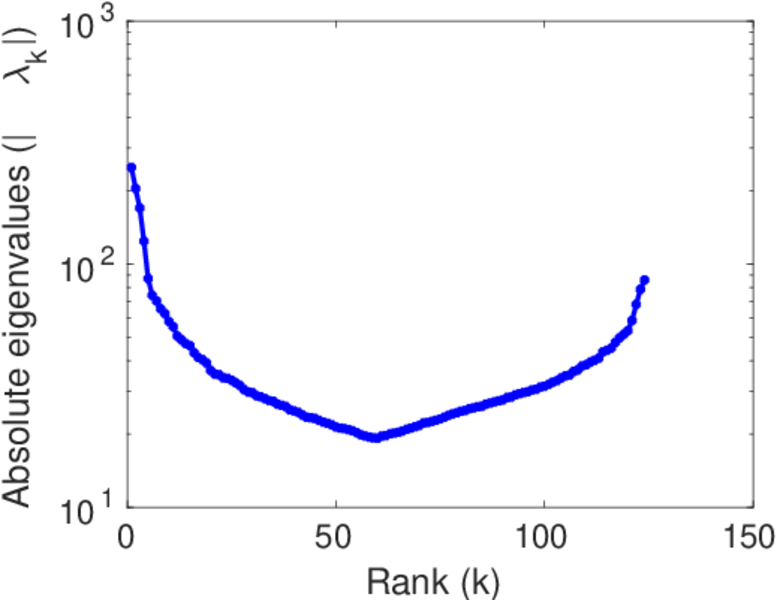
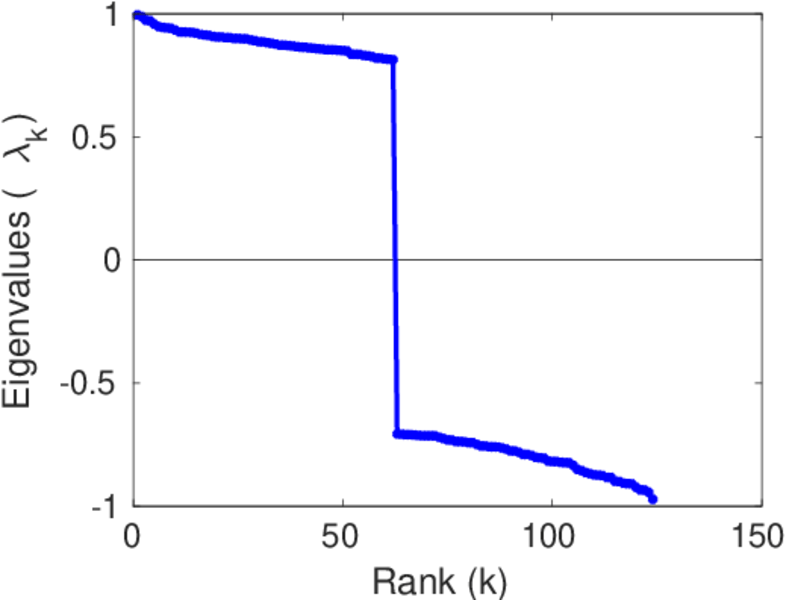
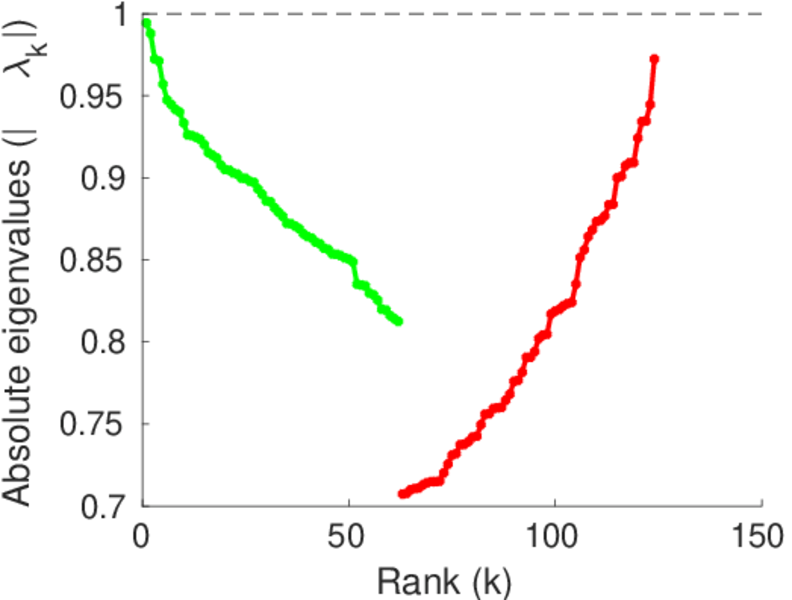
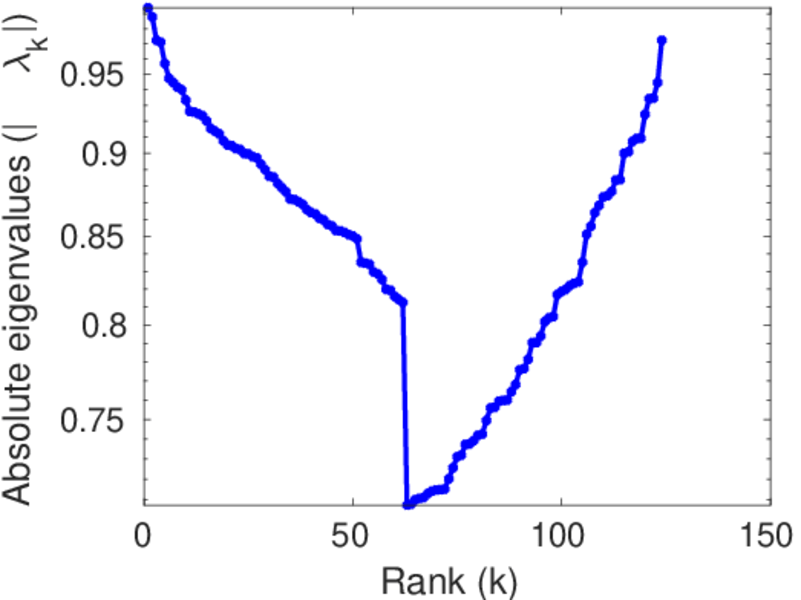
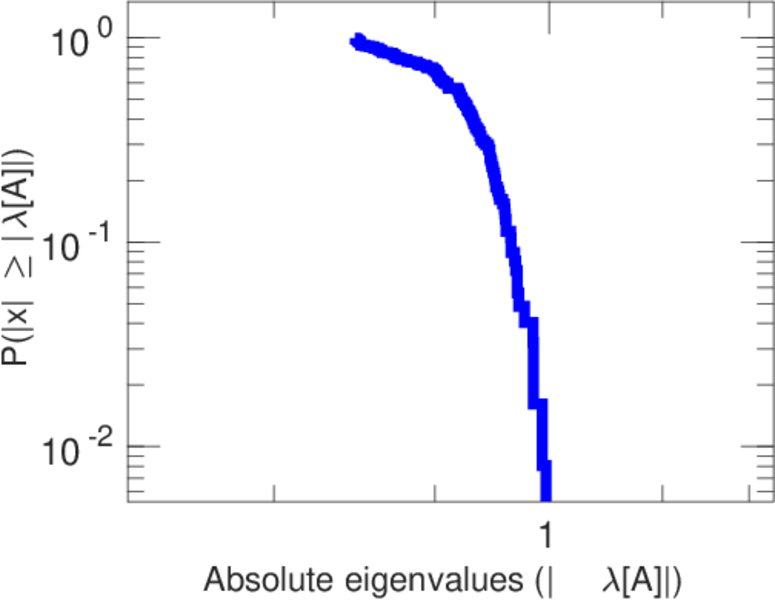
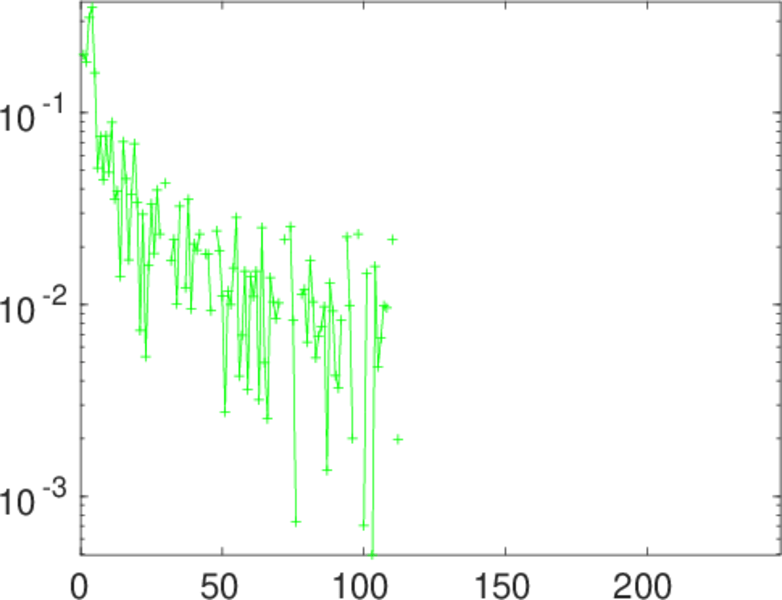
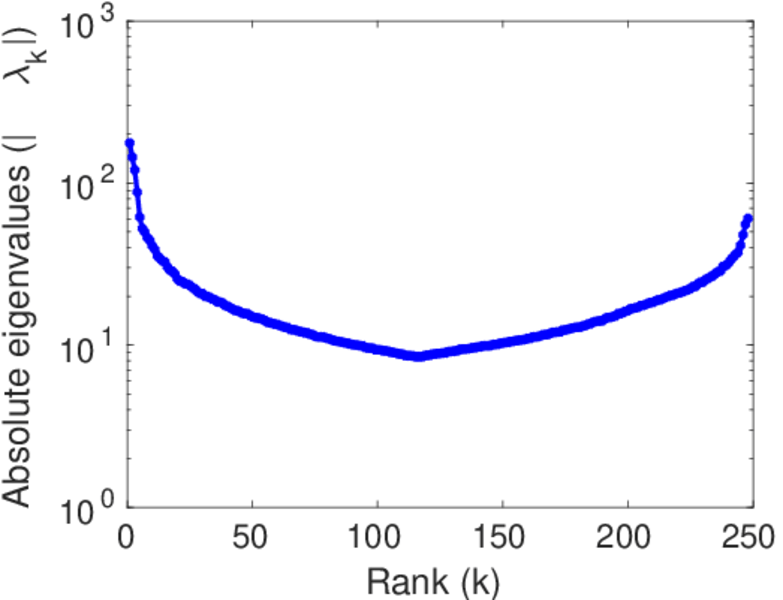
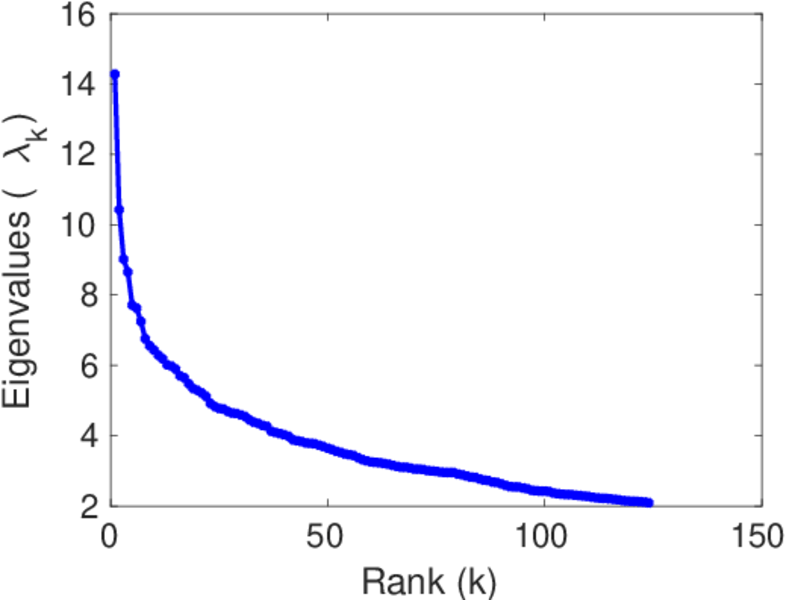
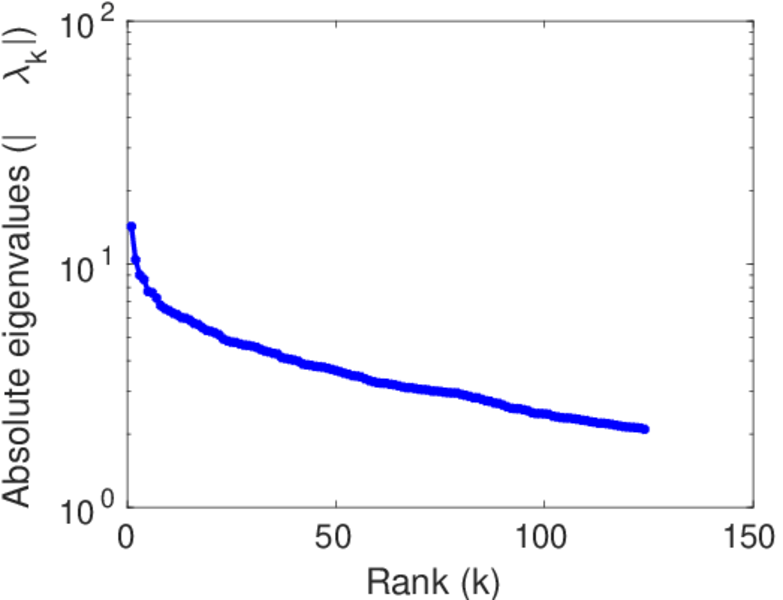
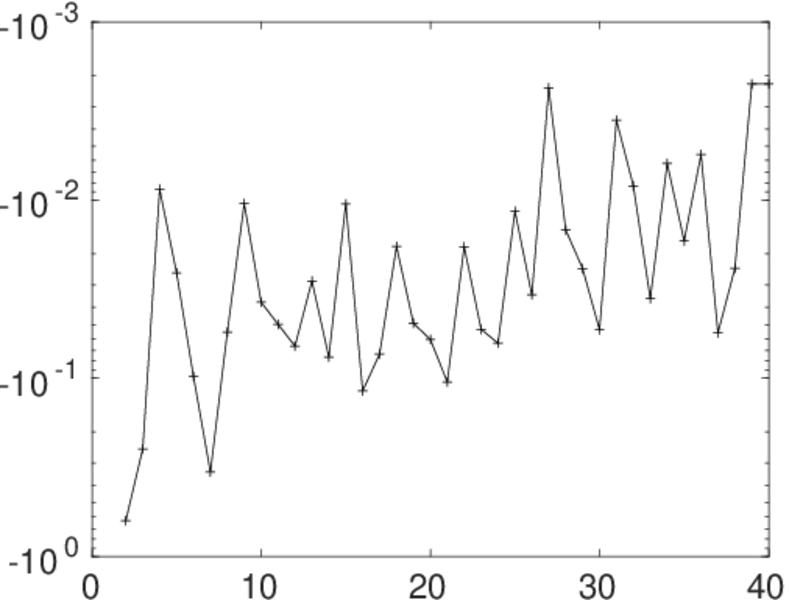
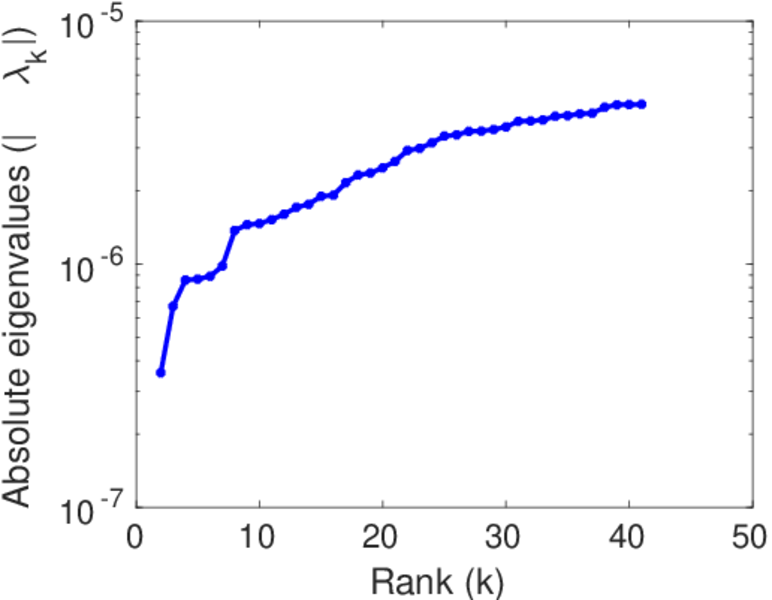
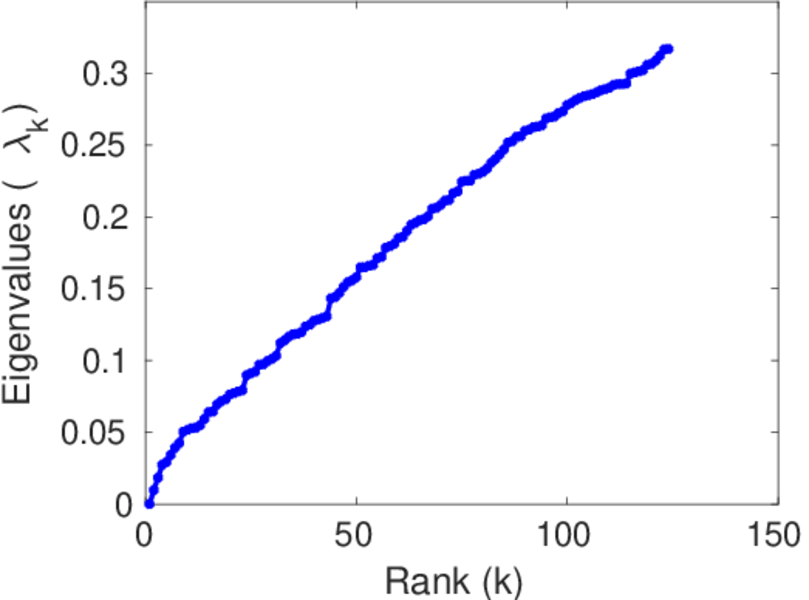
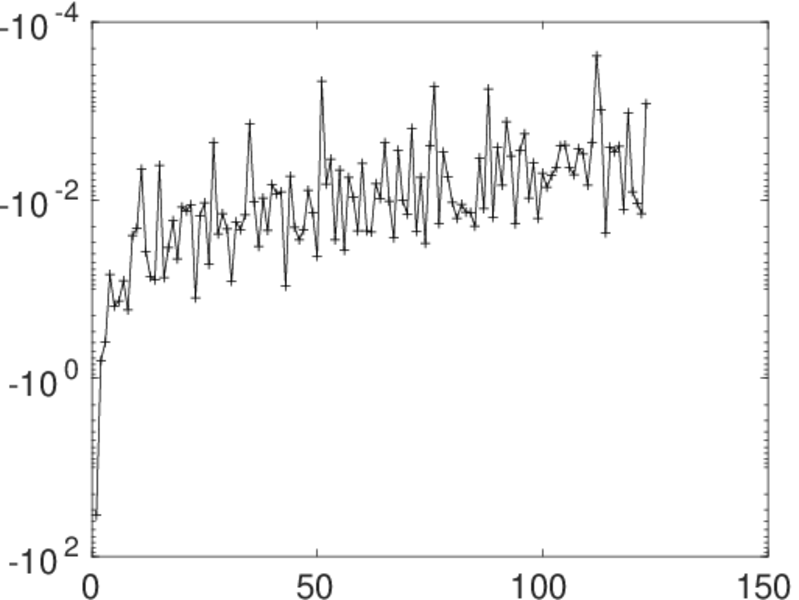
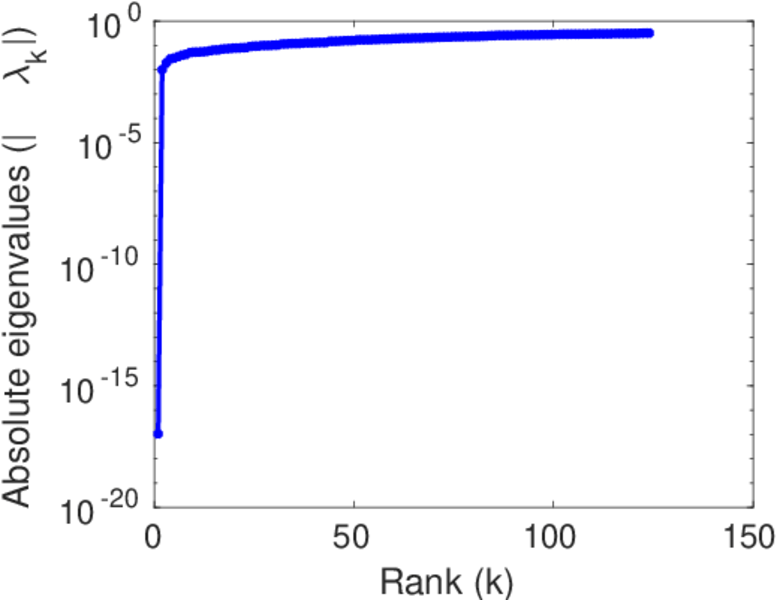
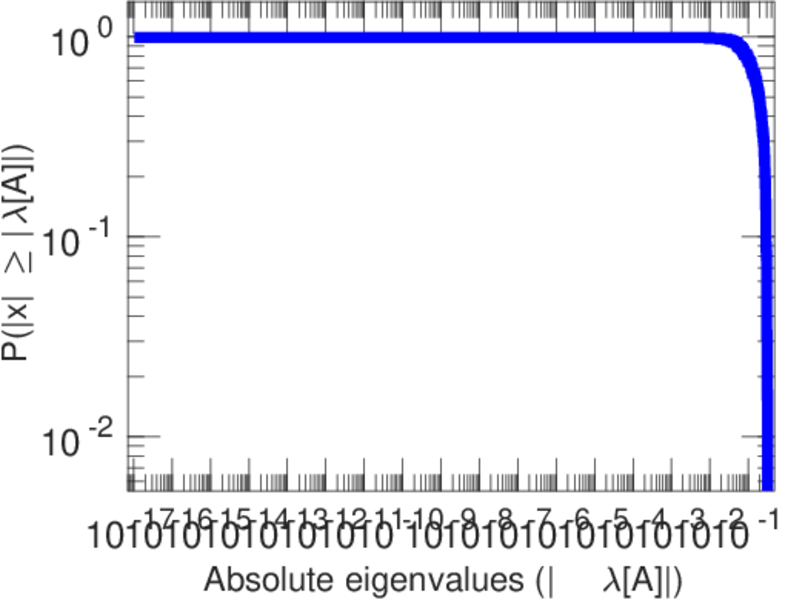
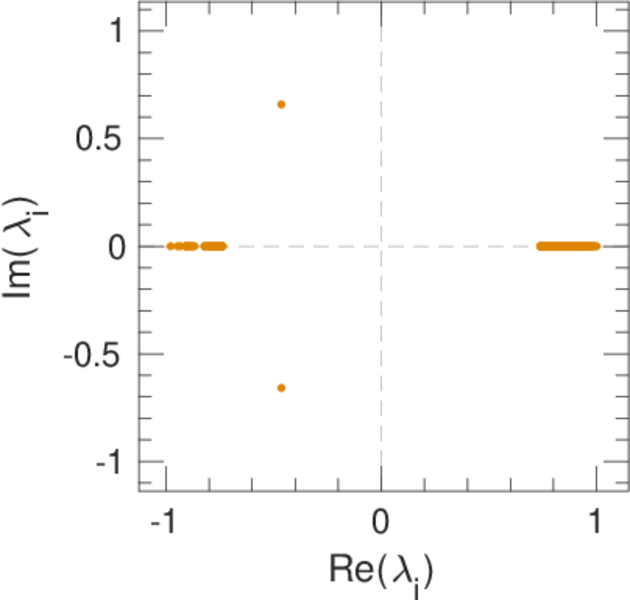
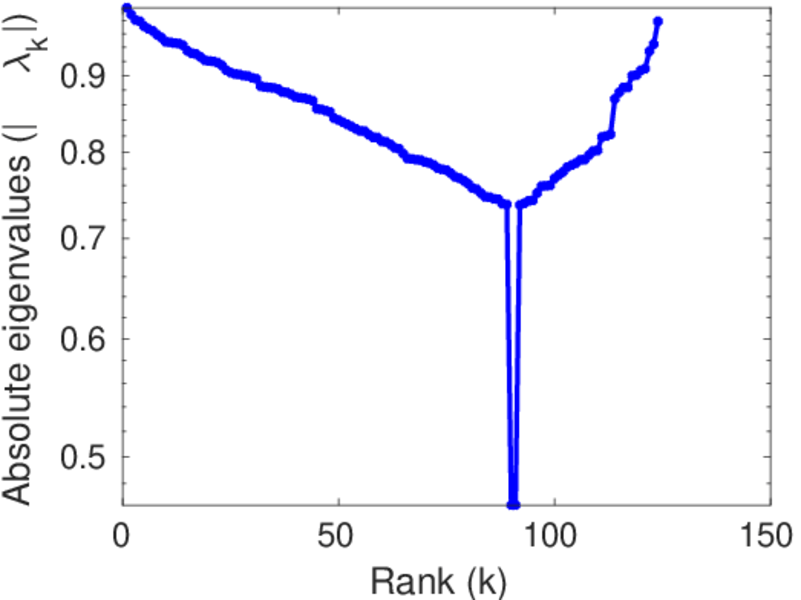
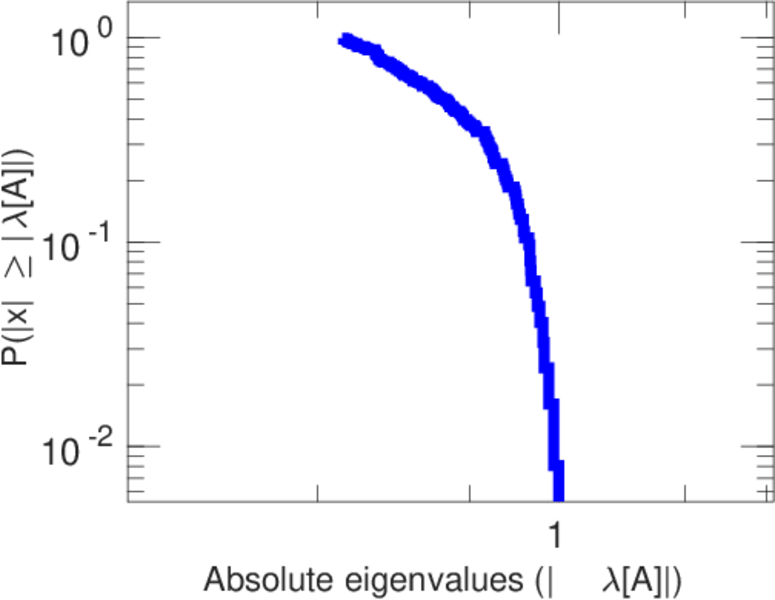
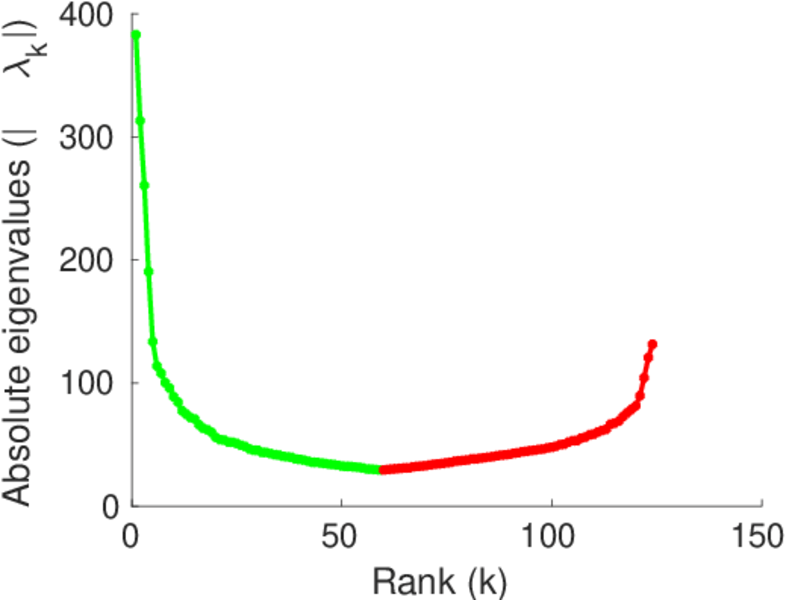
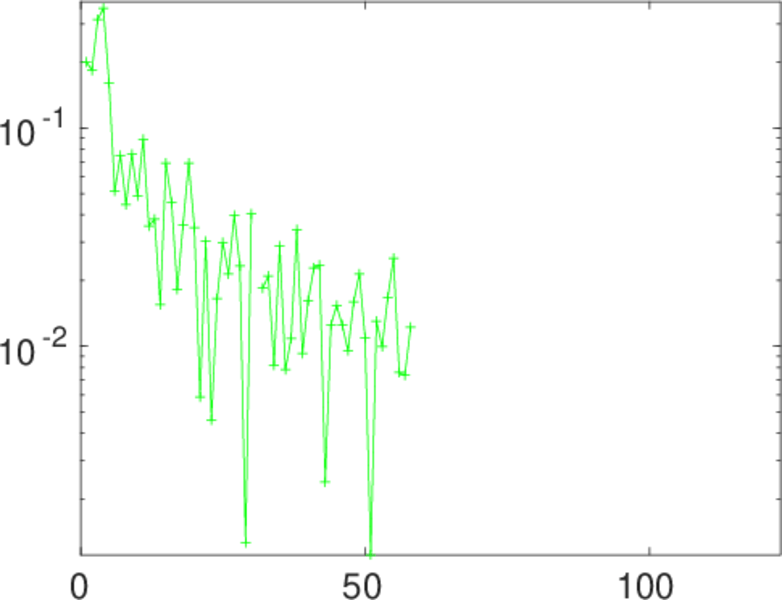
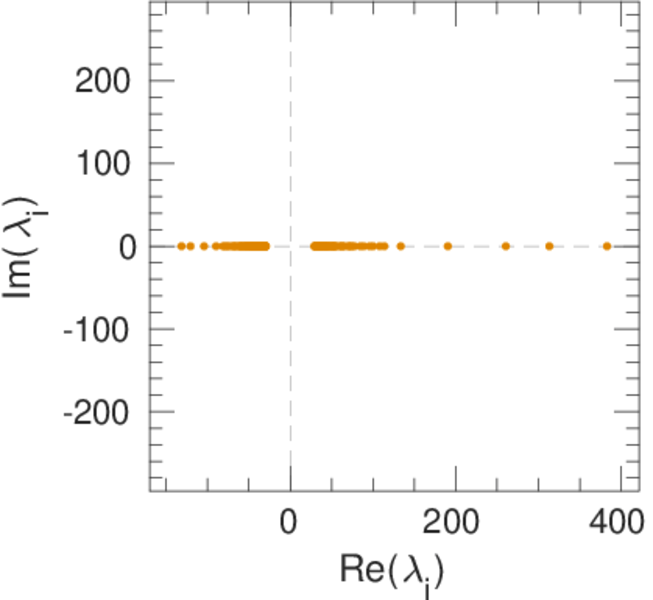
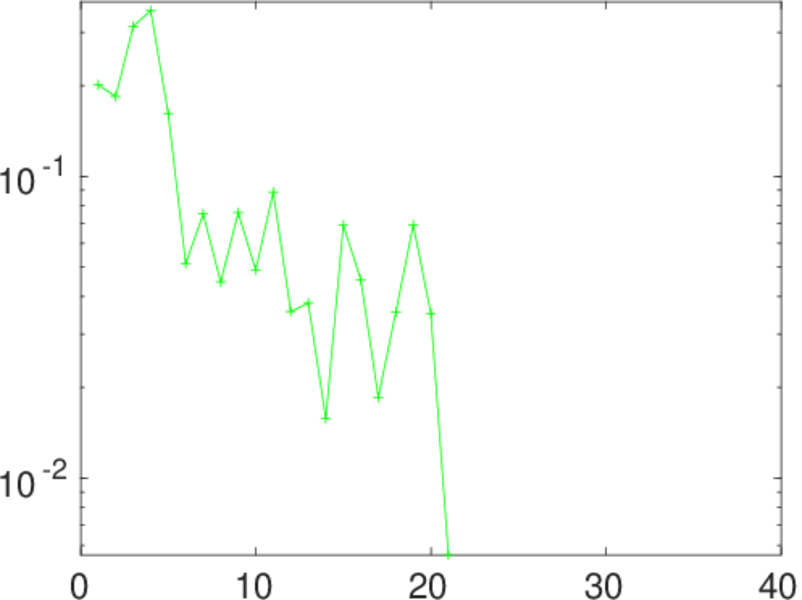
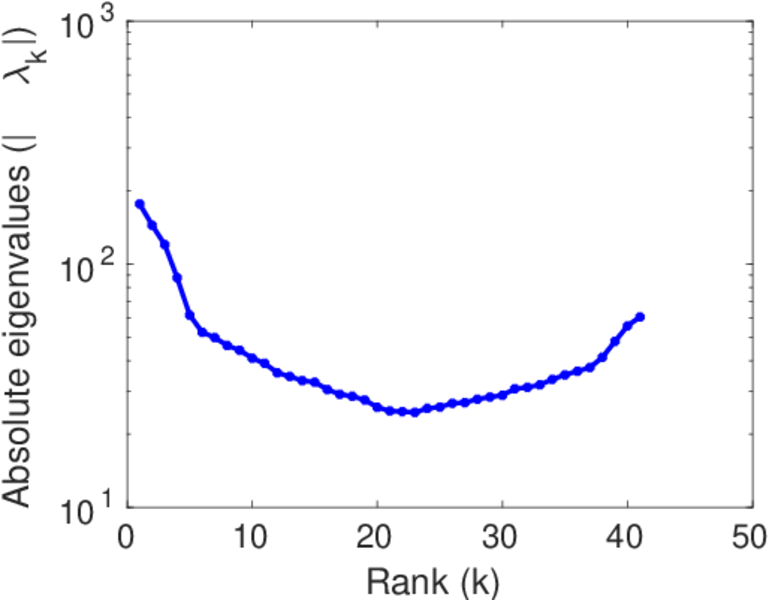
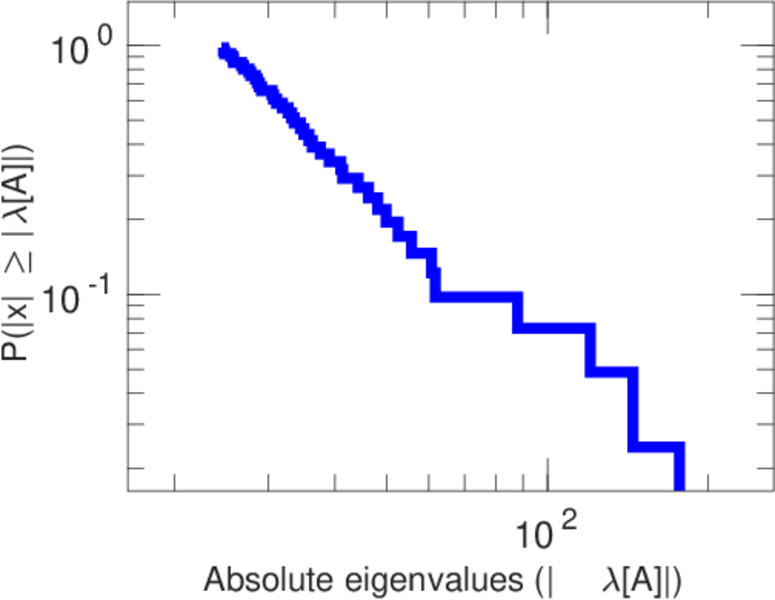
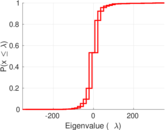
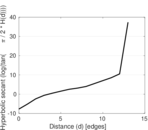
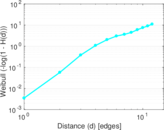
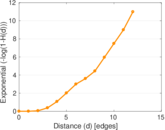
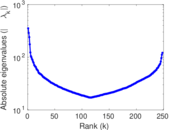
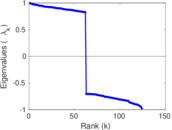
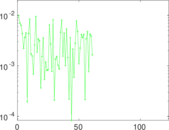
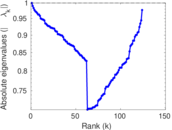
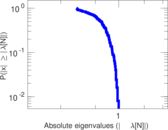
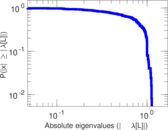
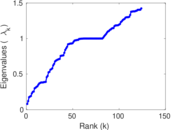
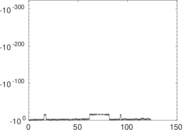
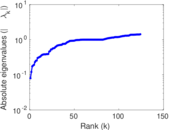
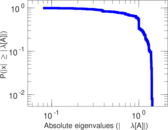
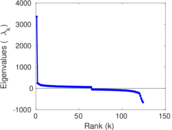
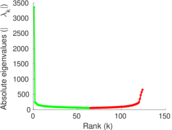
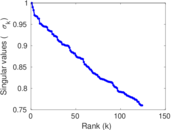
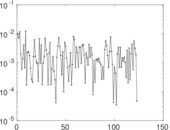
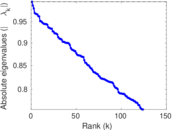
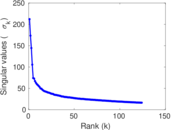
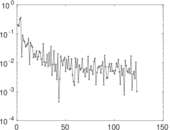
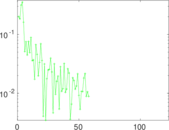
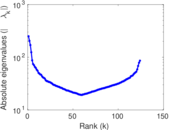
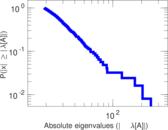
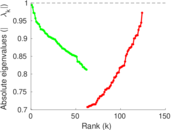
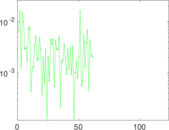
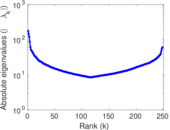
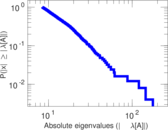
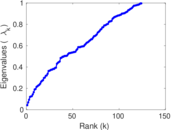
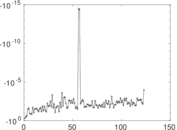
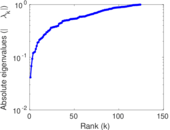
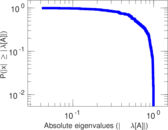
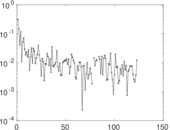
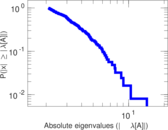
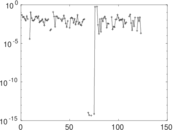
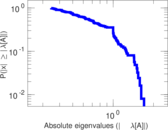
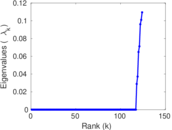
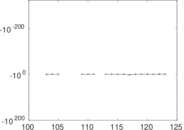
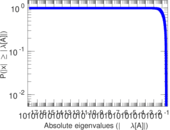
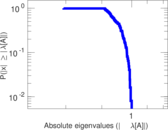
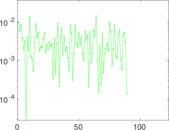
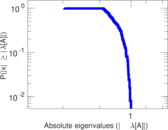
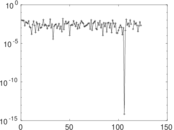
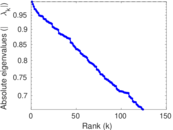
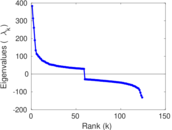
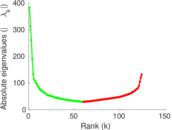
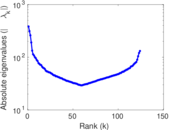
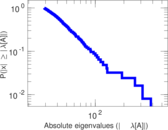
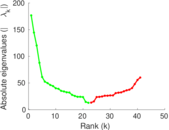
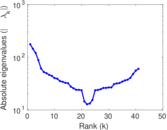
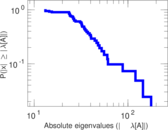
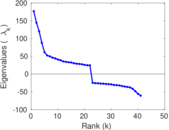
Plots
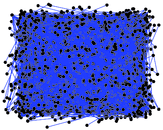


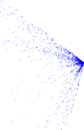
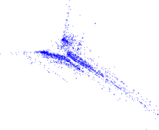
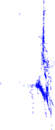


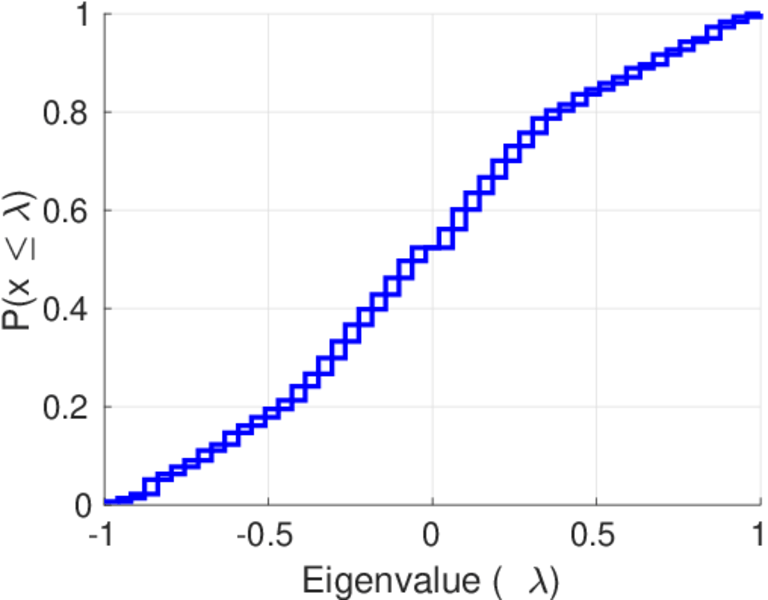
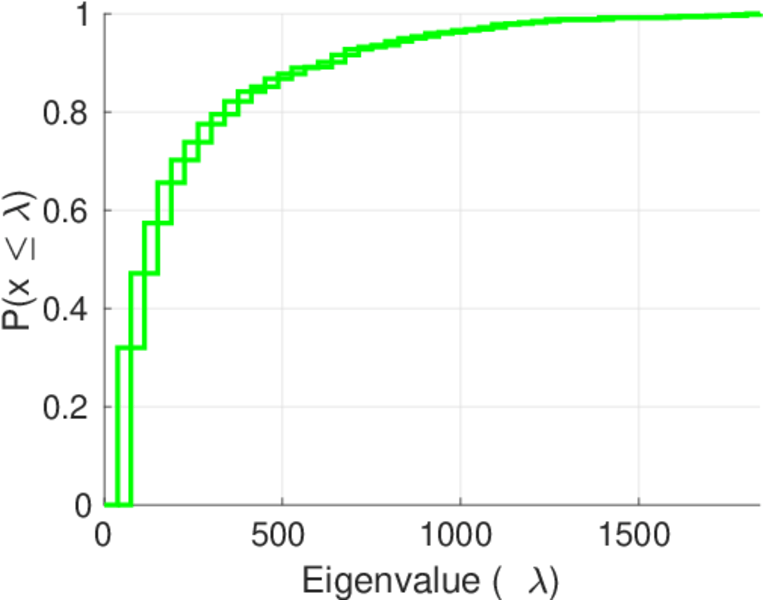
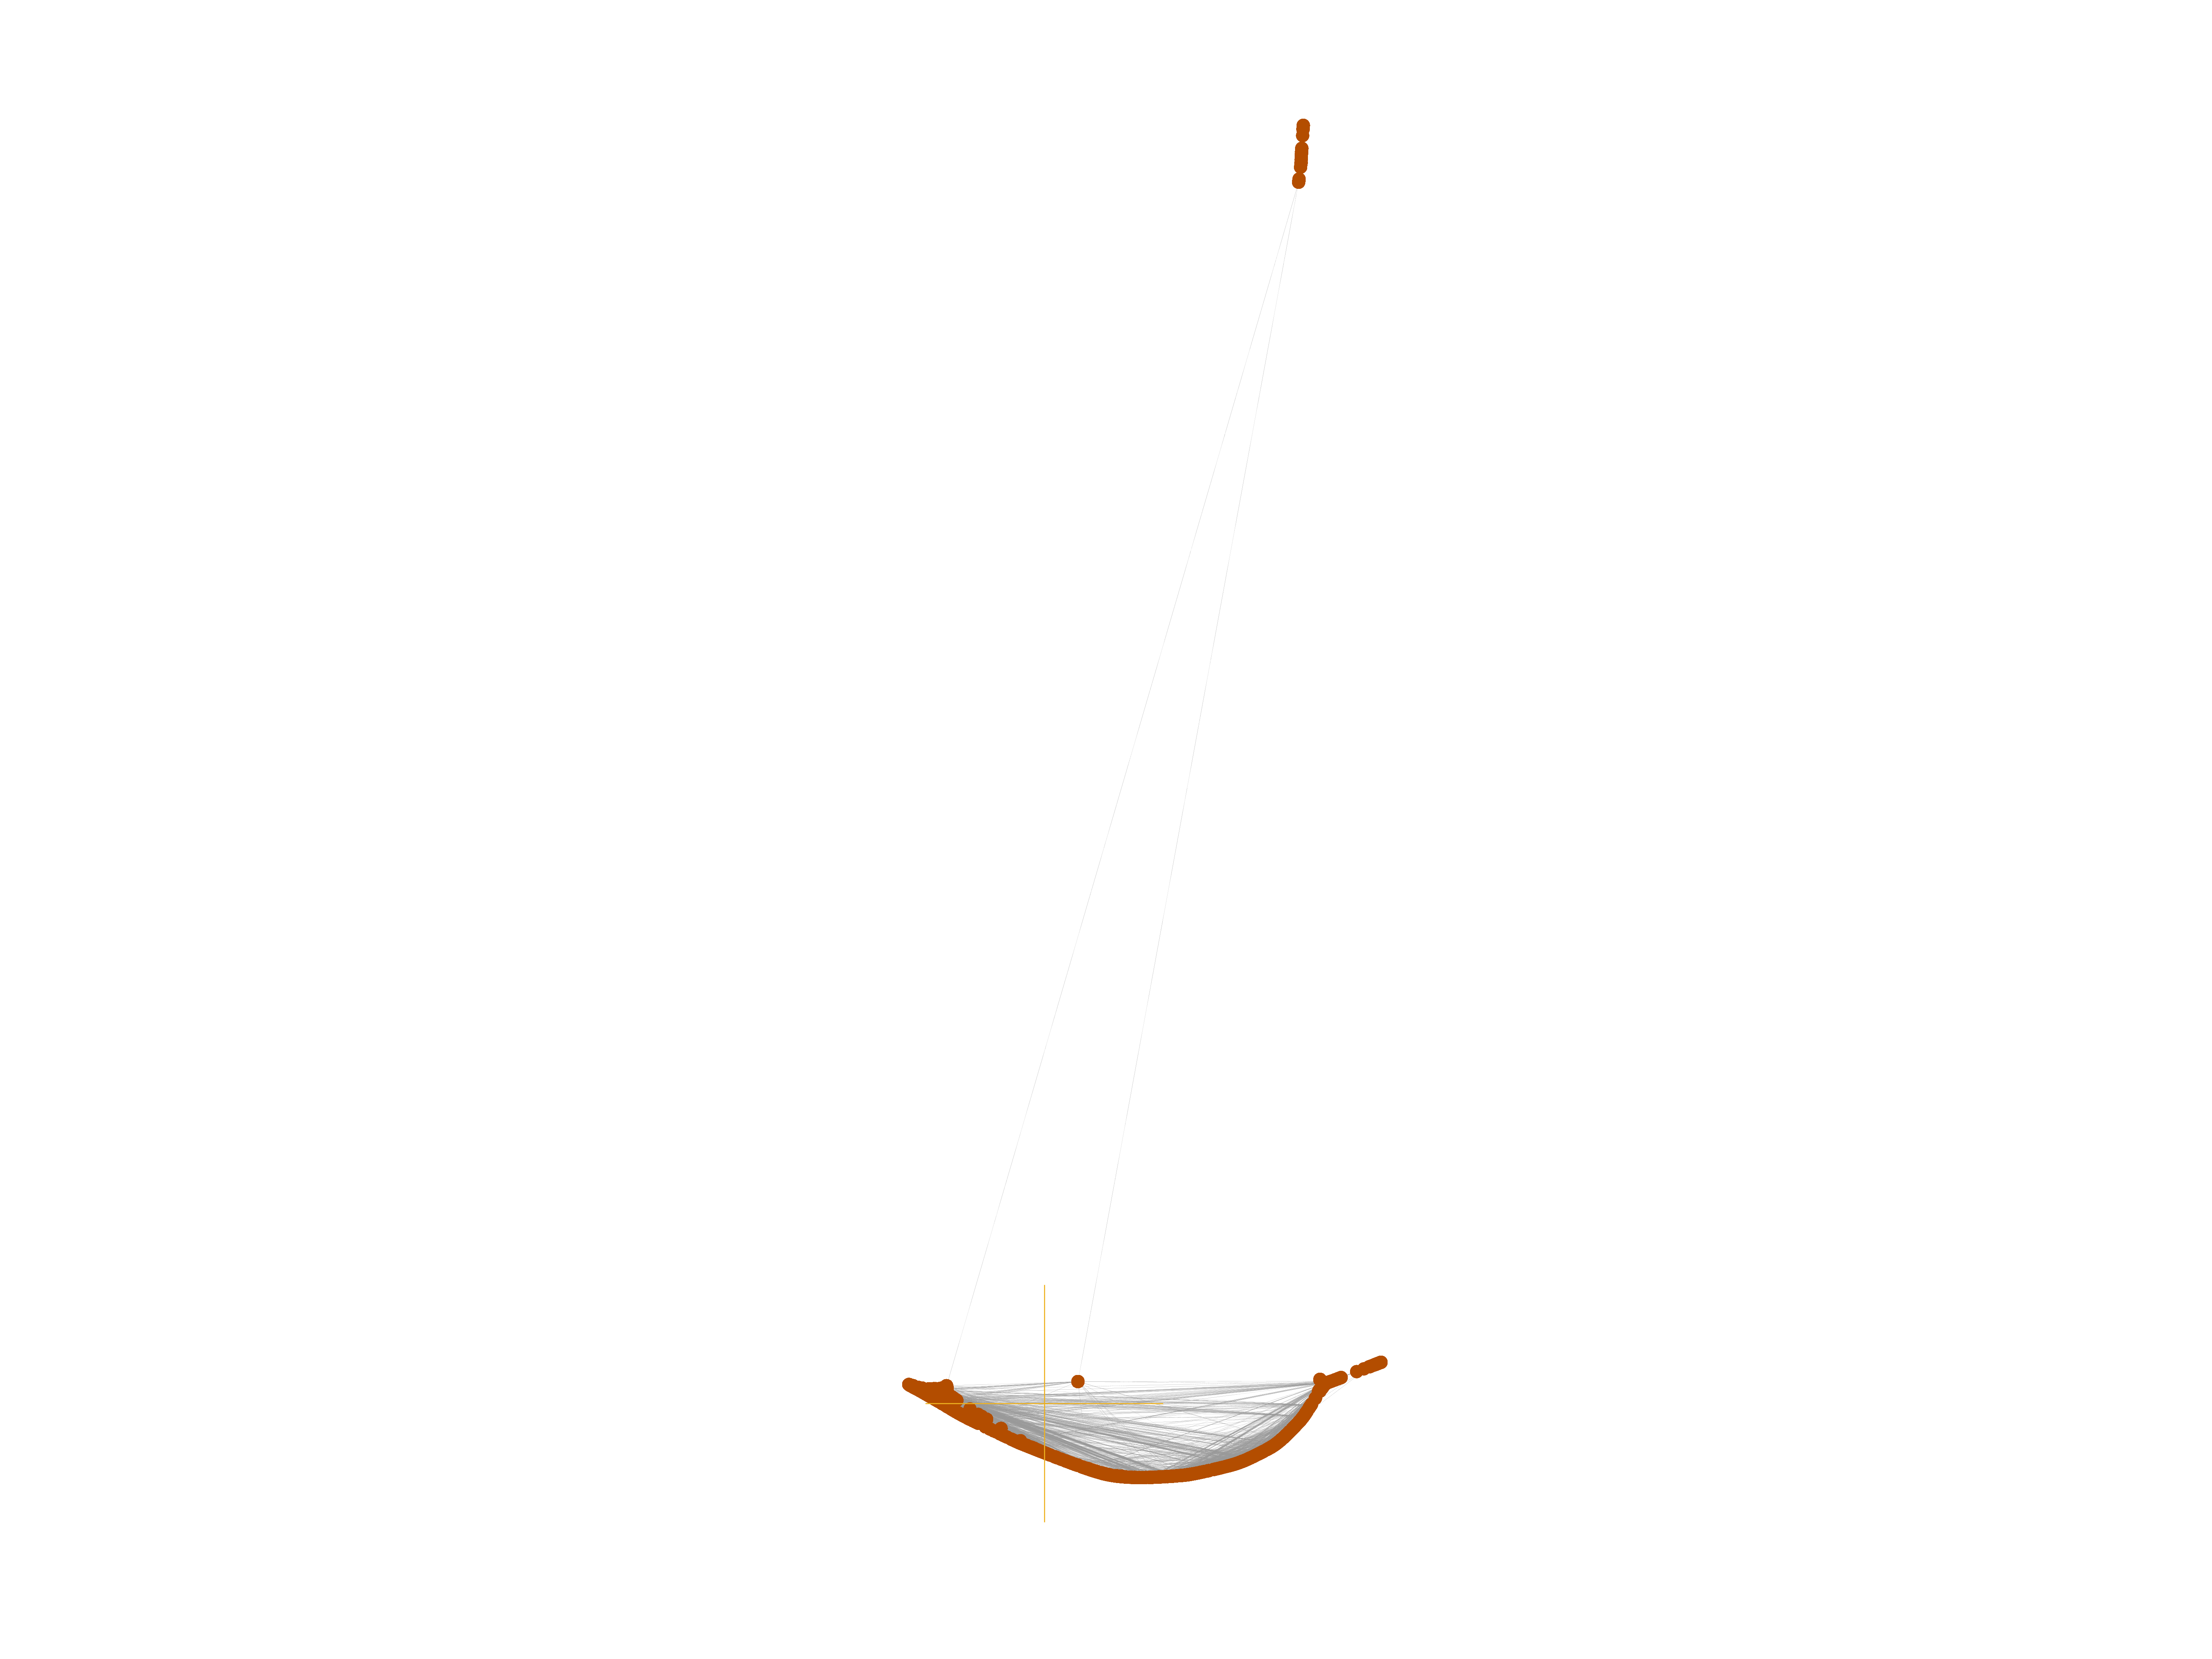
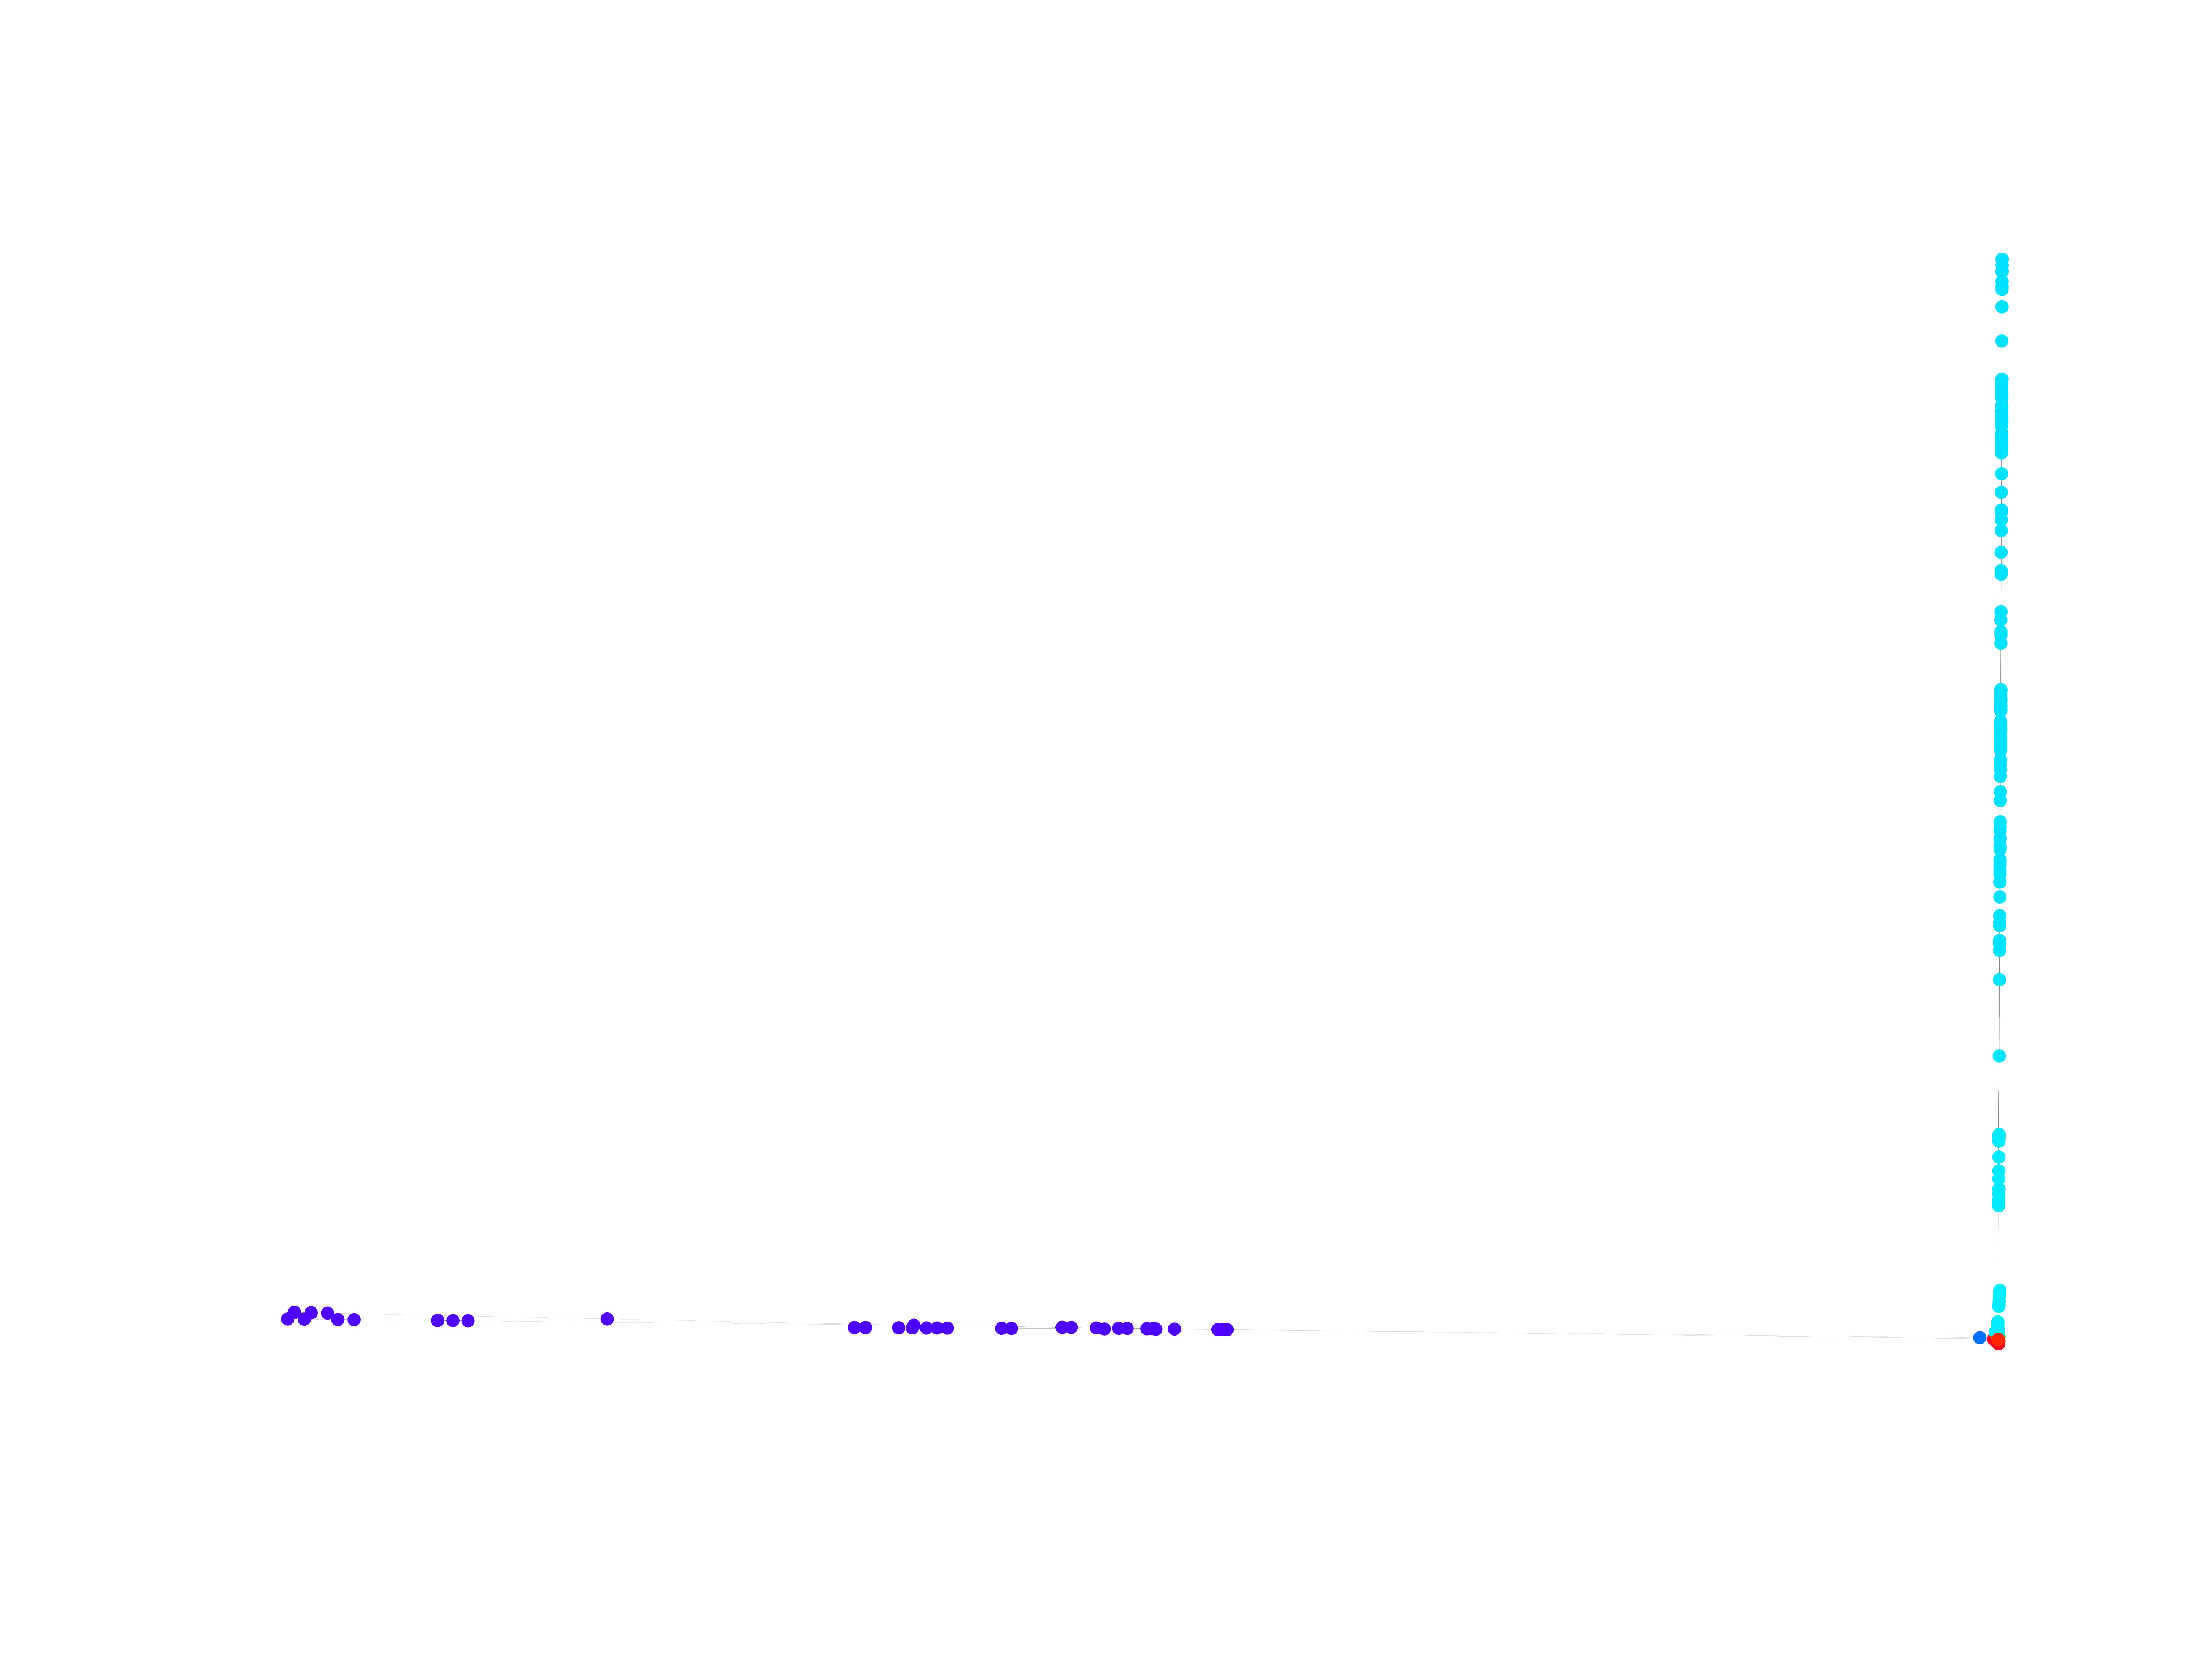
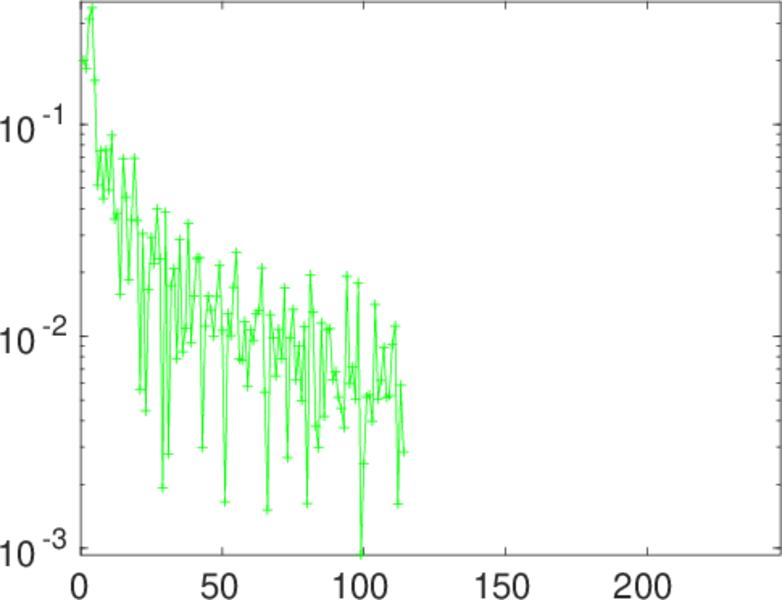
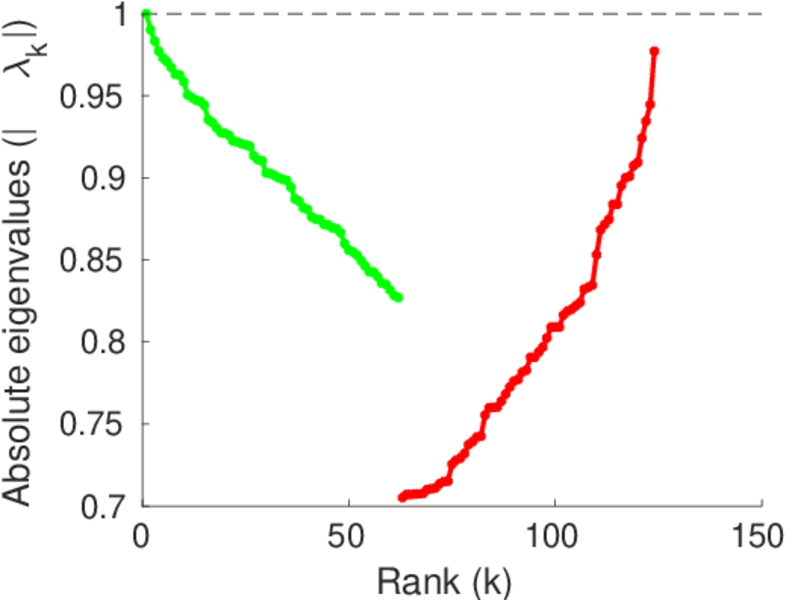
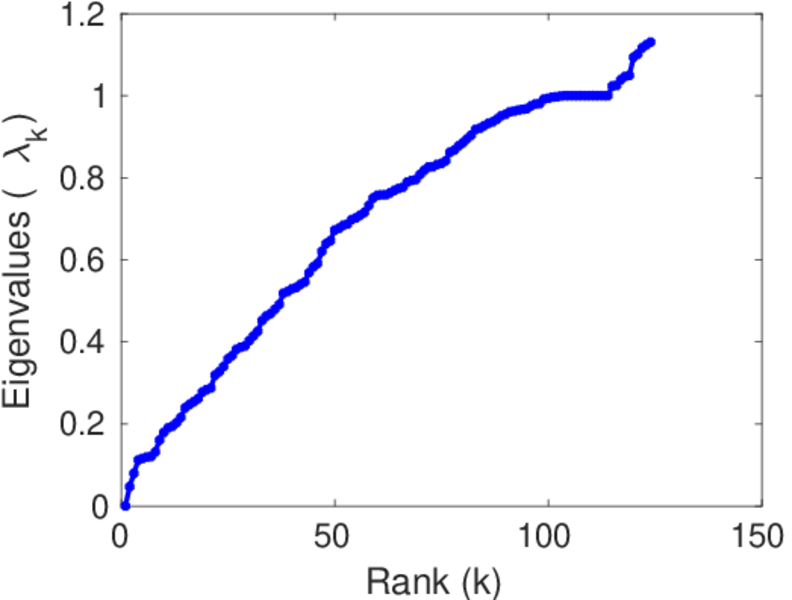
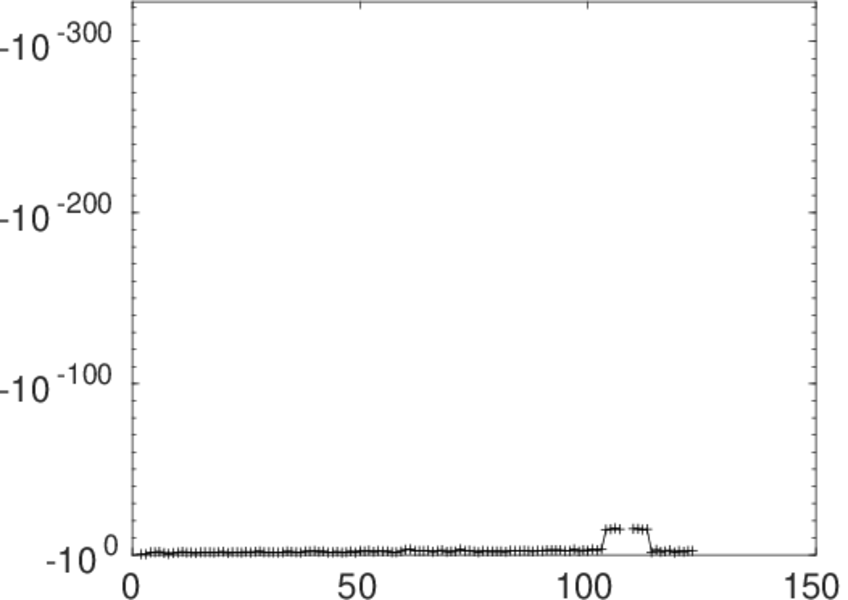
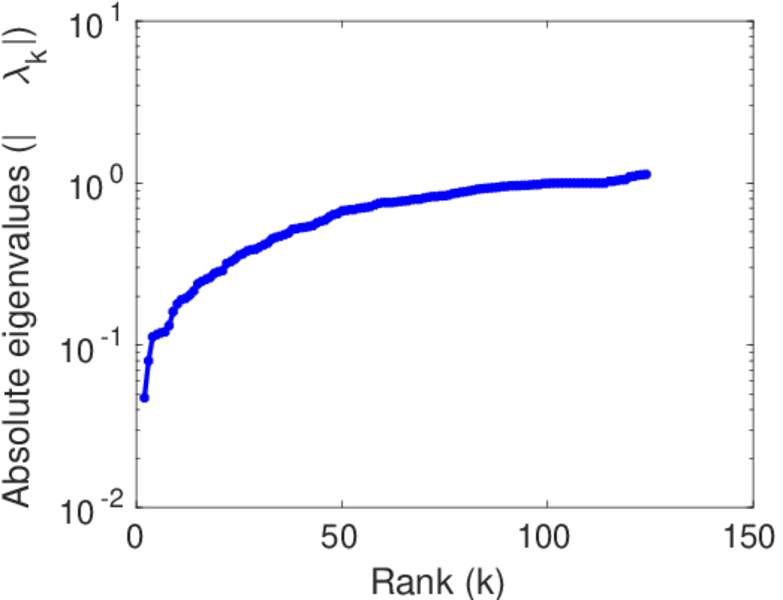
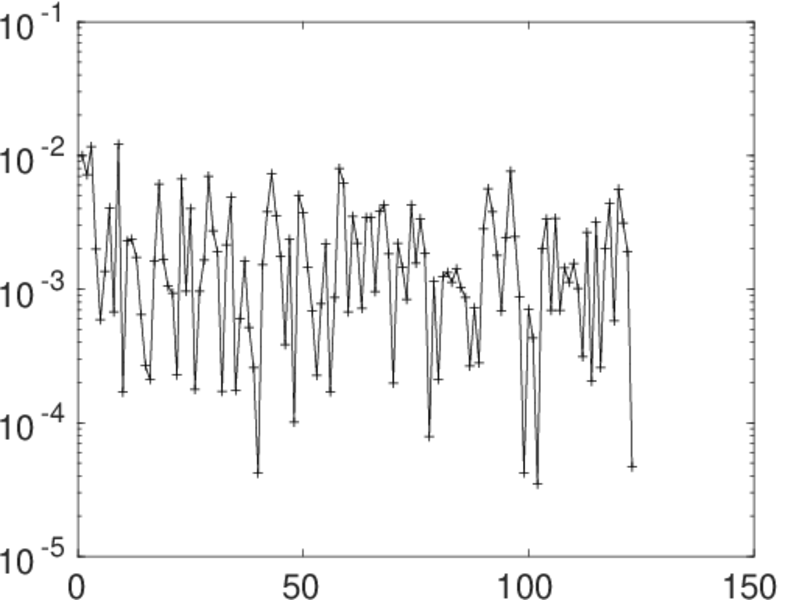
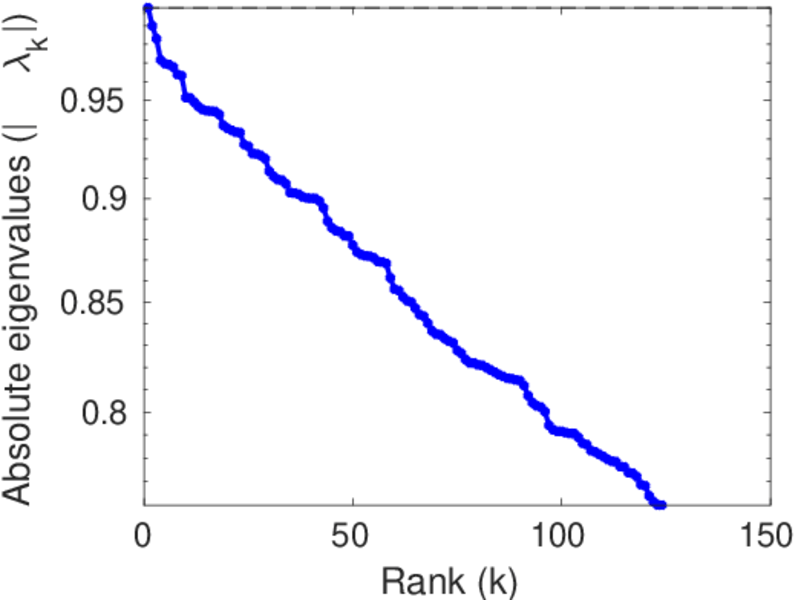
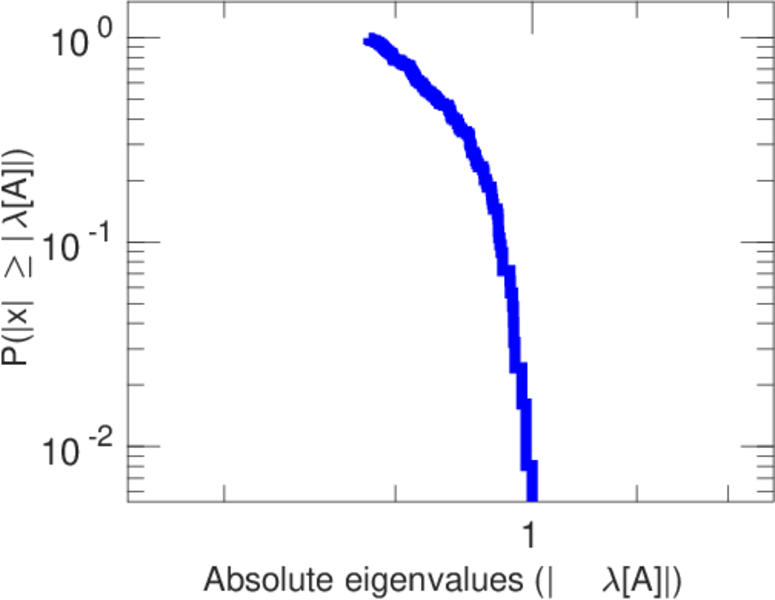
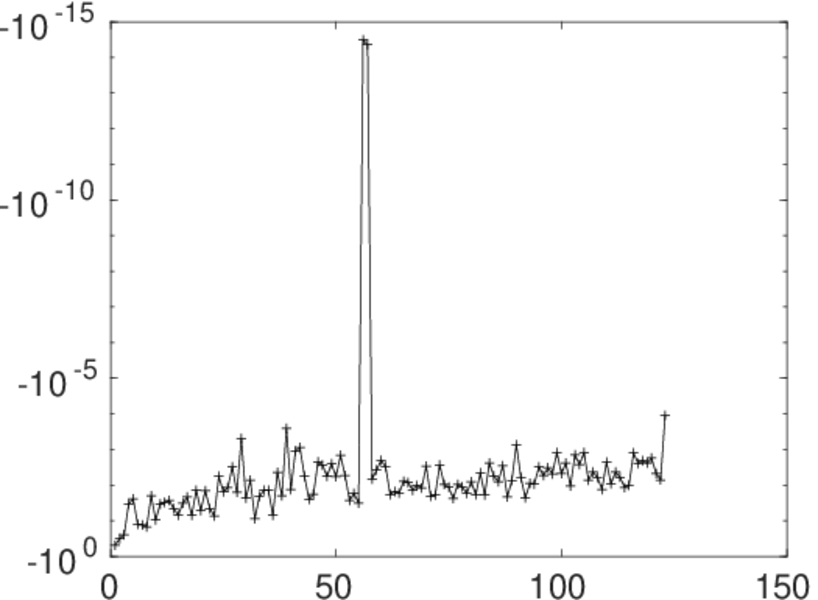
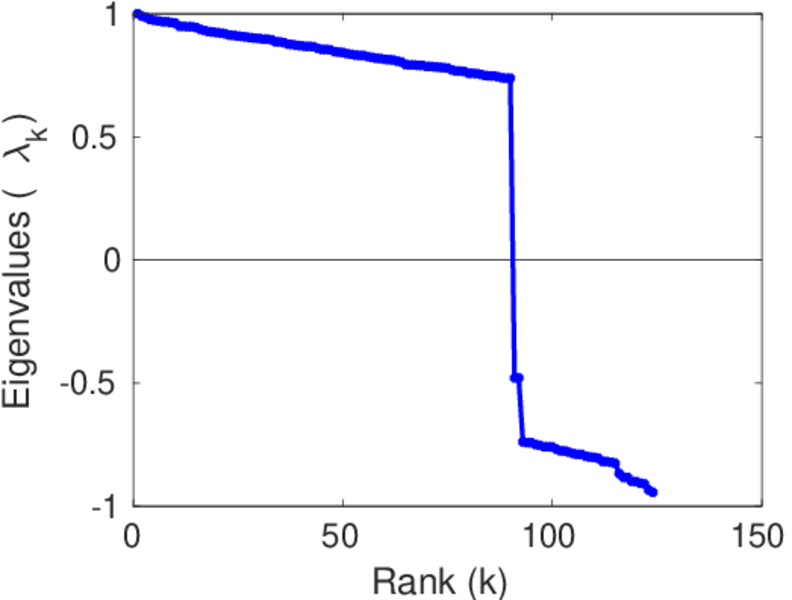
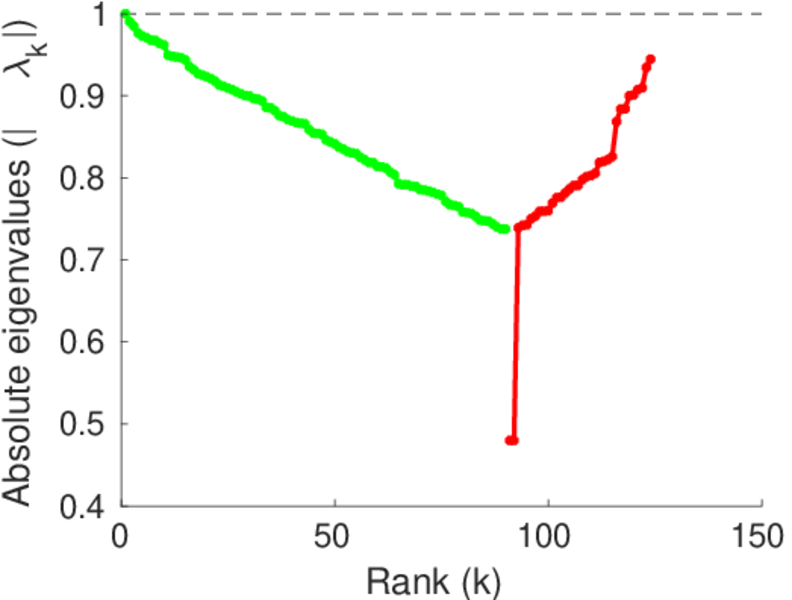
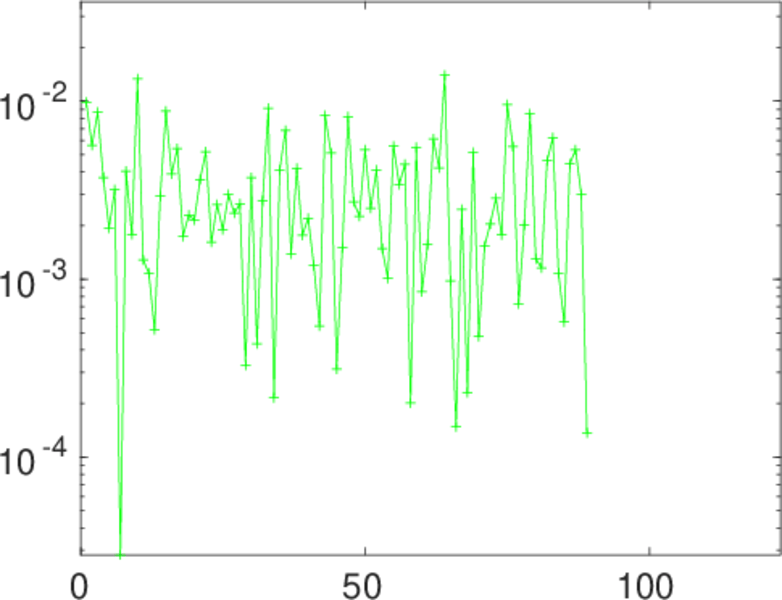
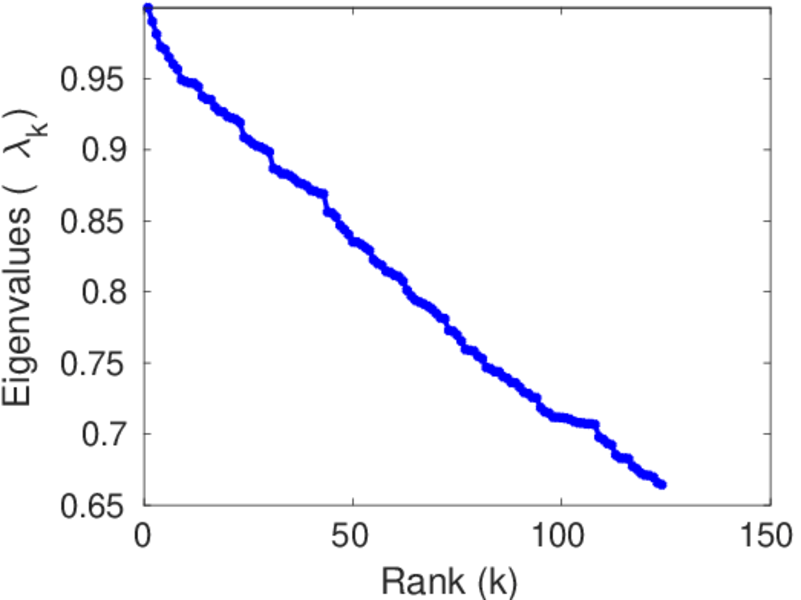
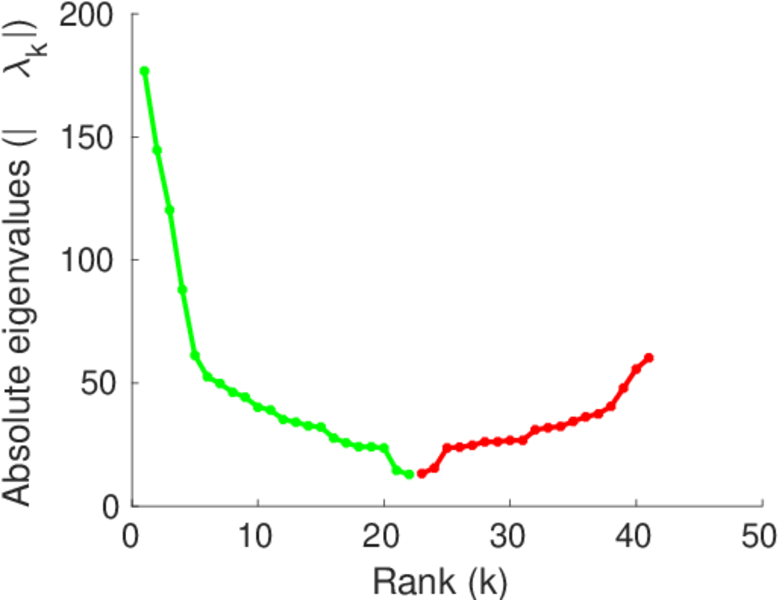
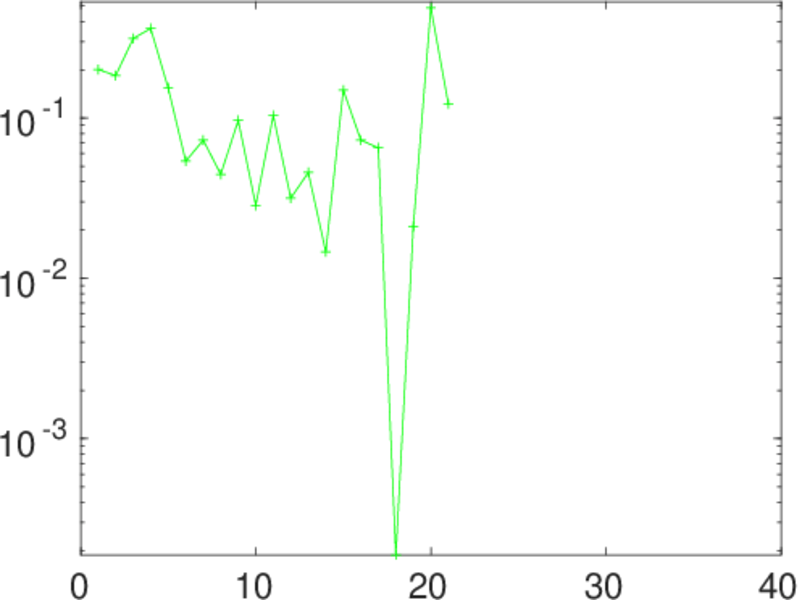
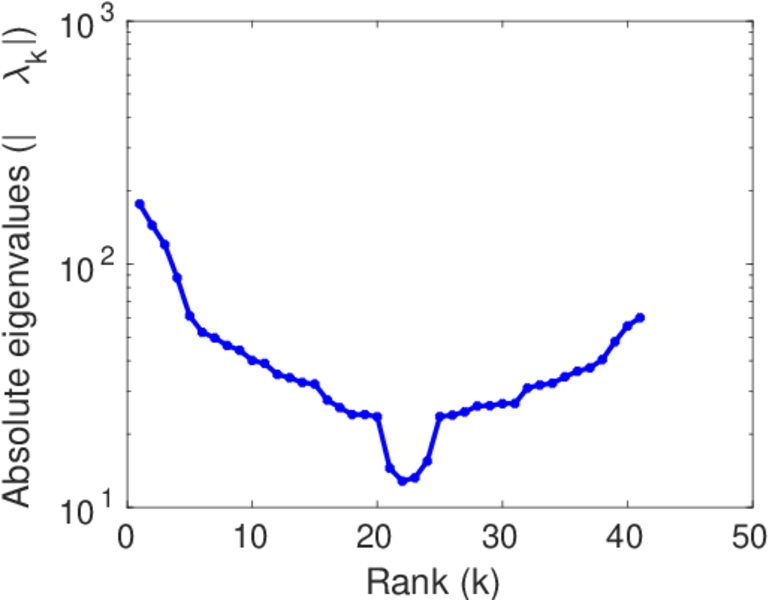
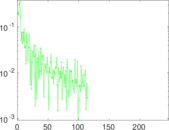
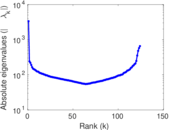
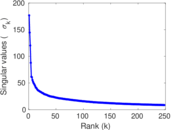
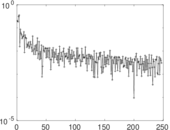
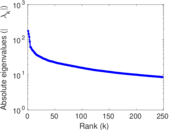
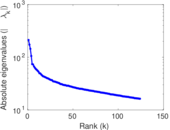
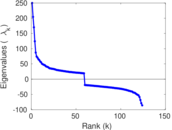
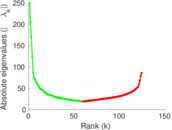
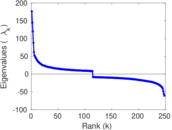
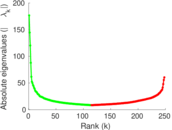
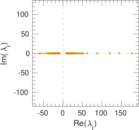
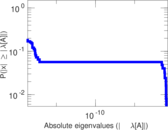
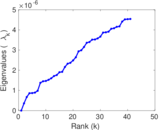
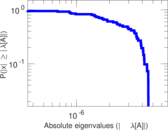
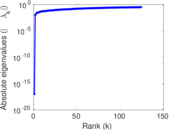
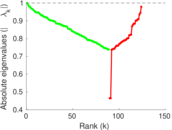
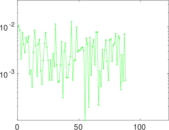
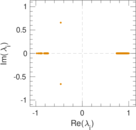
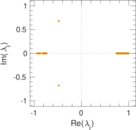
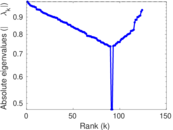
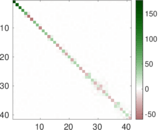
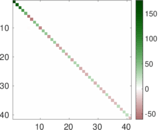
Matrix decompositions plots


Downloads
References
|
[1]
|
Jérôme Kunegis.
KONECT – The Koblenz Network Collection.
In Proc. Int. Conf. on World Wide Web Companion, pages
1343–1350, 2013.
[ http ]
|
 KONECT ‣ Networks ‣
Buy Me a Coffee
KONECT ‣ Networks ‣
Buy Me a Coffee