arXiv cond-mat
This bipartite network contains authorship links between authors and
publications in the arXiv condensed matter section (cond-mat) from 1995 to
1999. An edge represents an authorship connecting an author and a paper.
Metadata
Statistics
| Size | n = | 38,741
|
| Left size | n1 = | 16,726
|
| Right size | n2 = | 22,015
|
| Volume | m = | 58,595
|
| Wedge count | s = | 353,433
|
| Claw count | z = | 2,249,330
|
| Cross count | x = | 23,225,877
|
| Square count | q = | 70,549
|
| 4-Tour count | T4 = | 2,095,390
|
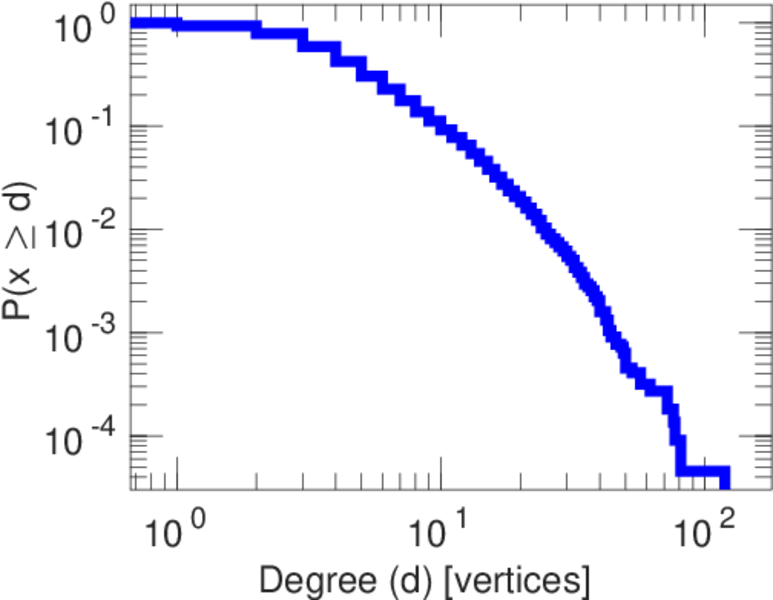
| Maximum degree | dmax = | 116
|
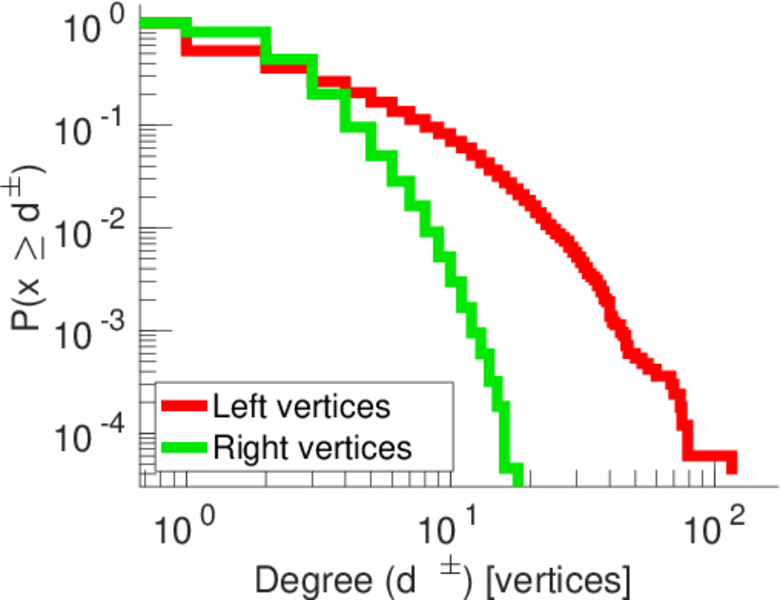
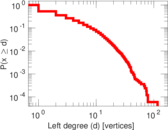
| Maximum left degree | d1max = | 116
|
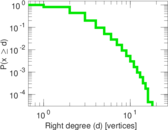
| Maximum right degree | d2max = | 18
|
| Average degree | d = | 3.024 96
|
| Average left degree | d1 = | 3.503 23
|
| Average right degree | d2 = | 2.661 59
|
| Fill | p = | 0.000 159 129
|
| Size of LCC | N = | 33,326
|
| Diameter | δ = | 36
|
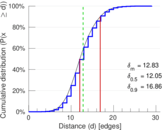
| 50-Percentile effective diameter | δ0.5 = | 12.046 6
|
| 90-Percentile effective diameter | δ0.9 = | 16.860 8
|
| Median distance | δM = | 13
|
| Mean distance | δm = | 12.830 7
|
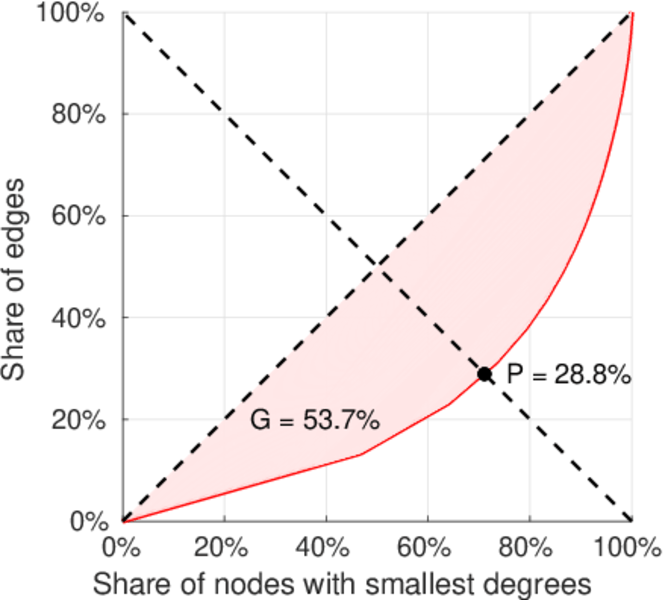
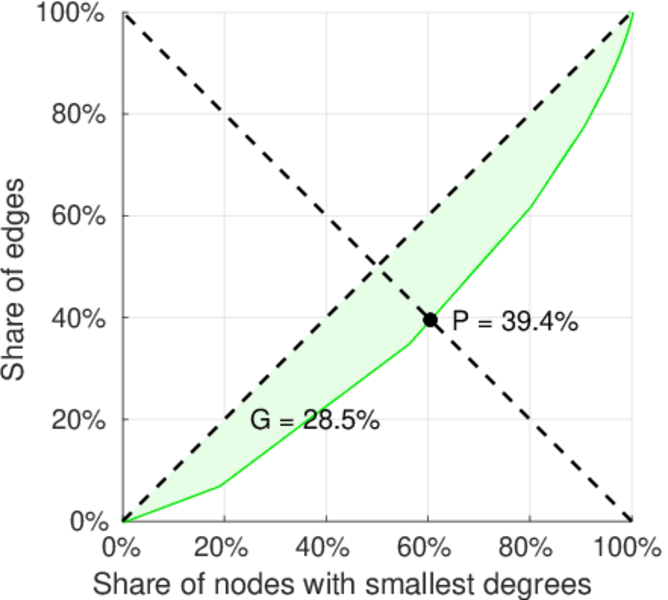
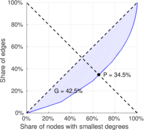
| Gini coefficient | G = | 0.390 429
|
| Balanced inequality ratio | P = | 0.357 053
|
| Left balanced inequality ratio | P1 = | 0.287 635
|
| Right balanced inequality ratio | P2 = | 0.393 976
|
| Relative edge distribution entropy | Her = | 0.965 644
|
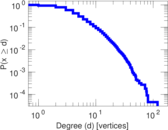
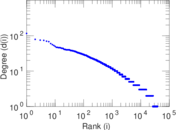
| Power law exponent | γ = | 2.244 82
|
| Tail power law exponent | γt = | 2.811 00
|
| Tail power law exponent with p | γ3 = | 2.811 00
|
| p-value | p = | 0.000 00
|
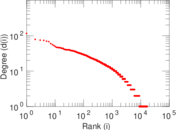
| Left tail power law exponent with p | γ3,1 = | 3.501 00
|
| Left p-value | p1 = | 0.000 00
|
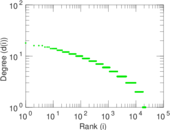
| Right tail power law exponent with p | γ3,2 = | 4.261 00
|
| Right p-value | p2 = | 0.000 00
|
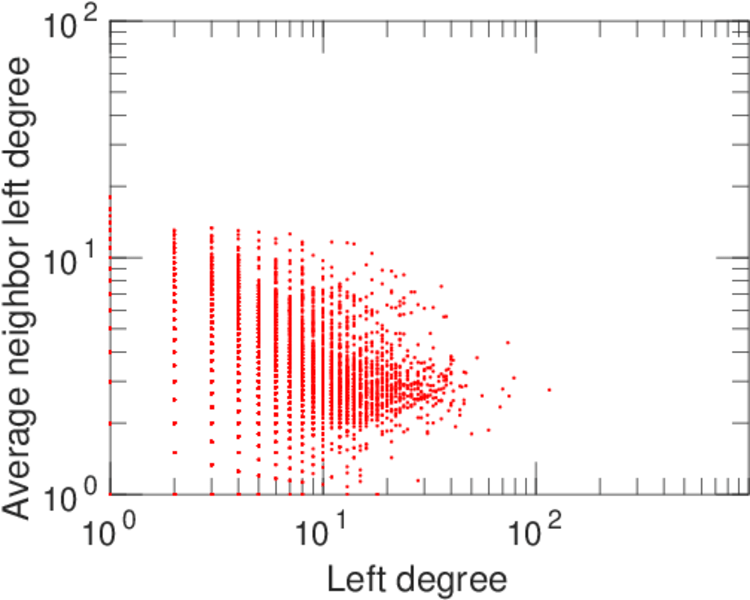
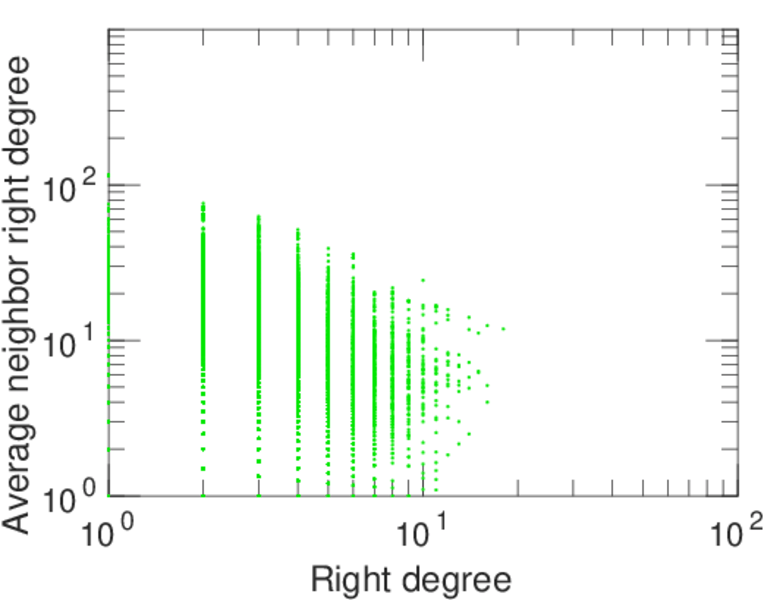
| Degree assortativity | ρ = | −0.129 318
|
| Degree assortativity p-value | pρ = | 6.816 59 × 10−217
|
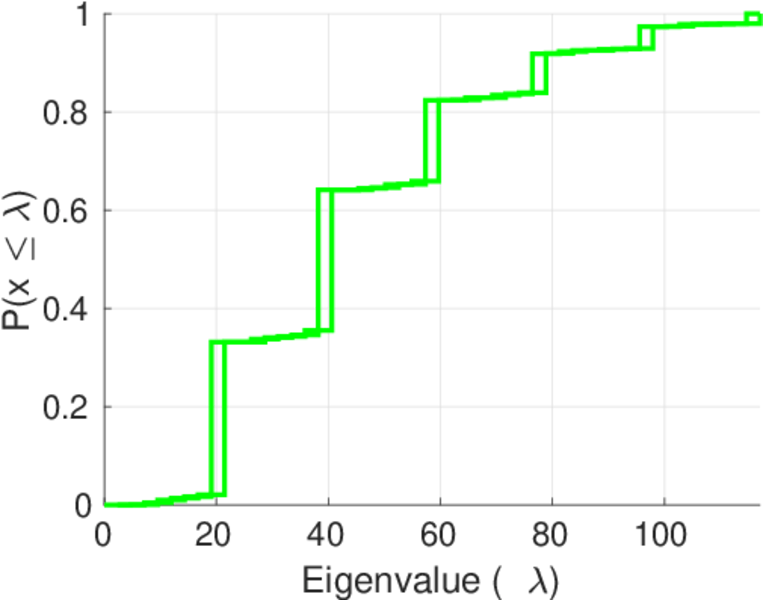
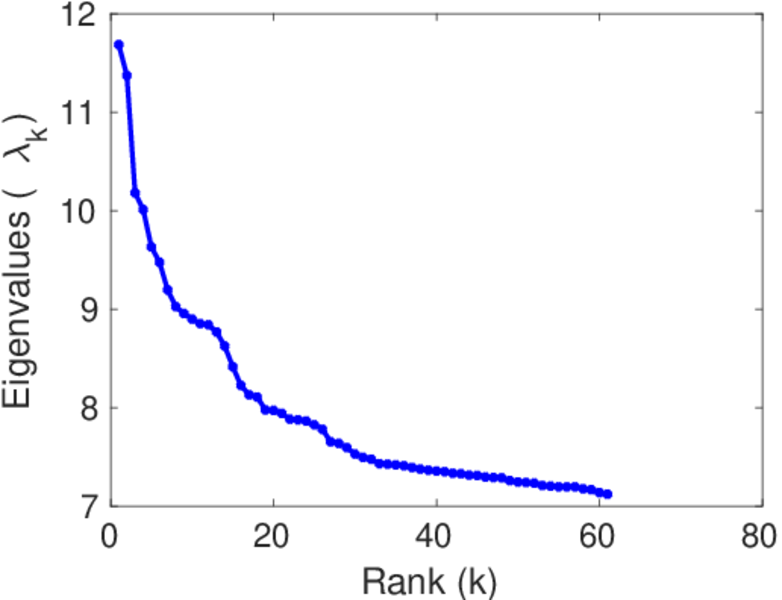
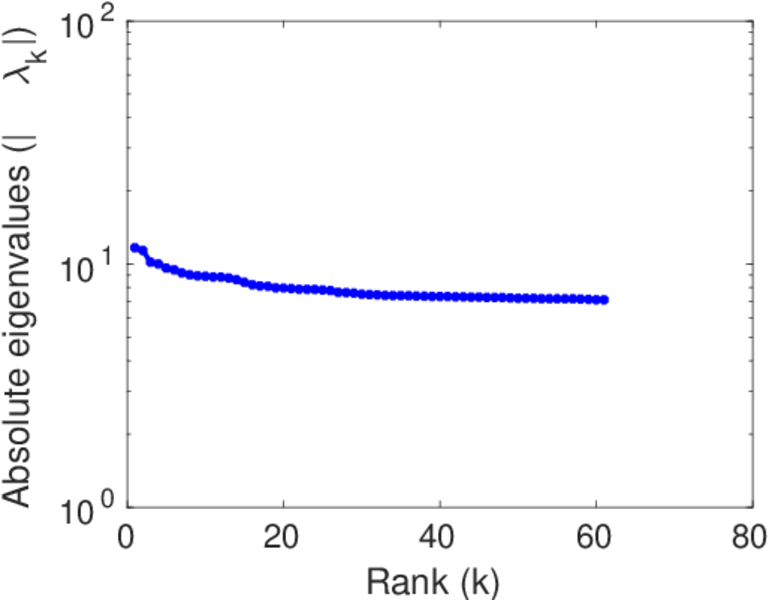
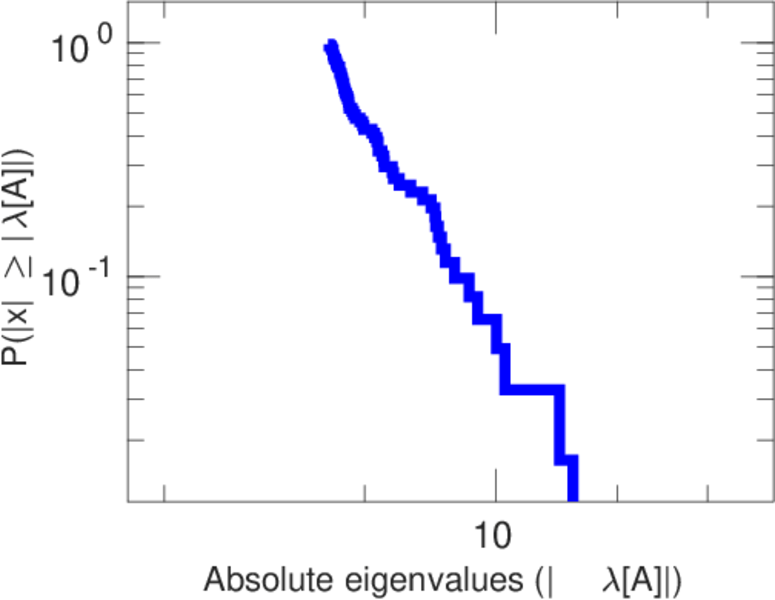
| Spectral norm | α = | 11.684 9
|
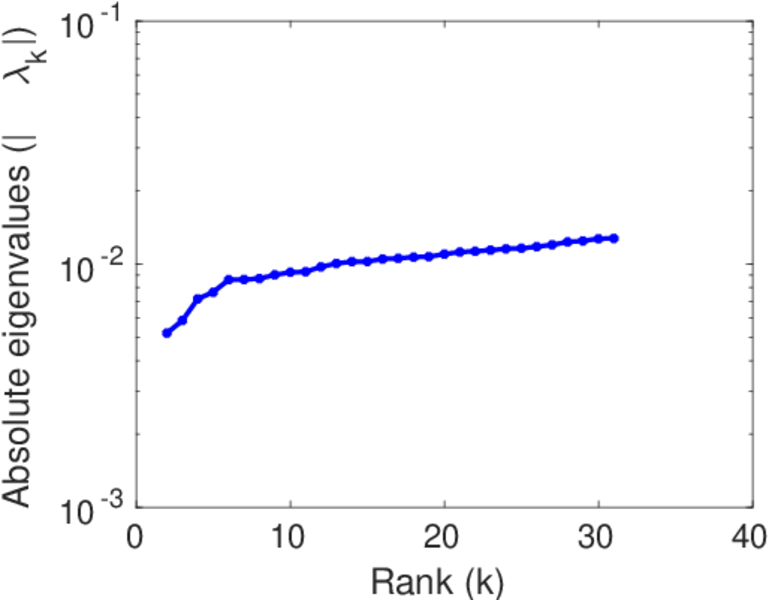
| Algebraic connectivity | a = | 0.005 202 70
|
| Spectral separation | |λ1[A] / λ2[A]| = | 1.027 69
|
| Controllability | C = | 13,507
|
| Relative controllability | Cr = | 0.348 649
|
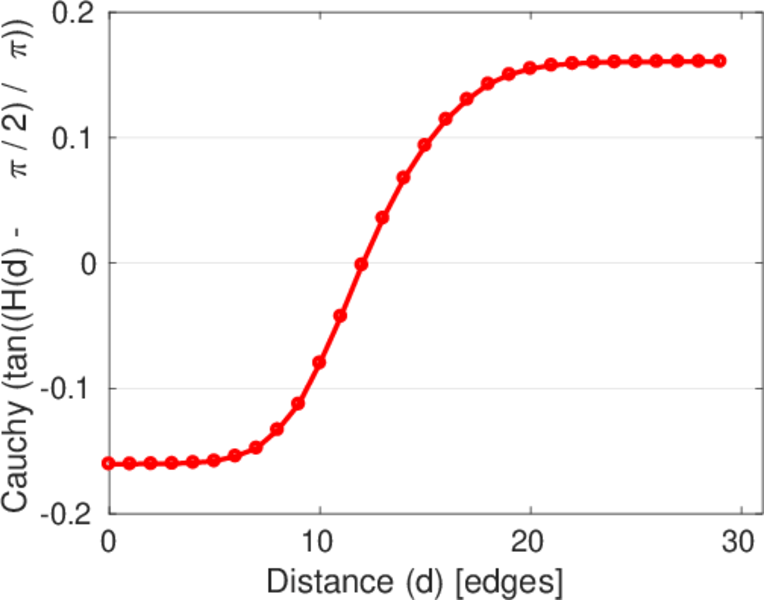
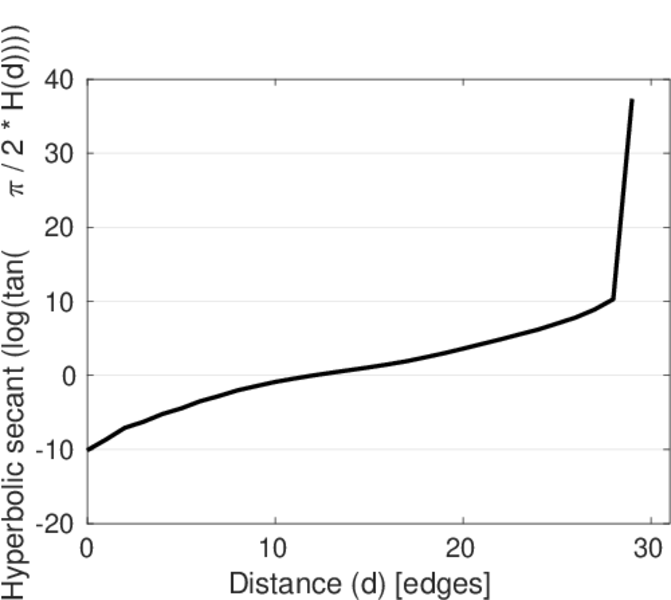
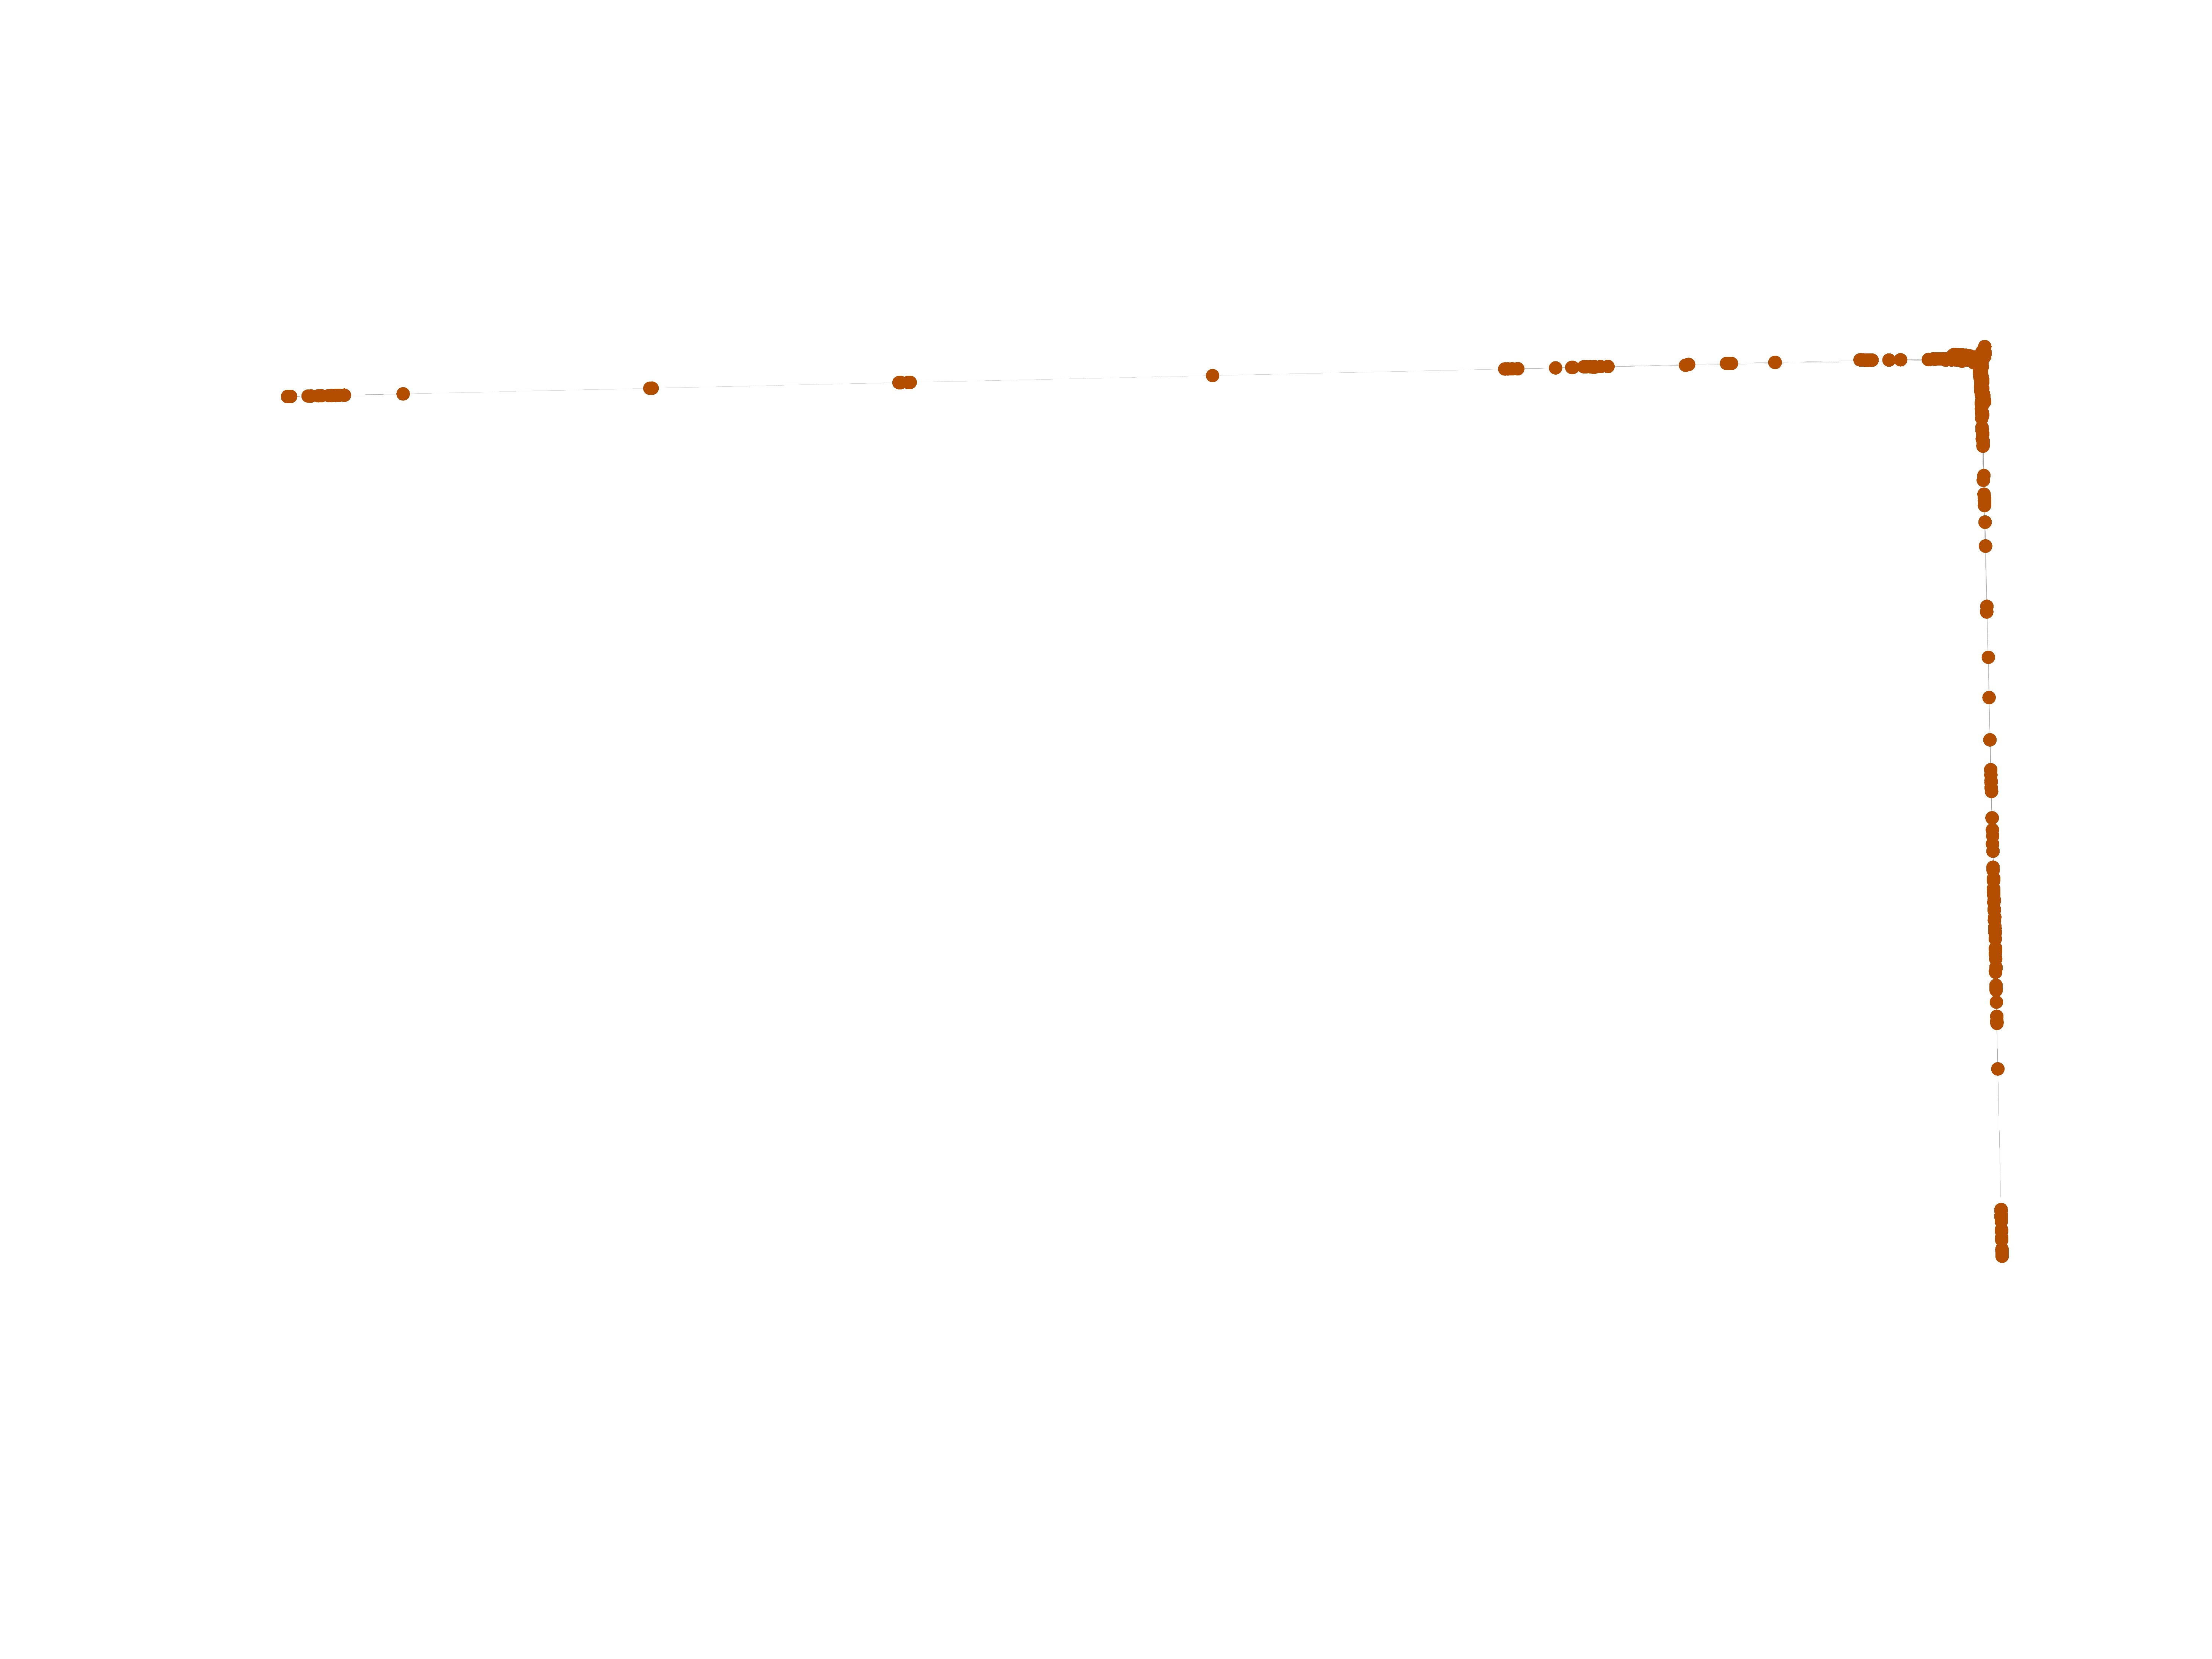
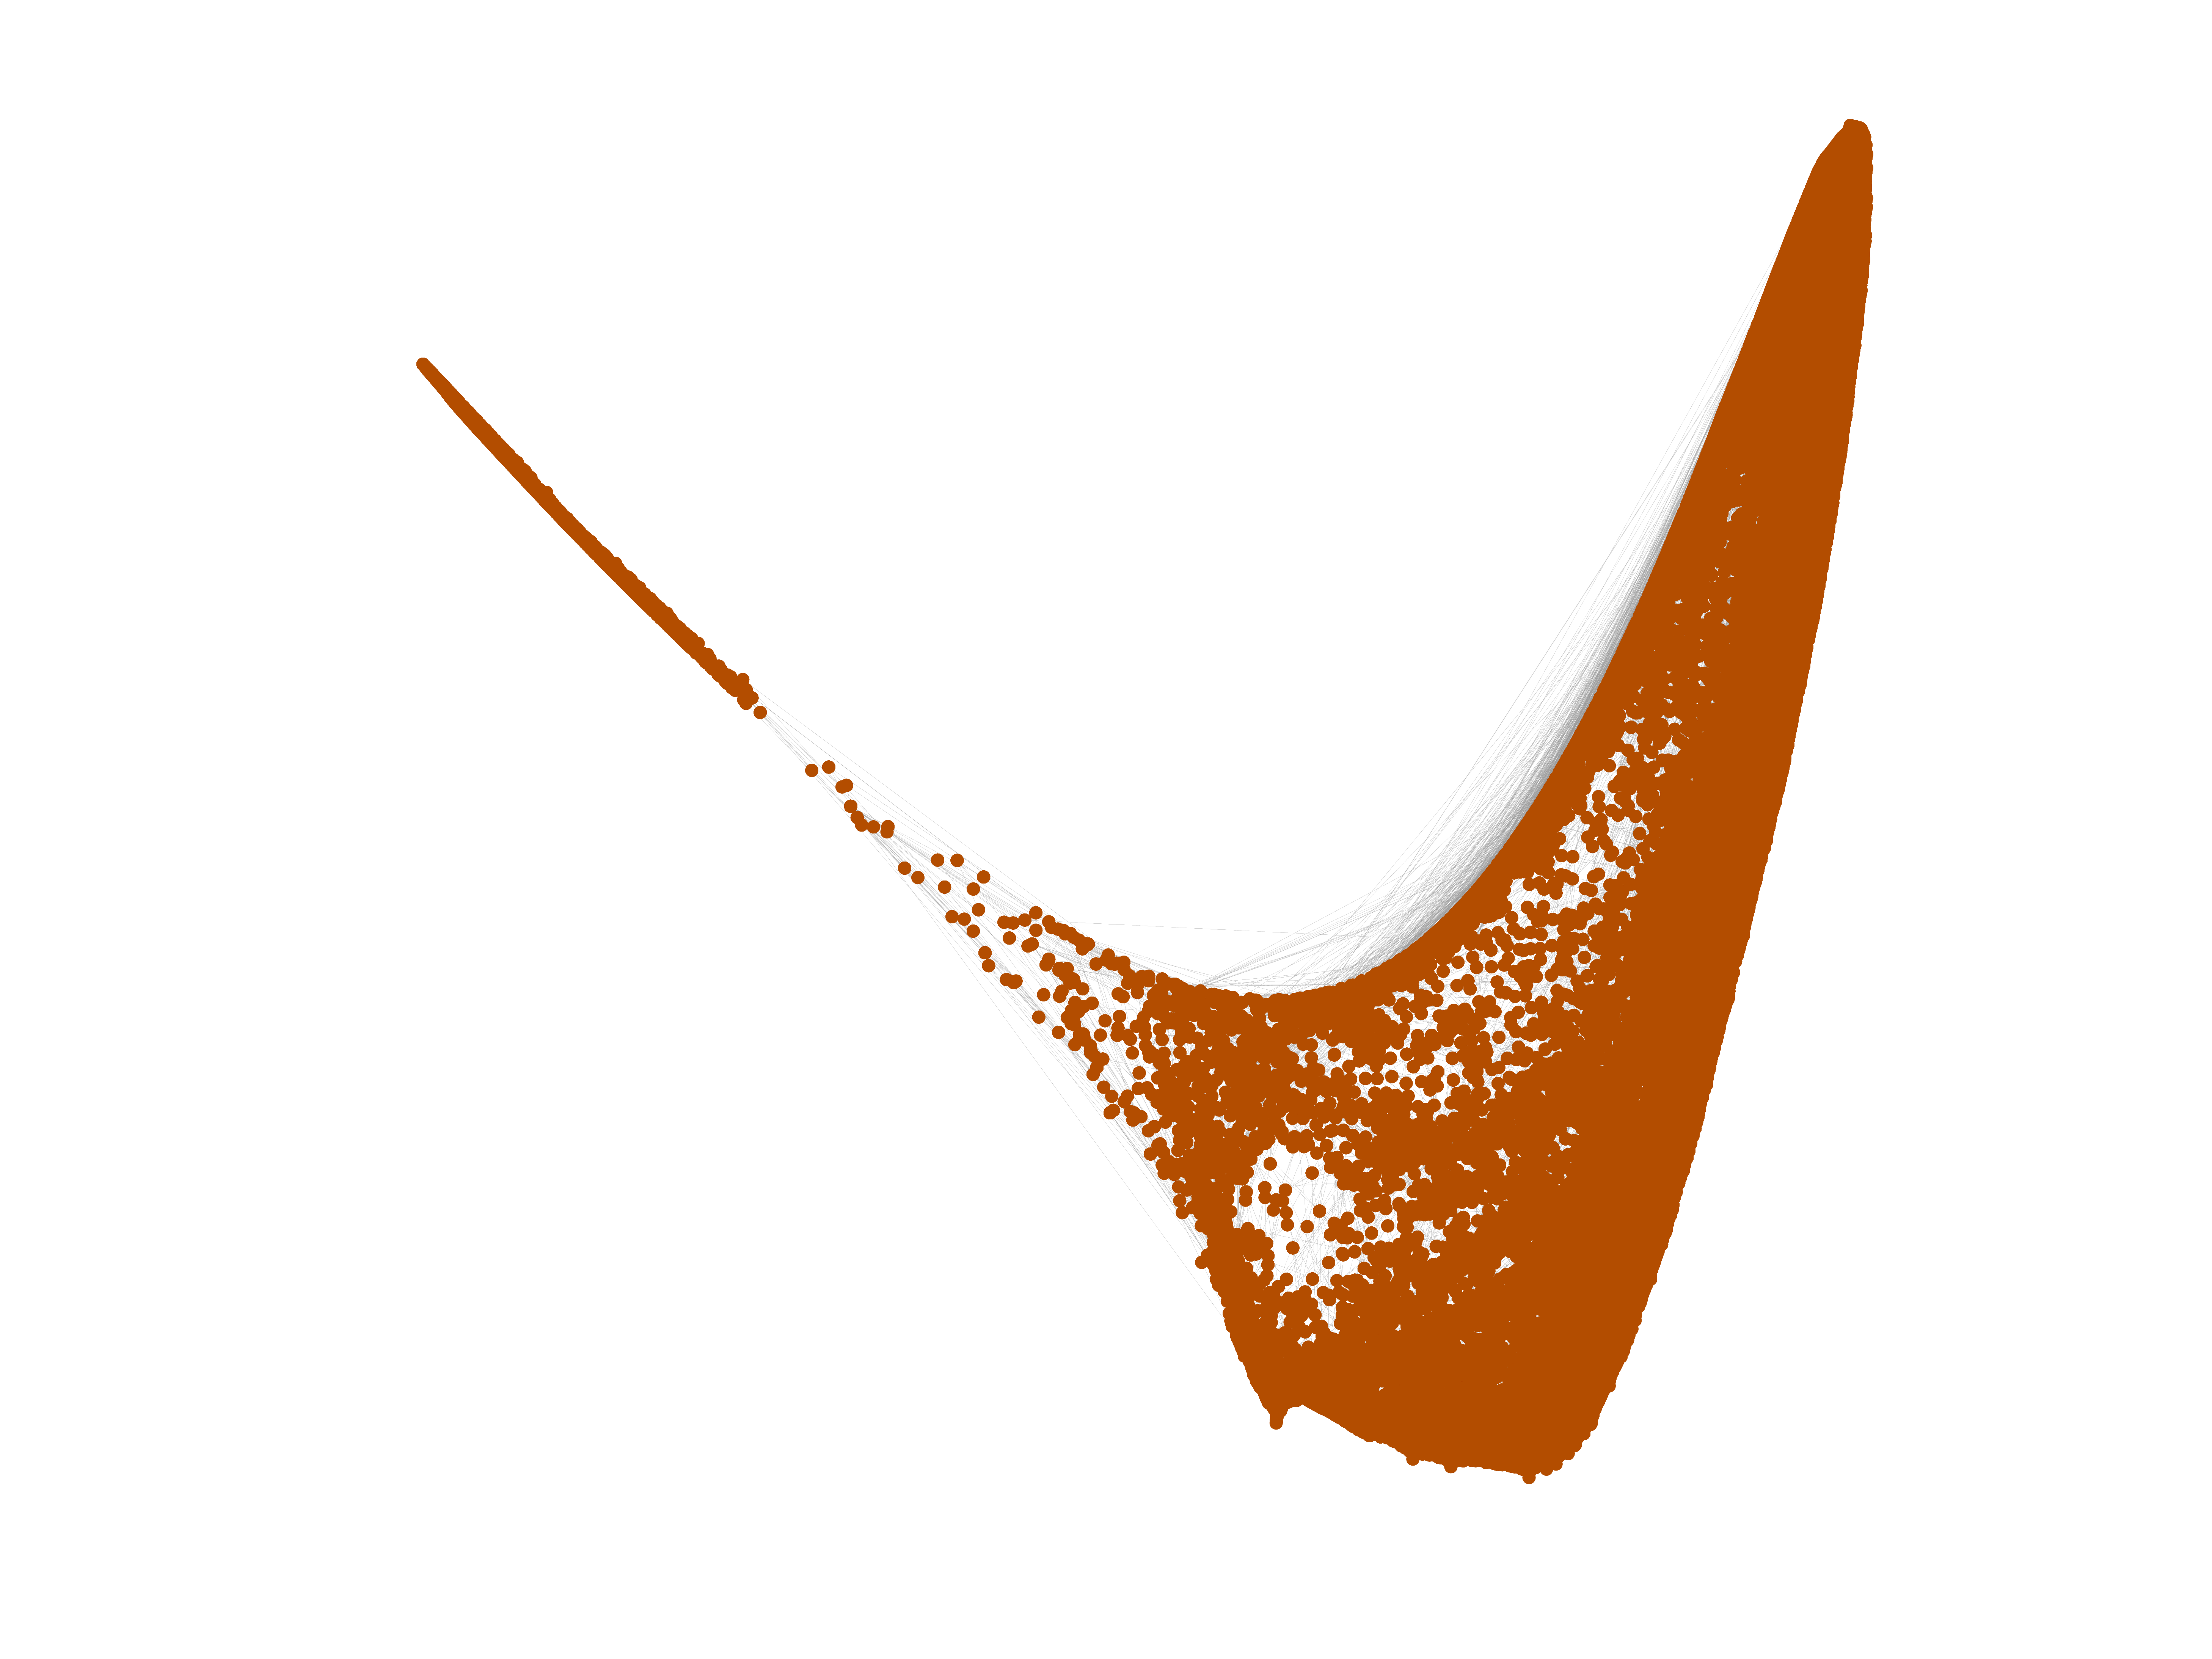
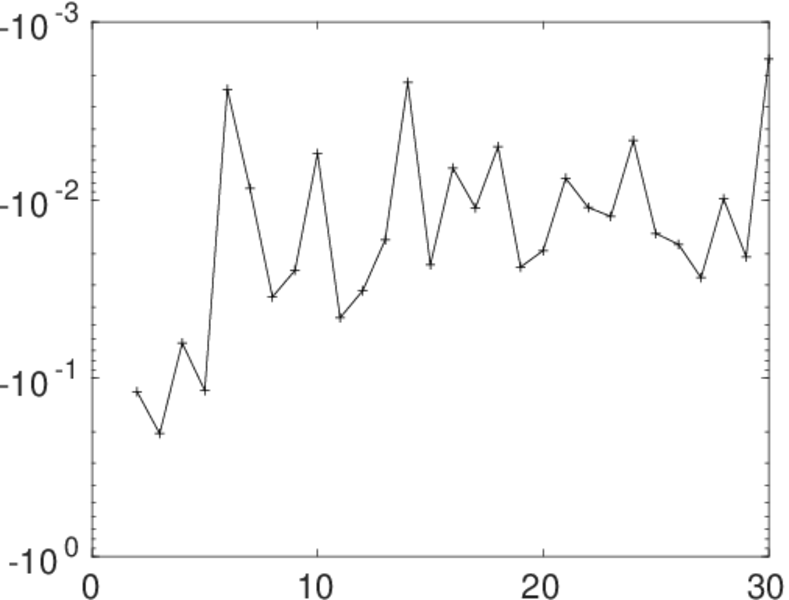
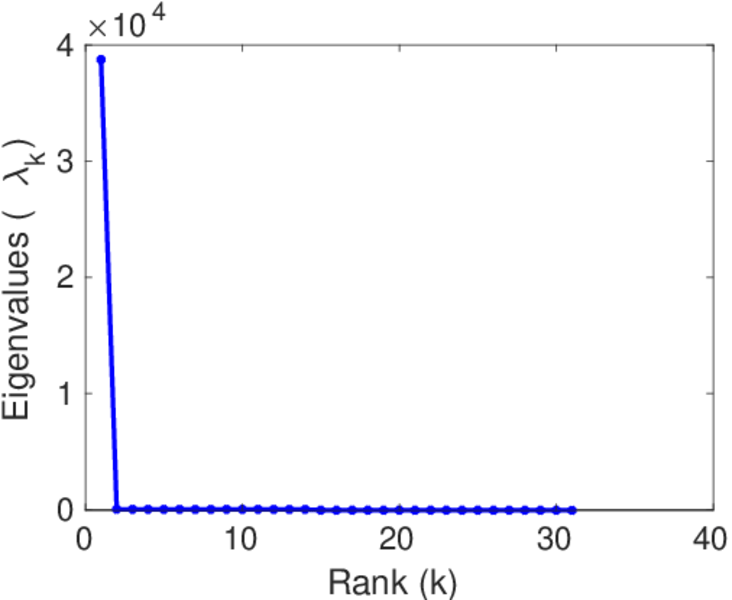
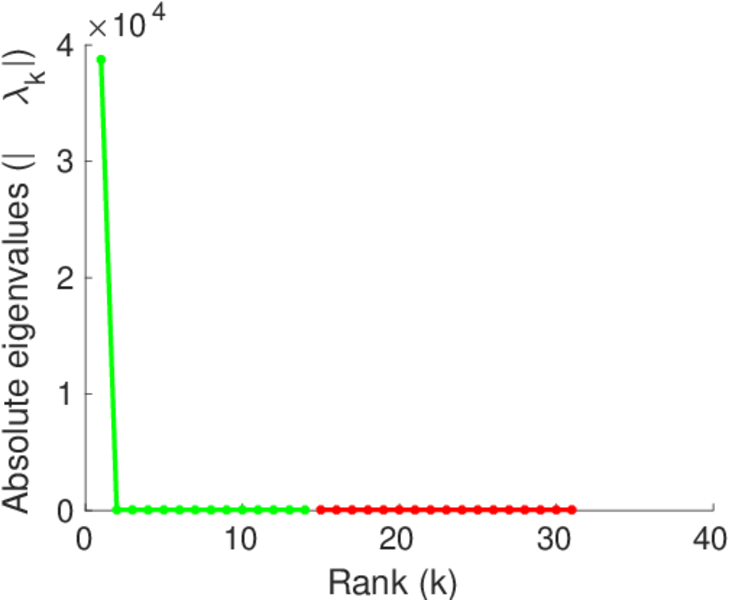
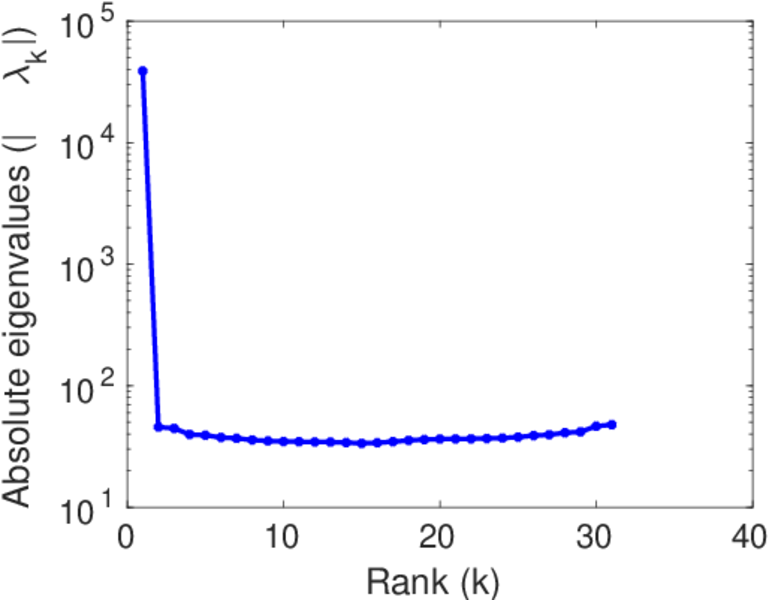
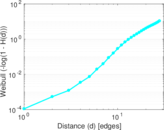
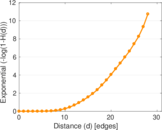
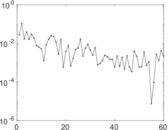
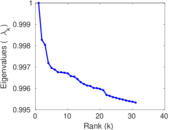
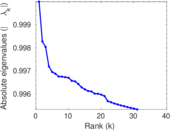
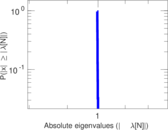
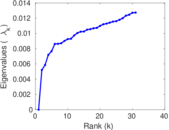
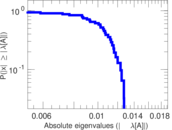
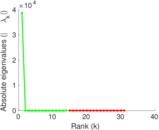
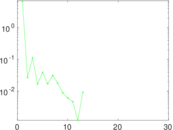
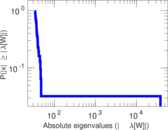
Plots


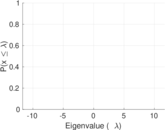
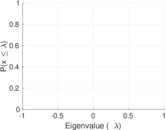

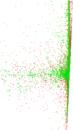
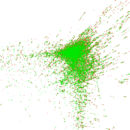


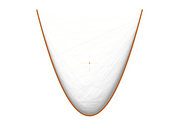


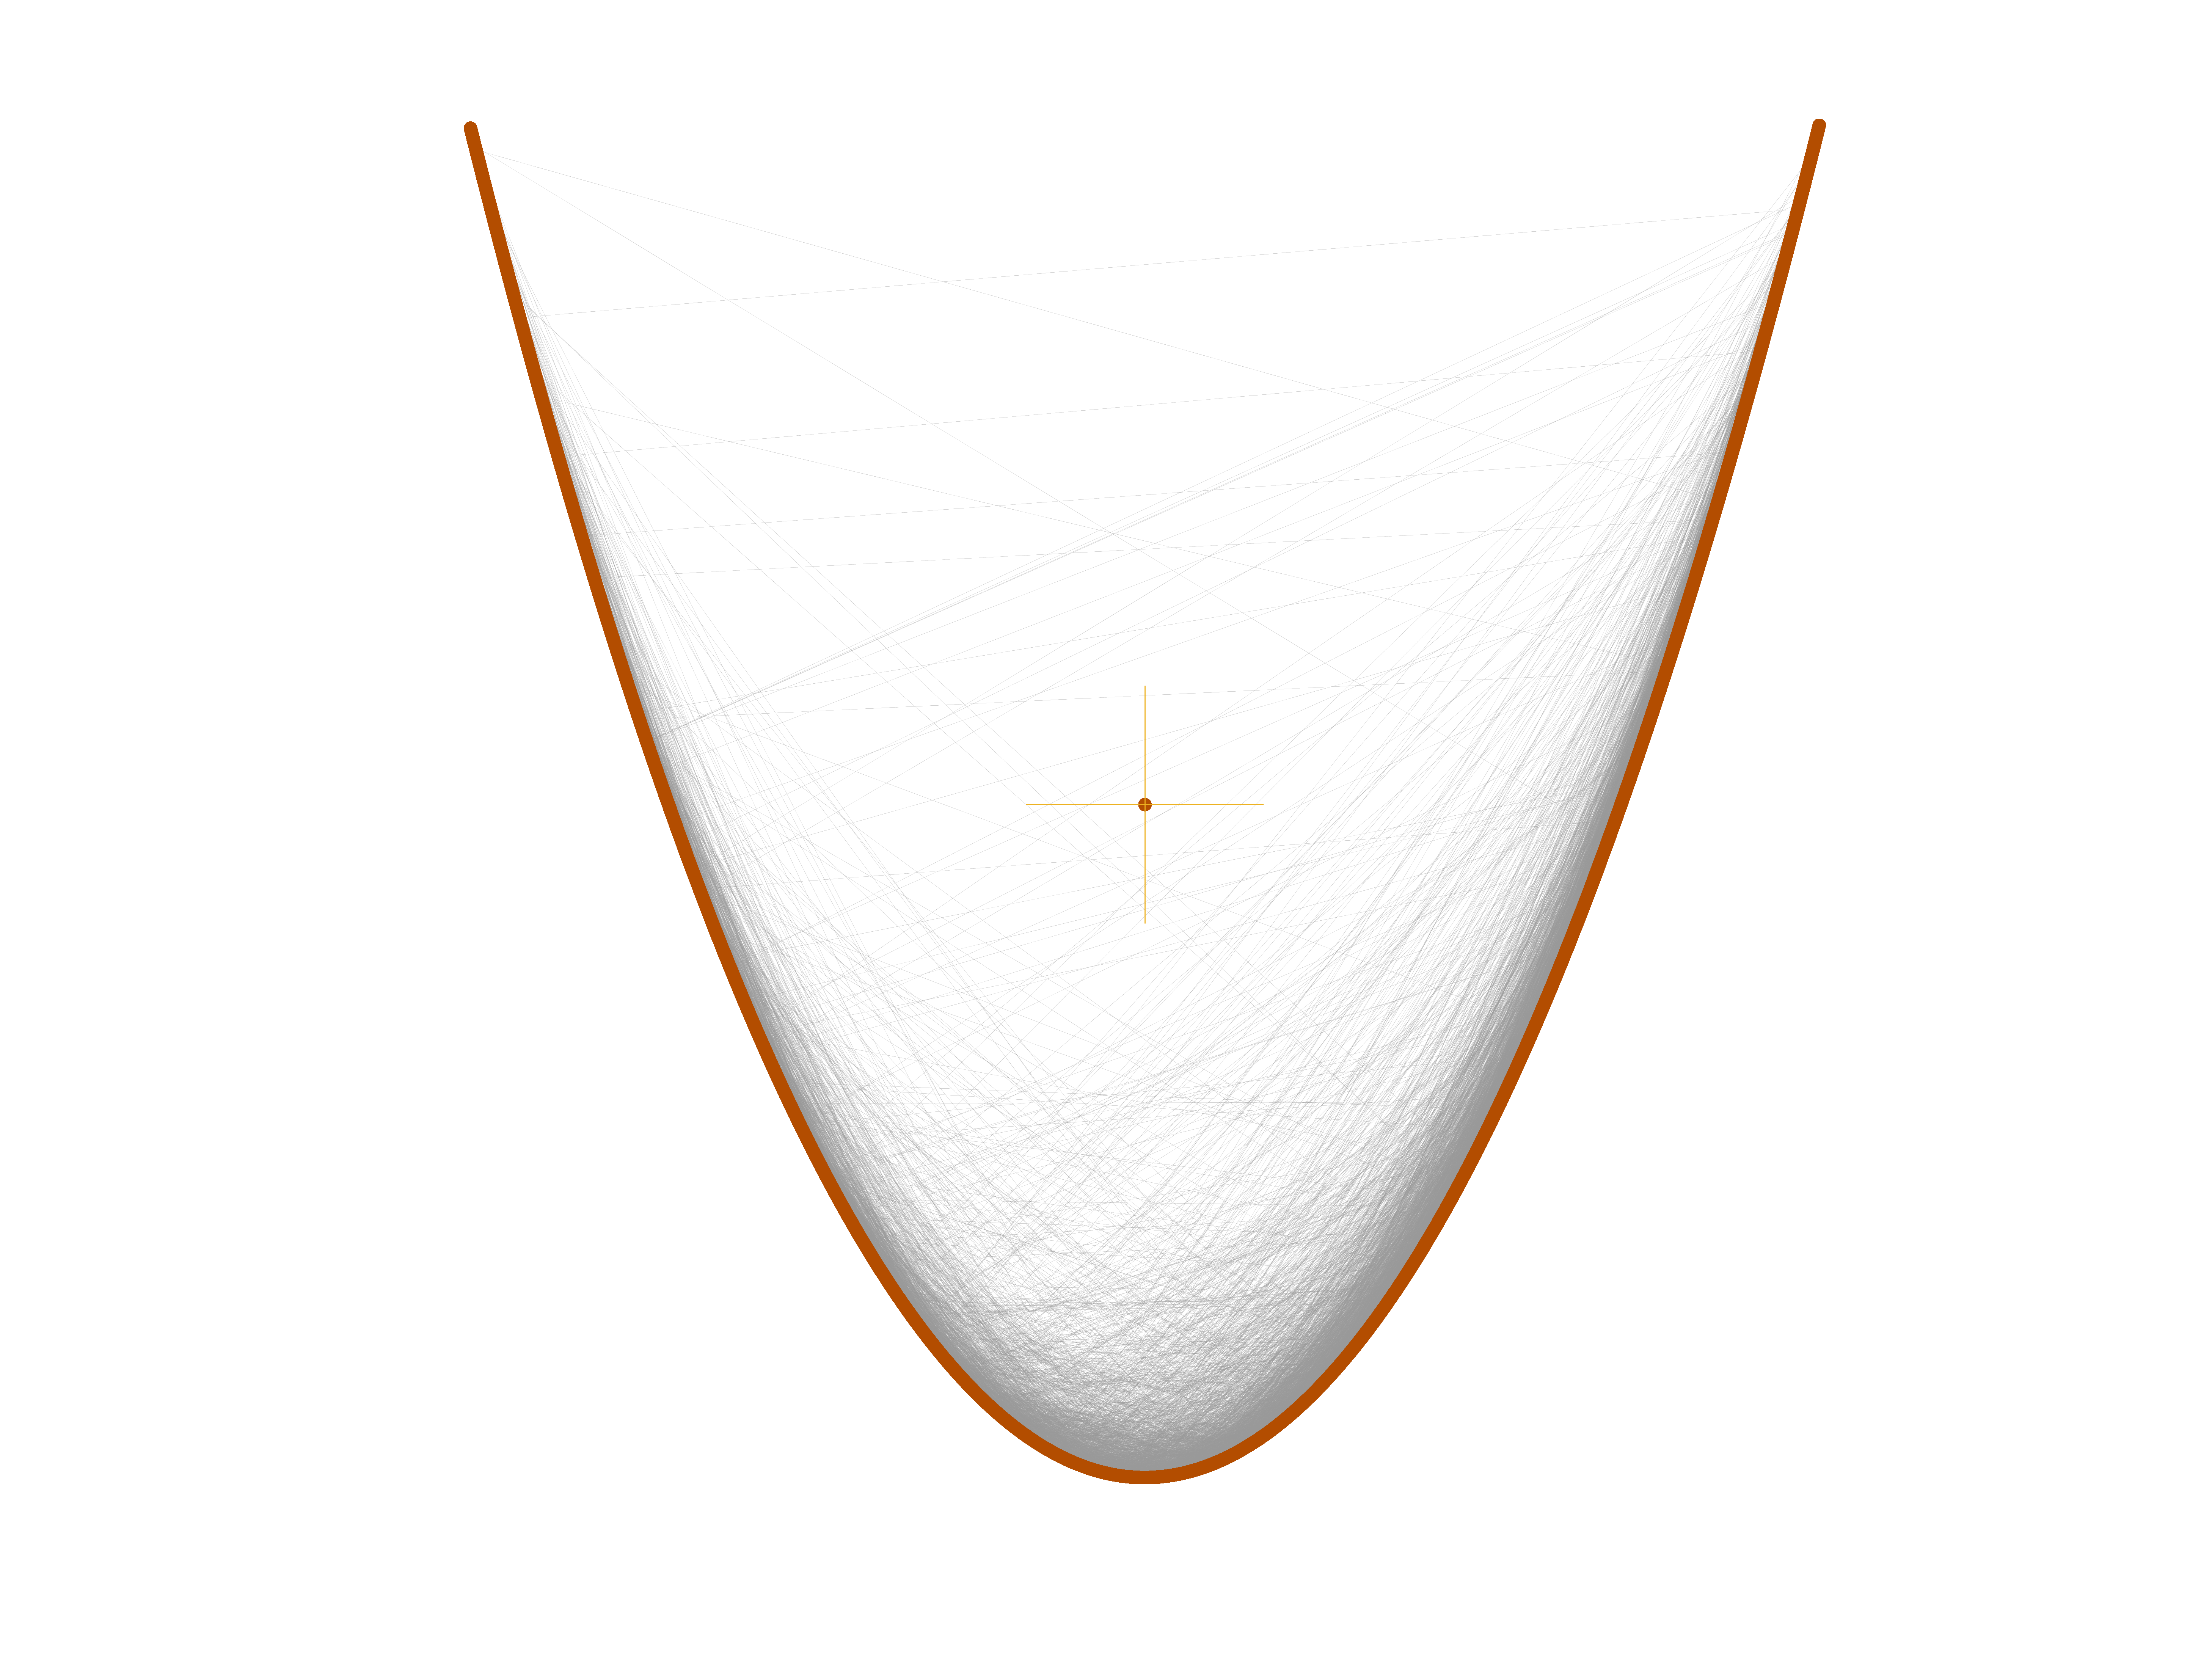
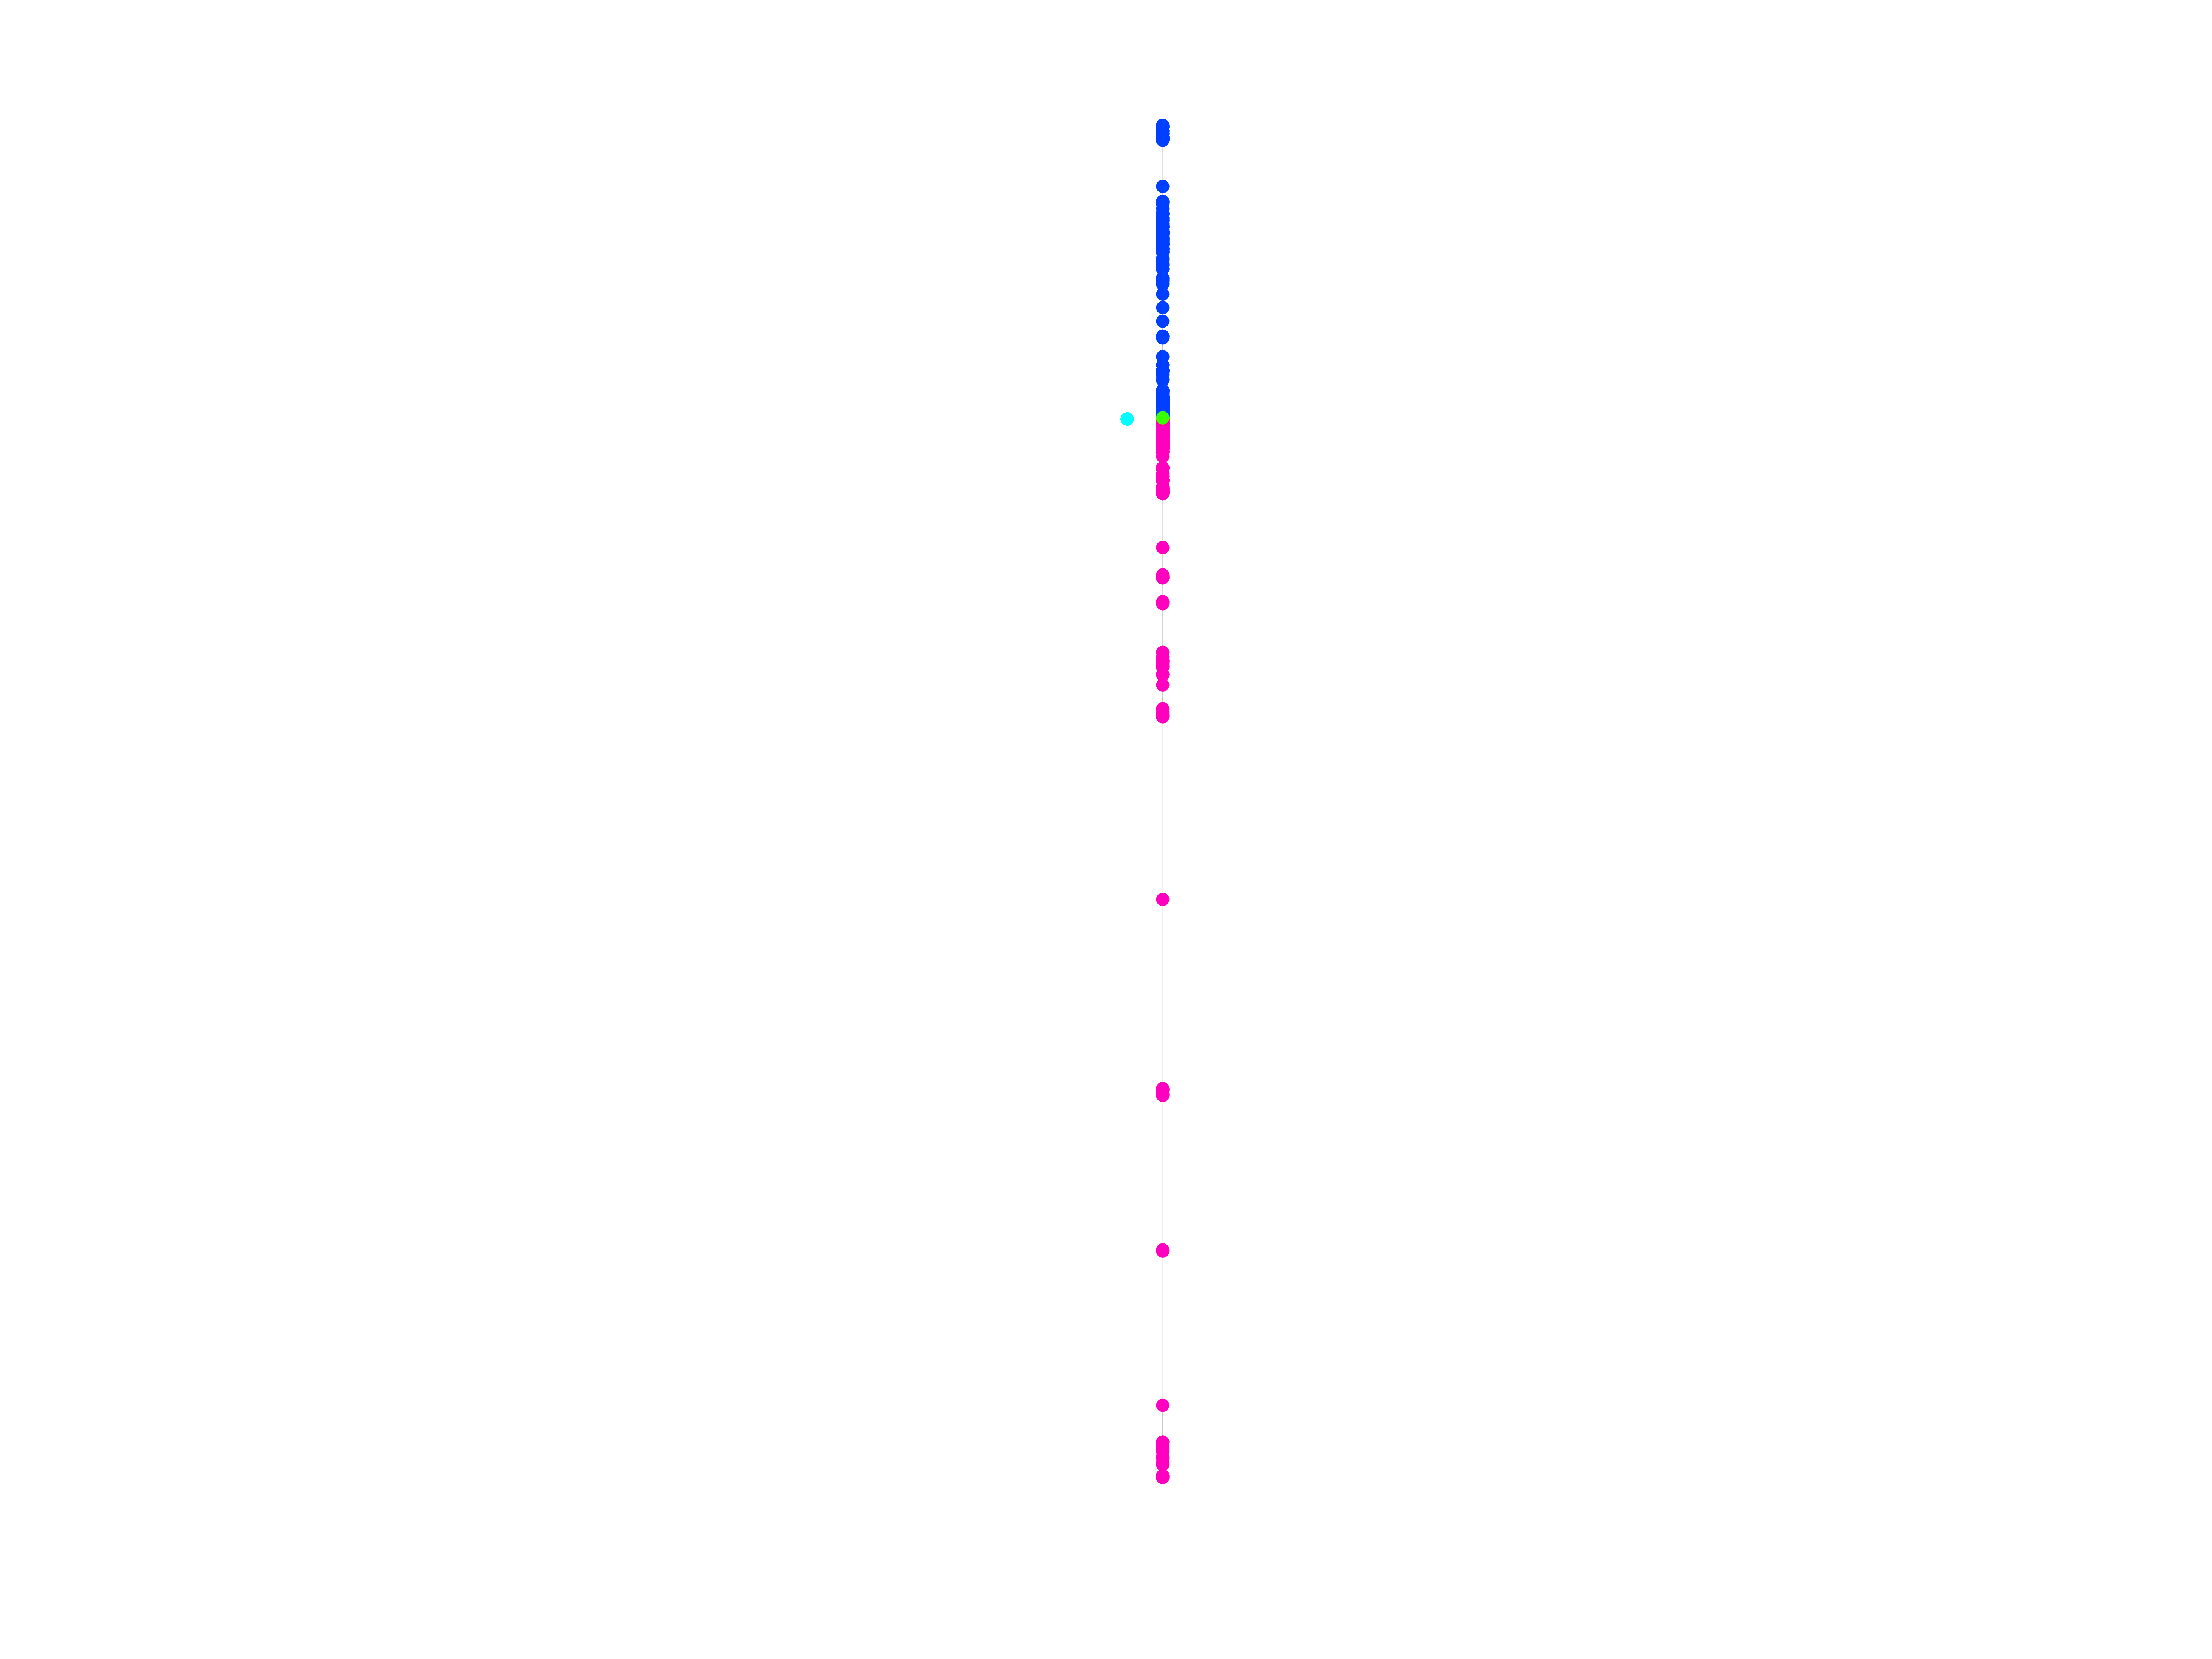
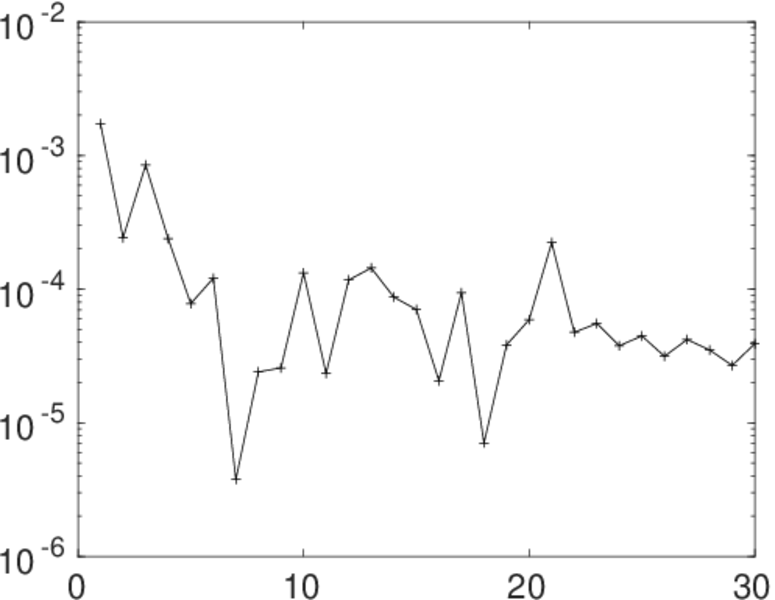
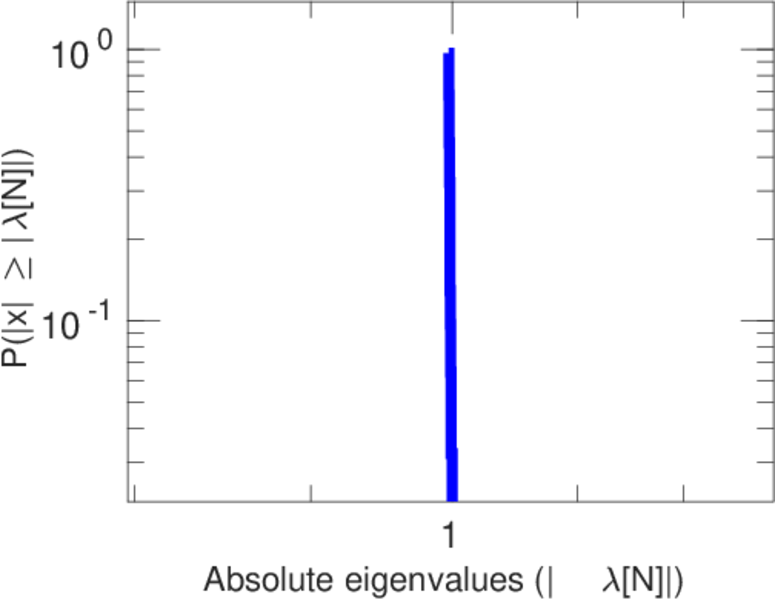
Matrix decompositions plots


Downloads
References
|
[1]
|
Jérôme Kunegis.
KONECT – The Koblenz Network Collection.
In Proc. Int. Conf. on World Wide Web Companion, pages
1343–1350, 2013.
[ http ]
|
|
[2]
|
Mark E. J. Newman.
The structure of scientific collaboration networks.
Proc. Natl. Acad. Sci. U.S.A., 98(2):404–409, 2001.
|
 KONECT ‣ Networks ‣
Buy Me a Coffee
KONECT ‣ Networks ‣
Buy Me a Coffee