OpenFlights (Opsahl)
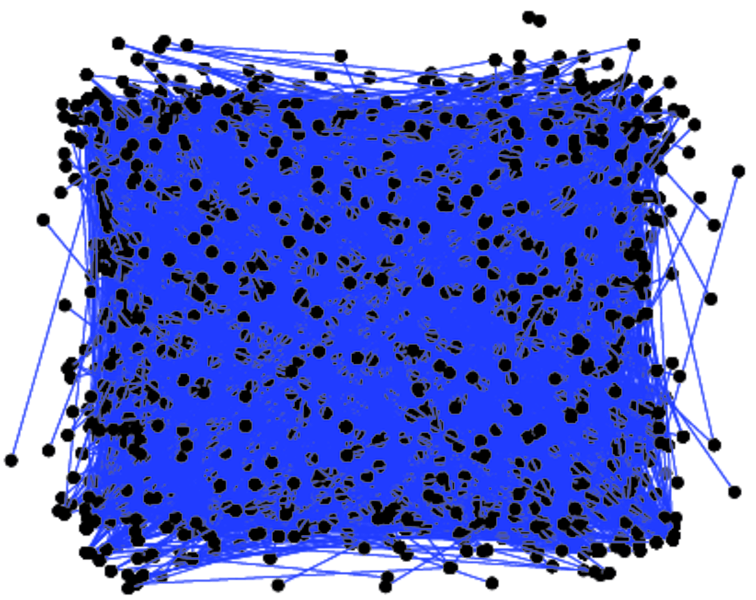
This directed network contains flights between airports of the world. A
directed edge represents a flight from one airport to another. This dataset is
extracted from Openflights.org data and corresponds to network 14c in the
dataset list by Tore Opsahl.
Metadata
Statistics
| Size | n = | 2,939
|
| Volume | m = | 30,501
|
| Loop count | l = | 0
|
| Wedge count | s = | 858,032
|
| Claw count | z = | 228,755,628
|
| Cross count | x = | 15,168,107,153
|
| Triangle count | t = | 72,852
|
| Square count | q = | 2,642,153
|
| 4-Tour count | T4 = | 24,600,706
|
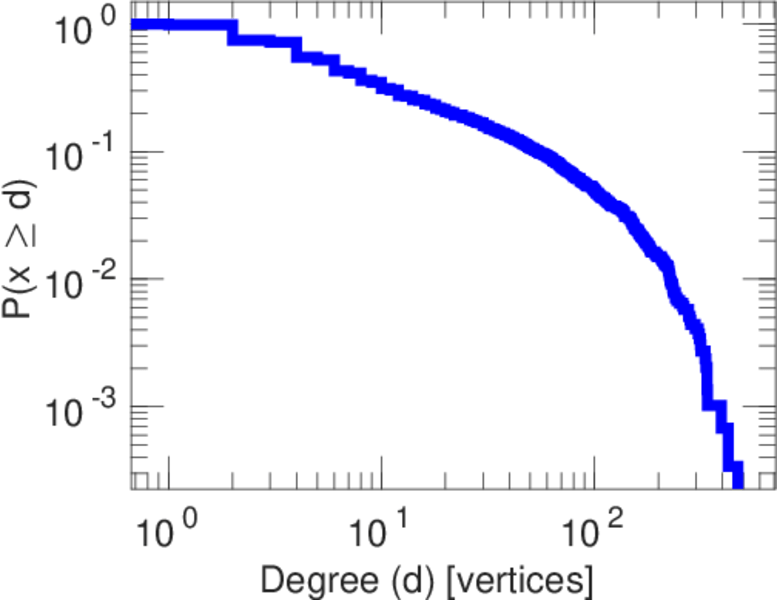
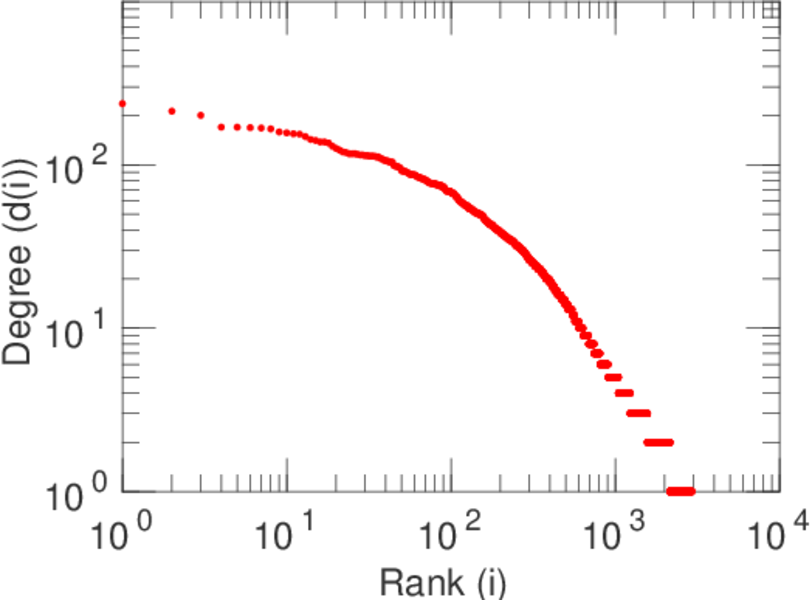
| Maximum degree | dmax = | 473
|
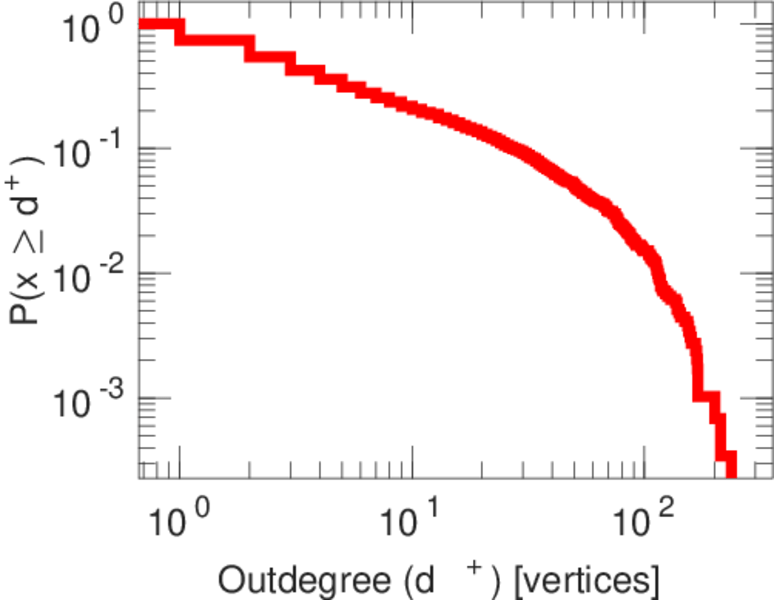
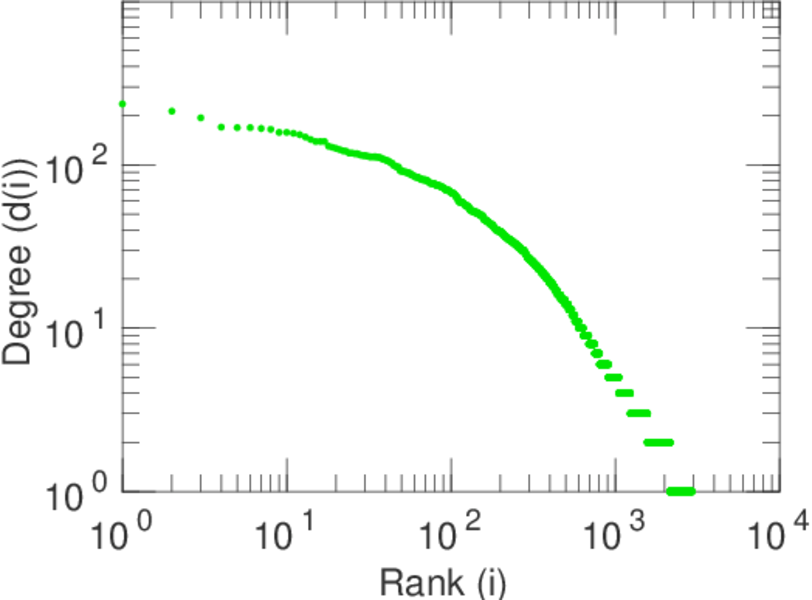
| Maximum outdegree | d+max = | 237
|
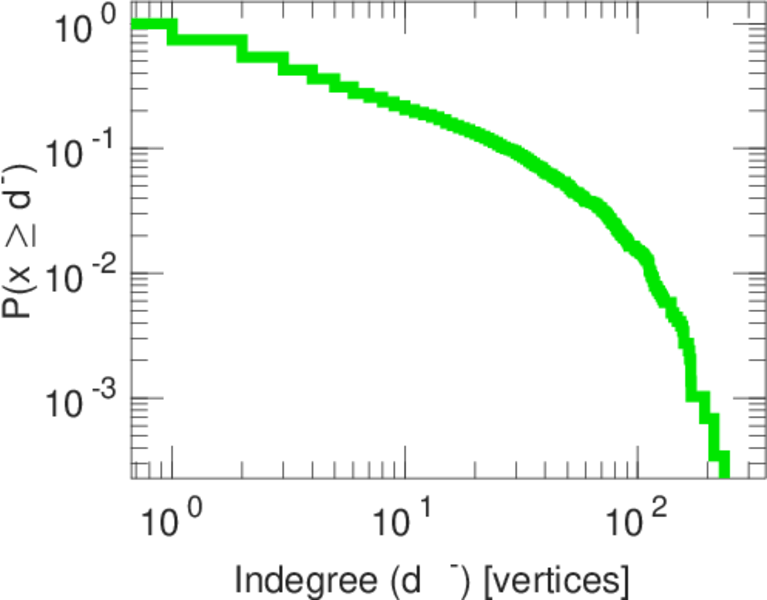
| Maximum indegree | d−max = | 236
|
| Average degree | d = | 20.756 0
|
| Fill | p = | 0.003 532 34
|
| Size of LCC | N = | 2,905
|
| Size of LSCC | Ns = | 2,868
|
| Relative size of LSCC | Nrs = | 0.975 842
|
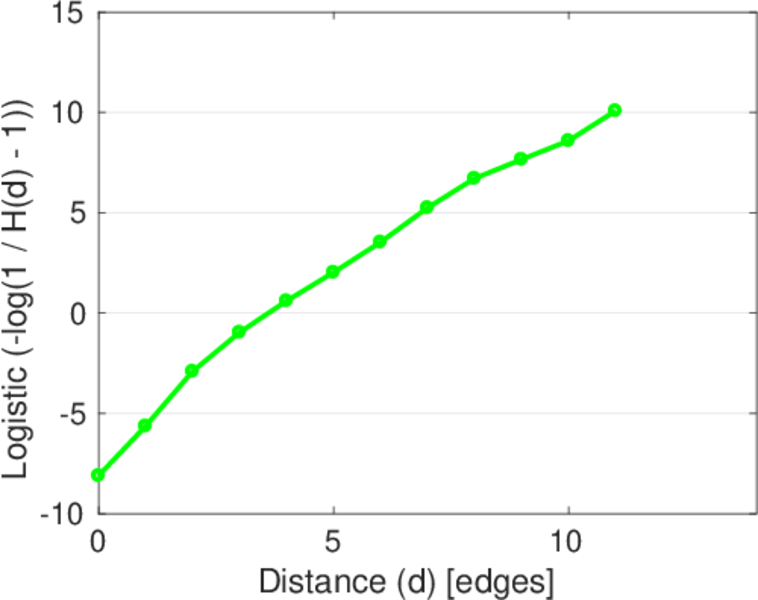
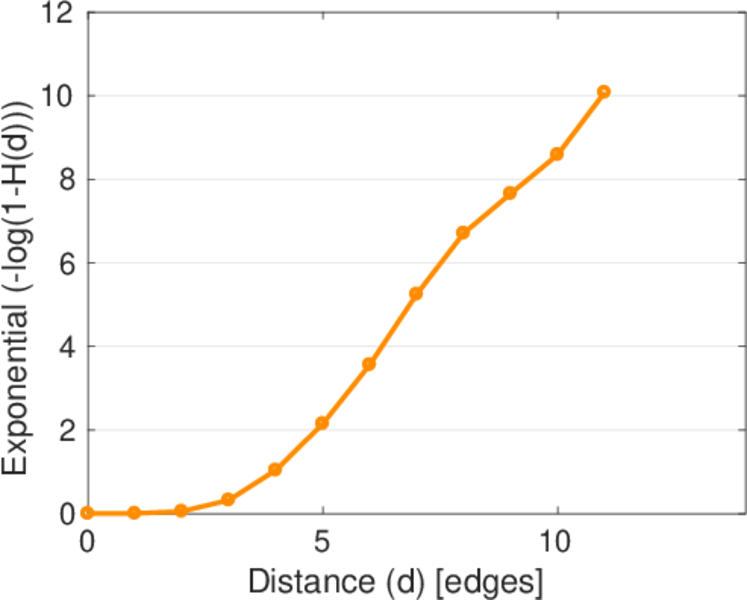
| Diameter | δ = | 14
|
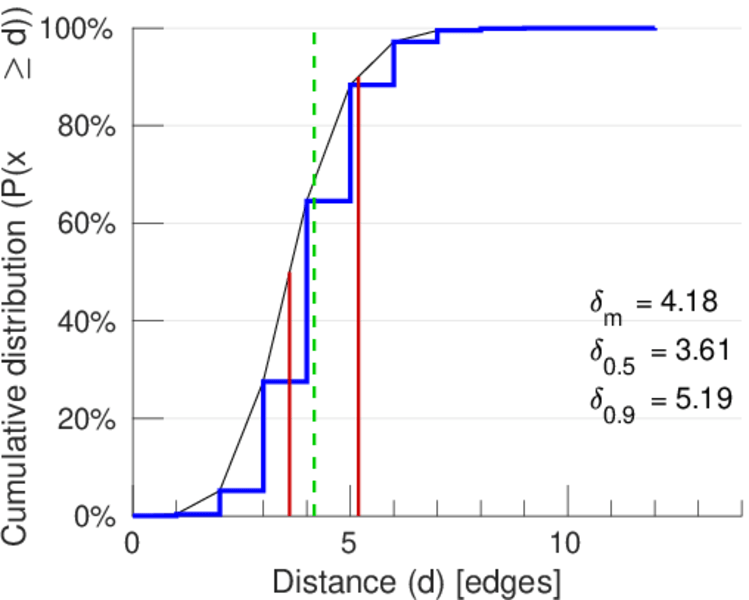
| 50-Percentile effective diameter | δ0.5 = | 3.606 51
|
| 90-Percentile effective diameter | δ0.9 = | 5.189 09
|
| Median distance | δM = | 4
|
| Mean distance | δm = | 4.175 91
|
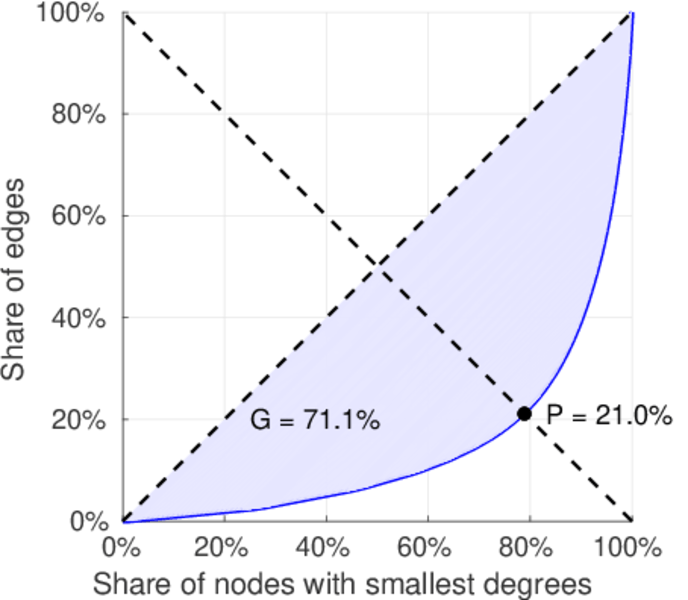
| Gini coefficient | G = | 0.711 349
|
| Balanced inequality ratio | P = | 0.209 583
|
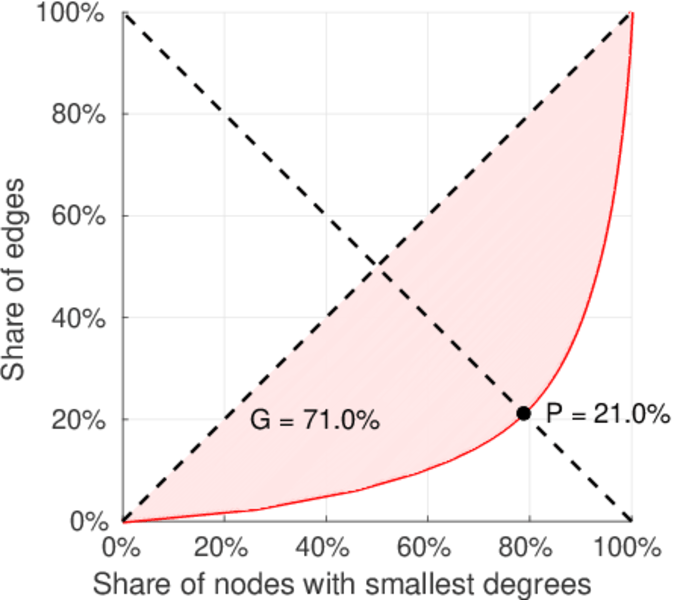
| Outdegree balanced inequality ratio | P+ = | 0.210 387
|
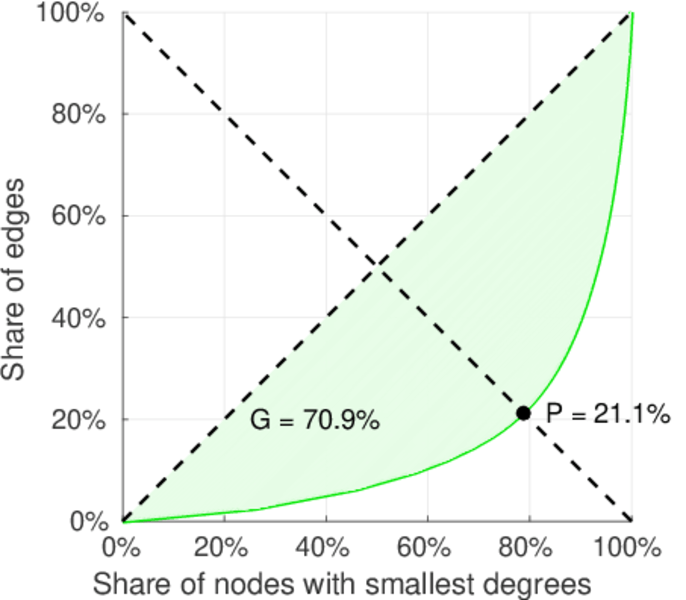
| Indegree balanced inequality ratio | P− = | 0.210 878
|
| Relative edge distribution entropy | Her = | 0.868 671
|
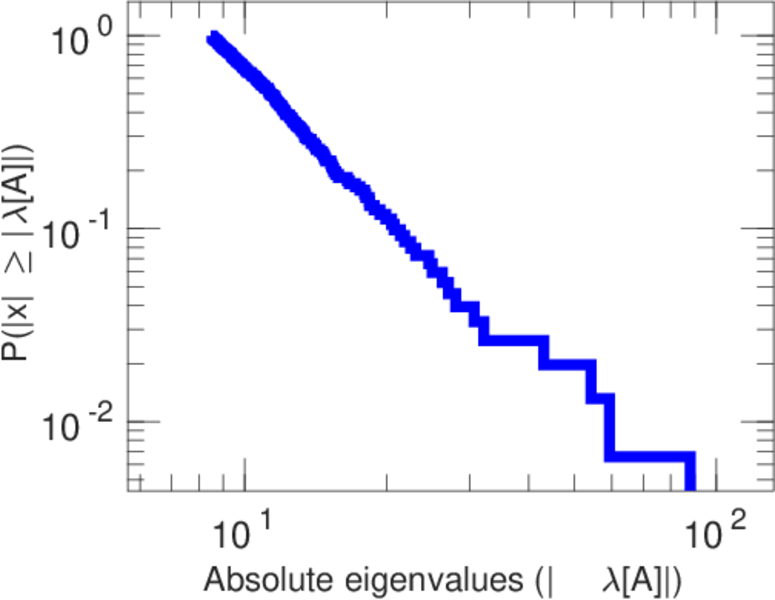
| Power law exponent | γ = | 1.722 69
|
| Tail power law exponent | γt = | 1.741 00
|
| Tail power law exponent with p | γ3 = | 1.741 00
|
| p-value | p = | 0.000 00
|
| Outdegree tail power law exponent with p | γ3,o = | 1.731 00
|
| Outdegree p-value | po = | 0.000 00
|
| Indegree tail power law exponent with p | γ3,i = | 1.731 00
|
| Indegree p-value | pi = | 0.000 00
|
| Degree assortativity | ρ = | +0.050 915 5
|
| Degree assortativity p-value | pρ = | 1.861 44 × 10−19
|
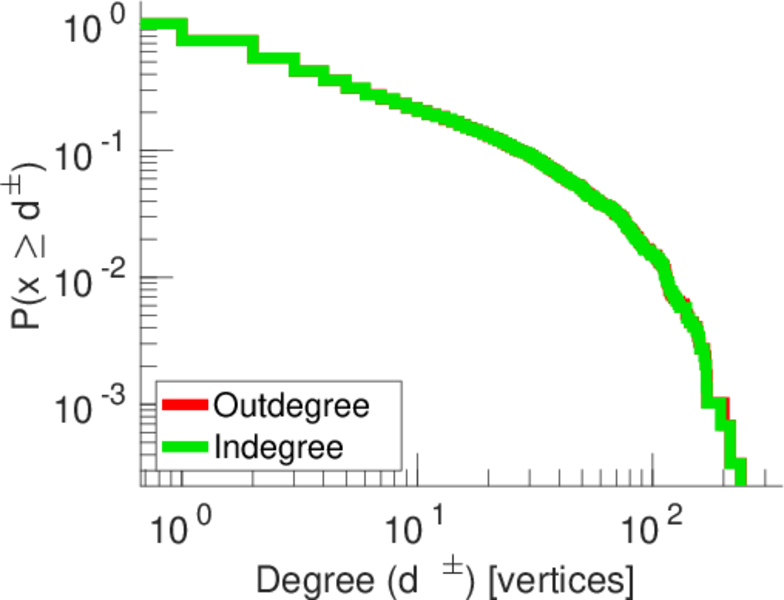
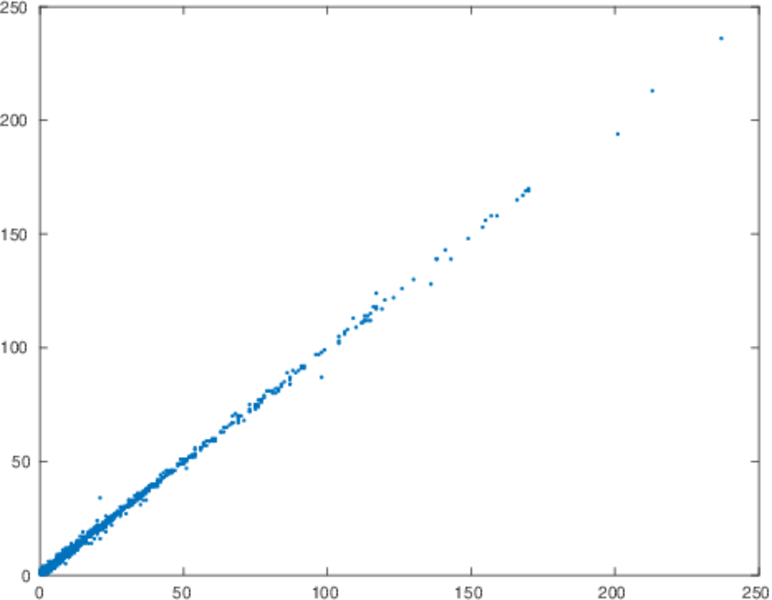
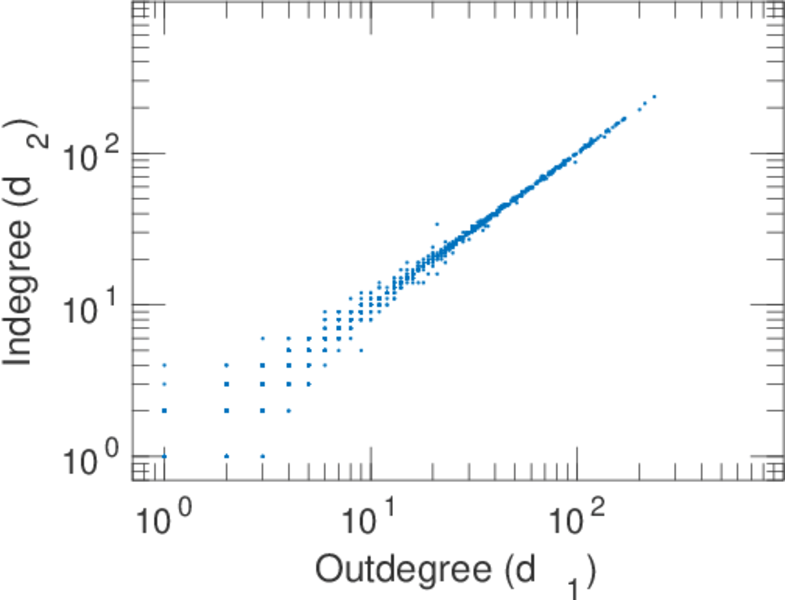
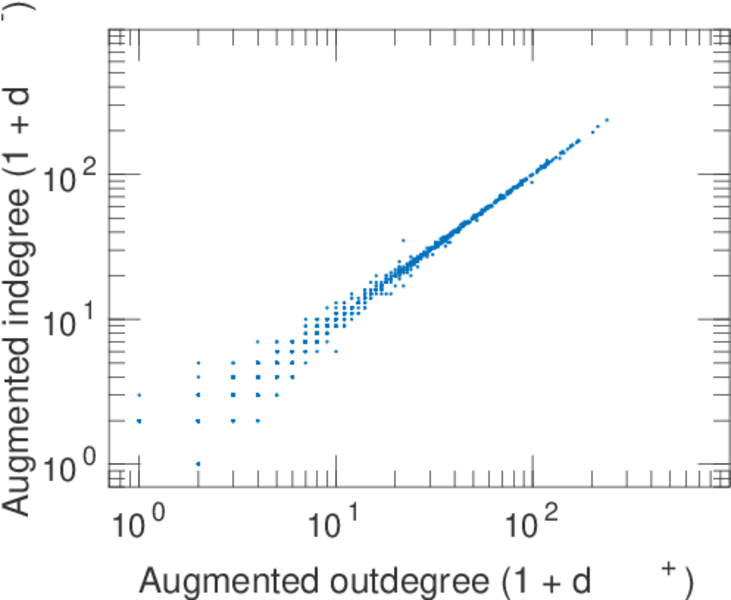
| In/outdegree correlation | ρ± = | +0.992 291
|
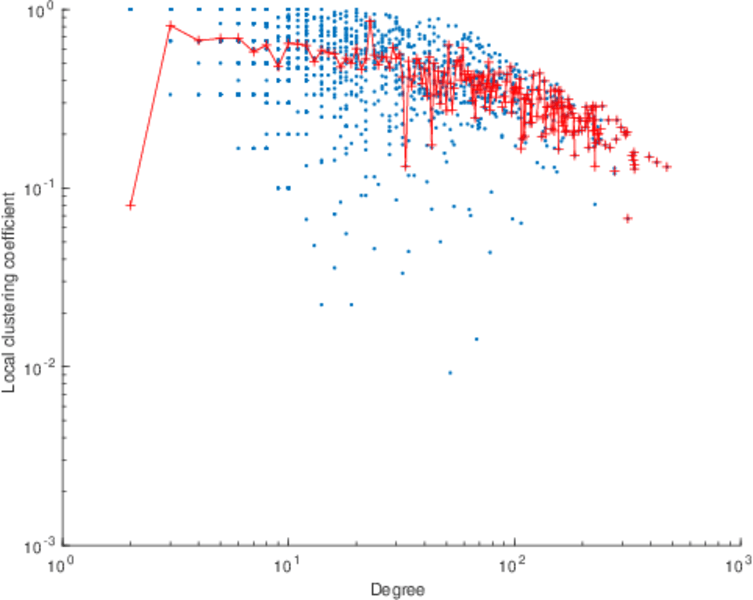
| Clustering coefficient | c = | 0.254 718
|
| Directed clustering coefficient | c± = | 0.254 319
|
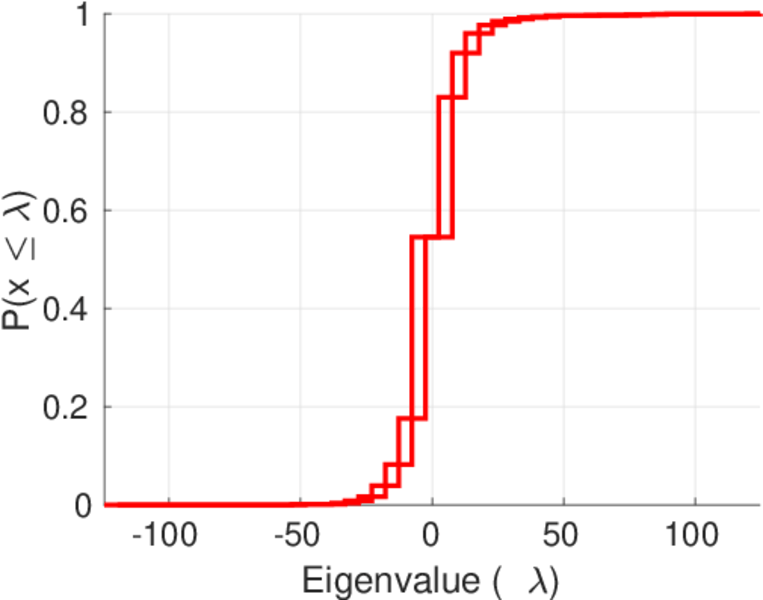
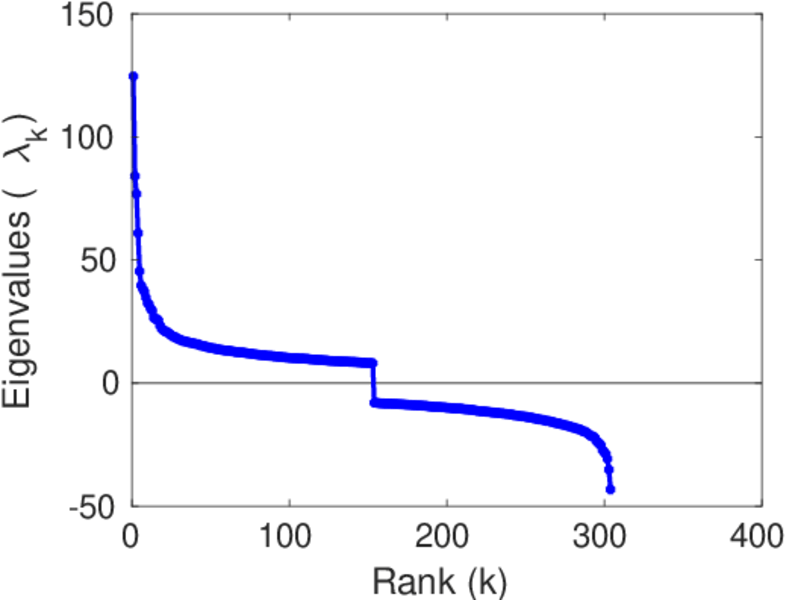
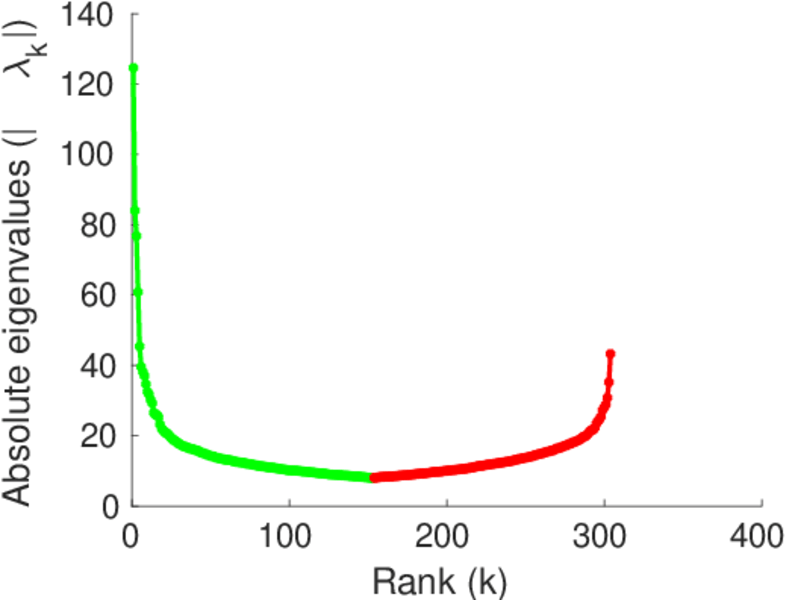
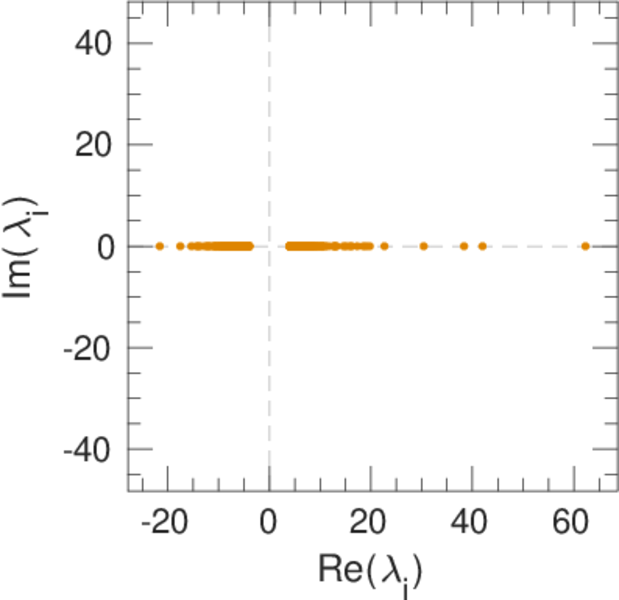
| Spectral norm | α = | 124.591
|
| Operator 2-norm | ν = | 62.311 7
|
| Cyclic eigenvalue | π = | 62.280 0
|
| Algebraic connectivity | a = | 0.078 388 5
|
| Spectral separation | |λ1[A] / λ2[A]| = | 1.483 18
|
| Reciprocity | y = | 0.972 034
|
| Non-bipartivity | bA = | 0.652 641
|
| Normalized non-bipartivity | bN = | 0.030 222 1
|
| Algebraic non-bipartivity | χ = | 0.052 326 2
|
| Spectral bipartite frustration | bK = | 0.001 214 51
|
| Controllability | C = | 905
|
| Relative controllability | Cr = | 0.307 928
|
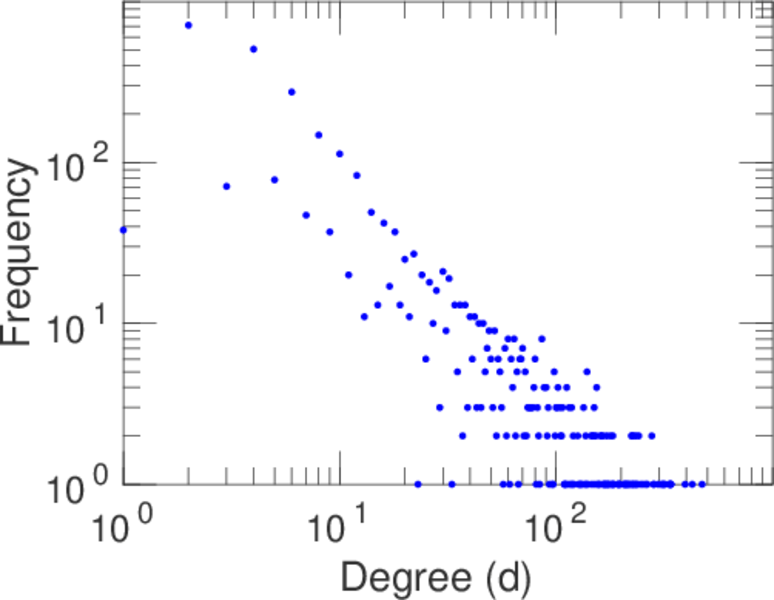
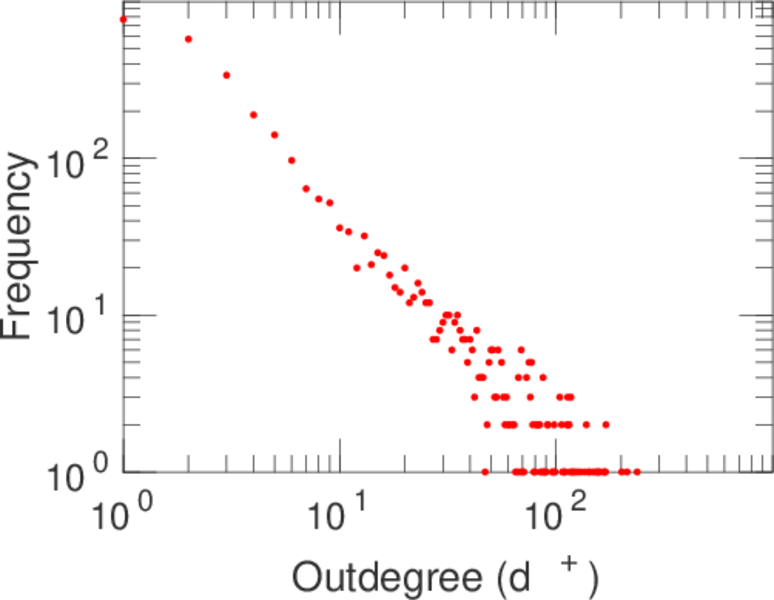
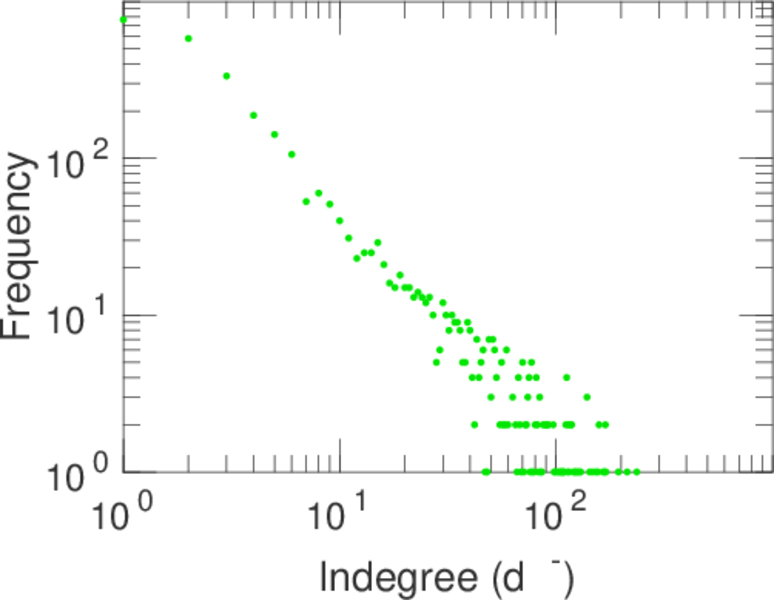
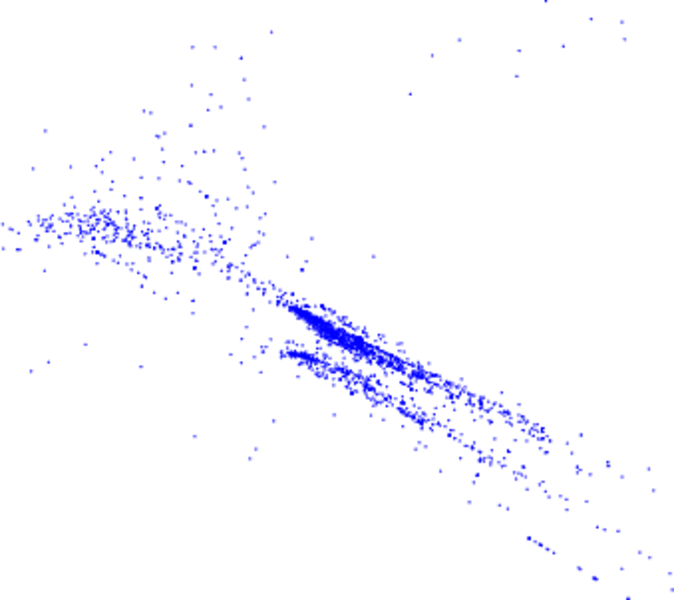
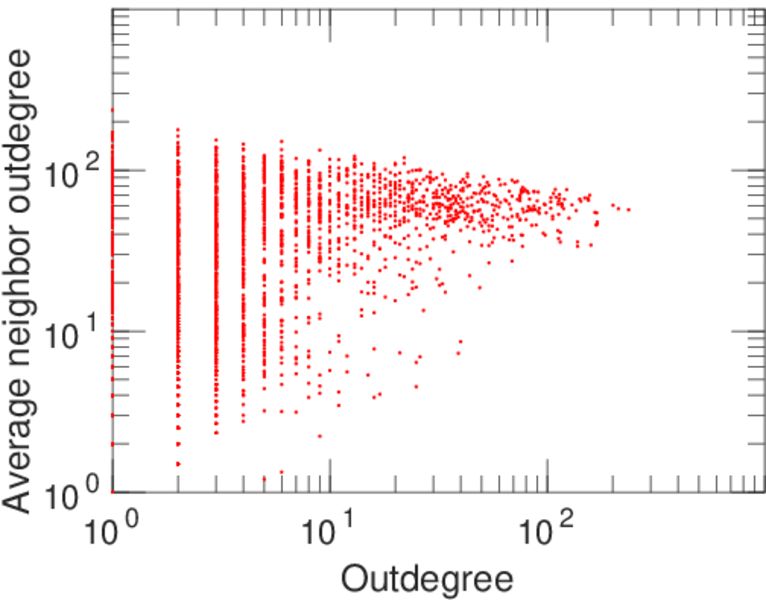
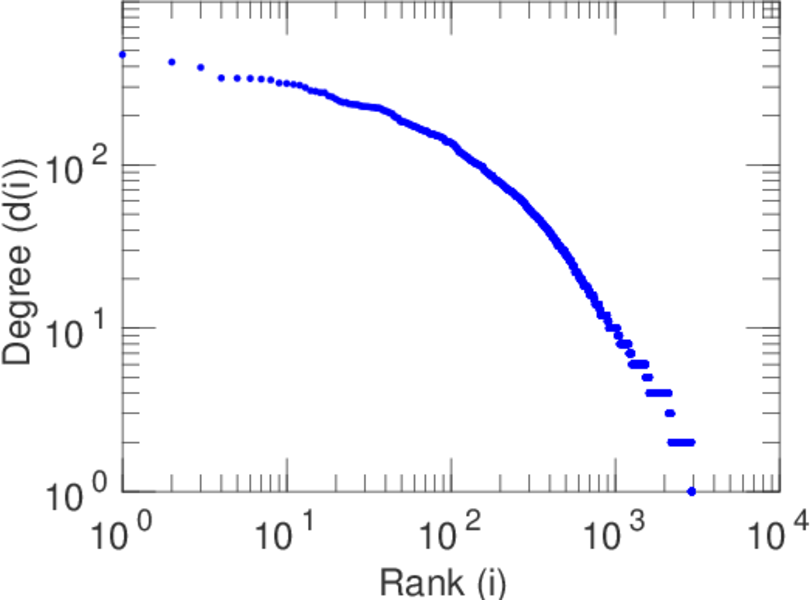
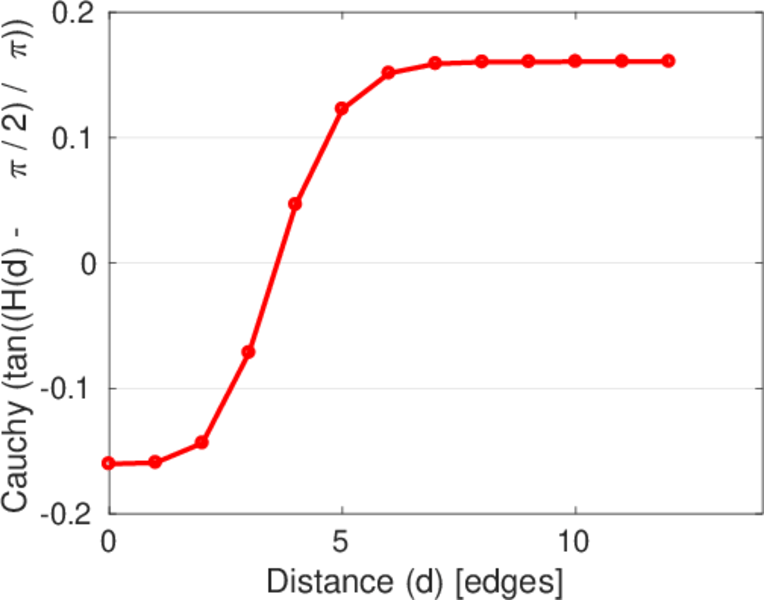
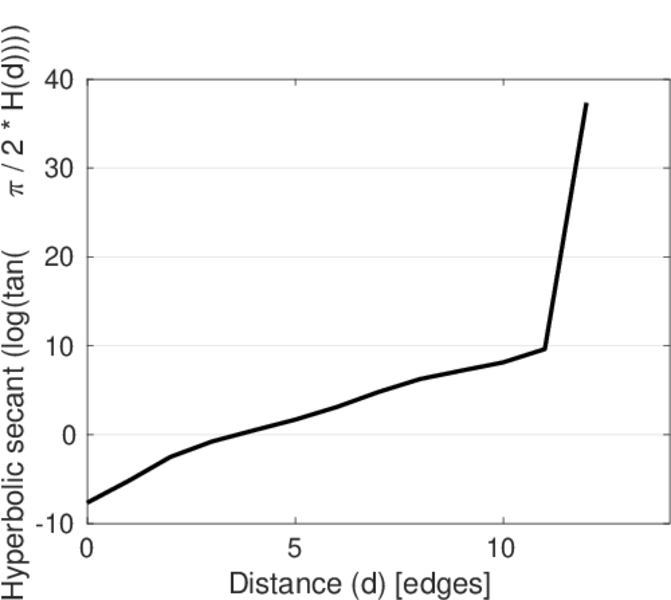
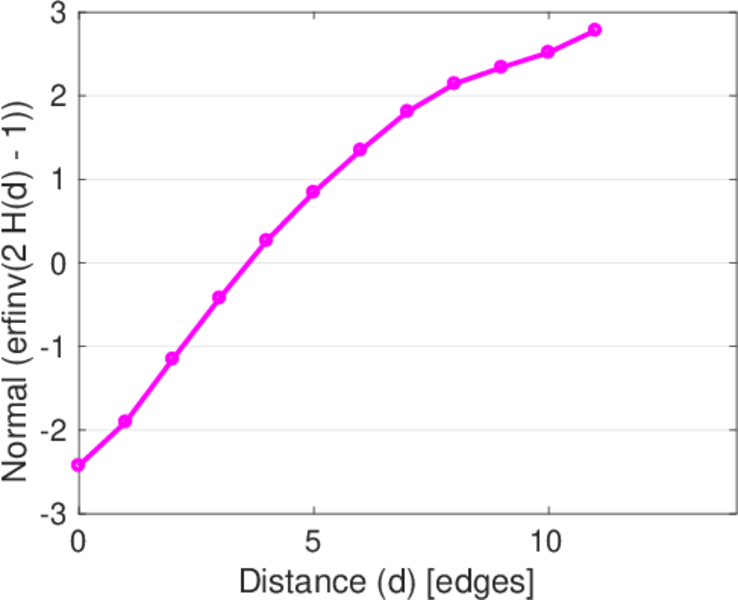
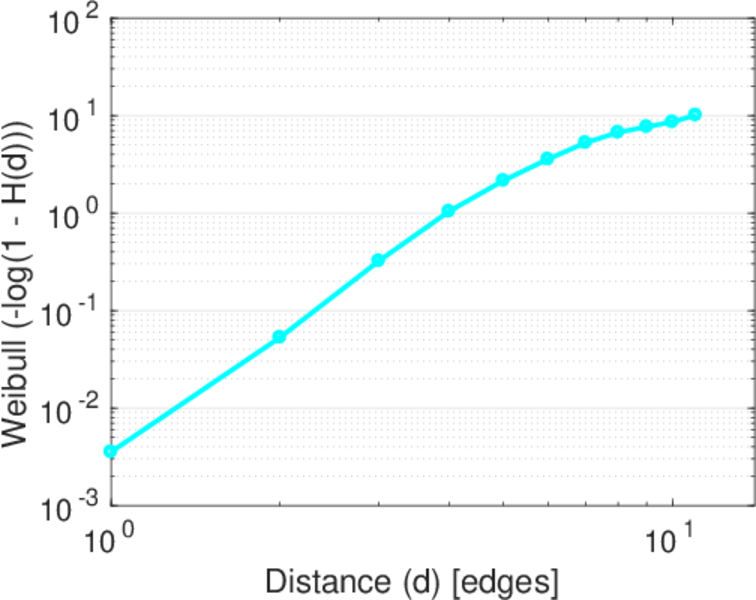
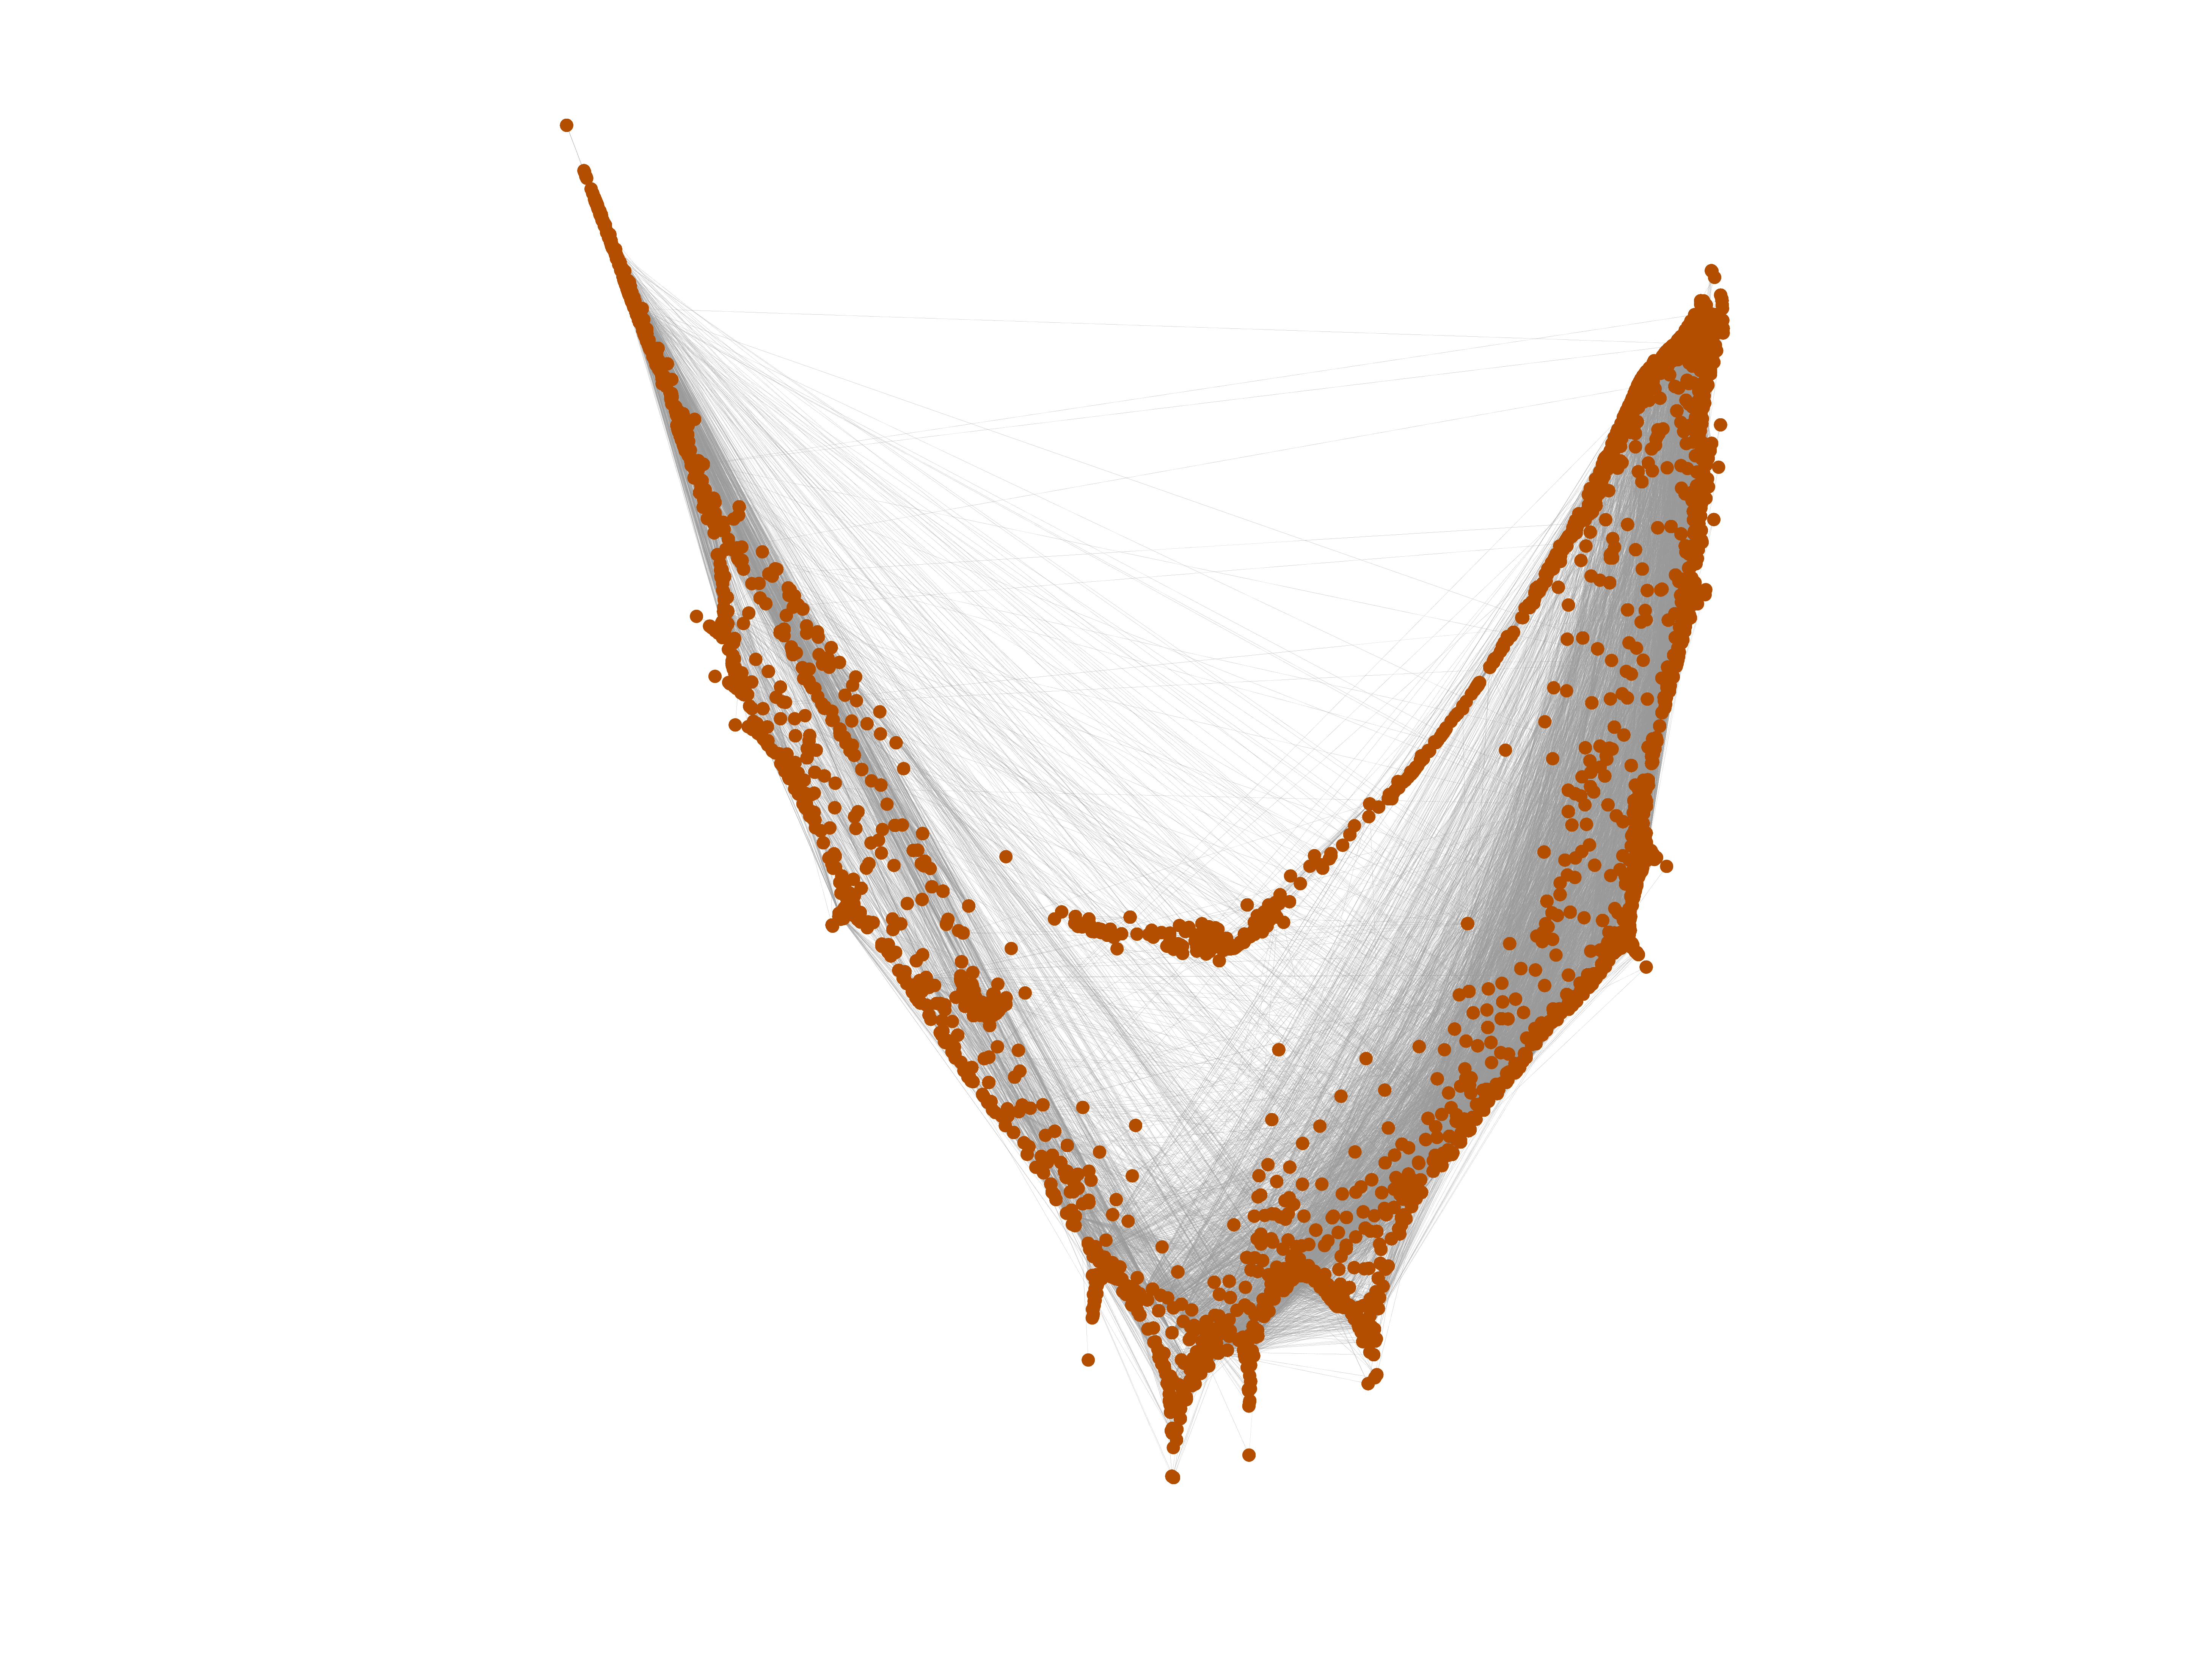
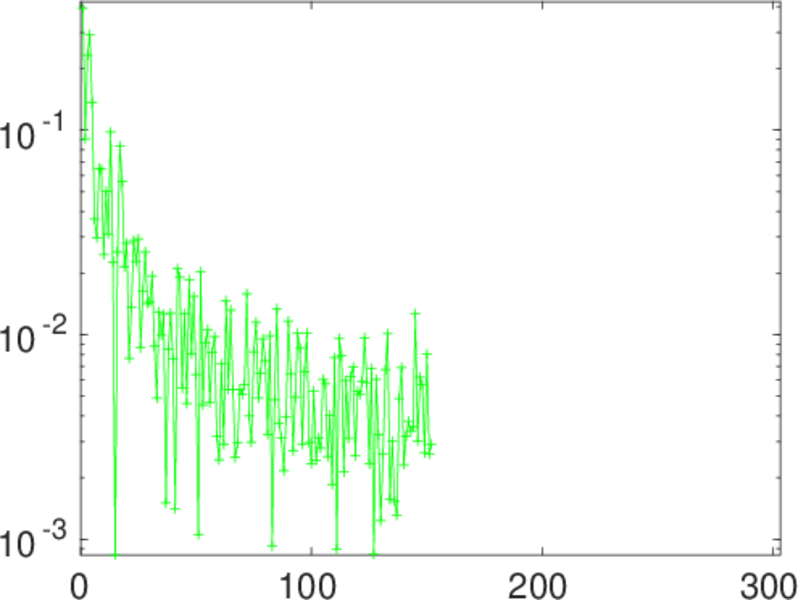
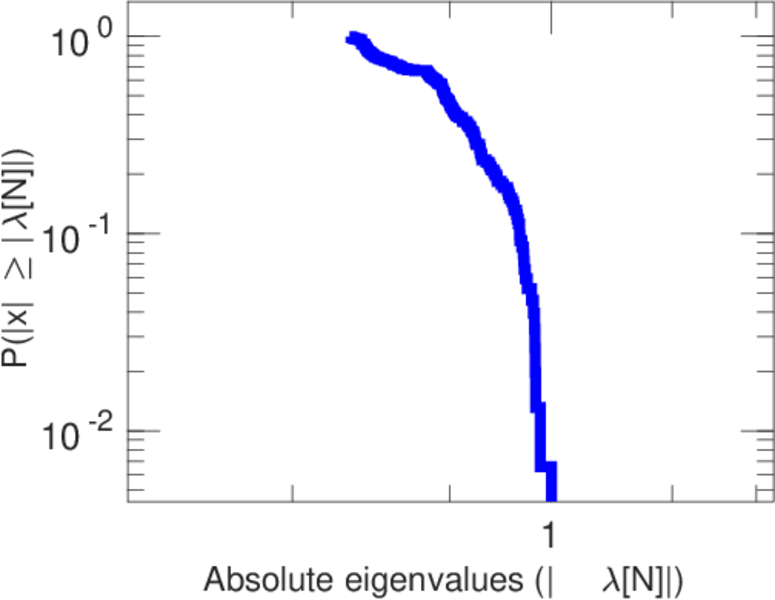
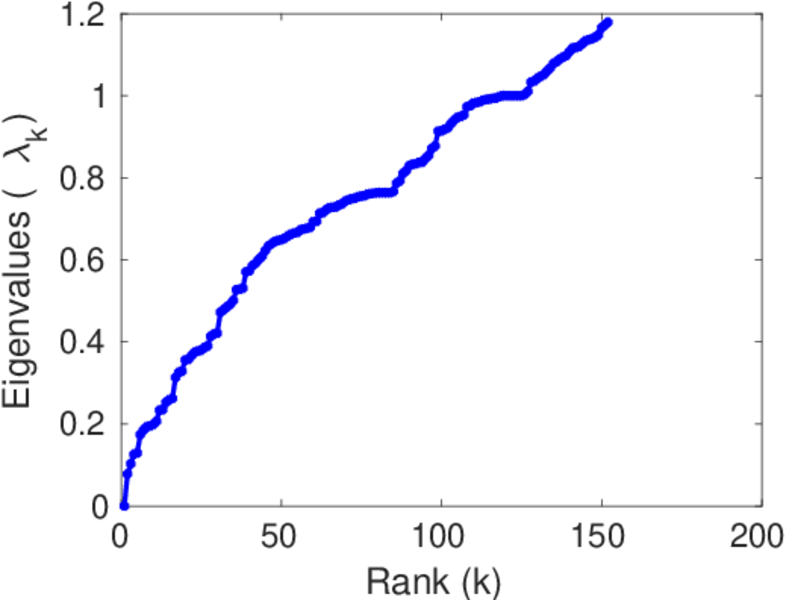
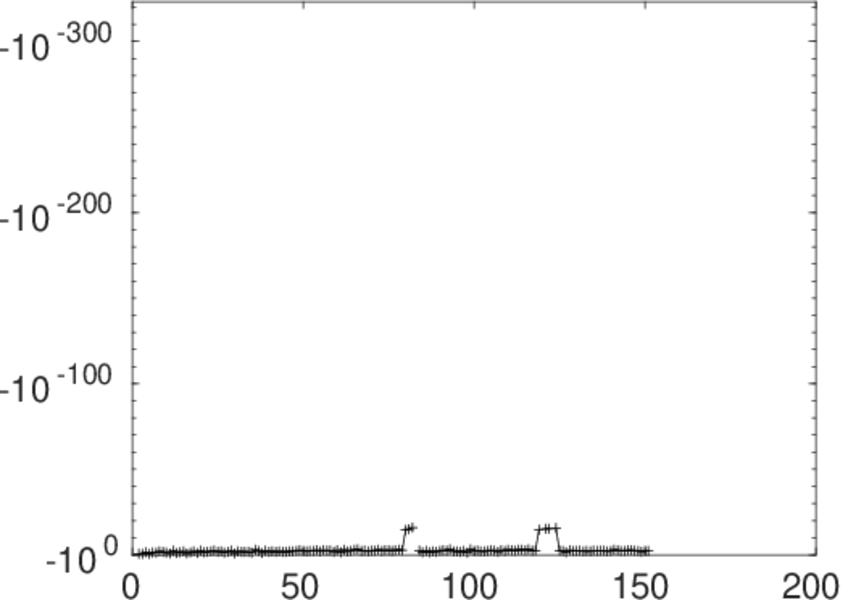
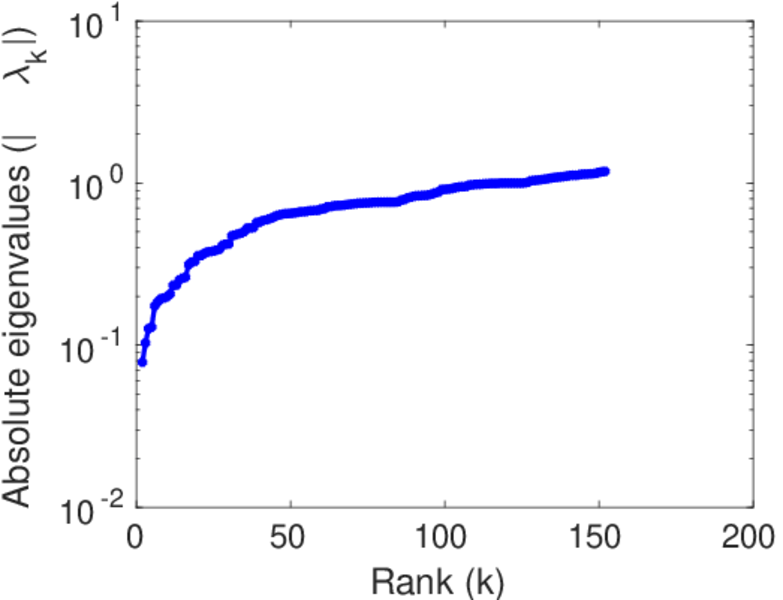
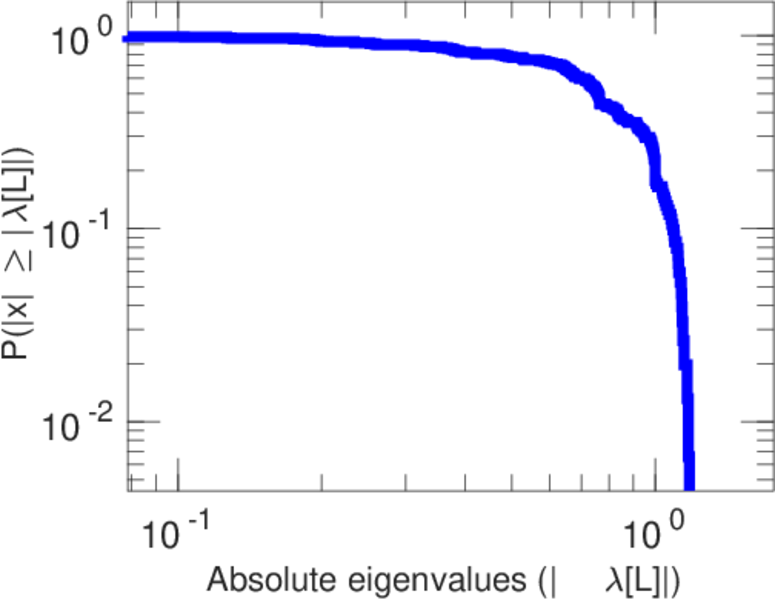
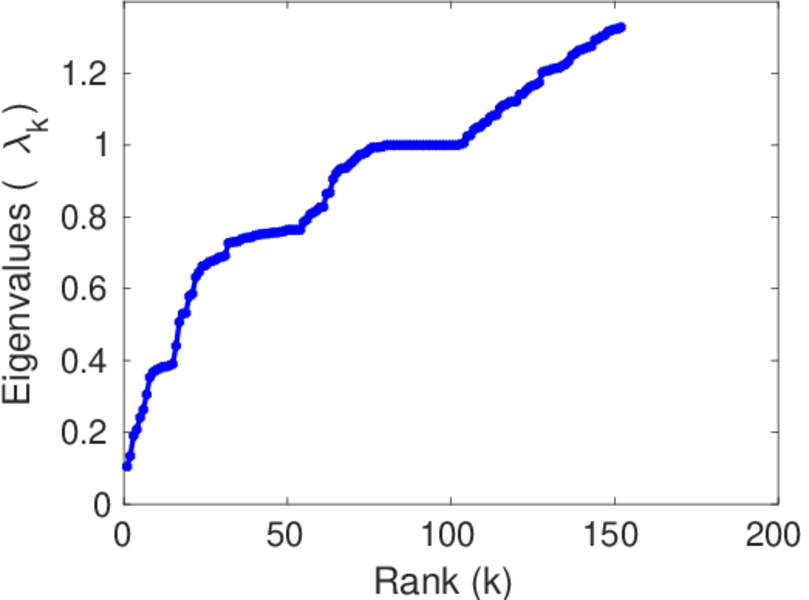
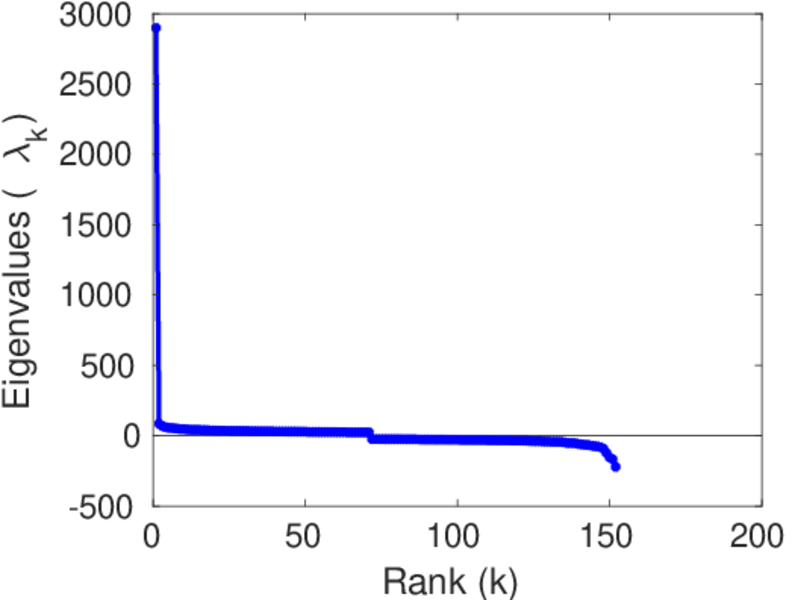
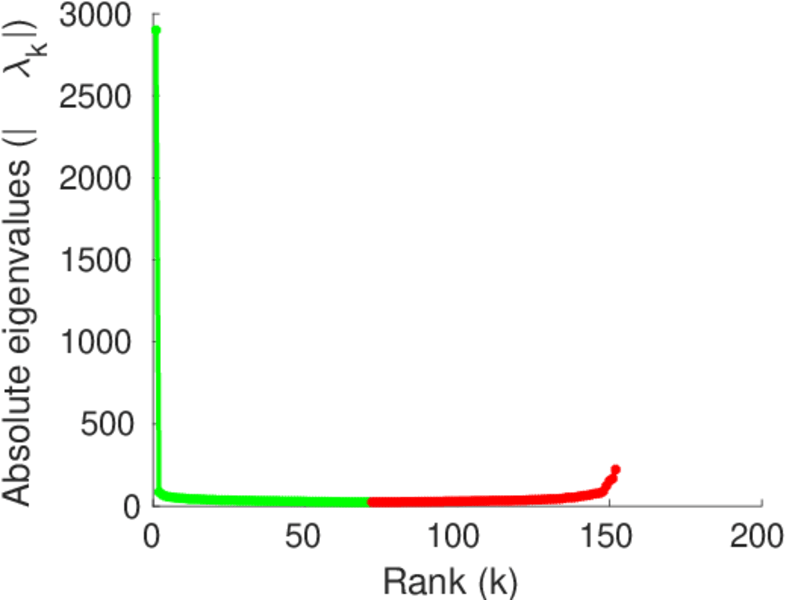
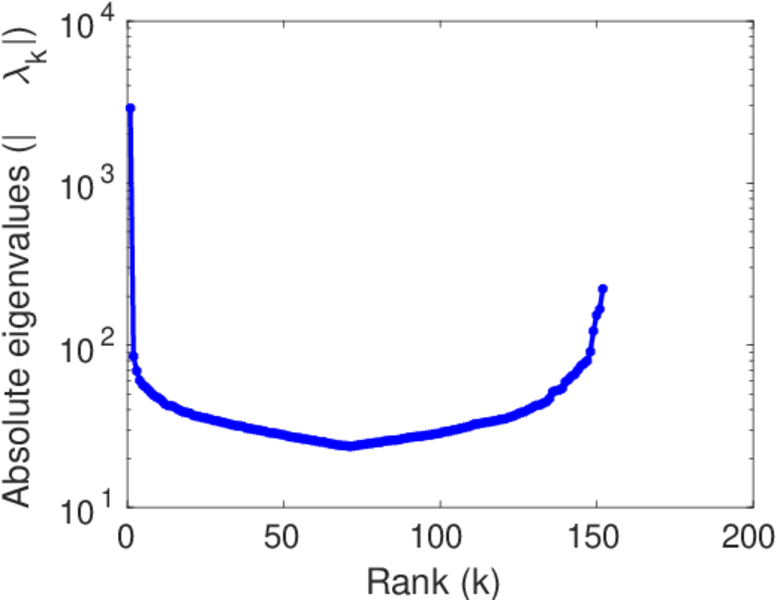
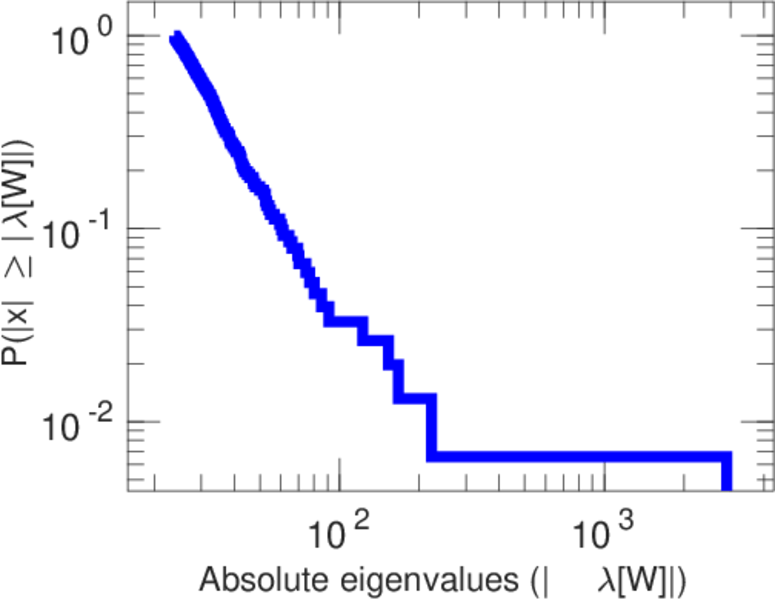
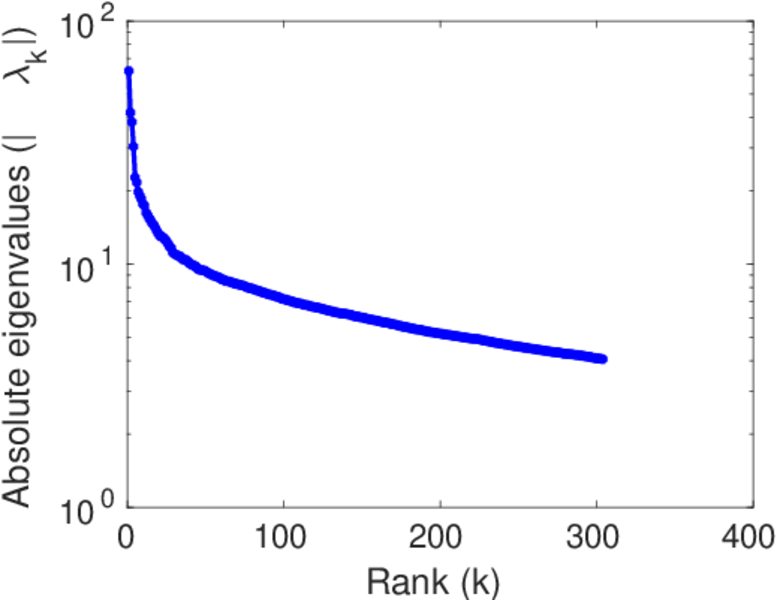
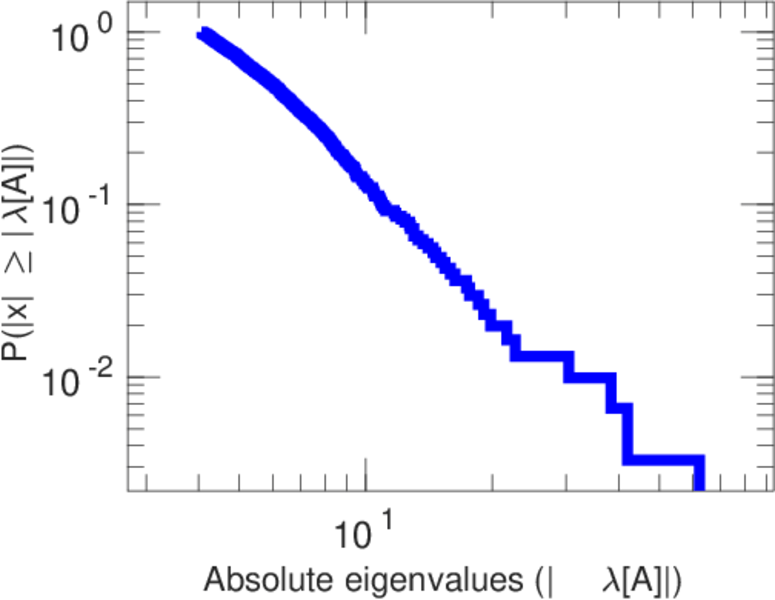
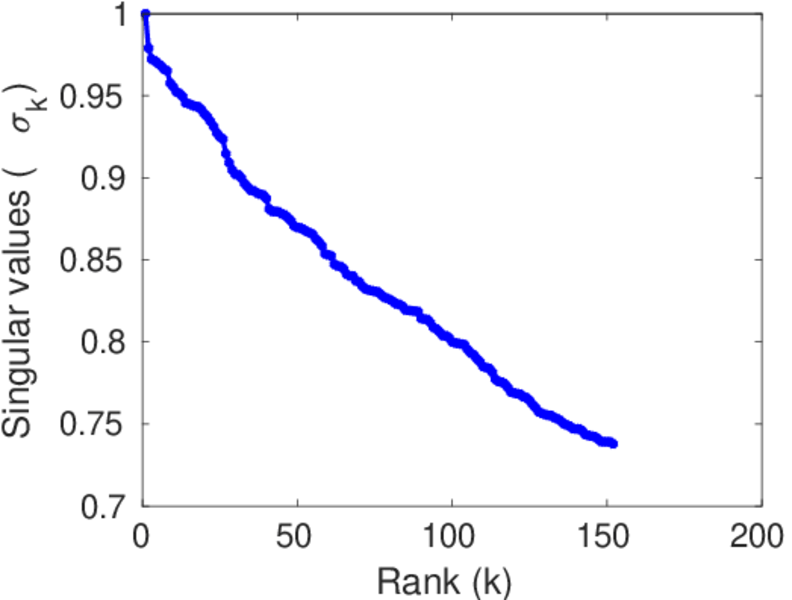
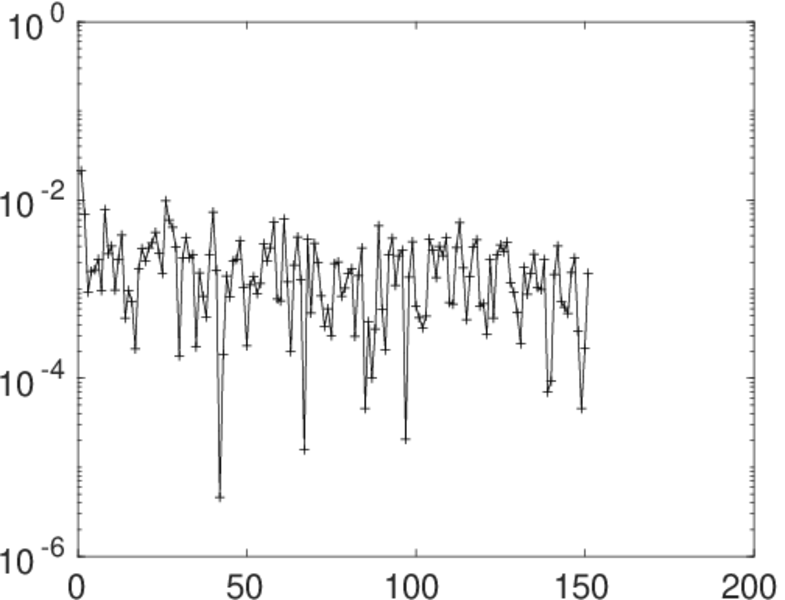
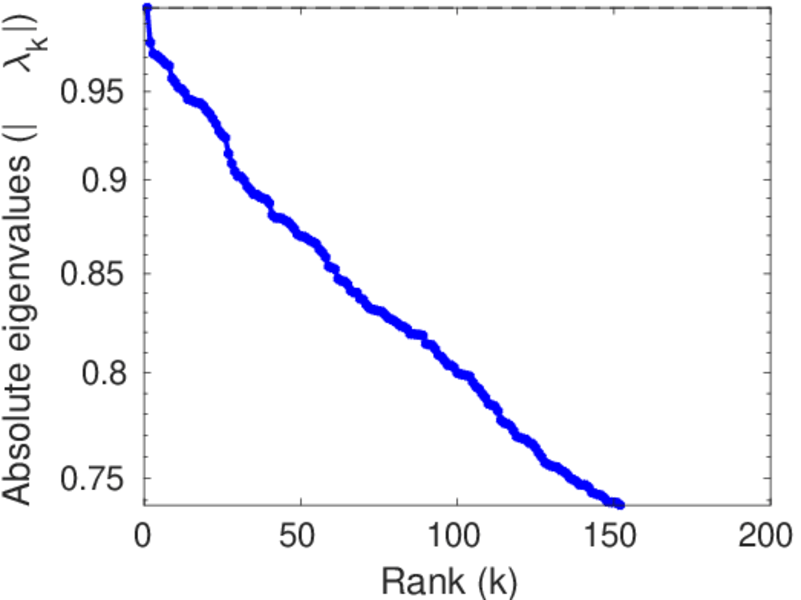
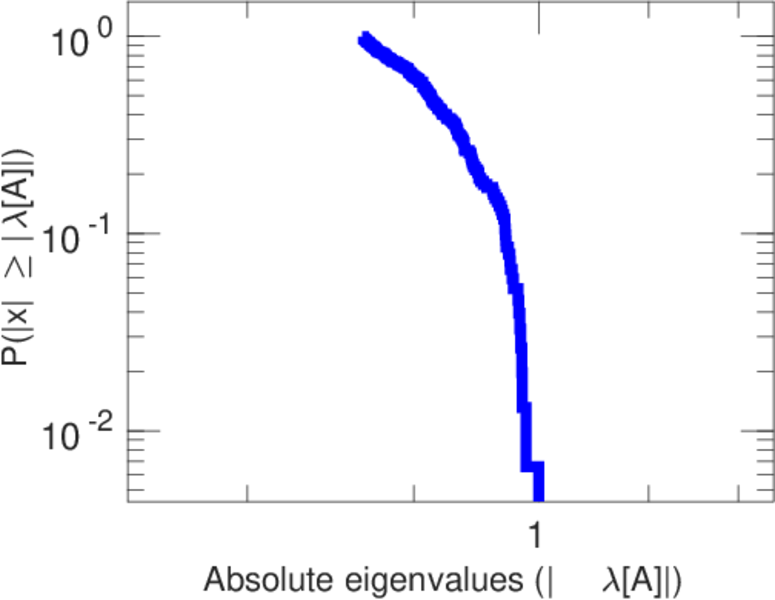
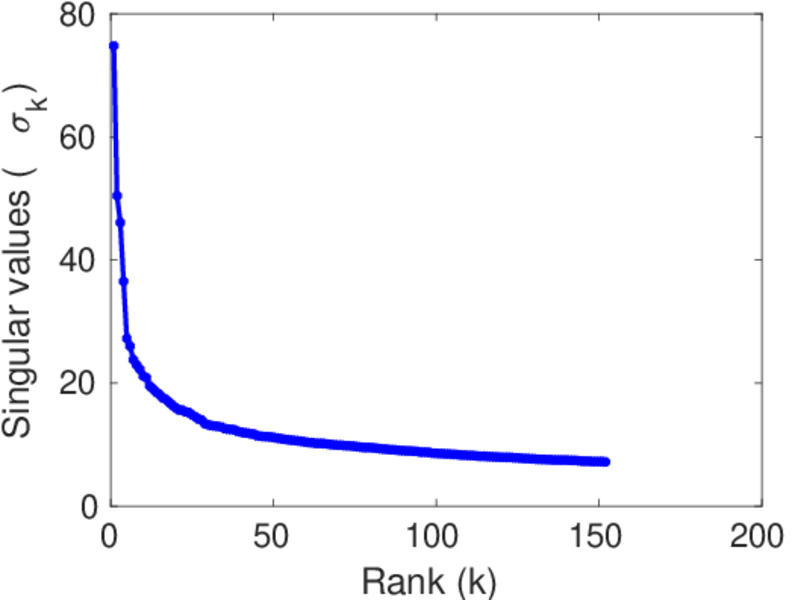
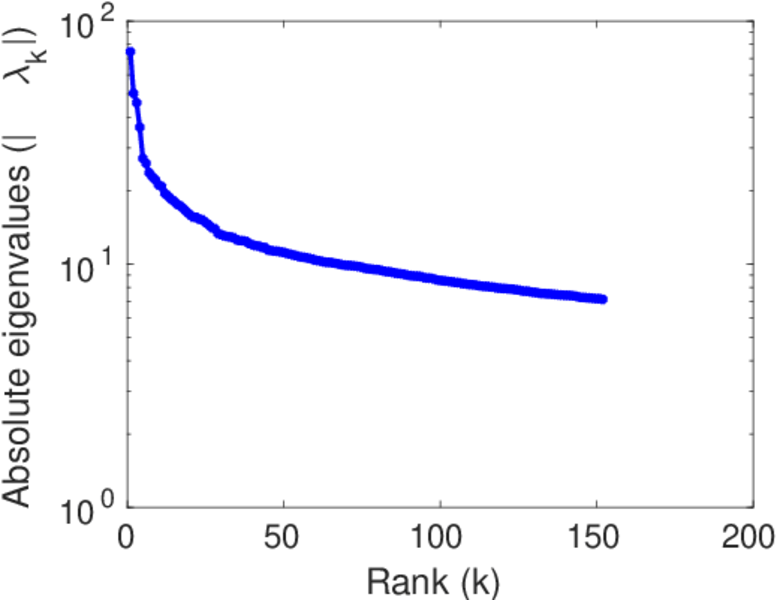
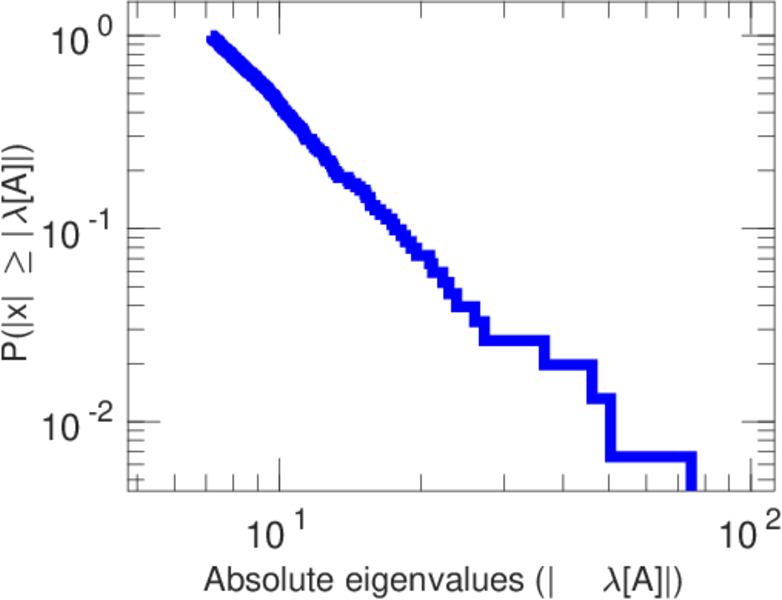
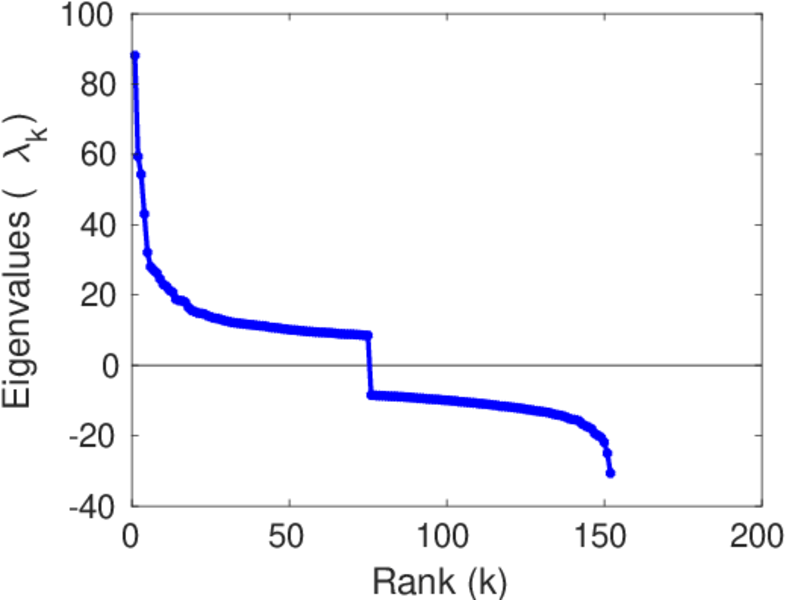
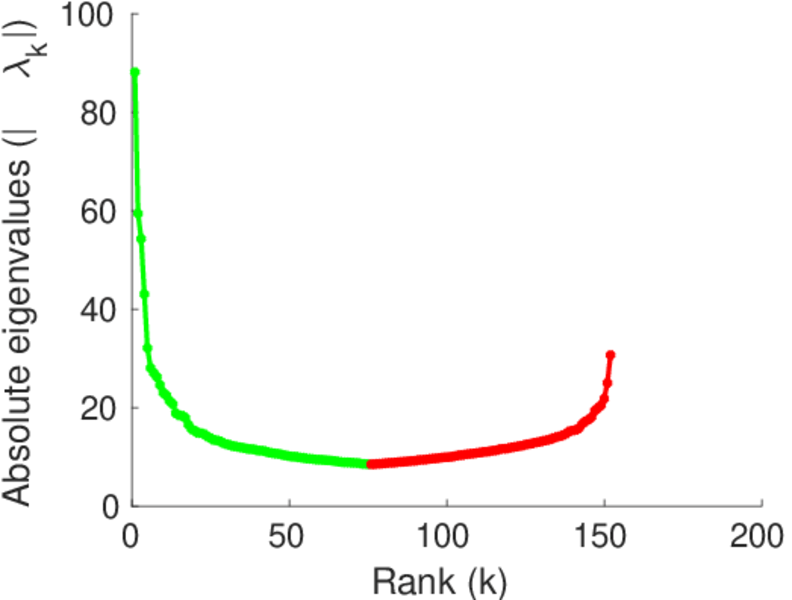
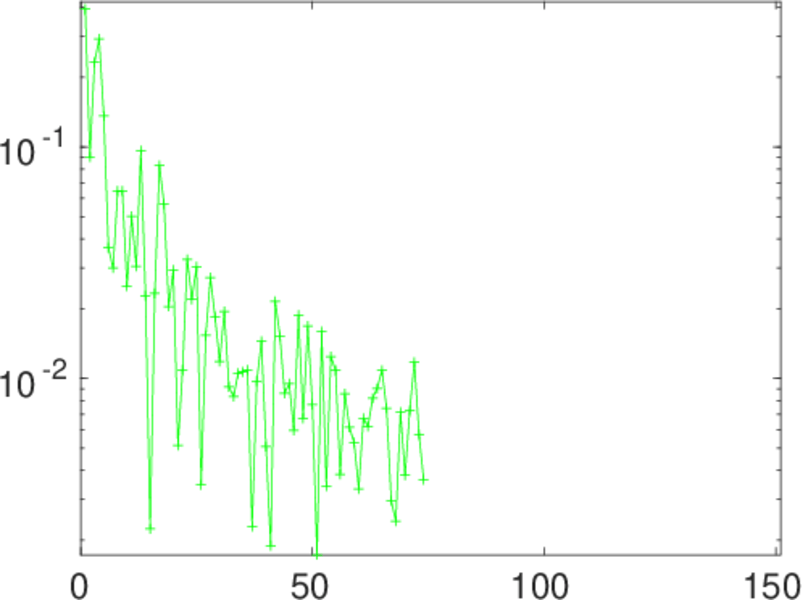
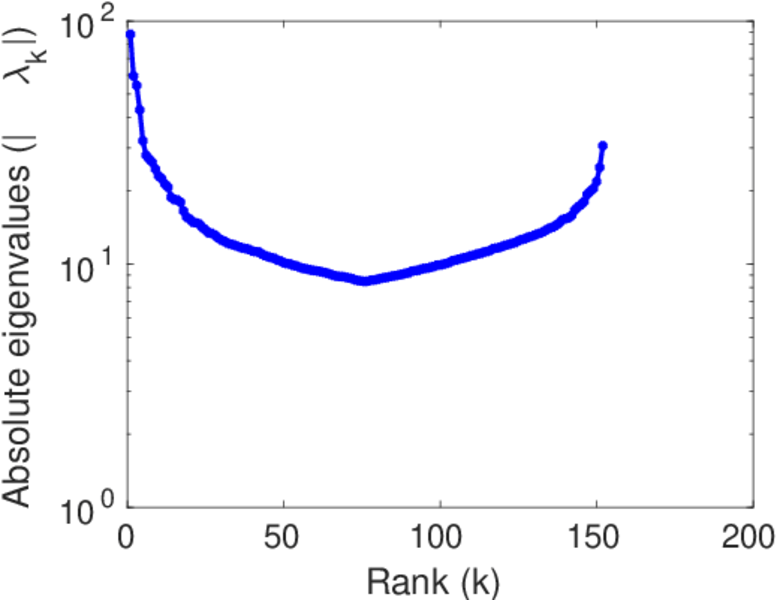
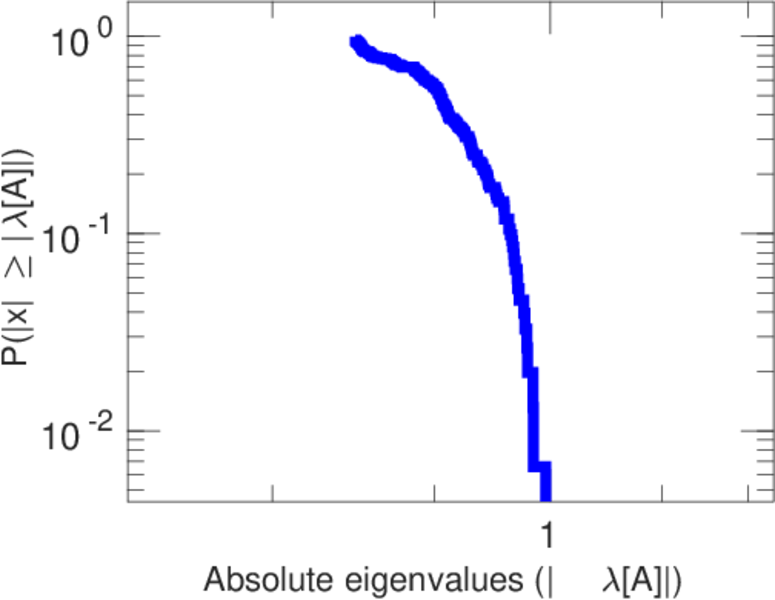
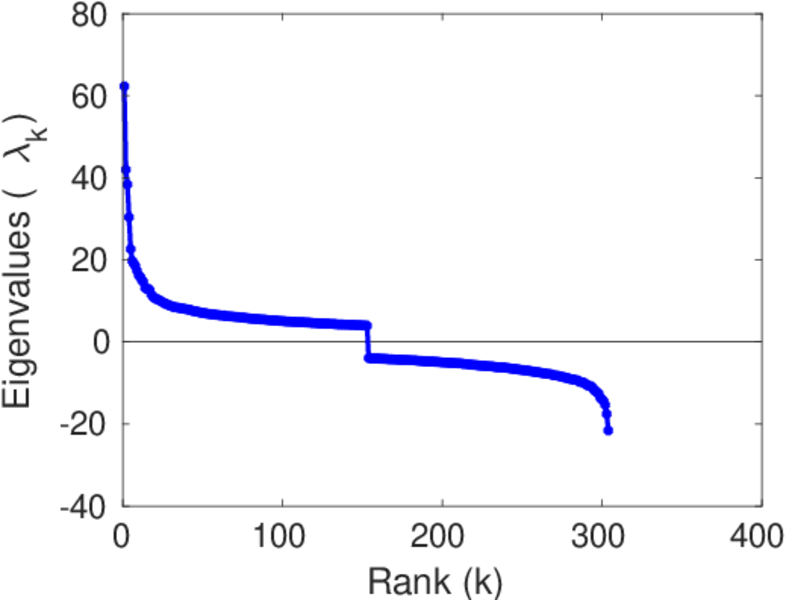
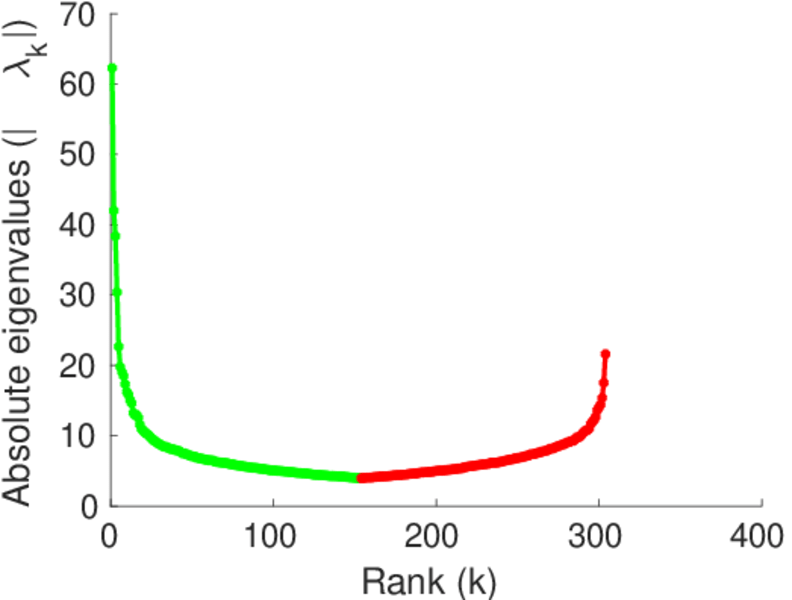
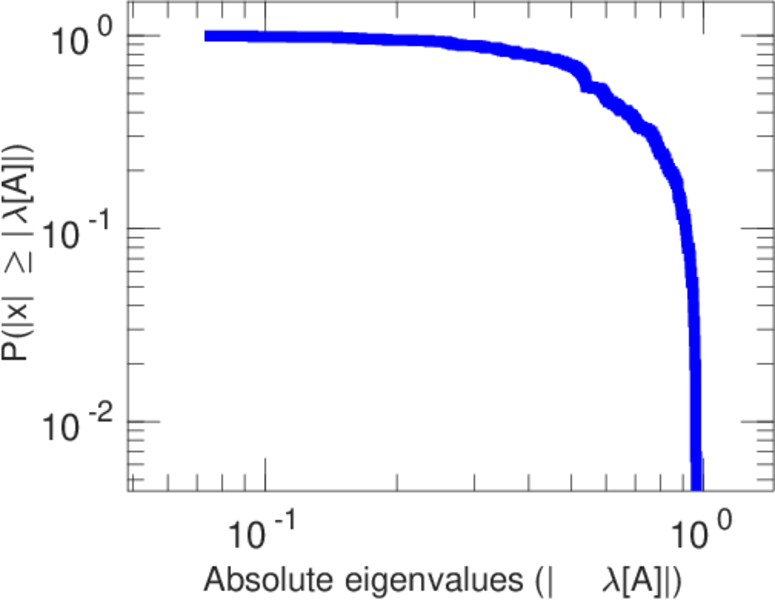
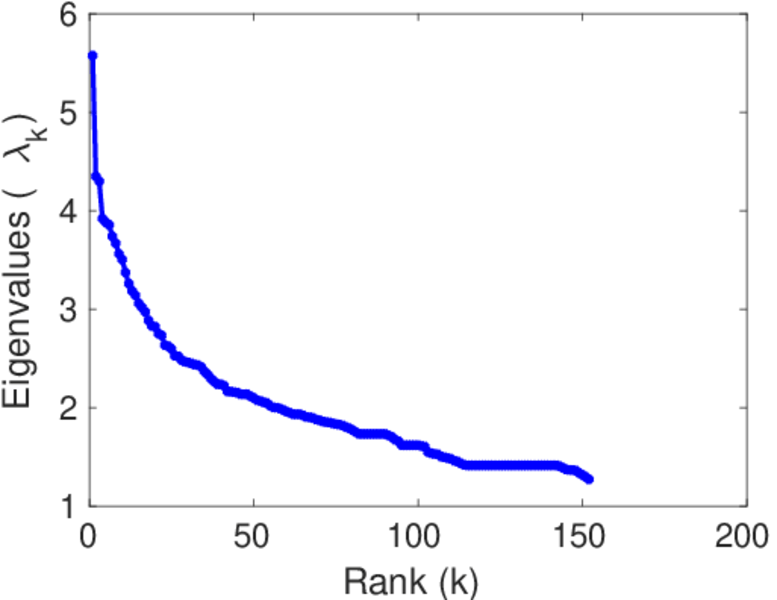
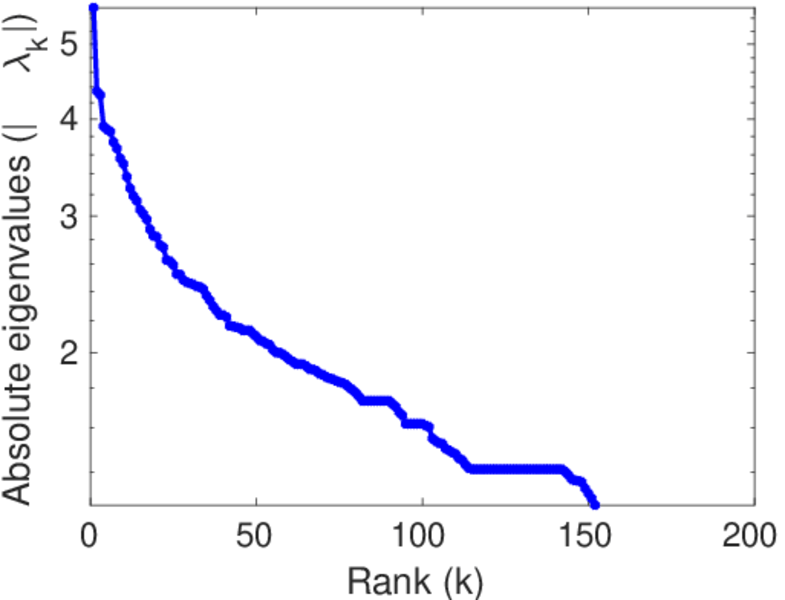
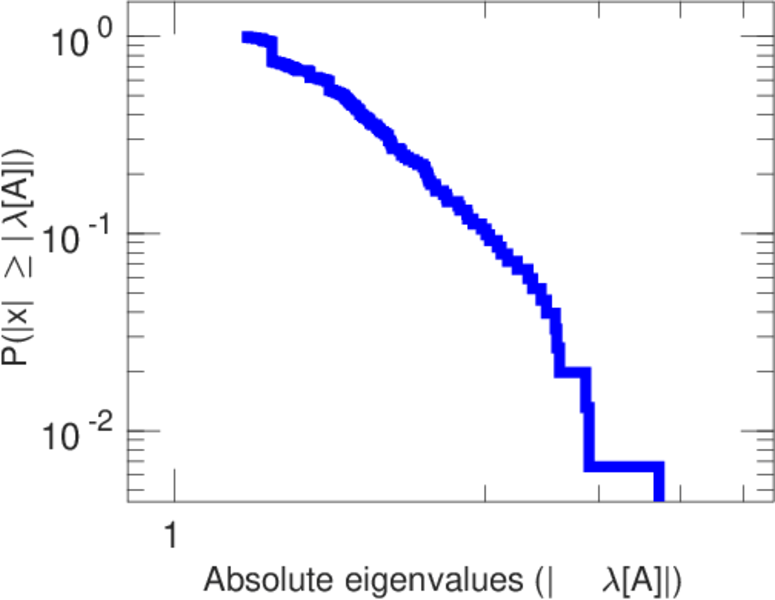
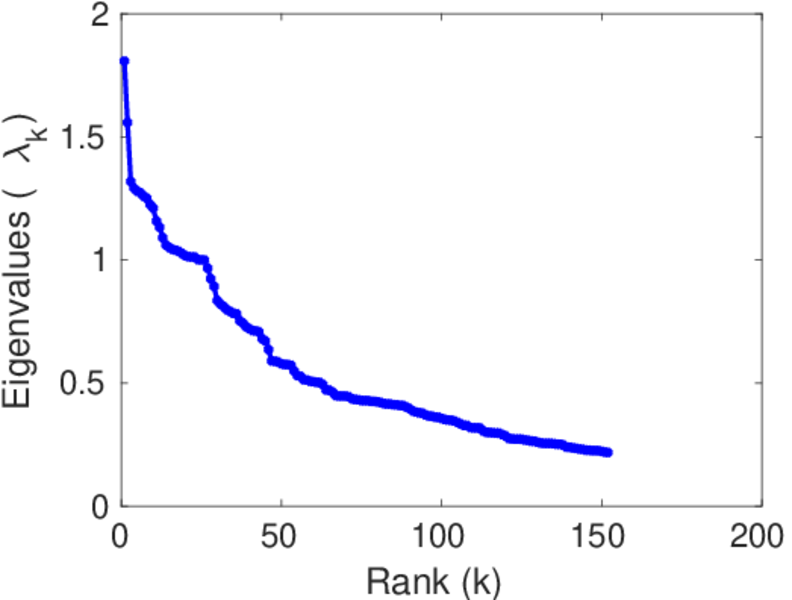
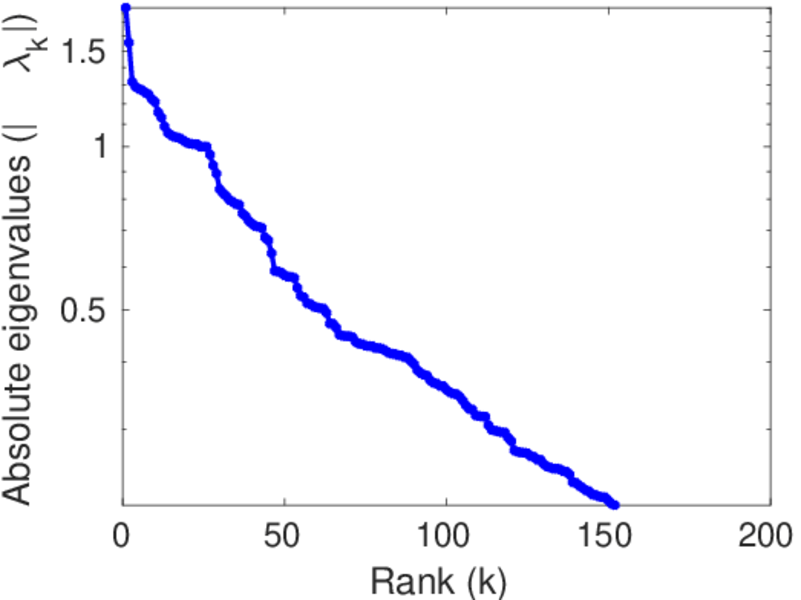
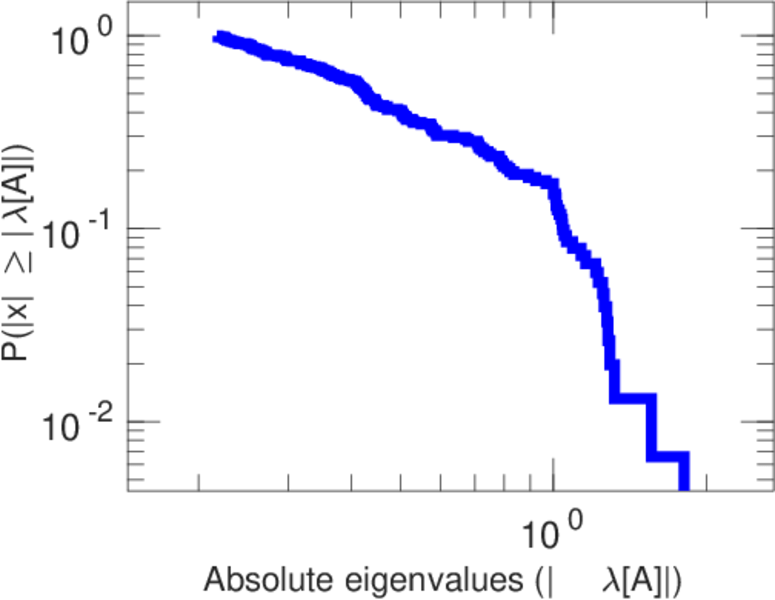
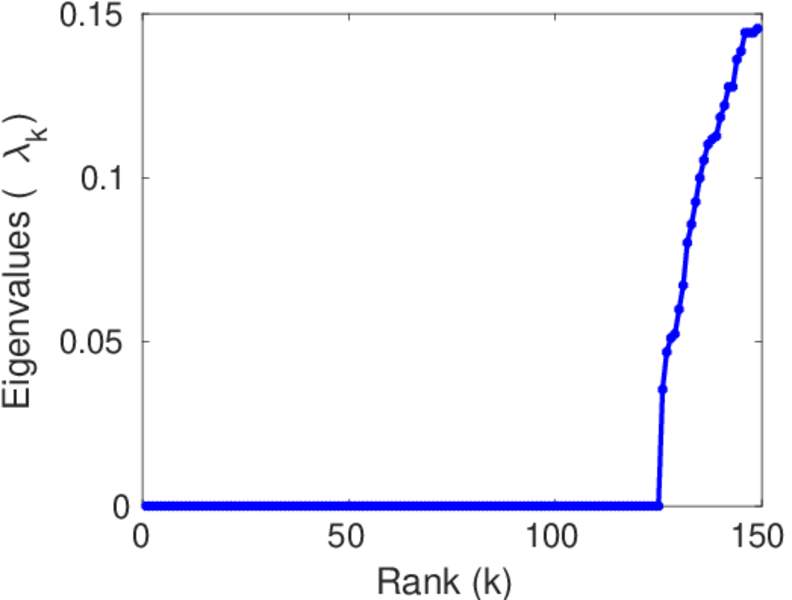
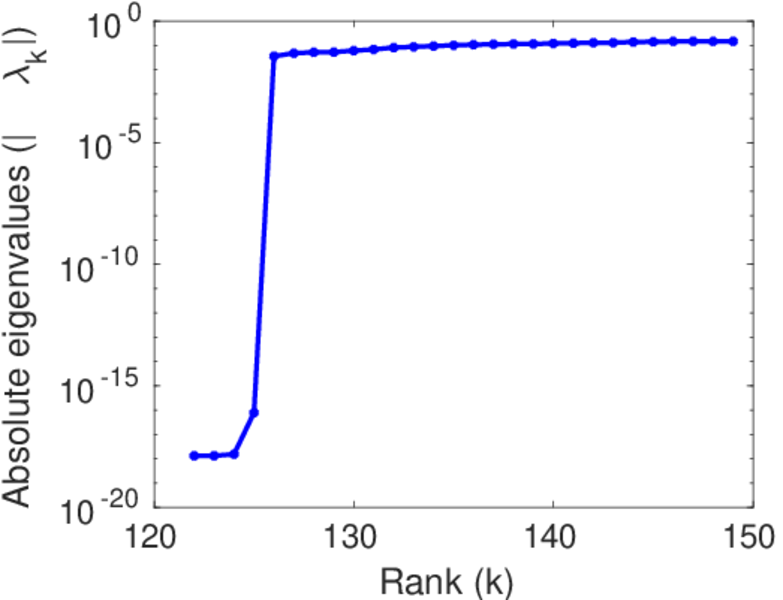
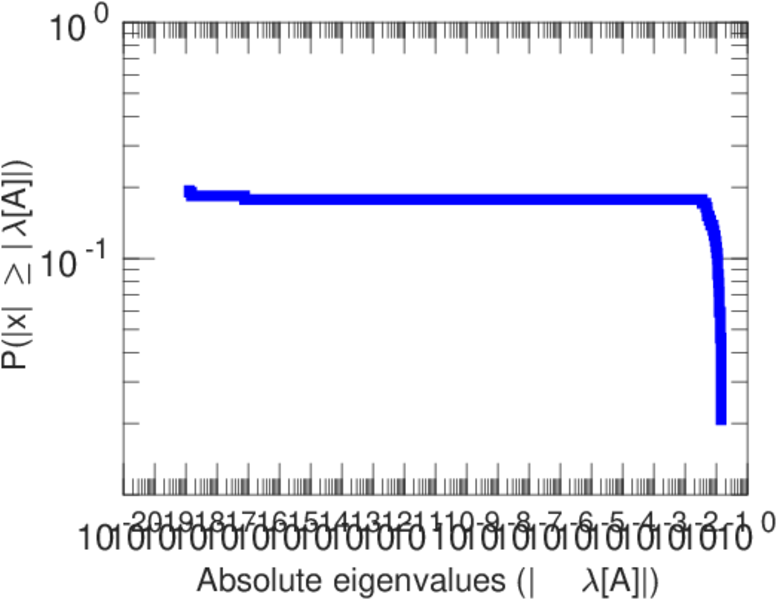
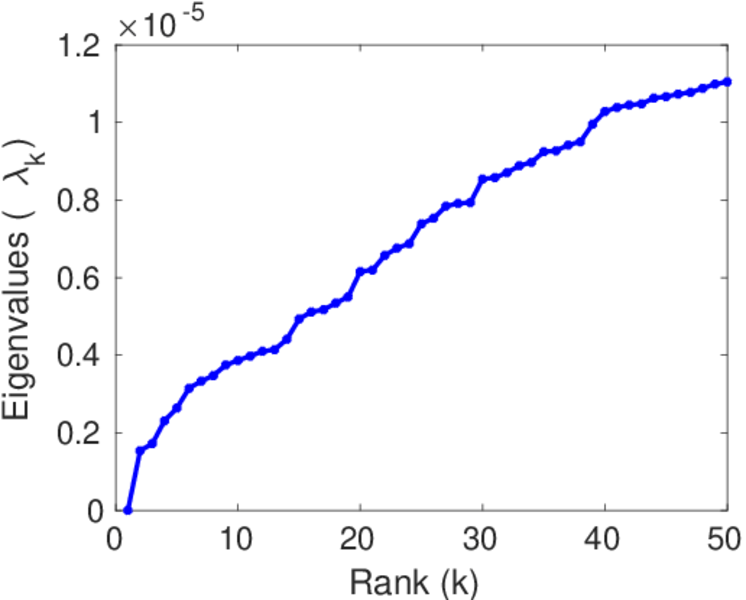
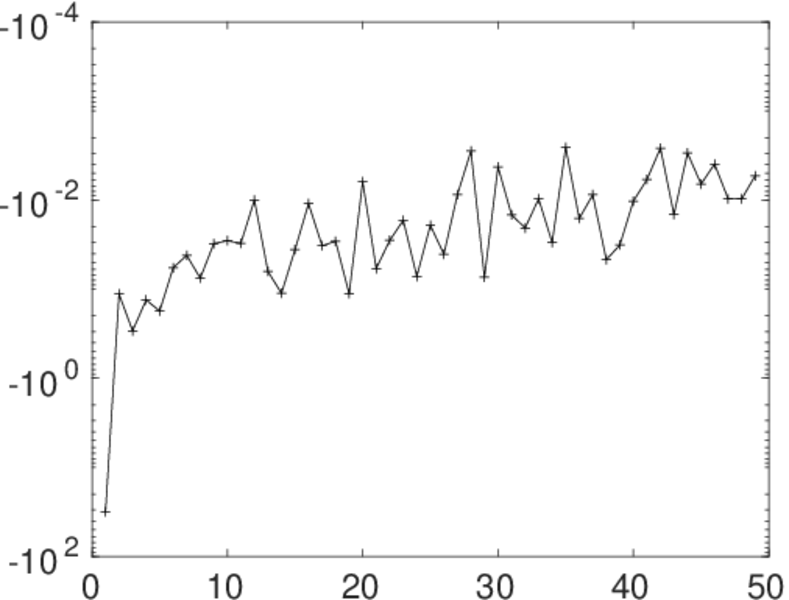
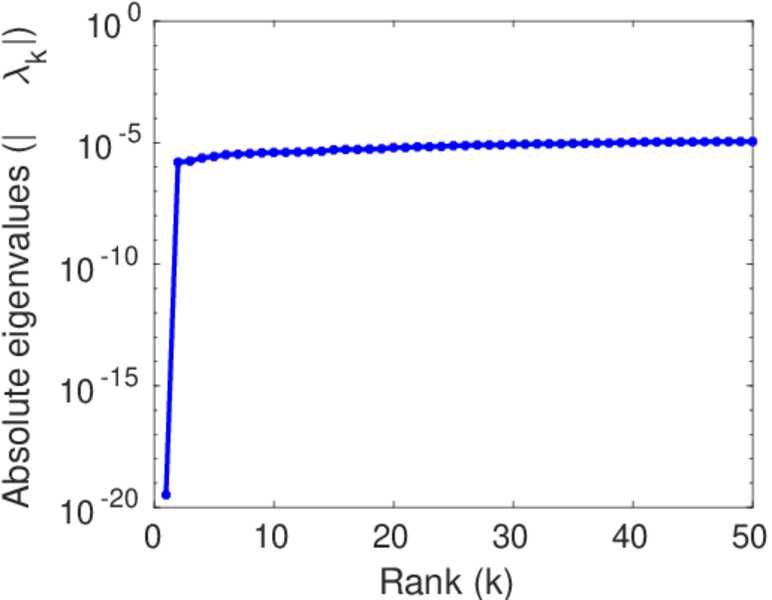
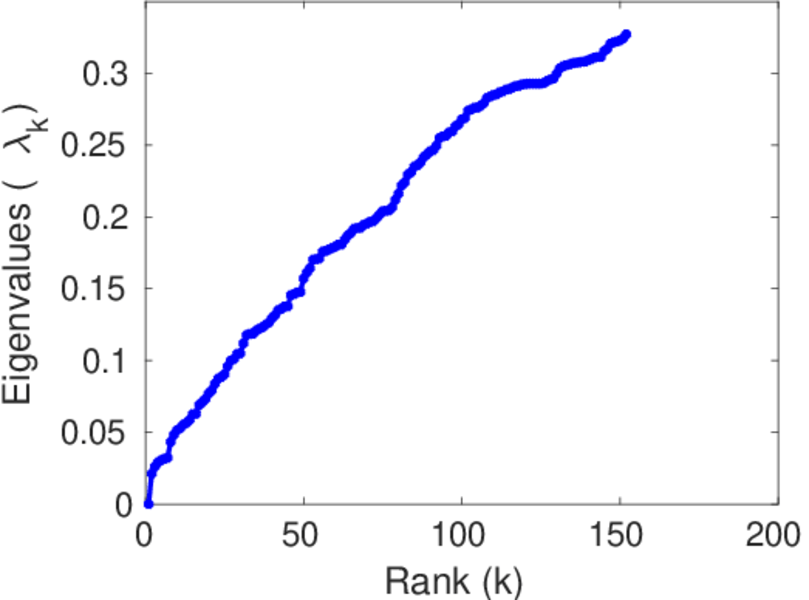
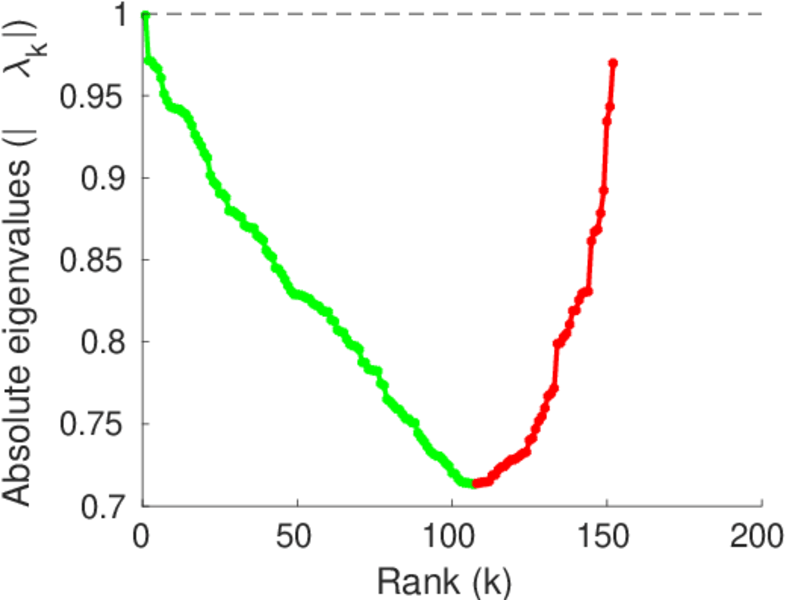
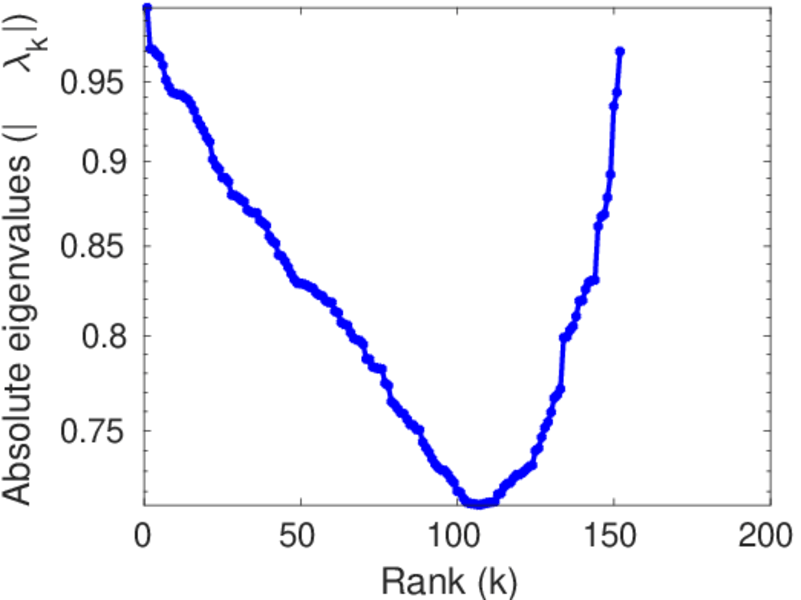
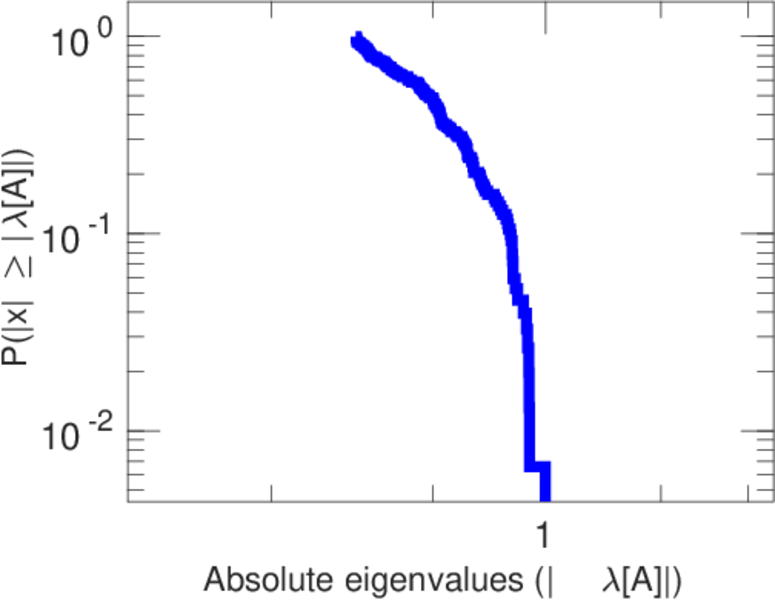
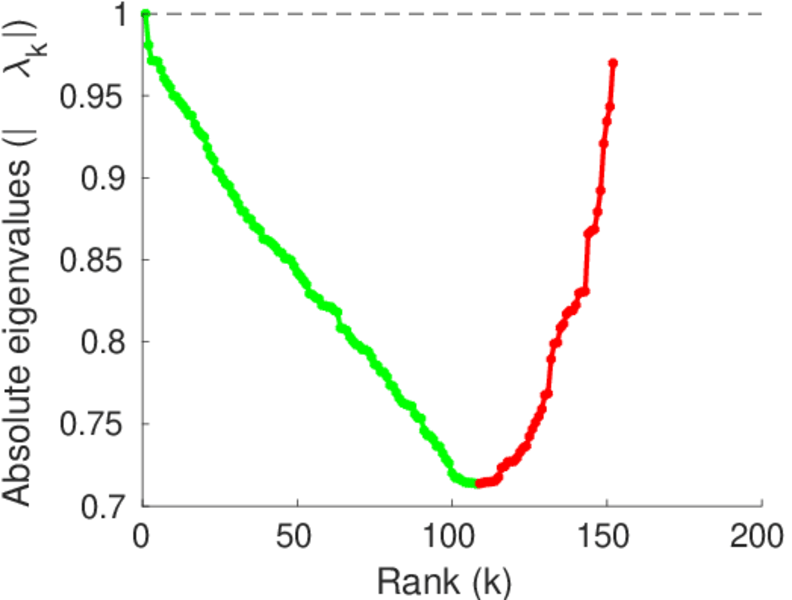
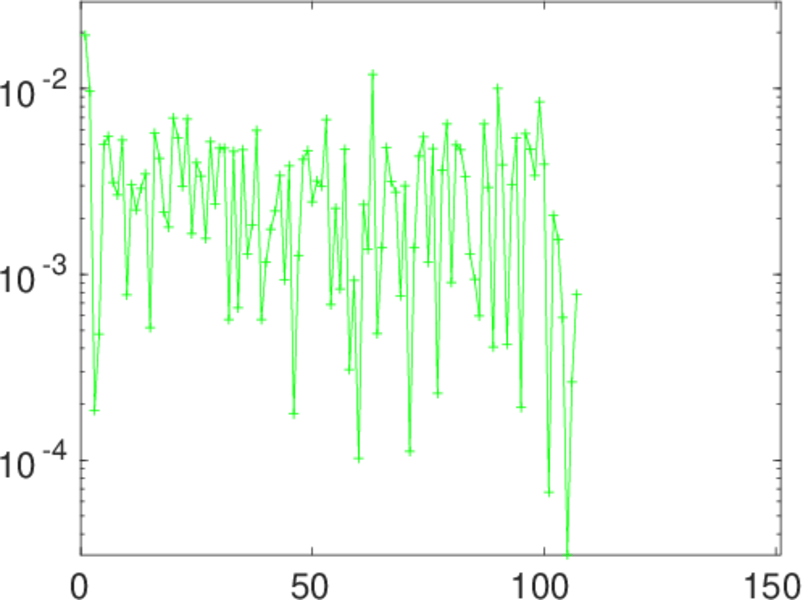
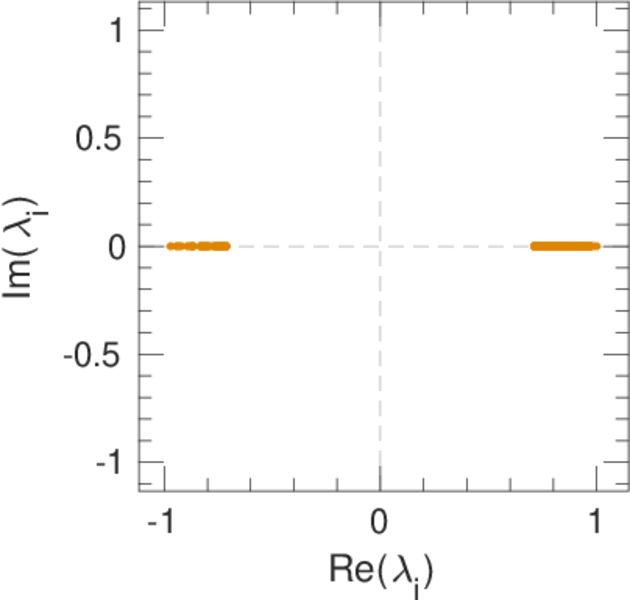
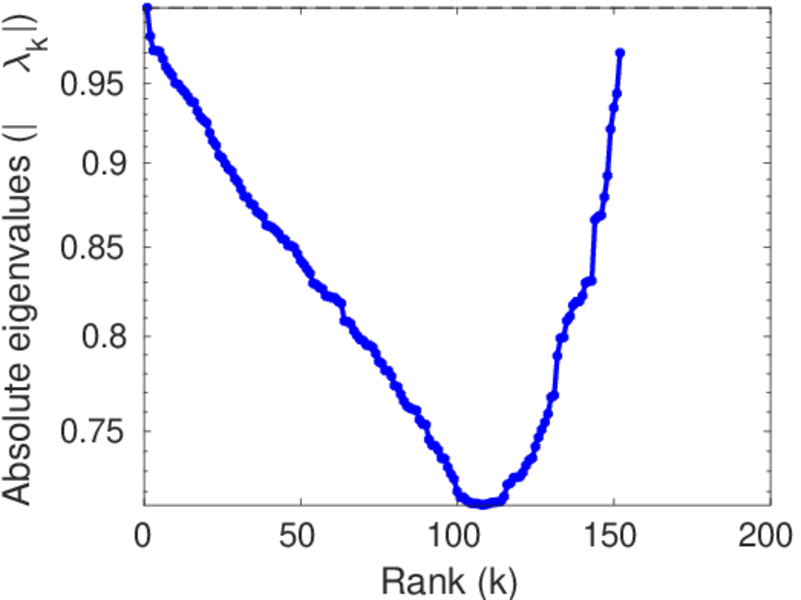
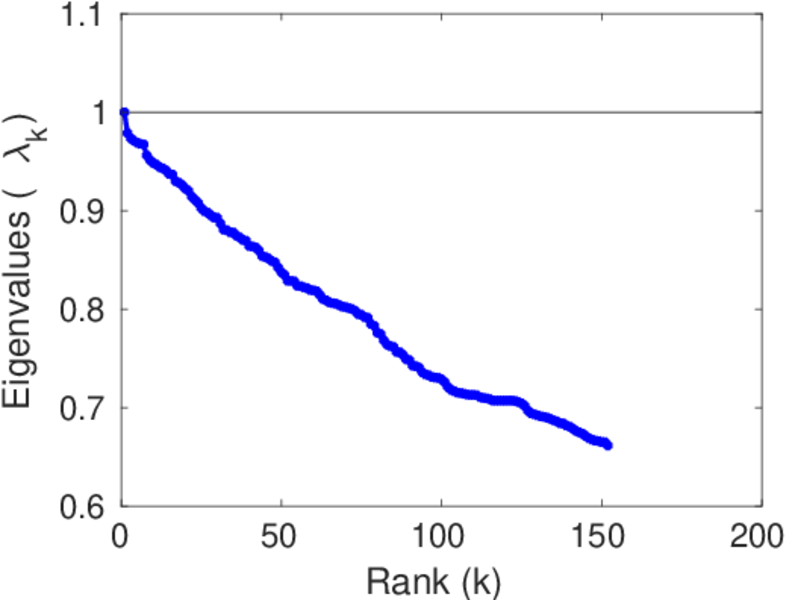
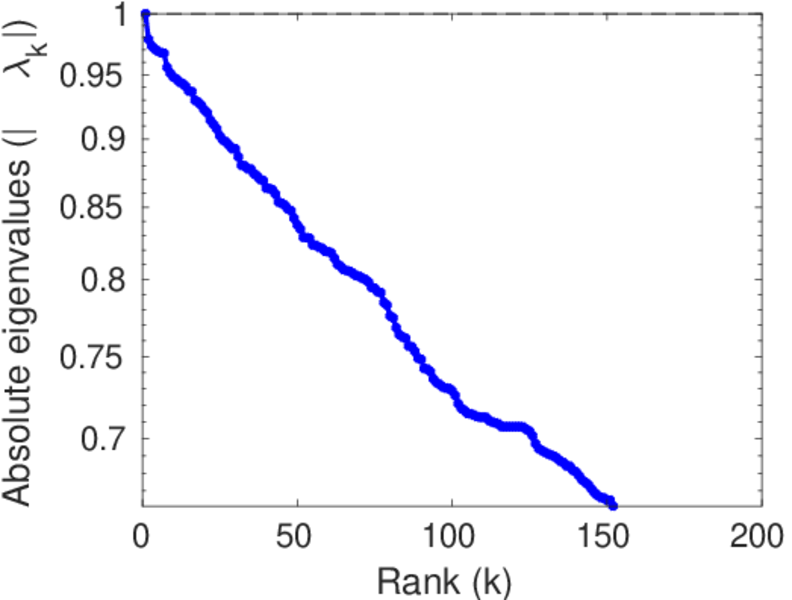
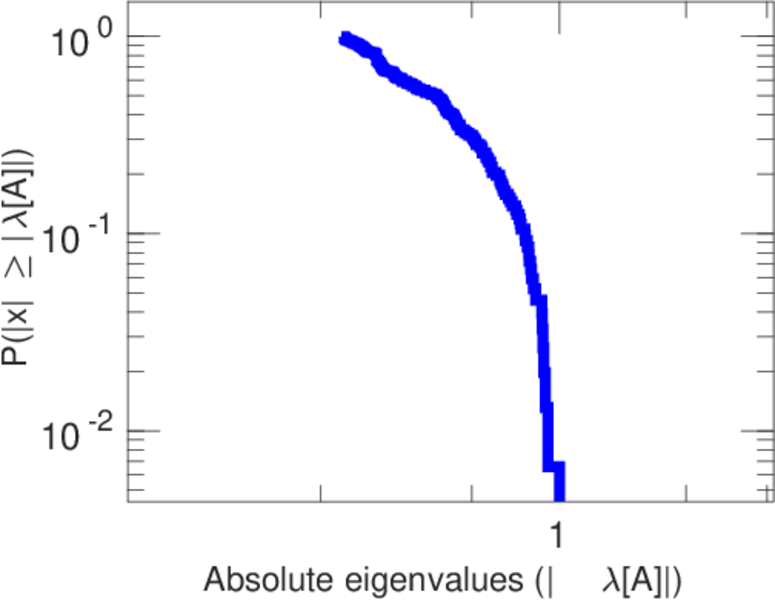
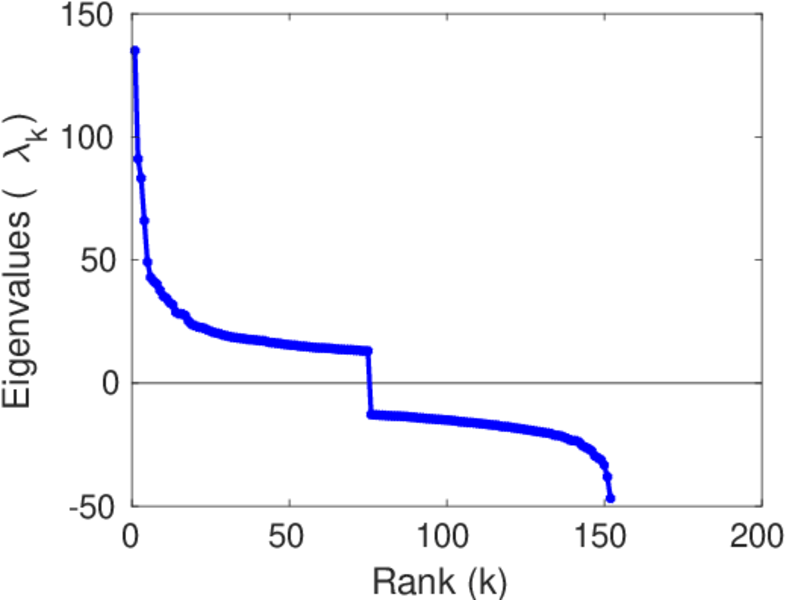
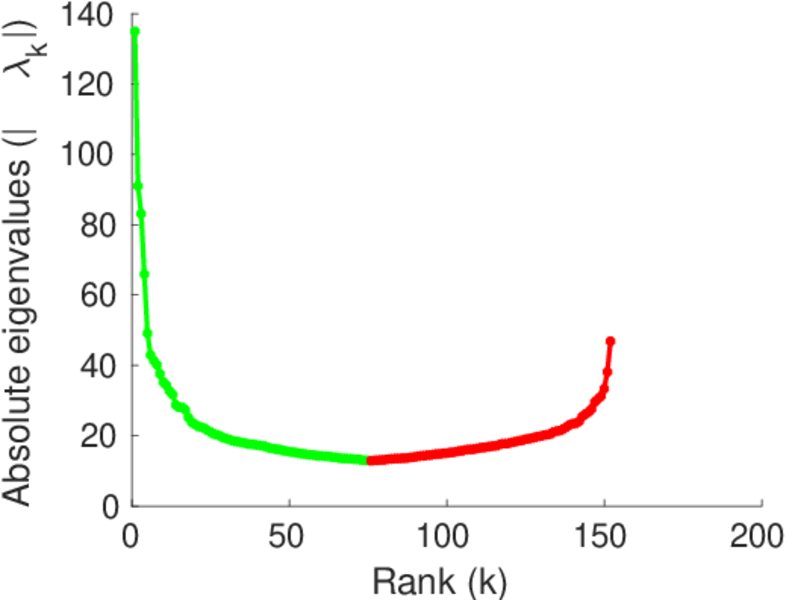
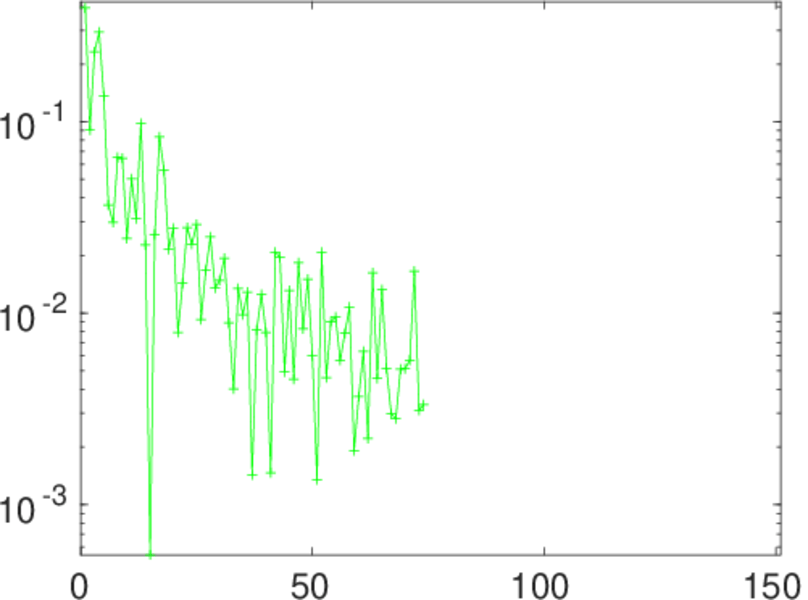
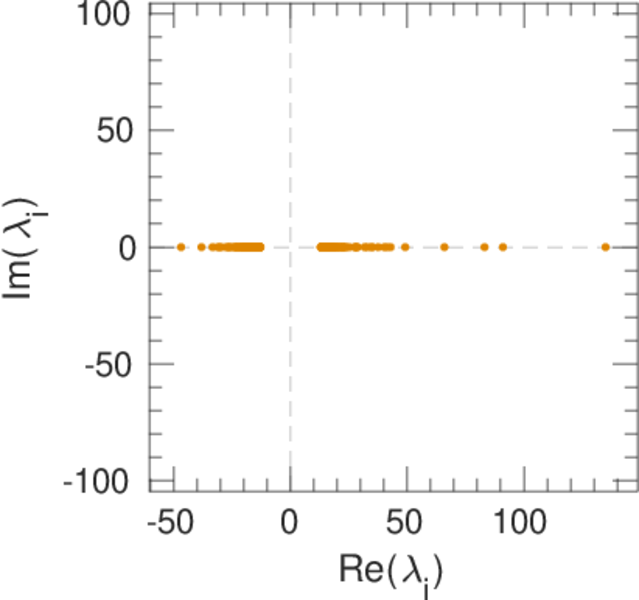
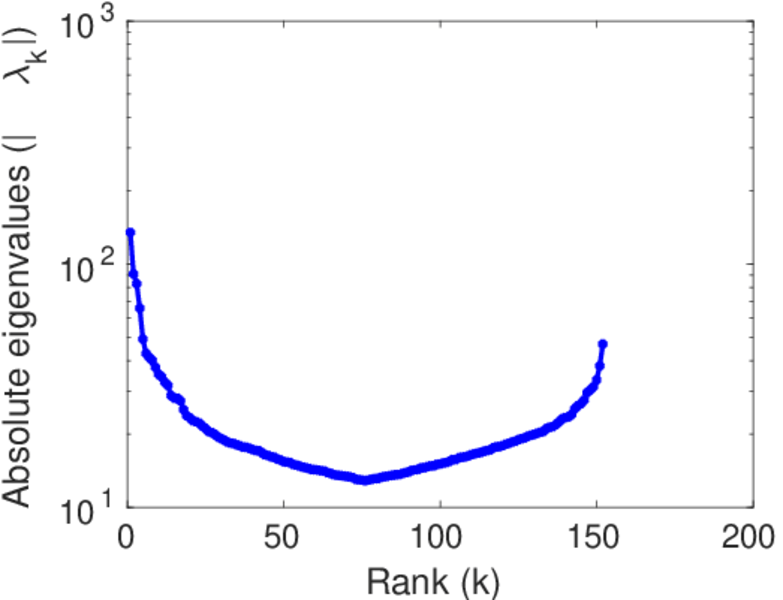
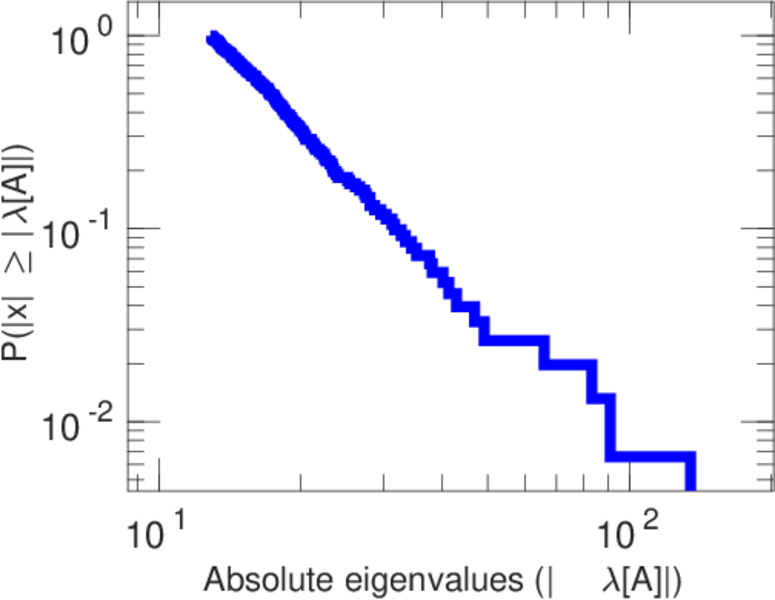
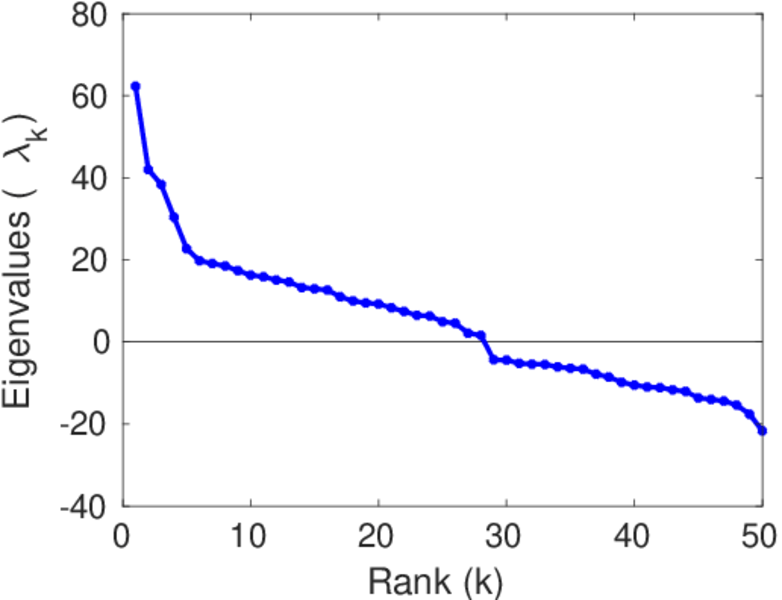
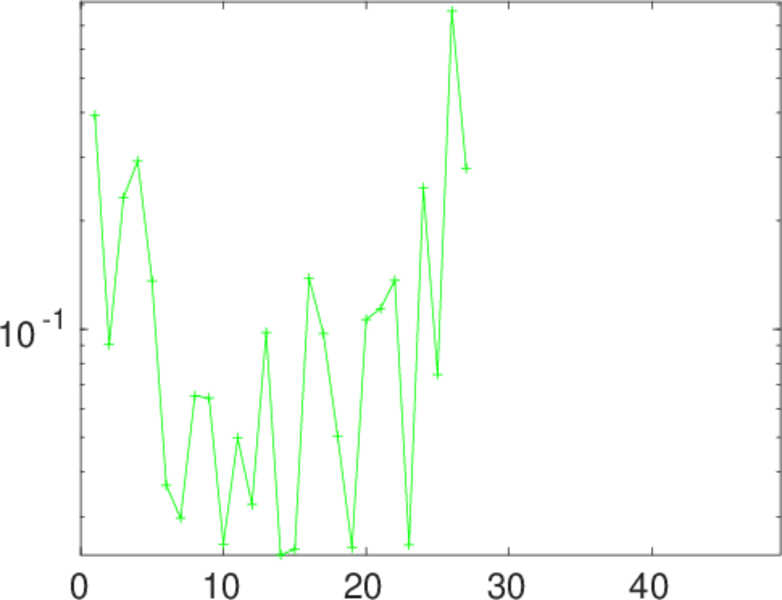
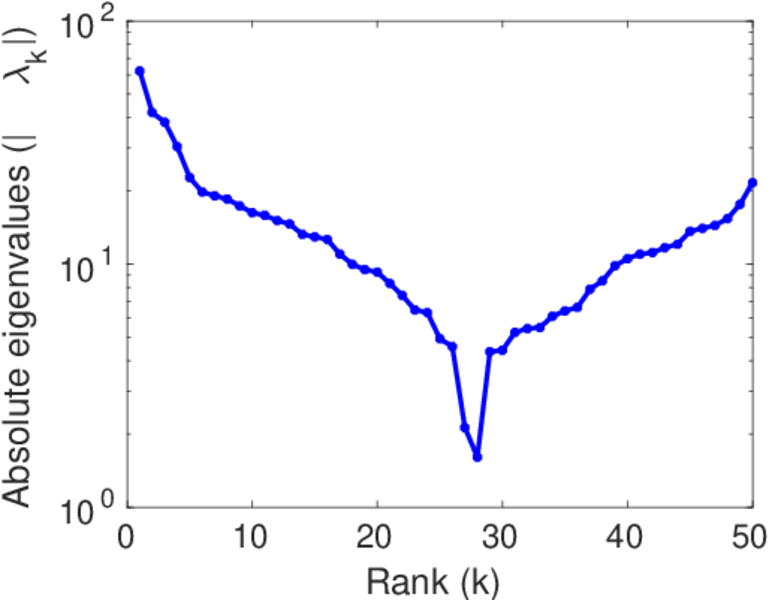
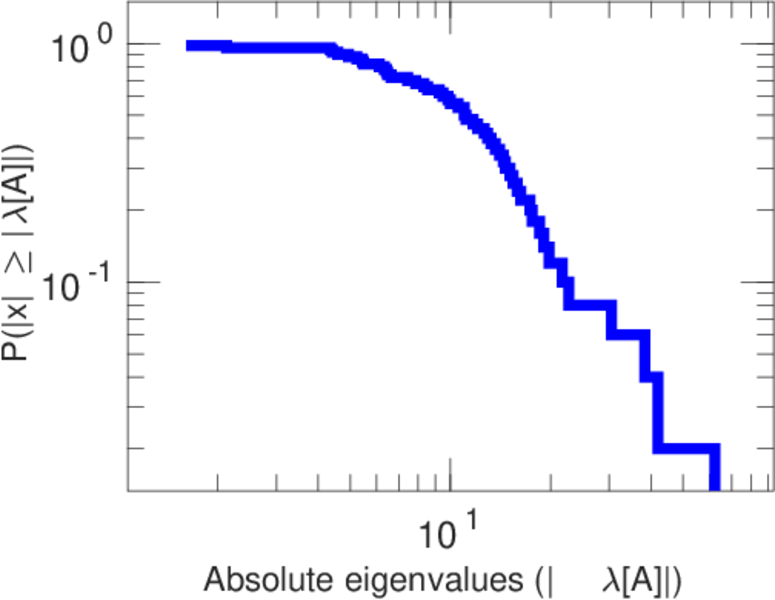
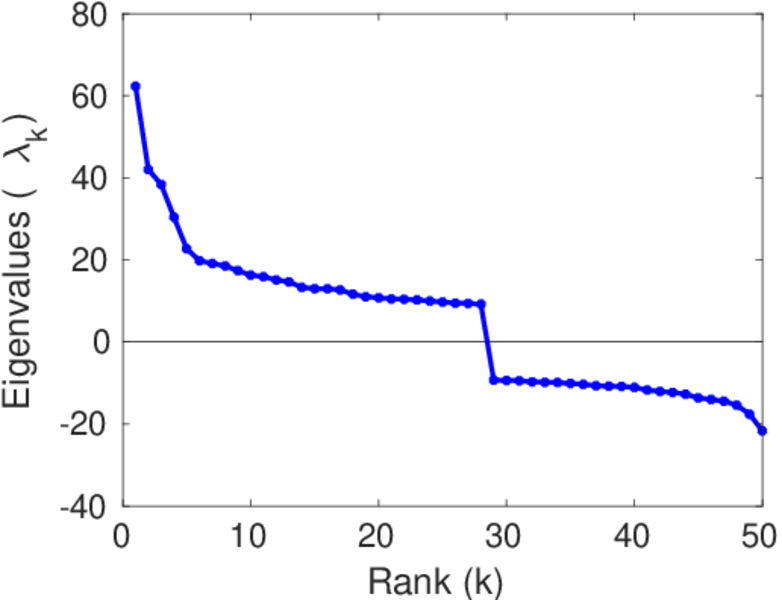
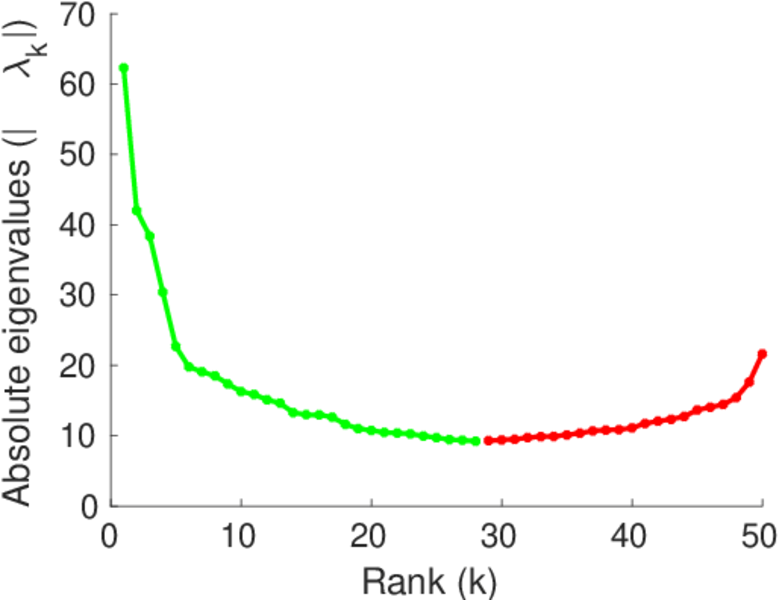
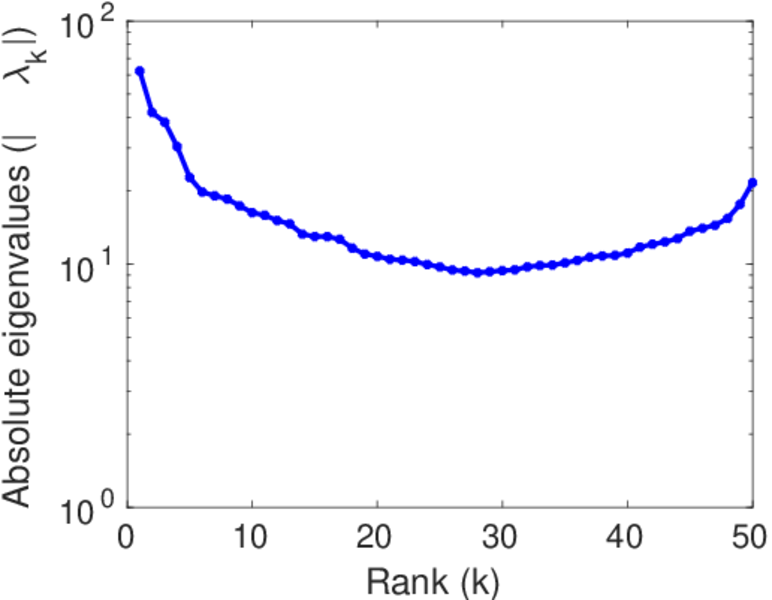
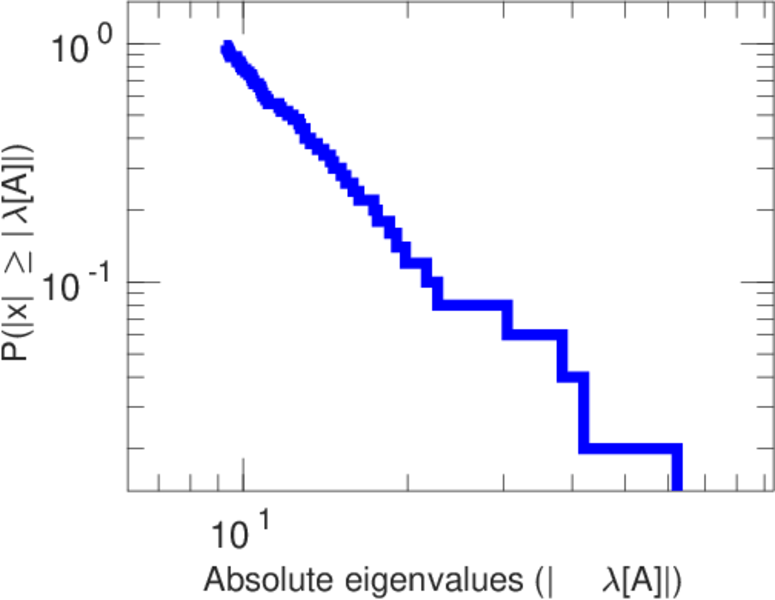
Plots


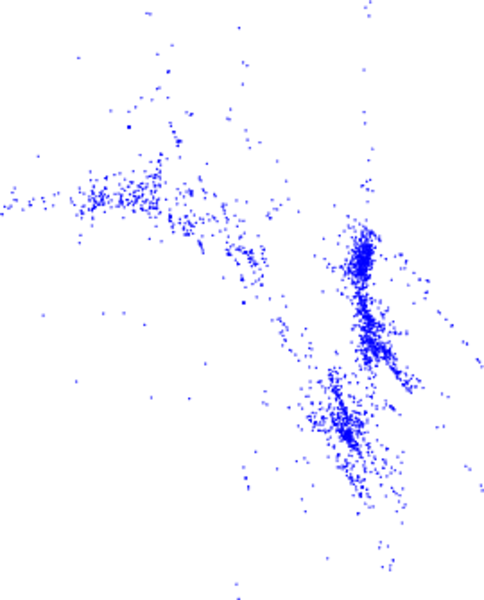
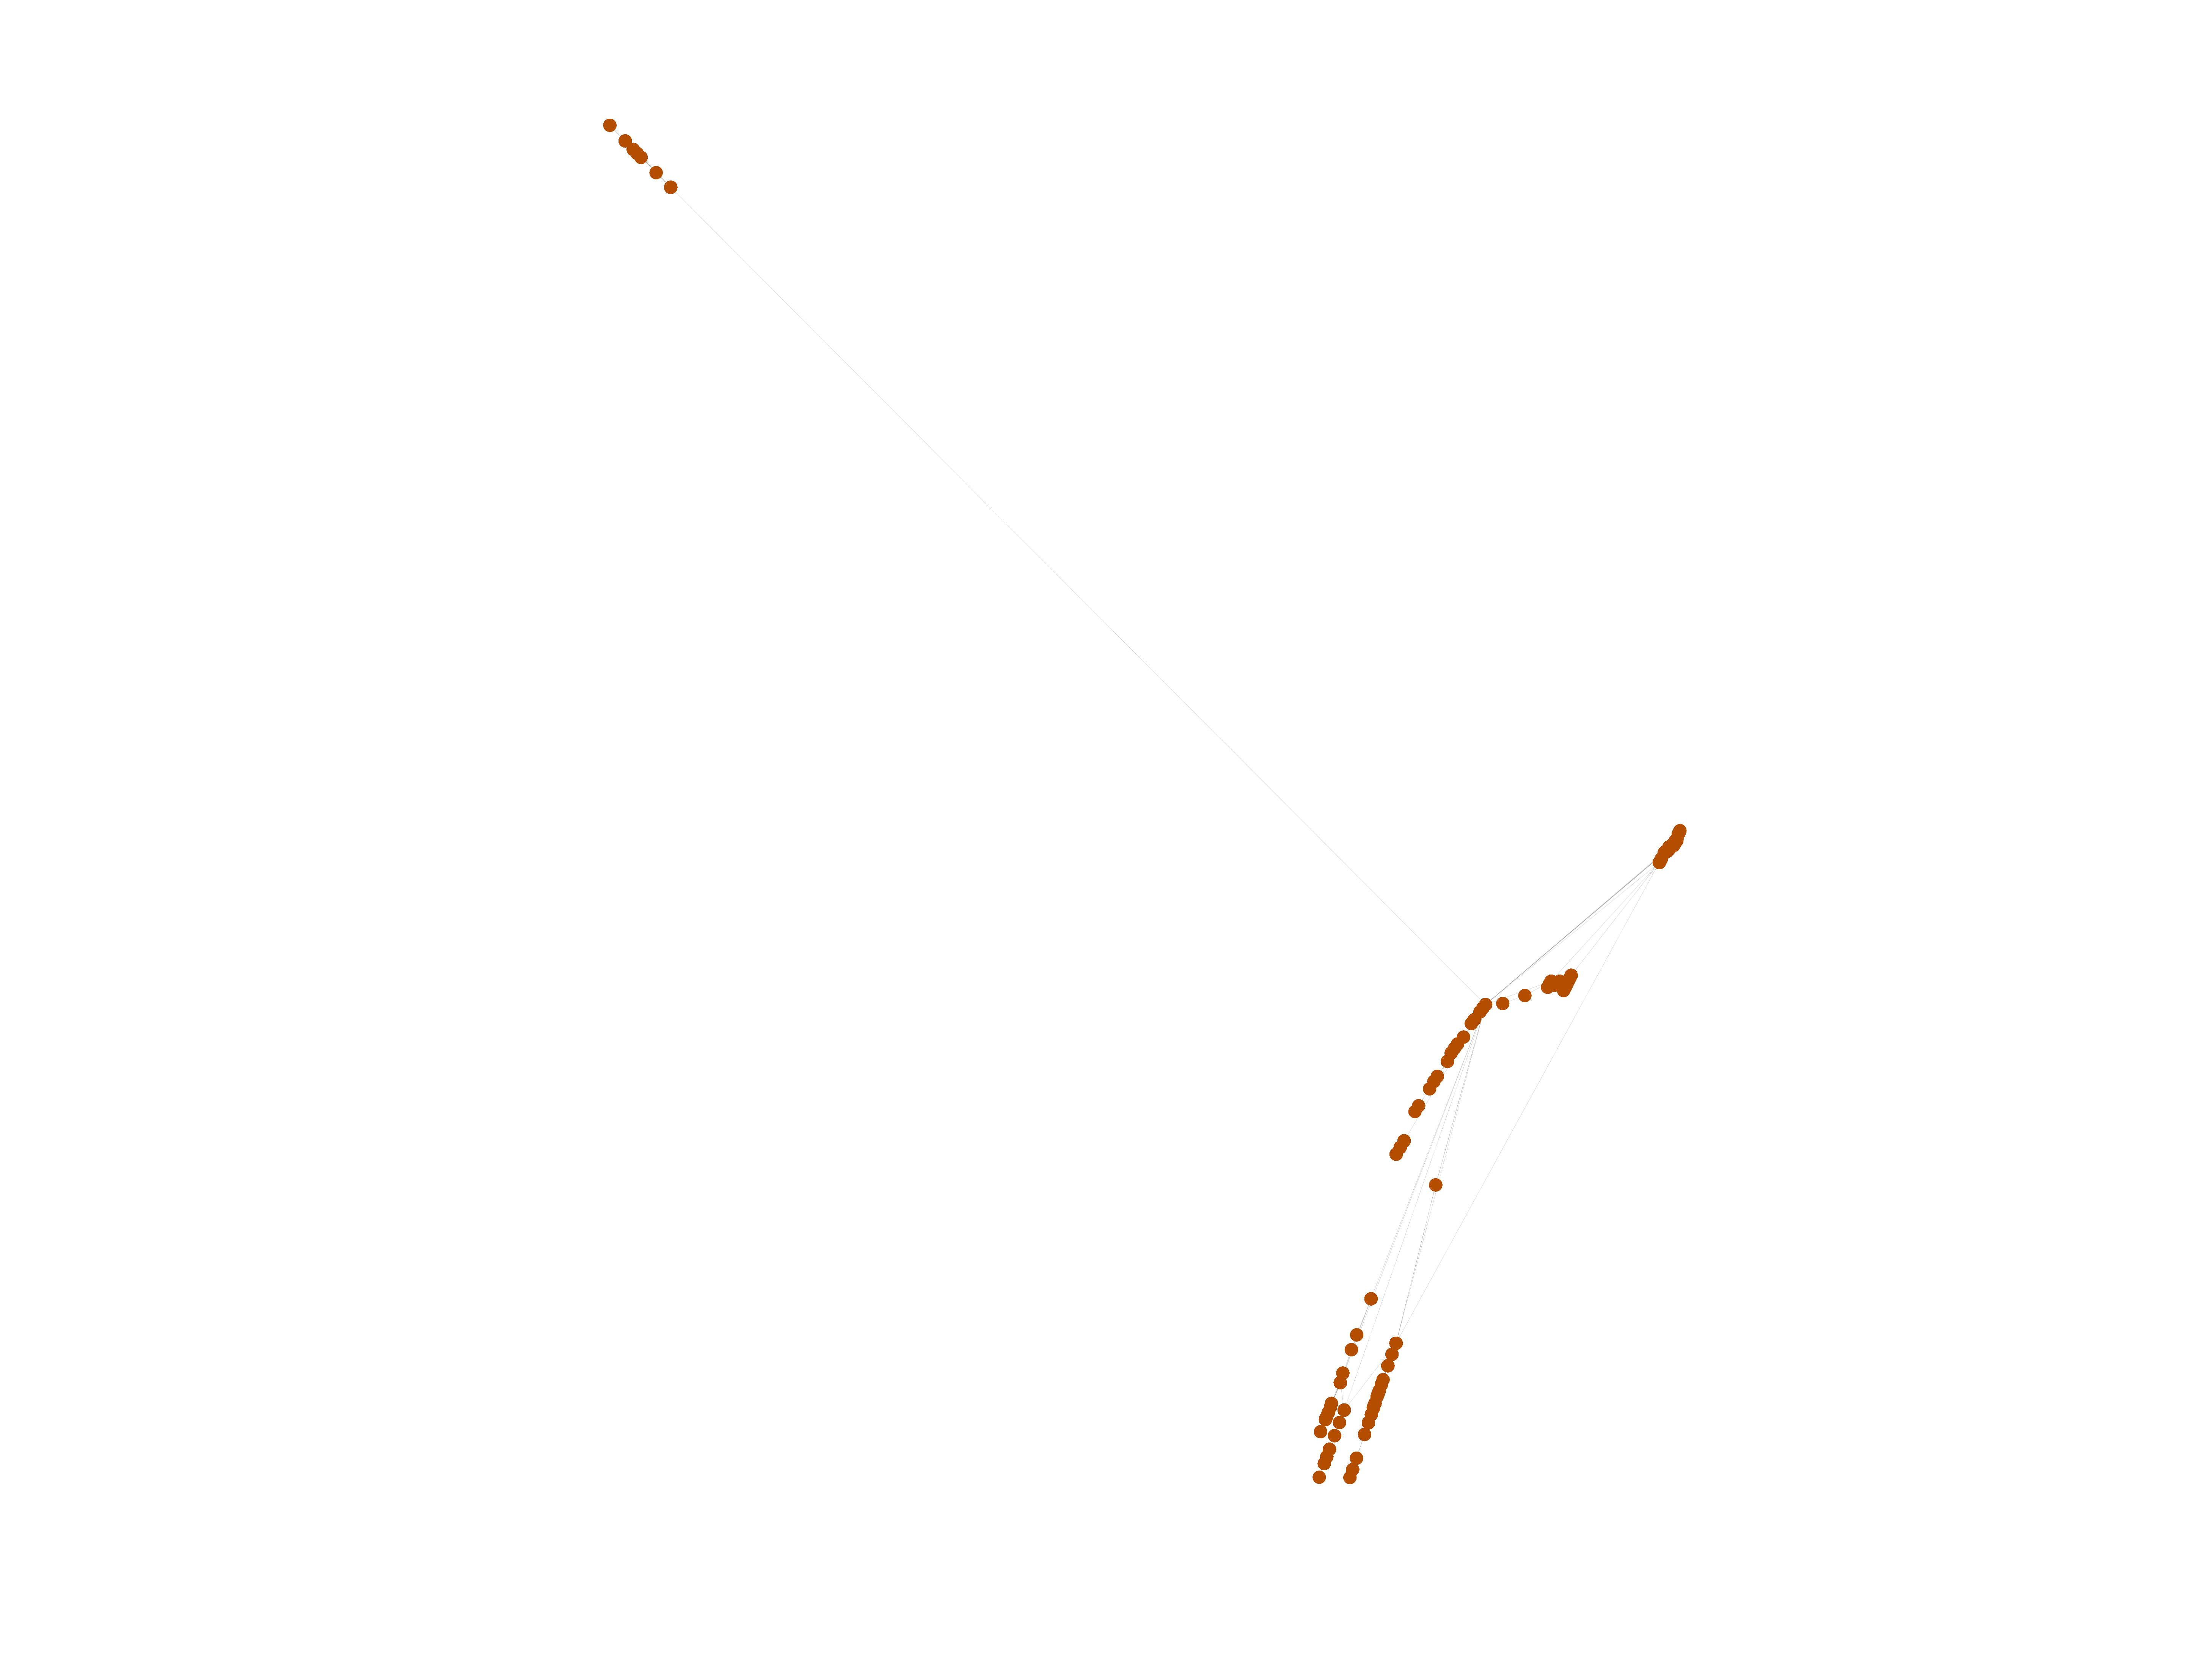
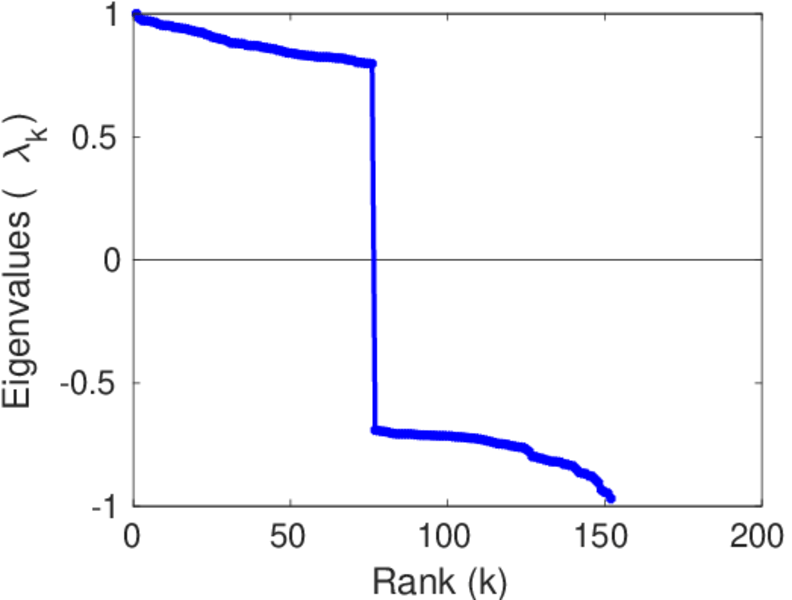
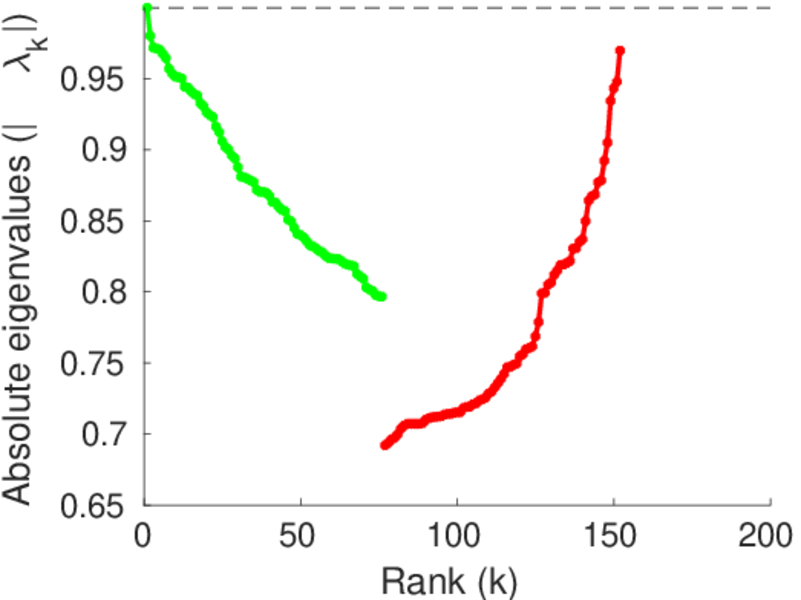
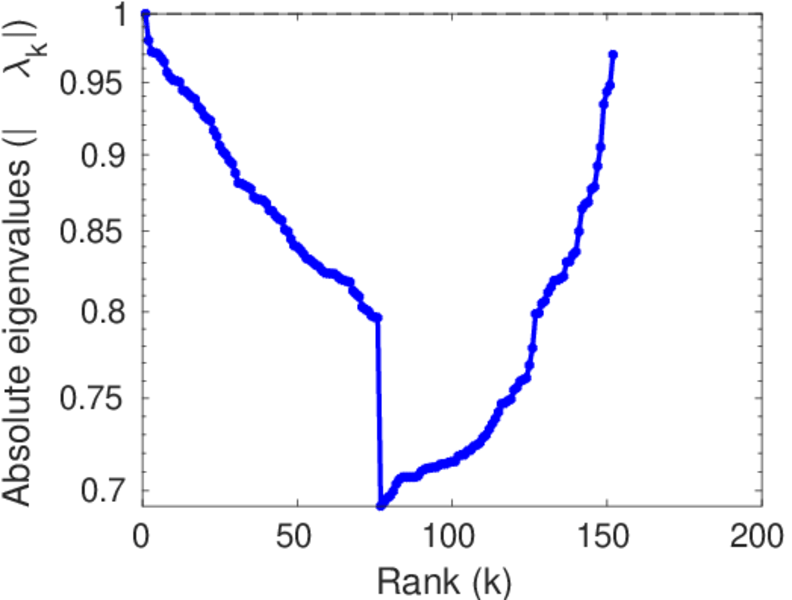
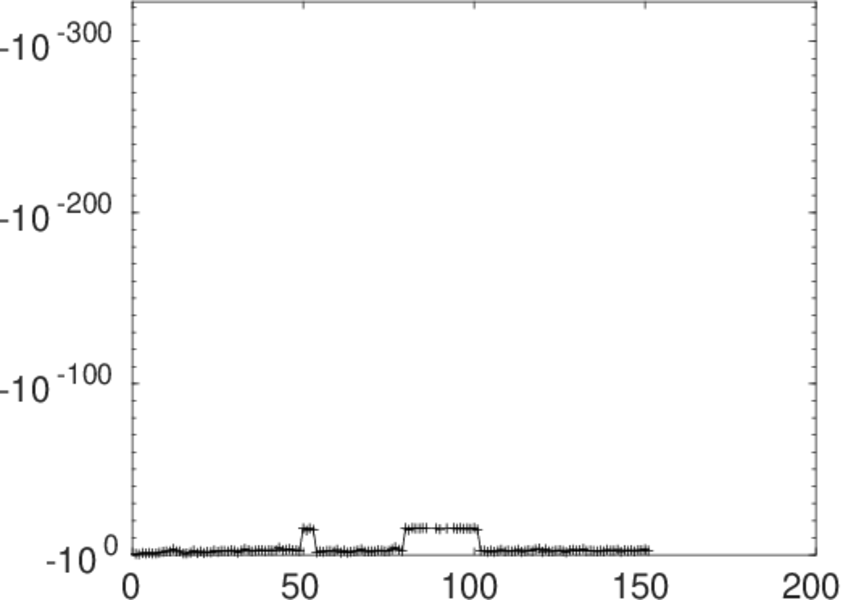
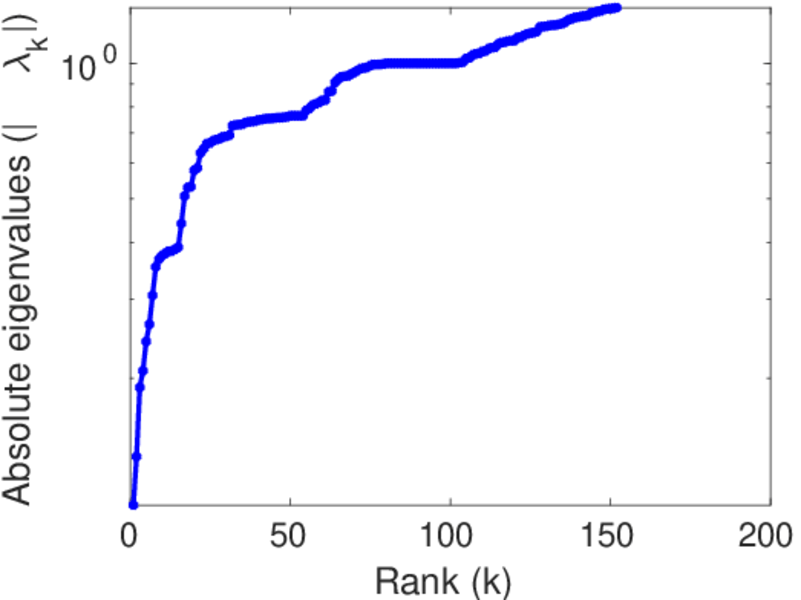
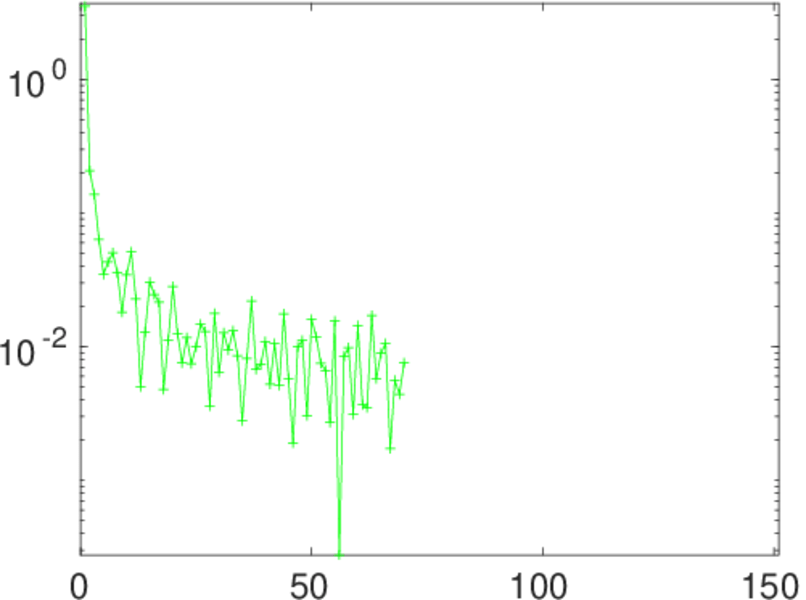
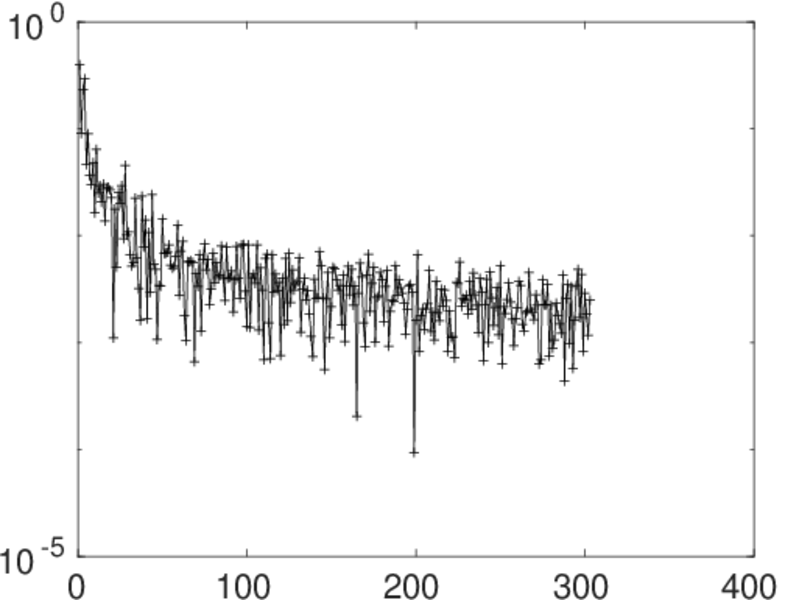
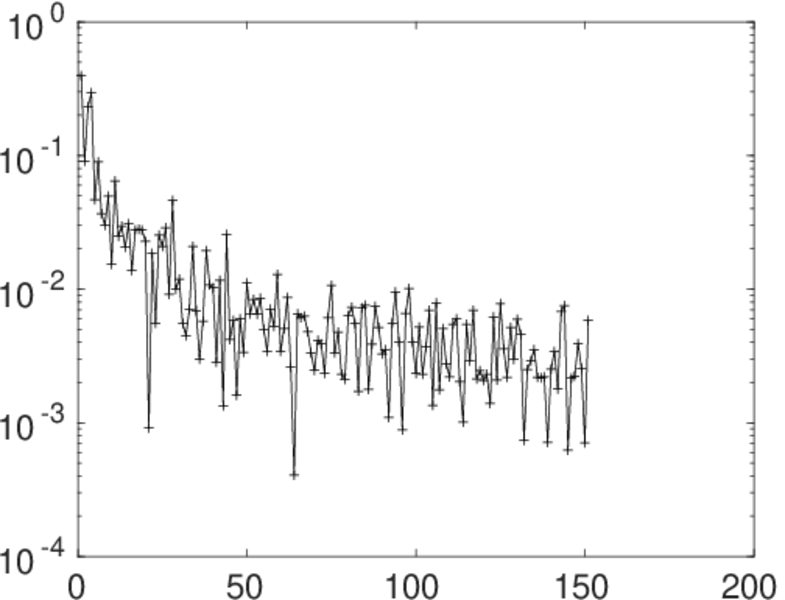
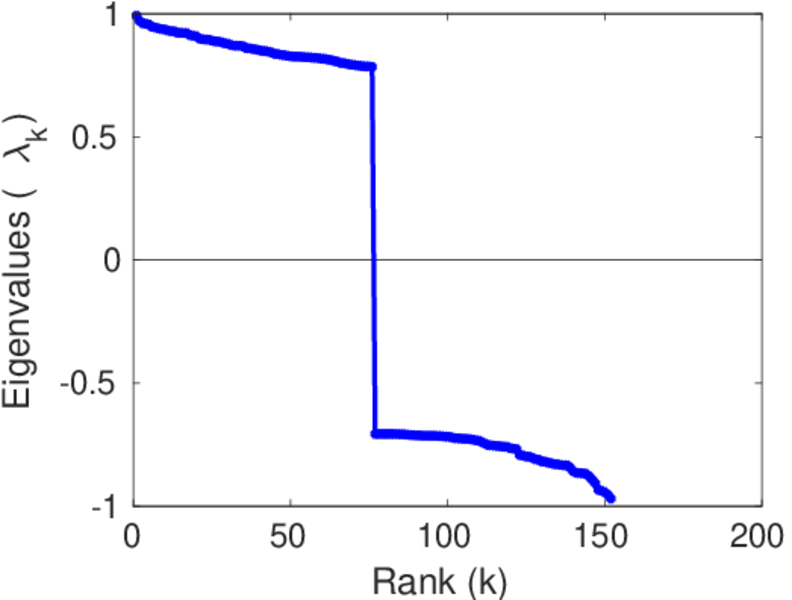
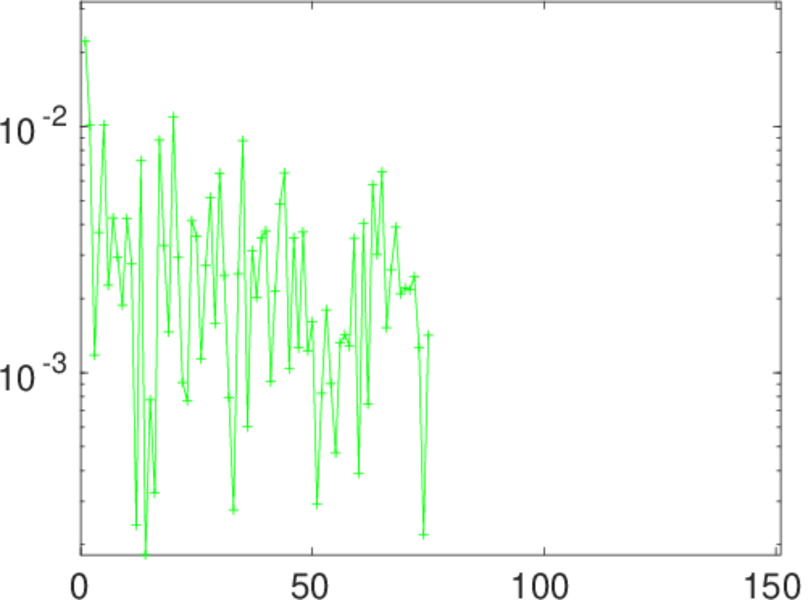
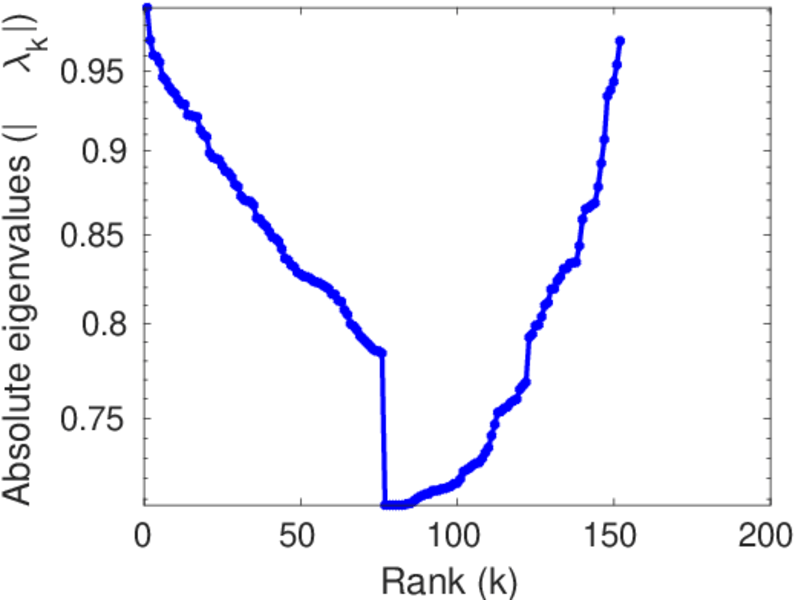
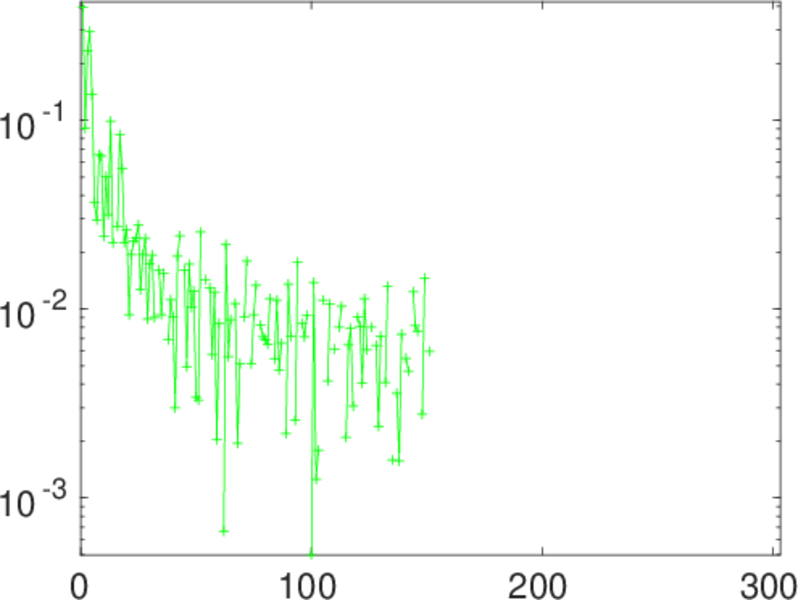
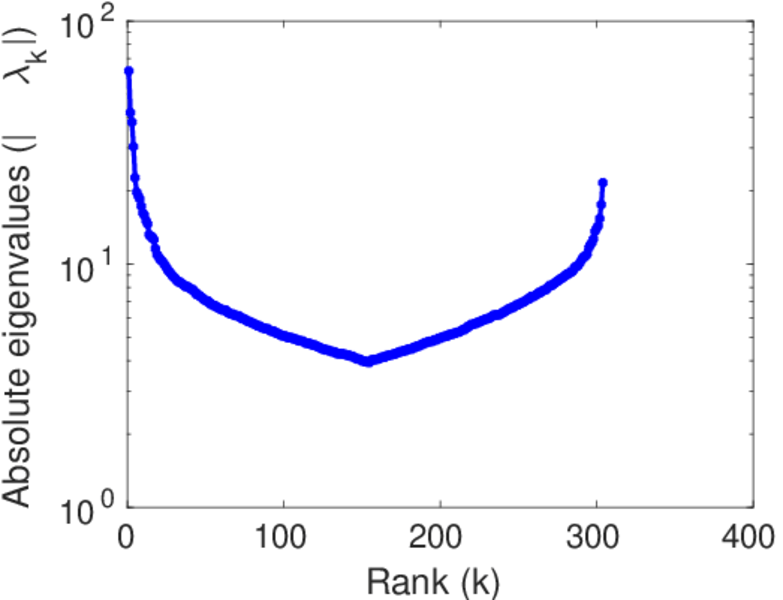
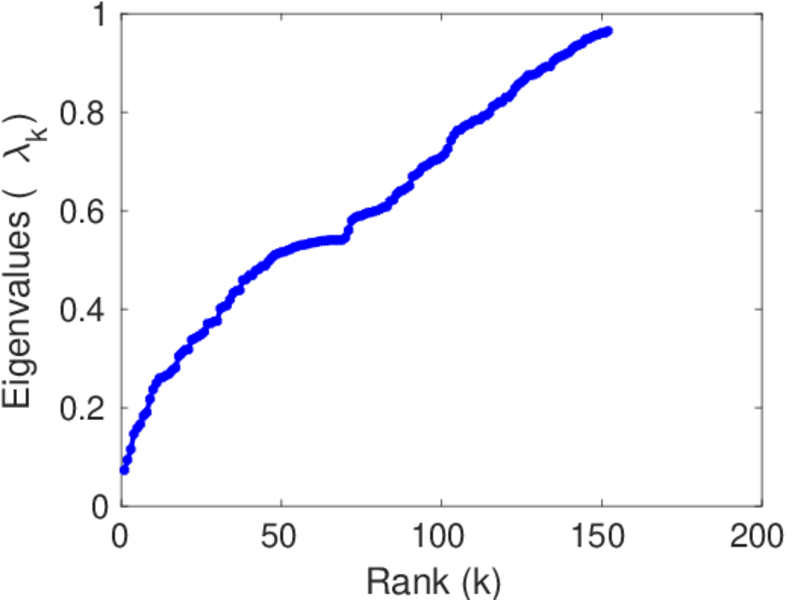
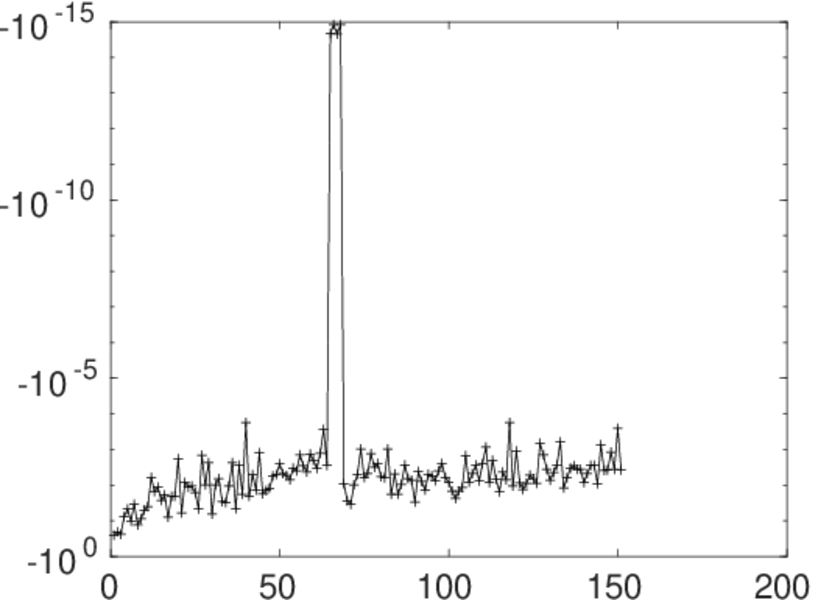
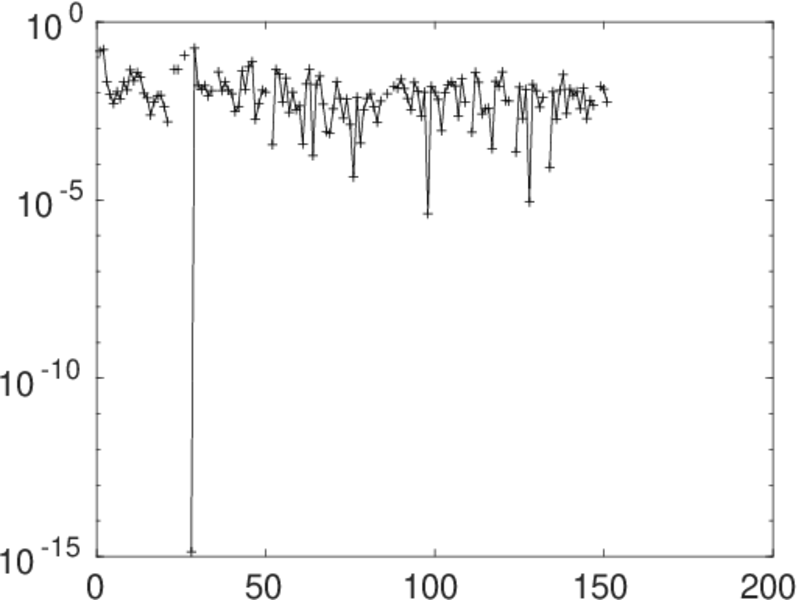
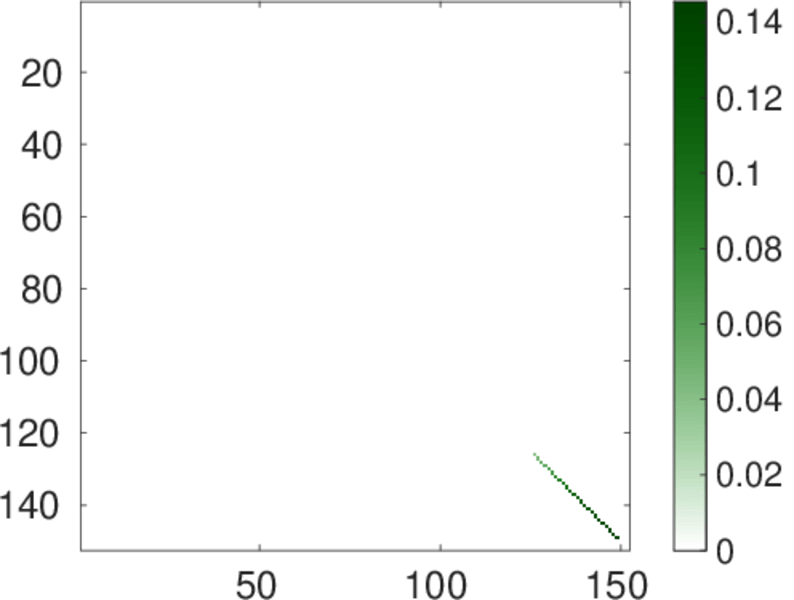
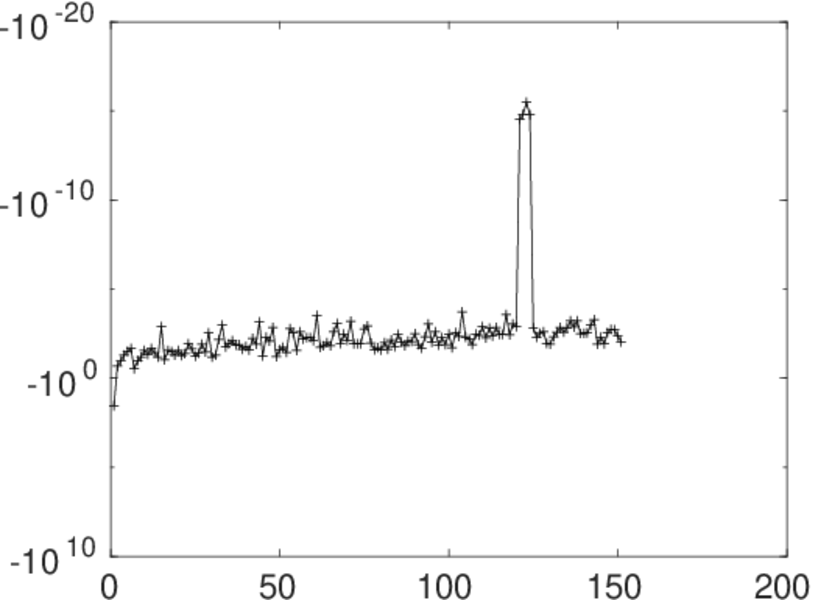
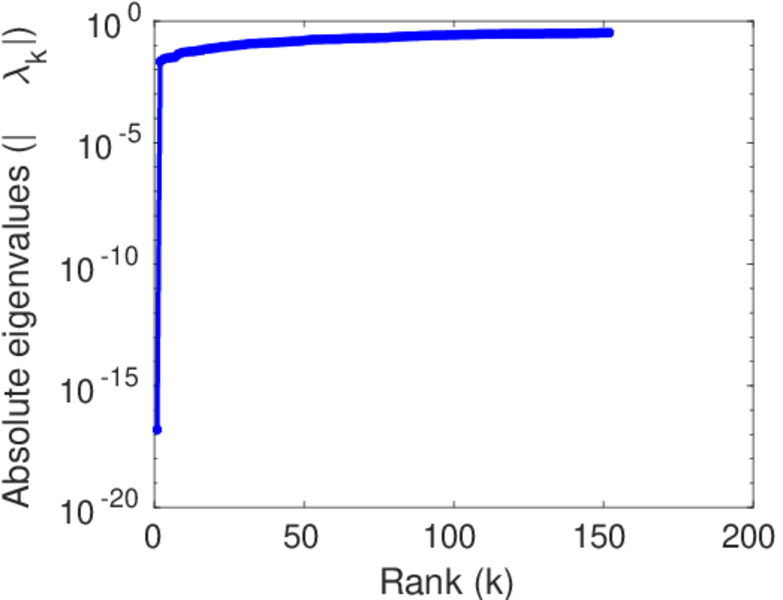
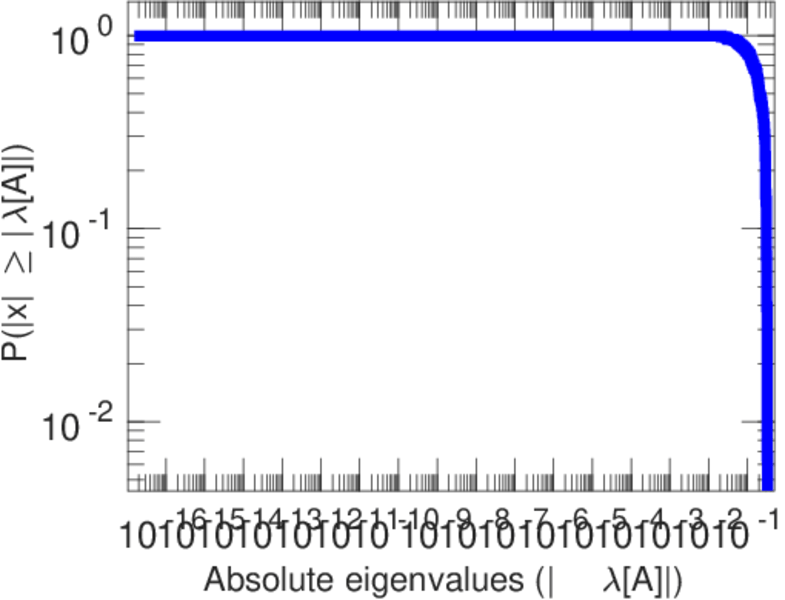
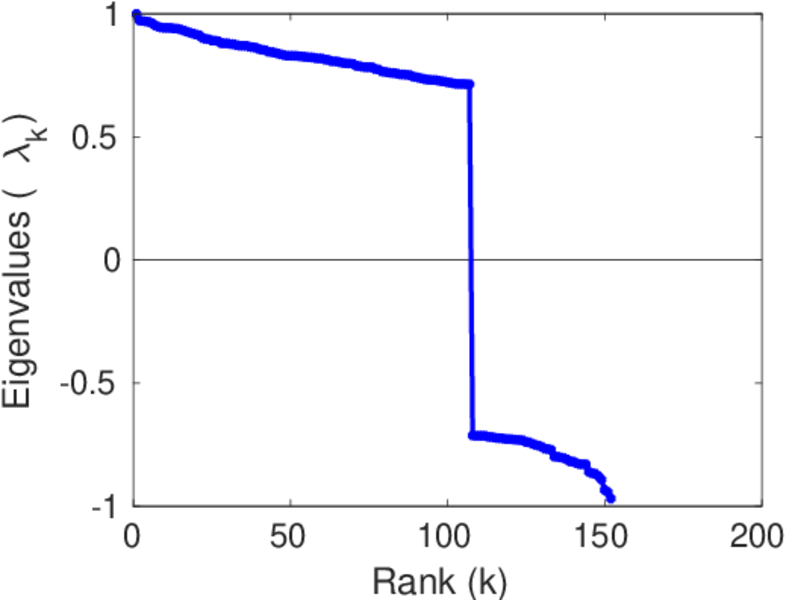
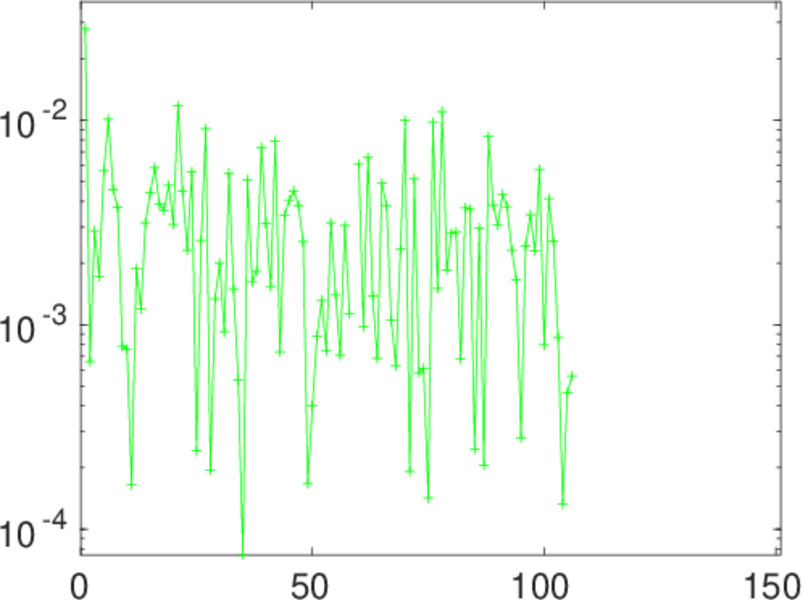
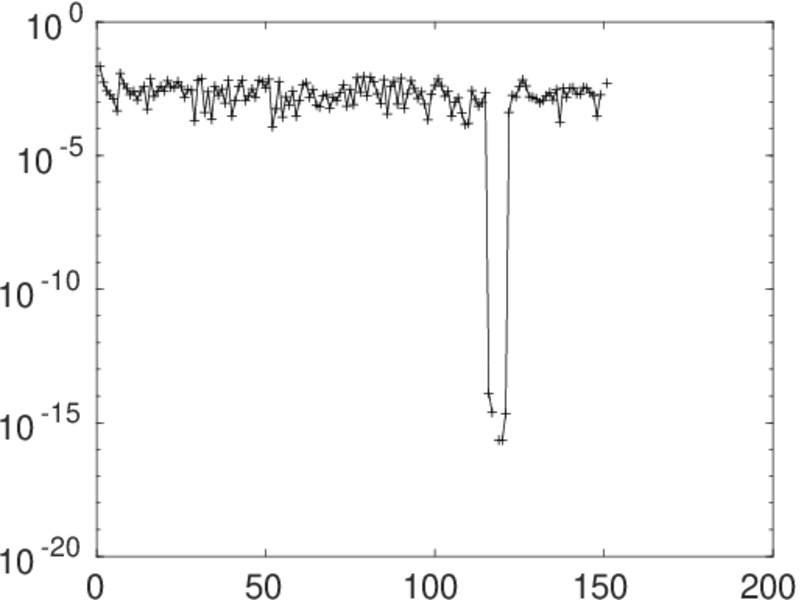
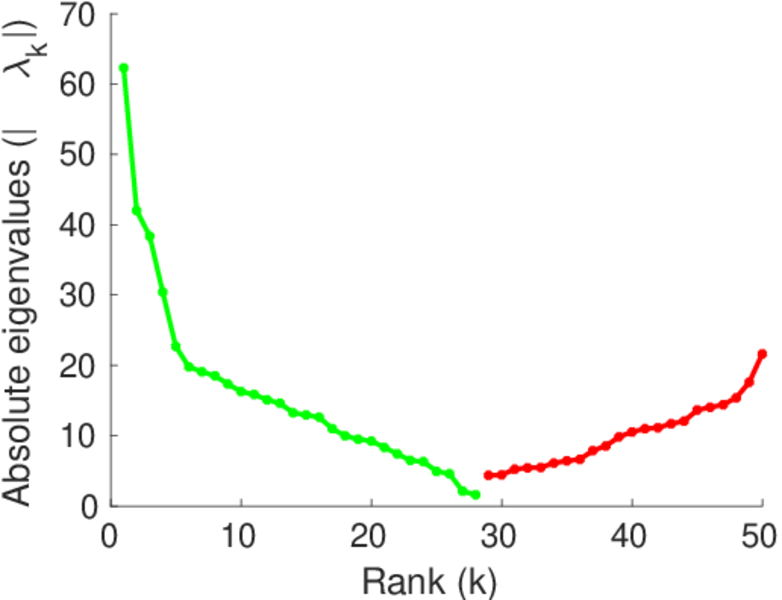
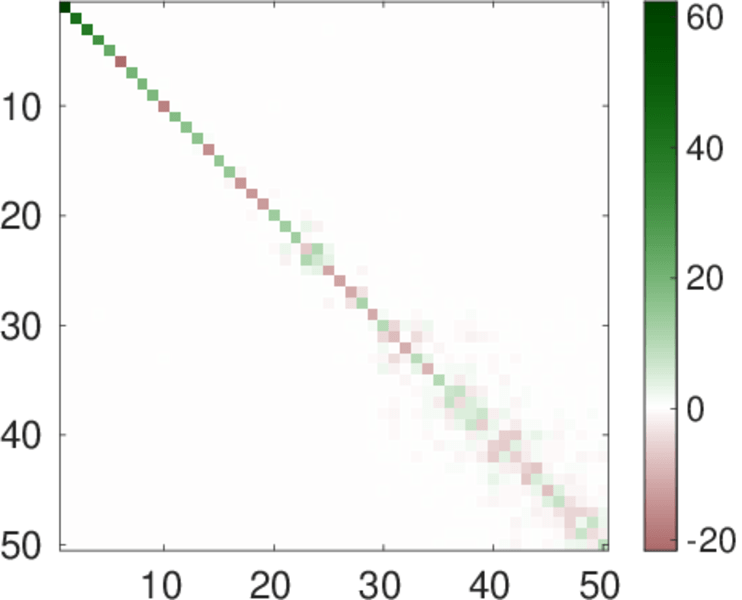
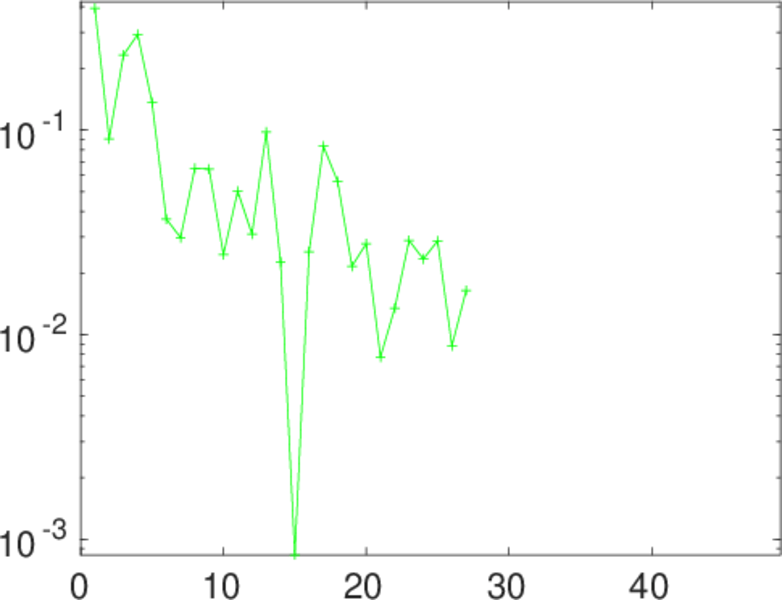
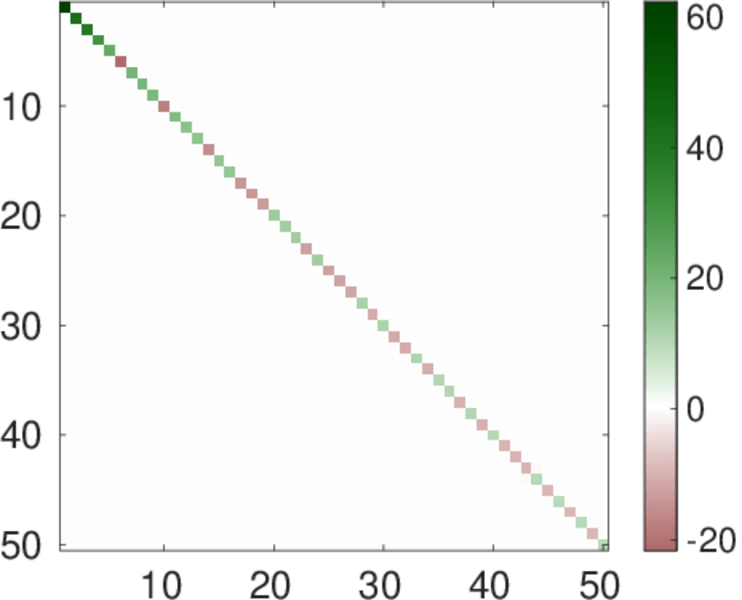
Matrix decompositions plots


Downloads
References
|
[1]
|
Jérôme Kunegis.
KONECT – The Koblenz Network Collection.
In Proc. Int. Conf. on World Wide Web Companion, pages
1343–1350, 2013.
[ http ]
|
|
[2]
|
Tore Opsahl, Filip Agneessens, and John Skvoretz.
Node centrality in weighted networks: Generalizing degree and
shortest paths.
Soc. Netw., 3(32):245–251, 2010.
|
 KONECT ‣ Networks ‣
Buy Me a Coffee
KONECT ‣ Networks ‣
Buy Me a Coffee