US power grid

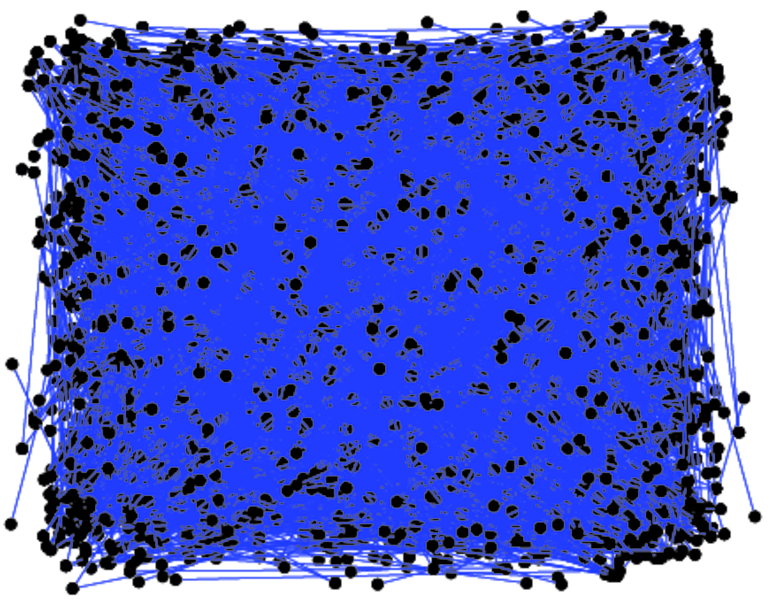
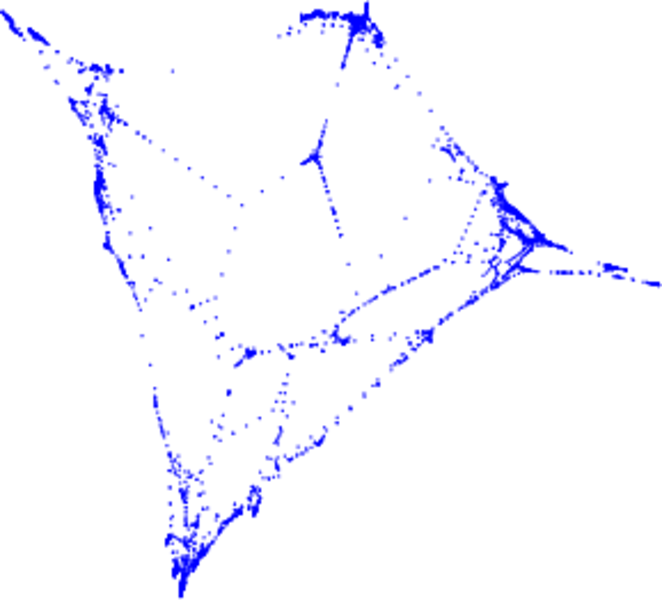
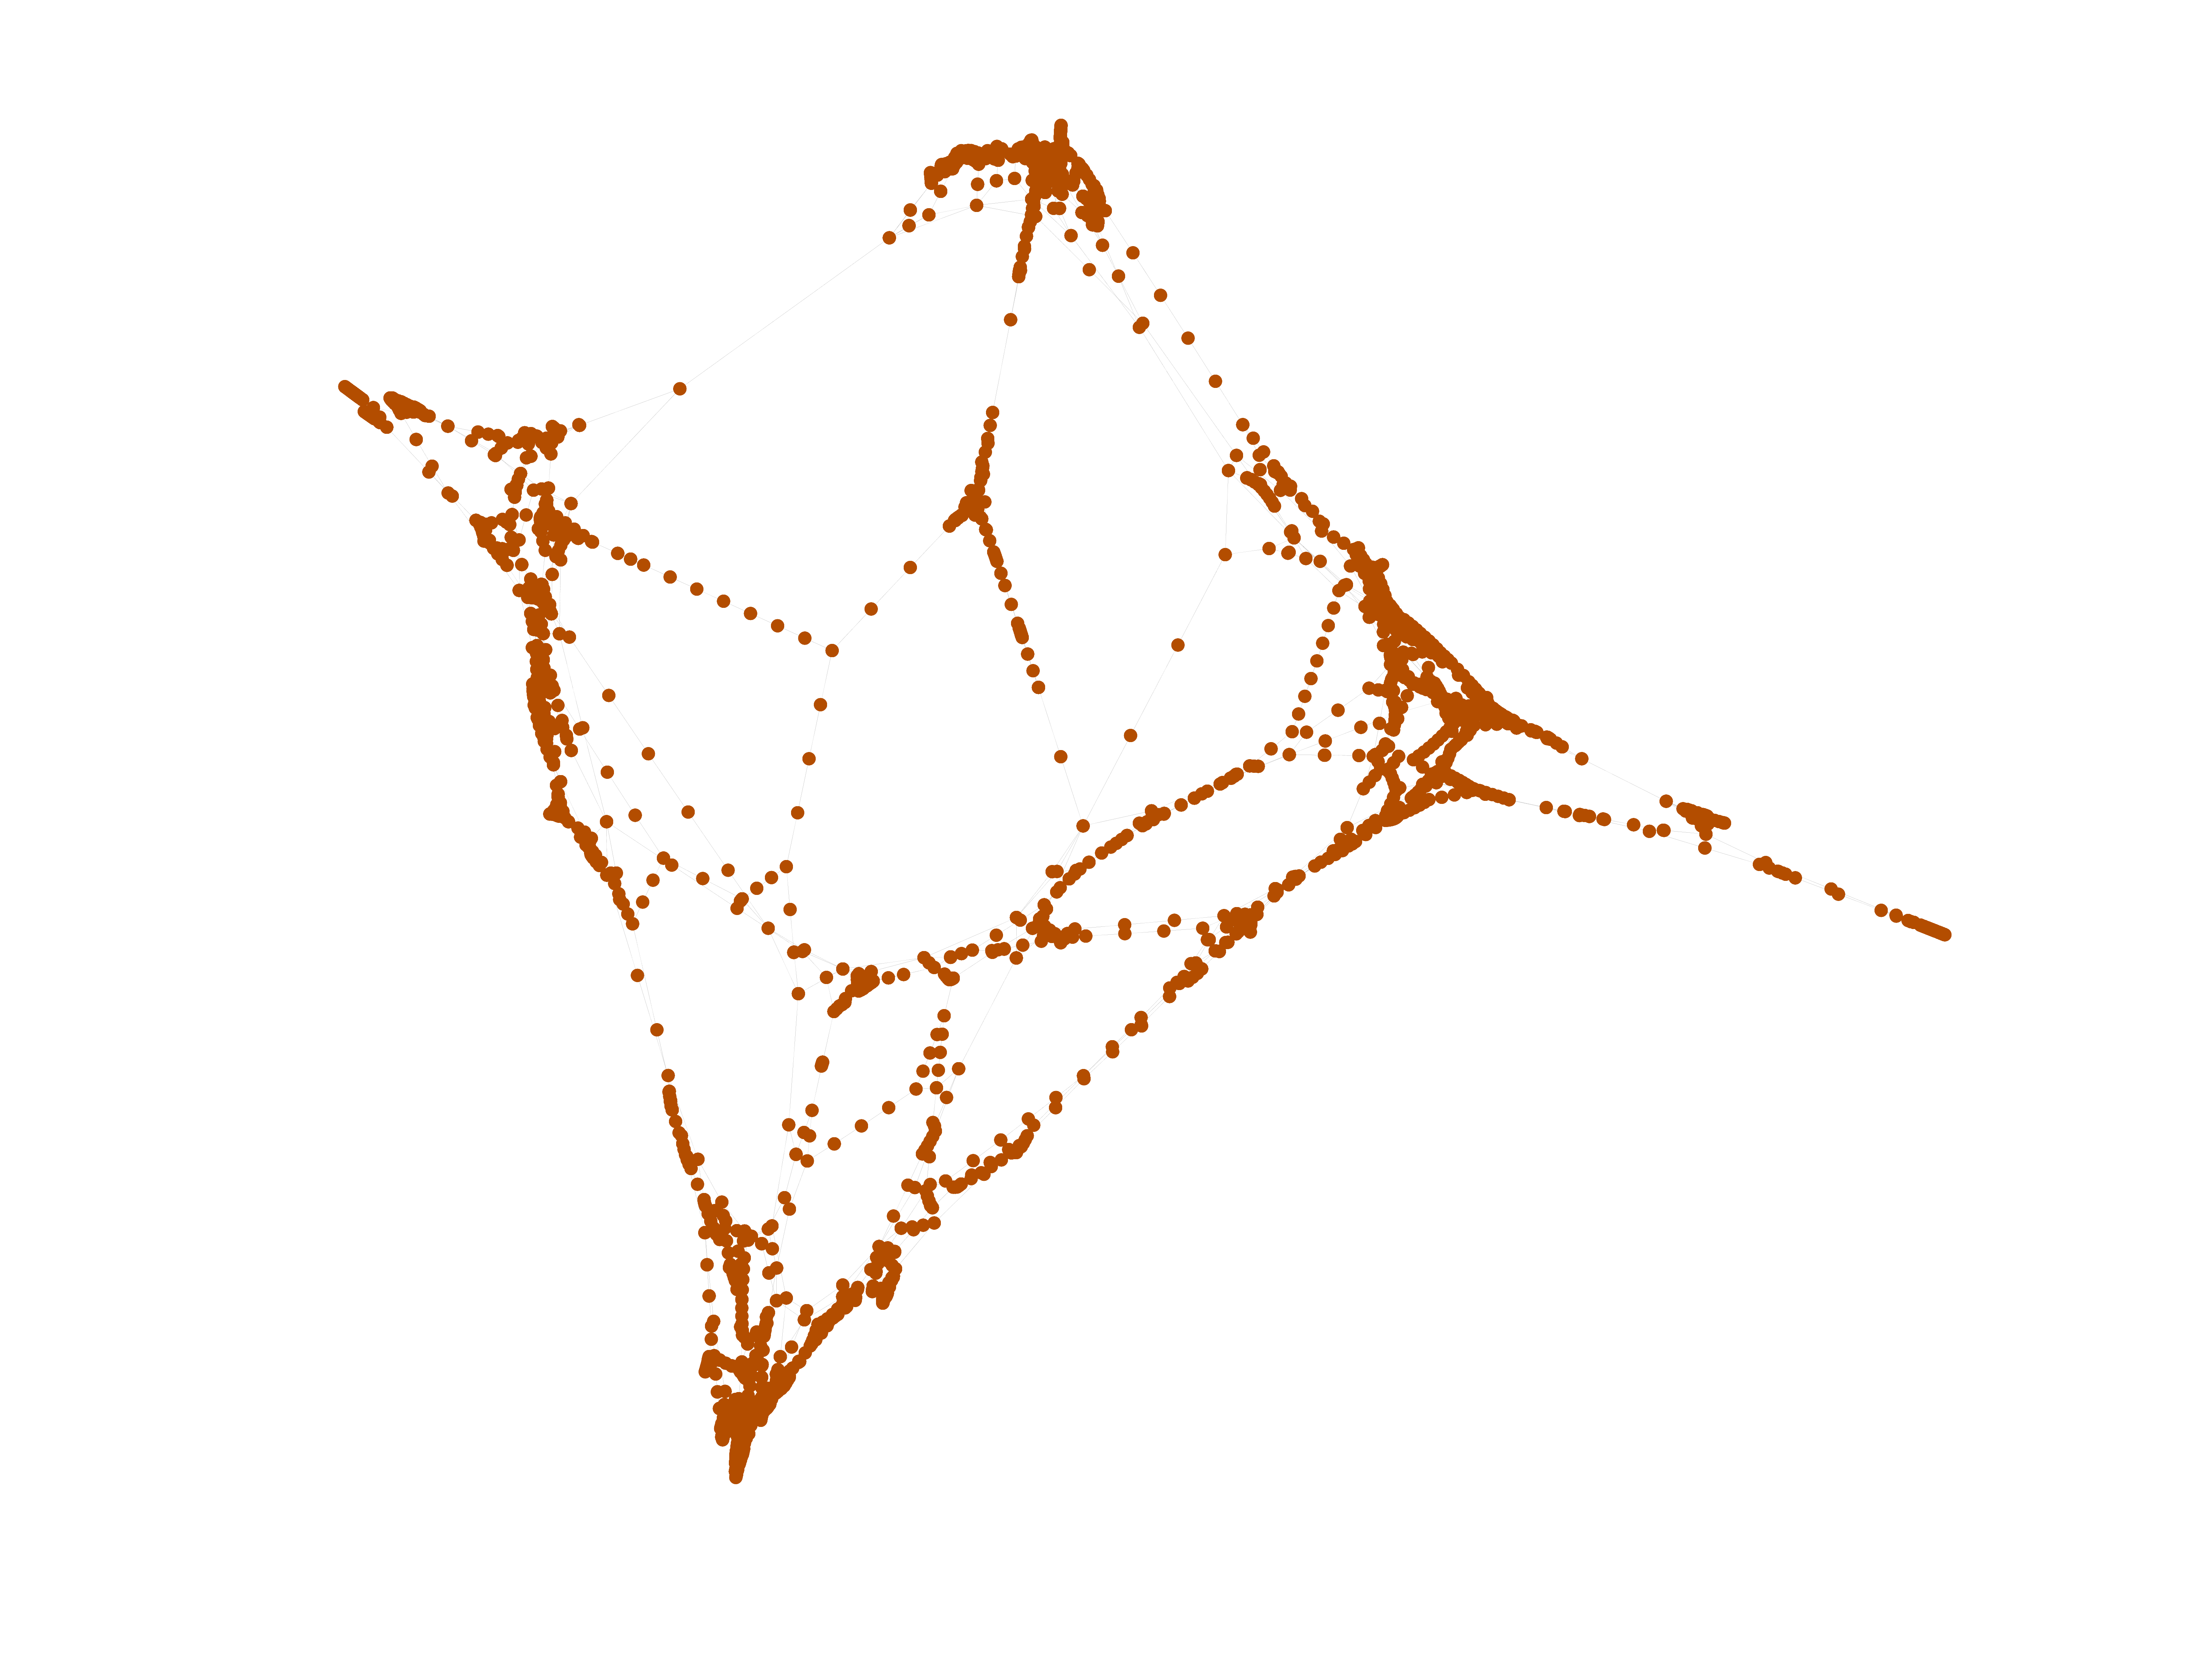
This undirected network contains information about the power grid of the Western States of the United States of America. An edge represents a power supply line. A node is either a generator, a transformator or a substation.

Metadata

CodeUG
Internal nameopsahl-powergrid
NameUS power grid
Data sourcehttp://toreopsahl.com/datasets/#uspowergrid
AvailabilityDataset is available for download
Consistency checkDataset passed all tests
Category
Infrastructure network
Node meaningNode
Edge meaningSupply
Network formatUnipartite, undirected
Edge typeUnweighted, no multiple edges
LoopsDoes not contain loops

Statistics

Size n =4,941
Volume m =6,594
Loop count l =0
Wedge count s =18,933
Claw count z =26,050
Cross count x =38,357
Triangle count t =651
Square count q =979
4-Tour count T4 =96,752
Maximum degree dmax =19
Average degree d =2.669 10
Fill p =0.000 540 303
Size of LCC N =4,941
Diameter δ =46
50-Percentile effective diameter δ0.5 =19.675 7
90-Percentile effective diameter δ0.9 =28.172 8
Median distance δM =20
Mean distance δm =20.094 1
Gini coefficient G =0.324 777
Balanced inequality ratio P =0.379 588
Relative edge distribution entropy Her =0.978 307
Power law exponent γ =2.246 78
Tail power law exponent γt =7.631 00
Tail power law exponent with p γ3 =7.631 00
p-value p =0.830 000
Degree assortativity ρ =+0.003 456 99
Degree assortativity p-value pρ =0.691 396
Clustering coefficient c =0.103 153
Spectral norm α =7.483 05
Algebraic connectivity a =0.000 759 212
Spectral separation 1[A] / λ2[A]| =1.132 21
Non-bipartivity bA =0.398 772
Normalized non-bipartivity bN =0.008 259 16
Algebraic non-bipartivity χ =0.016 118 7
Spectral bipartite frustration bK =0.001 509 75
Controllability C =721
Relative controllability Cr =0.145 922

Plots

Fruchterman–Reingold graph drawing

Degree distribution

Cumulative degree distribution

Lorenz curve

Spectral distribution of the adjacency matrix

Spectral distribution of the normalized adjacency matrix

Spectral distribution of the Laplacian

Spectral graph drawing based on the adjacency matrix

Spectral graph drawing based on the Laplacian

Spectral graph drawing based on the normalized adjacency matrix

Degree assortativity

Zipf plot

Hop distribution

Double Laplacian graph drawing

Delaunay graph drawing

Clustering coefficient distribution

Average neighbor degree distribution

SynGraphy

Matrix decompositions plots

Downloads

References

[1] Jérôme Kunegis. KONECT – The Koblenz Network Collection. In Proc. Int. Conf. on World Wide Web Companion, pages 1343–1350, 2013. [ http ]
[2] Duncan J. Watts and Steven H. Strogatz. Collective dynamics of `small-world' networks. Nature, 393(1):440–442, 1998.