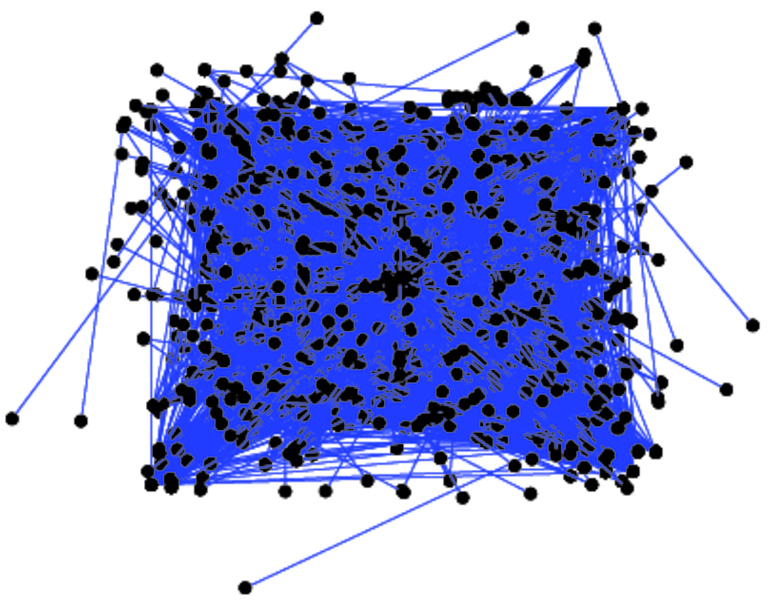
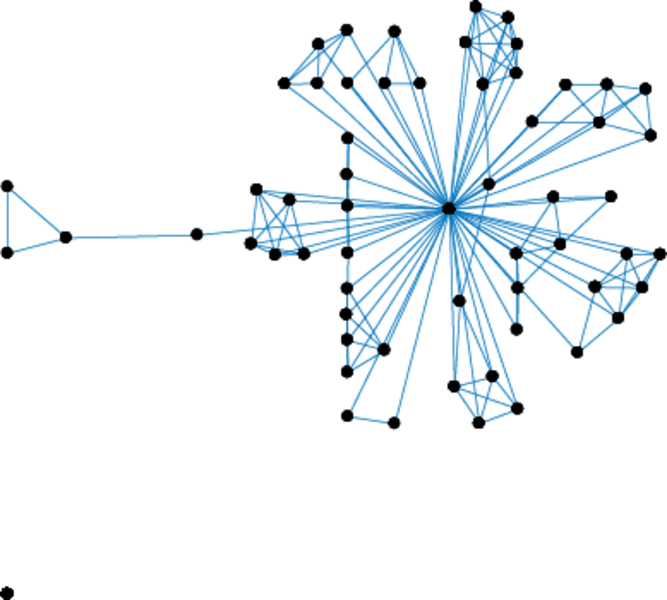
US airports
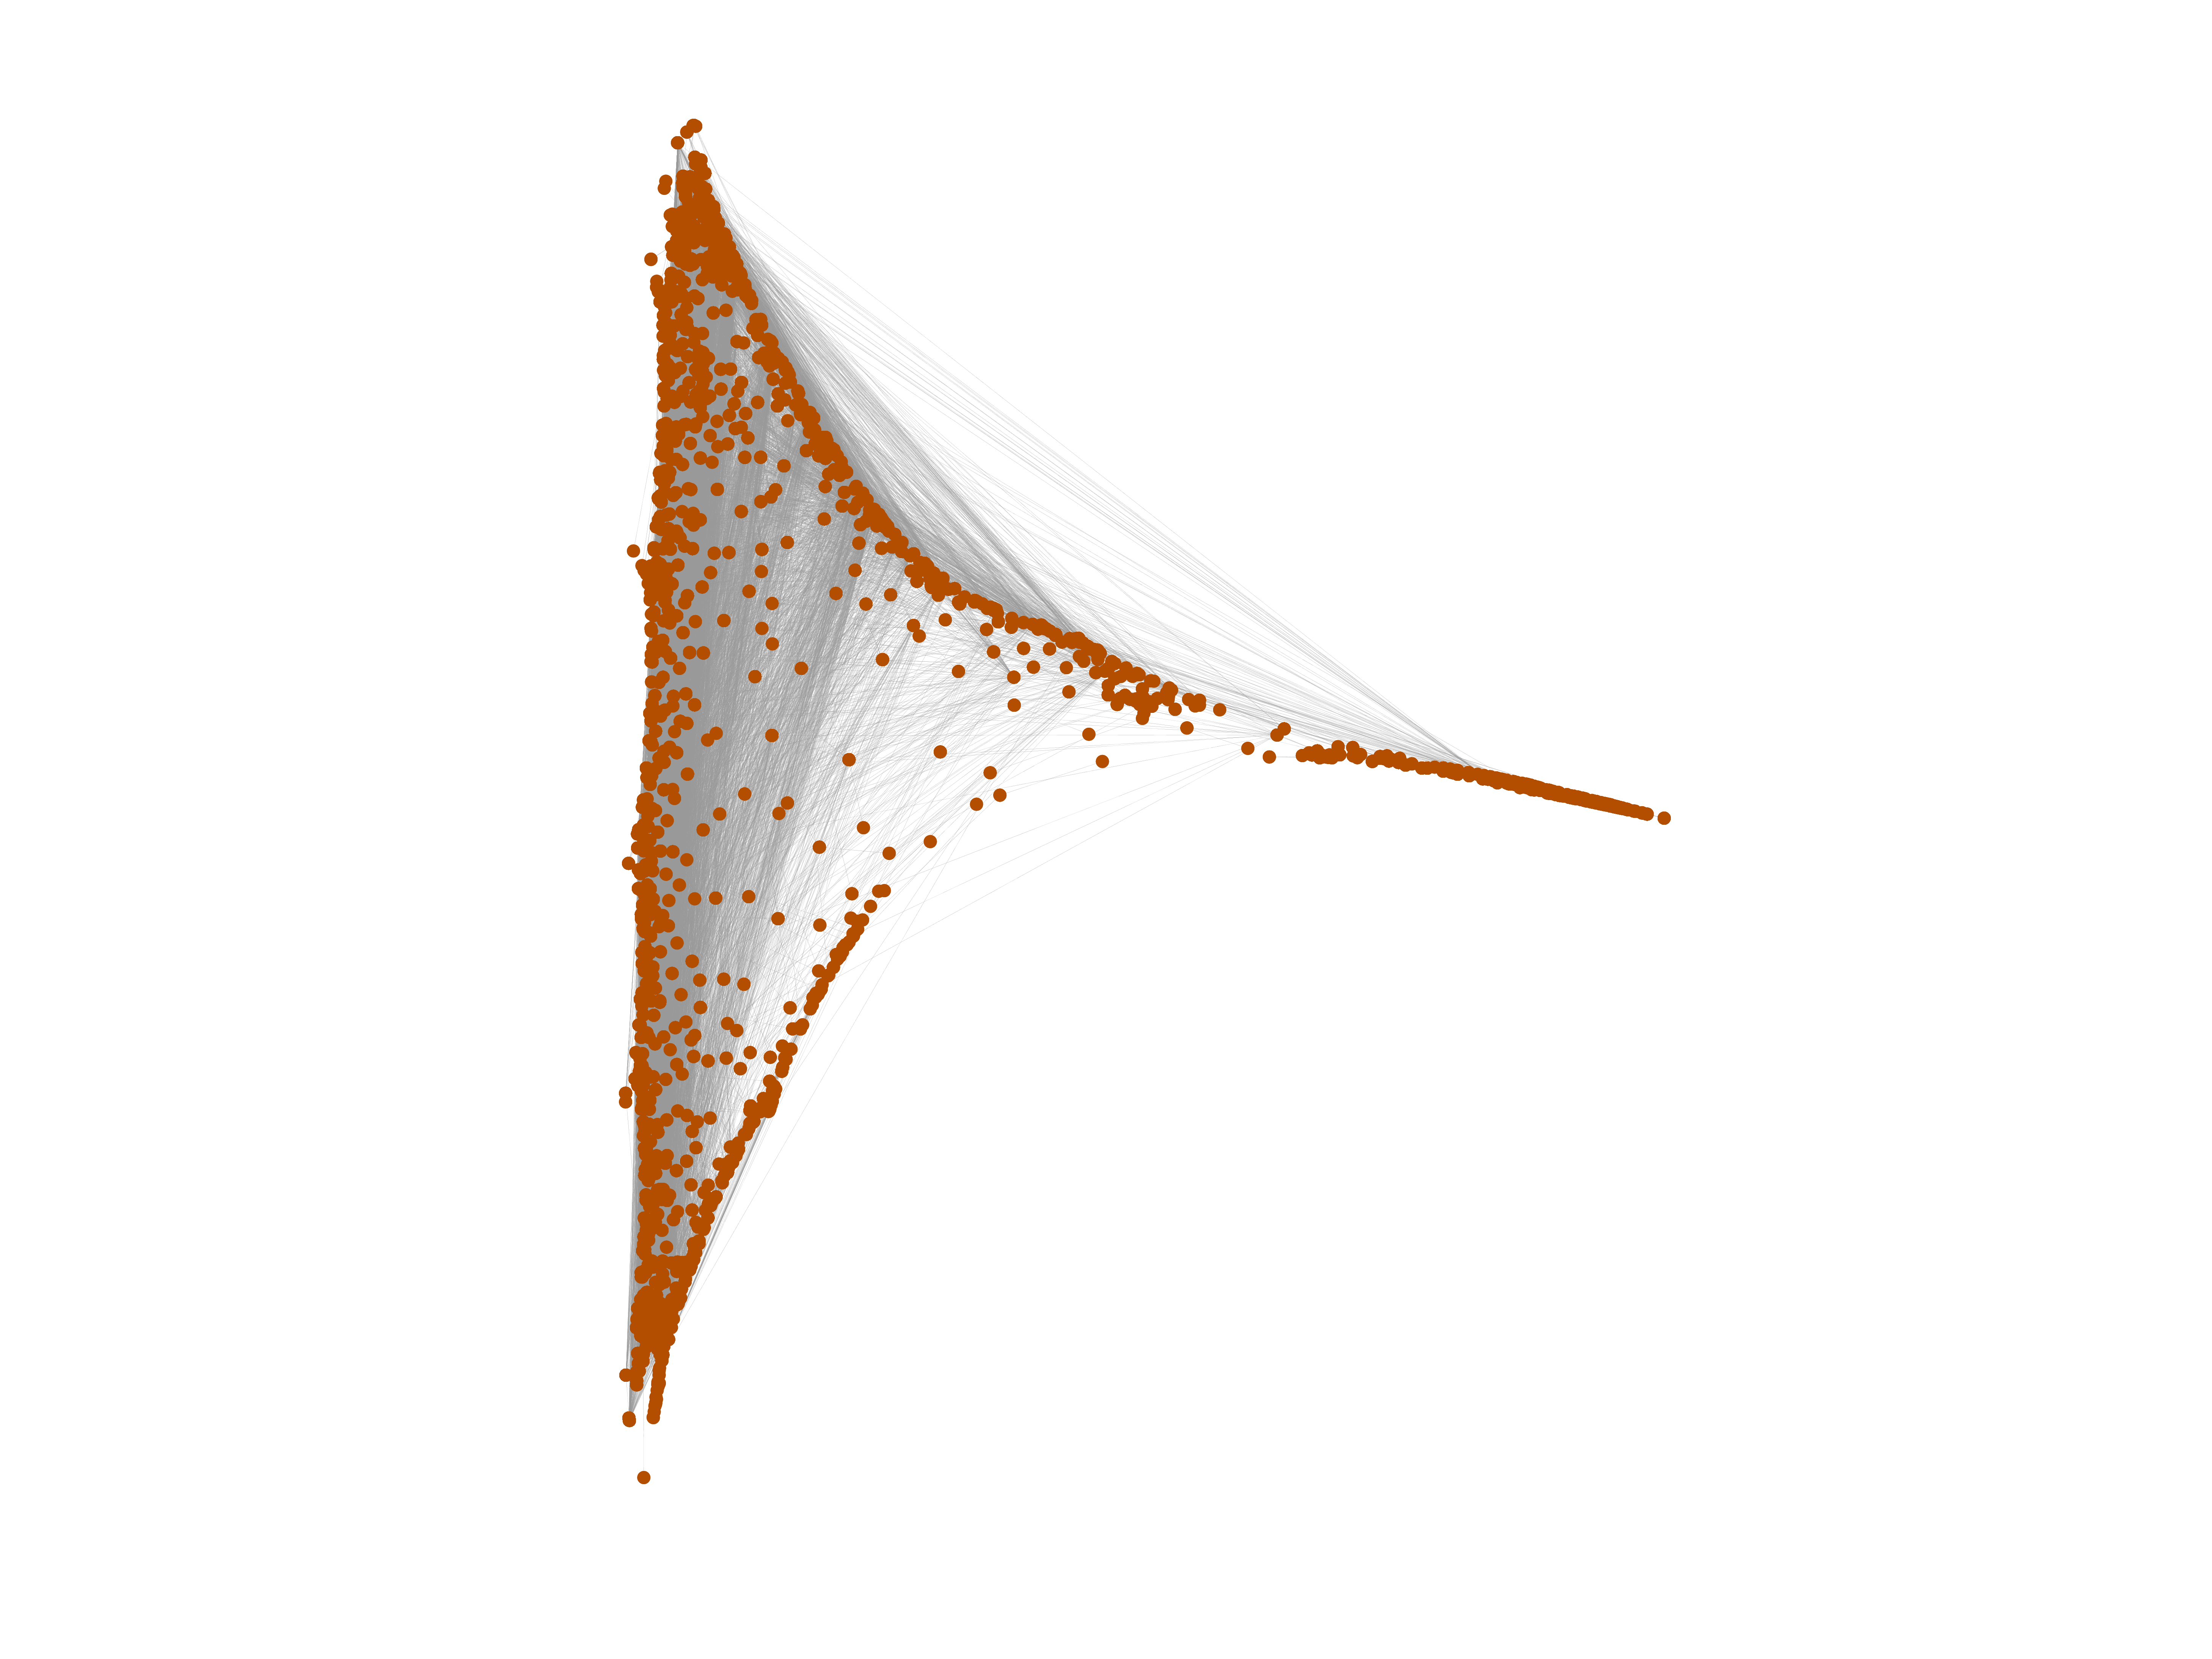
This is the directed network of flights between US airports in 2010. Each edge
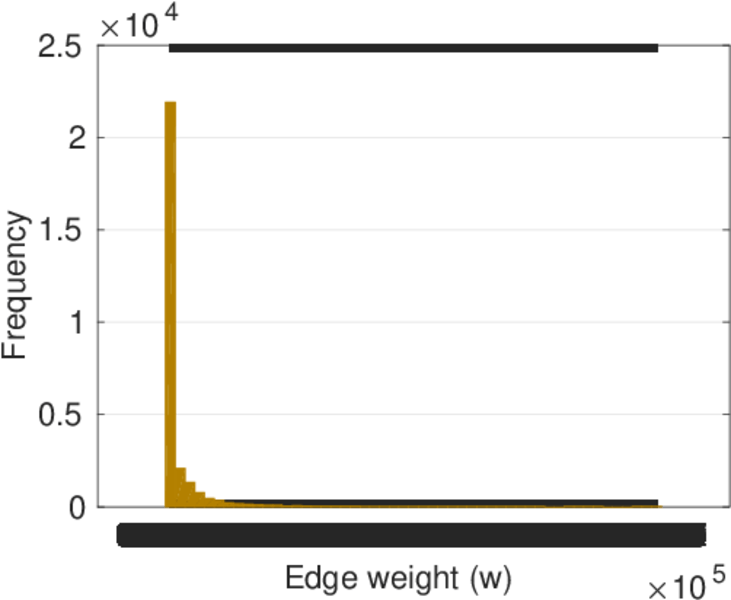
represents a connection from one airport to another, and the weight of an edge
shows the number of flights on that connection in the given direction, in 2010.
Metadata
Statistics
| Size | n = | 1,574
|
| Volume | m = | 28,236
|
| Loop count | l = | 0
|
| Wedge count | s = | 1,914,691
|
| Claw count | z = | 612,363,375
|
| Cross count | x = | 60,144,933,383
|
| Triangle count | t = | 245,172
|
| Square count | q = | 19,604,634
|
| 4-Tour count | T4 = | 164,530,266
|
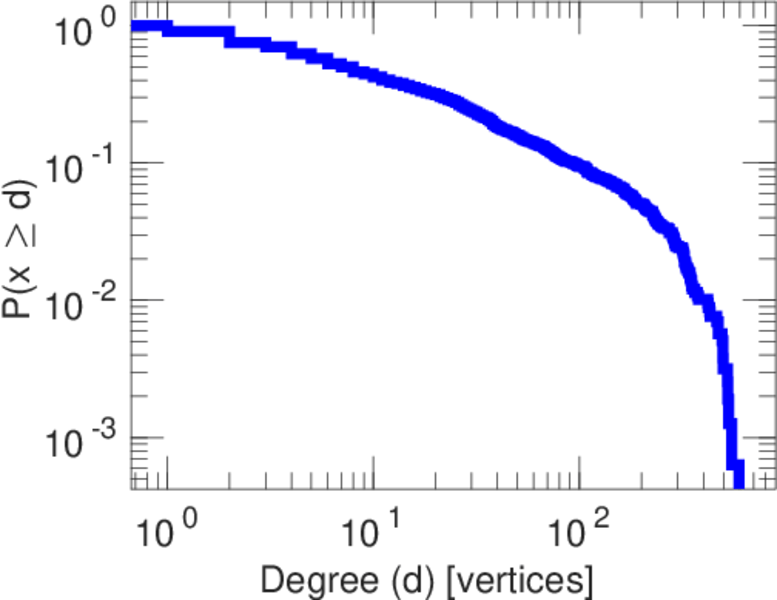
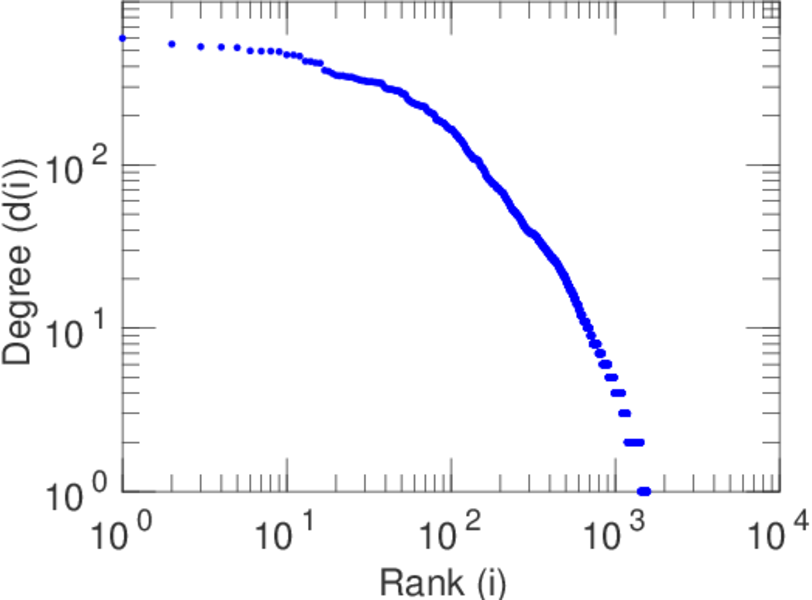
| Maximum degree | dmax = | 596
|
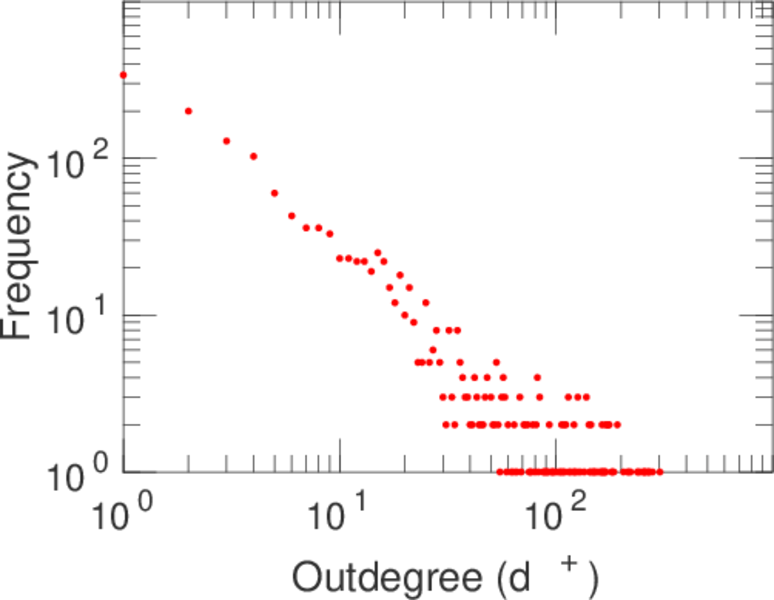
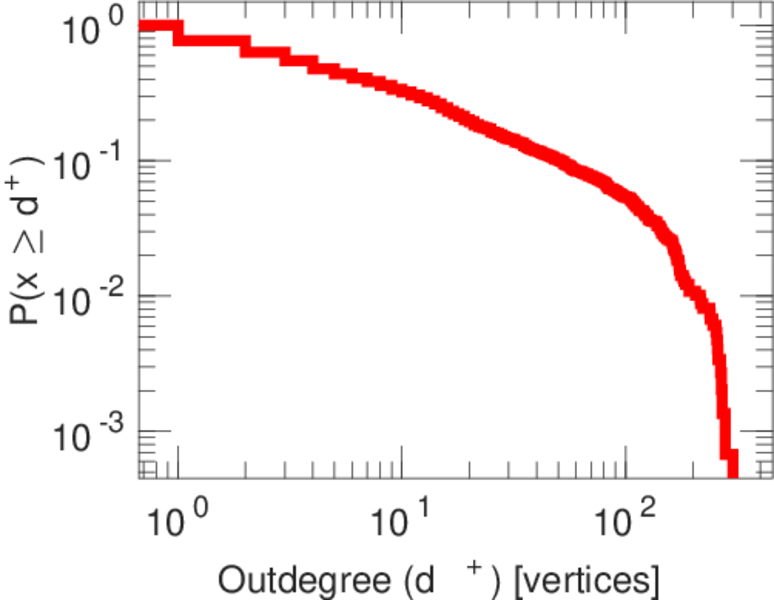
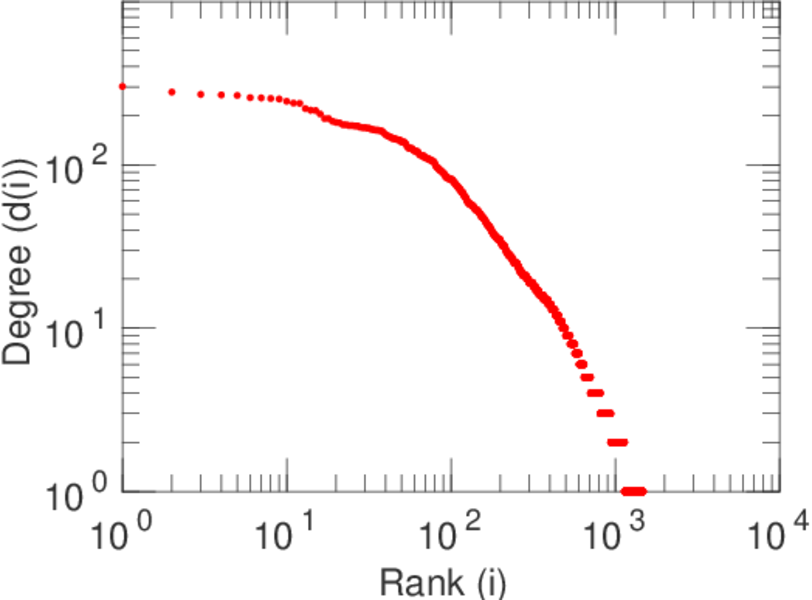
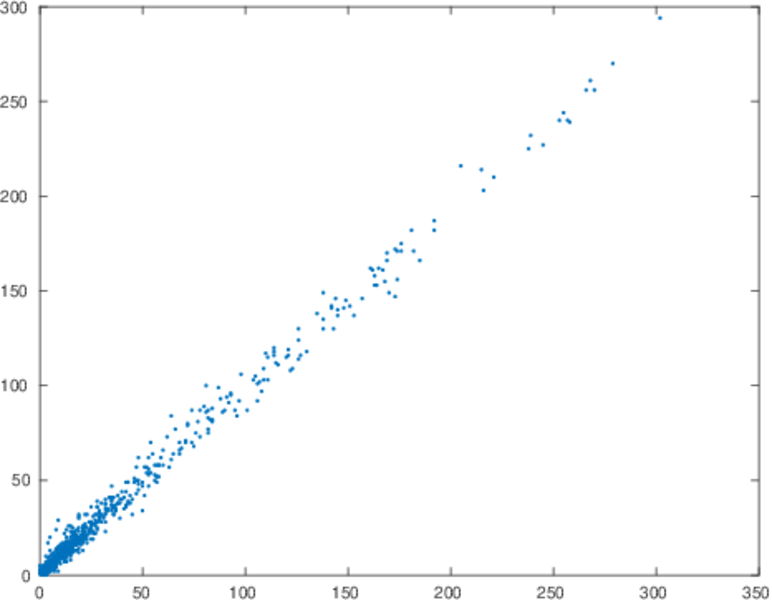
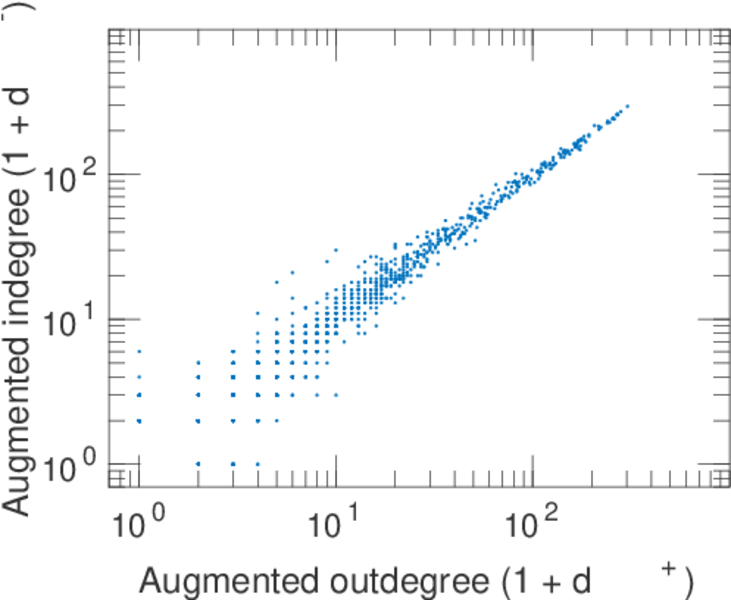
| Maximum outdegree | d+max = | 302
|
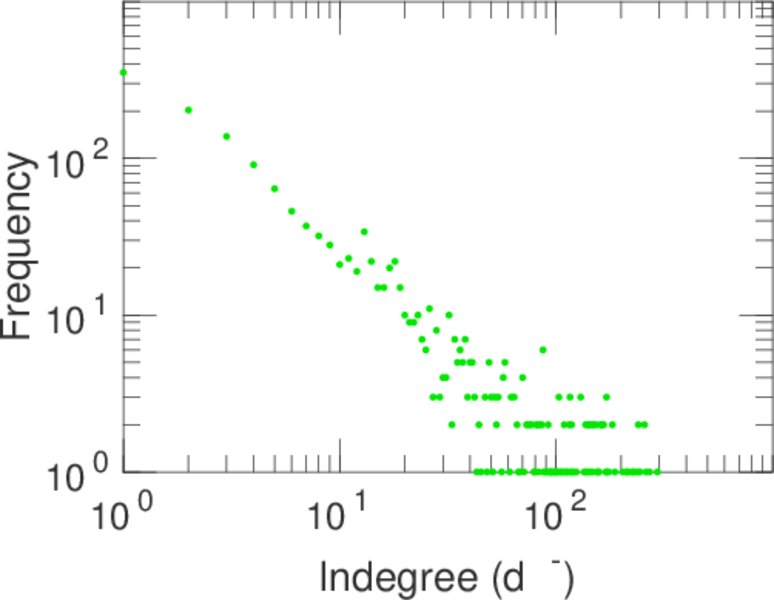
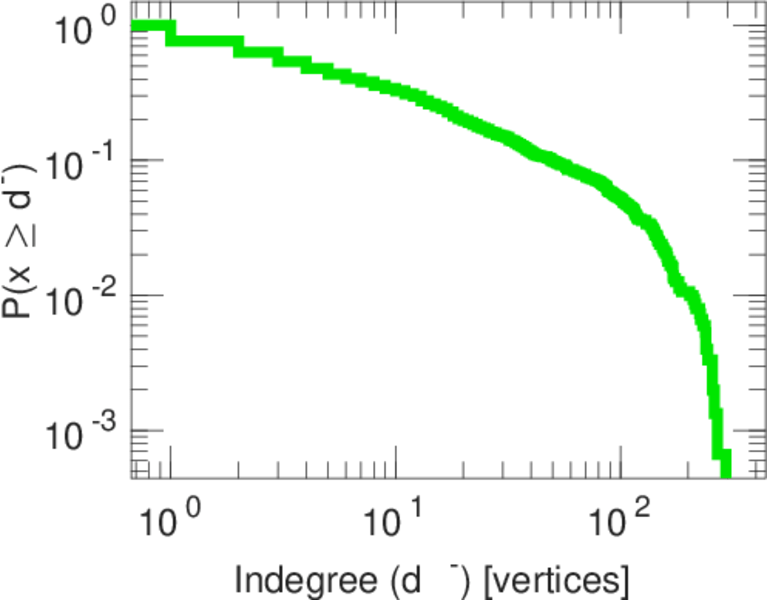
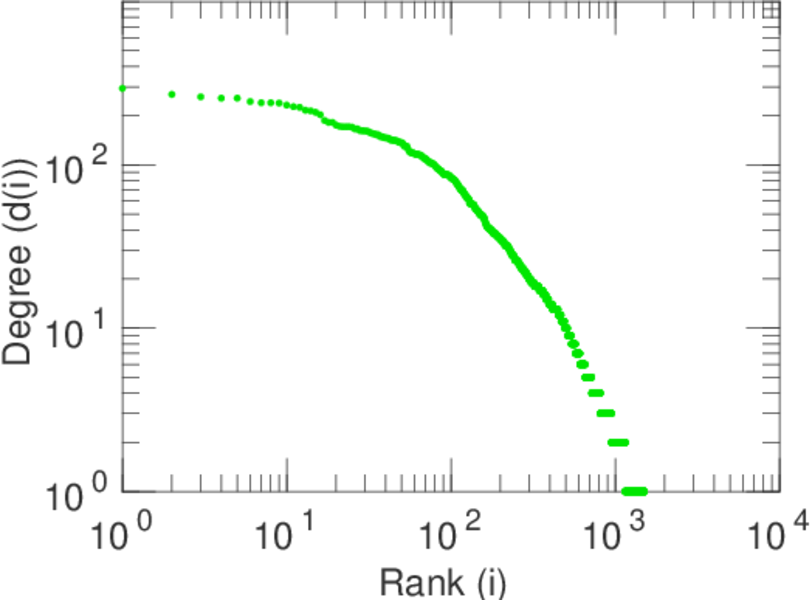
| Maximum indegree | d−max = | 294
|
| Average degree | d = | 35.878 0
|
| Fill | p = | 0.011 404 3
|
| Size of LCC | N = | 1,572
|
| Size of LSCC | Ns = | 1,402
|
| Relative size of LSCC | Nrs = | 0.890 724
|
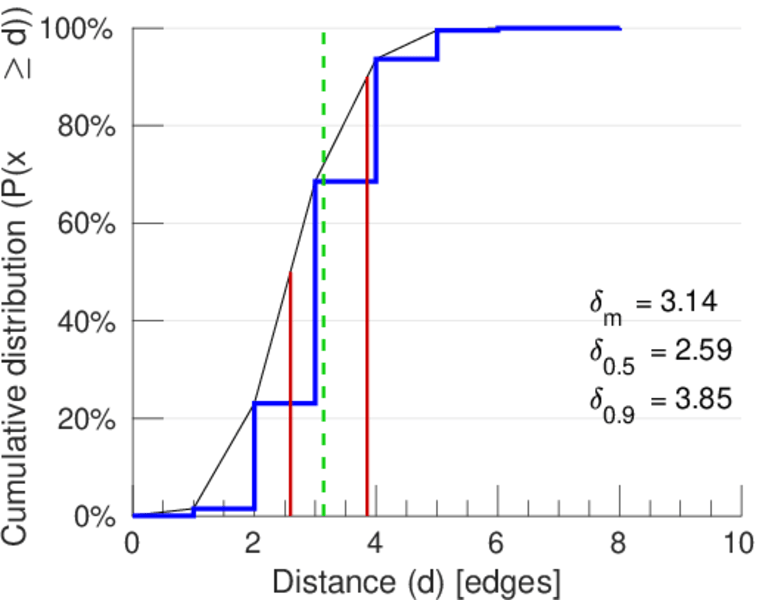
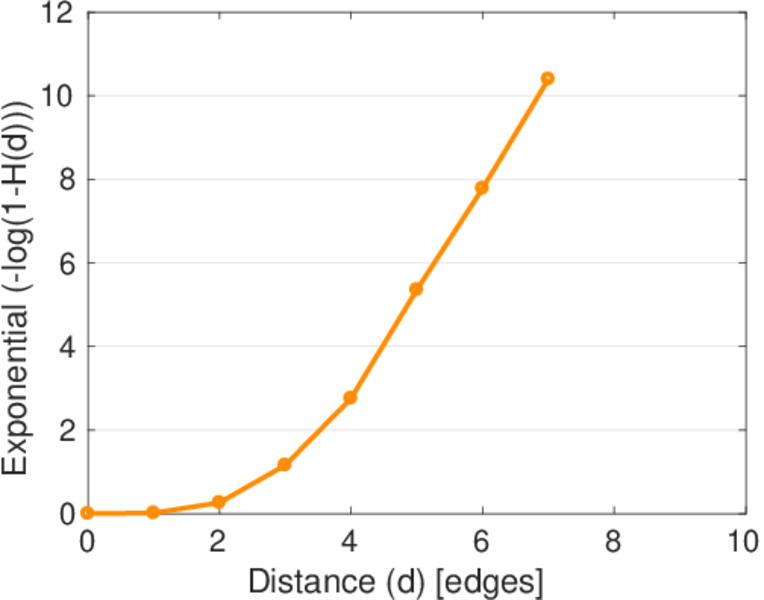
| Diameter | δ = | 8
|
| 50-Percentile effective diameter | δ0.5 = | 2.592 05
|
| 90-Percentile effective diameter | δ0.9 = | 3.854 67
|
| Median distance | δM = | 3
|
| Mean distance | δm = | 3.136 85
|
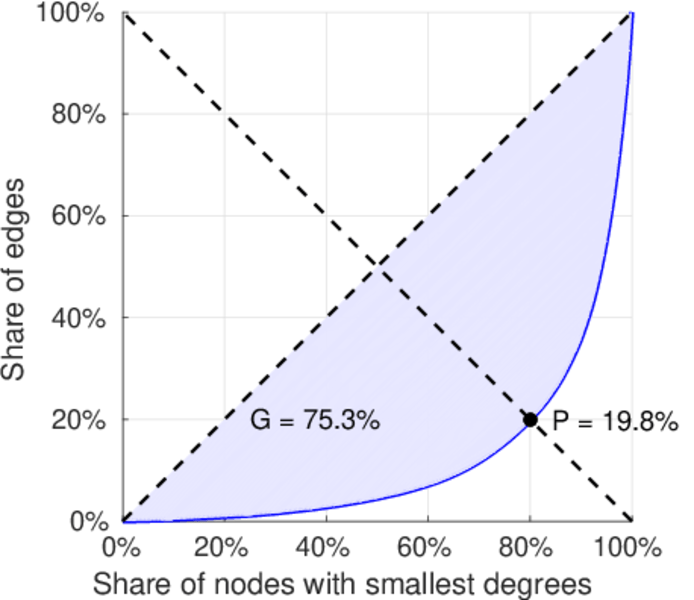
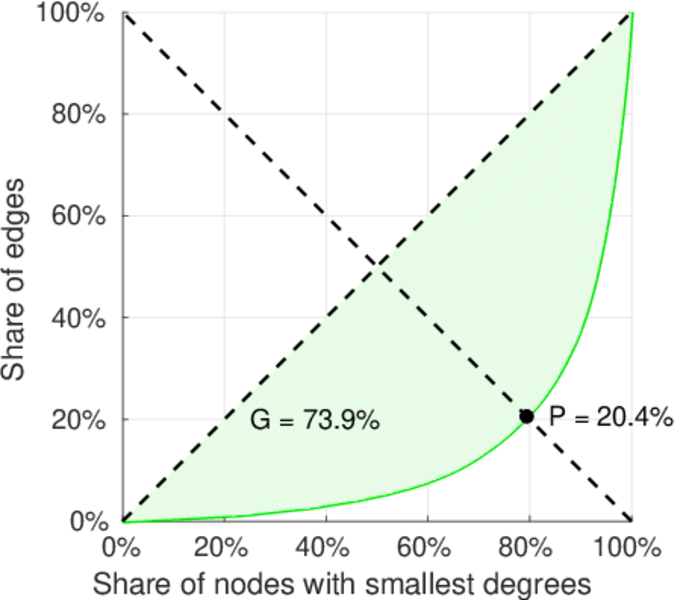
| Gini coefficient | G = | 0.753 400
|
| Balanced inequality ratio | P = | 0.197 762
|
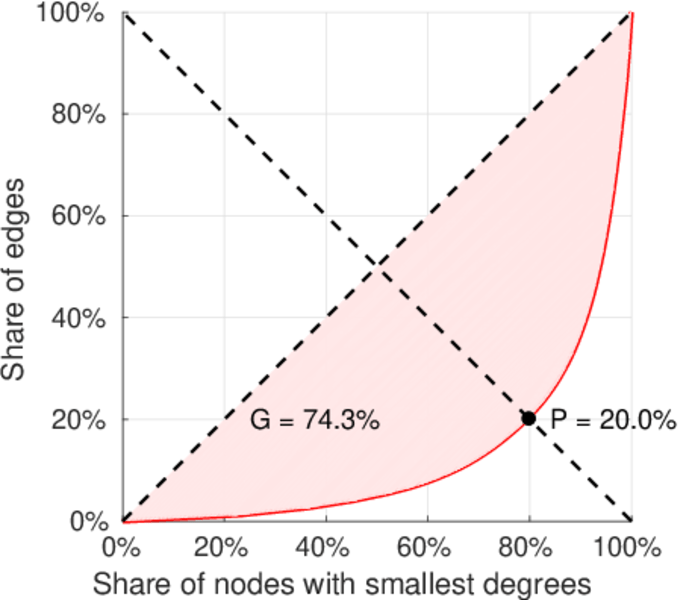
| Outdegree balanced inequality ratio | P+ = | 0.200 418
|
| Indegree balanced inequality ratio | P− = | 0.204 349
|
| Relative edge distribution entropy | Her = | 0.841 657
|
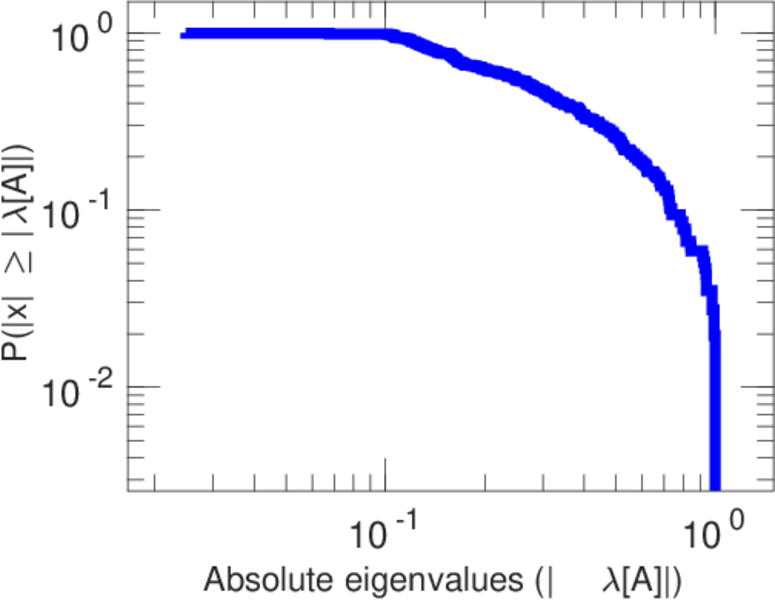
| Power law exponent | γ = | 1.546 88
|
| Tail power law exponent | γt = | 1.851 00
|
| Tail power law exponent with p | γ3 = | 1.851 00
|
| p-value | p = | 0.000 00
|
| Outdegree tail power law exponent with p | γ3,o = | 1.851 00
|
| Outdegree p-value | po = | 0.000 00
|
| Indegree tail power law exponent with p | γ3,i = | 1.861 00
|
| Indegree p-value | pi = | 0.000 00
|
| Degree assortativity | ρ = | −0.113 295
|
| Degree assortativity p-value | pρ = | 9.930 38 × 10−99
|
| In/outdegree correlation | ρ± = | +0.966 816
|
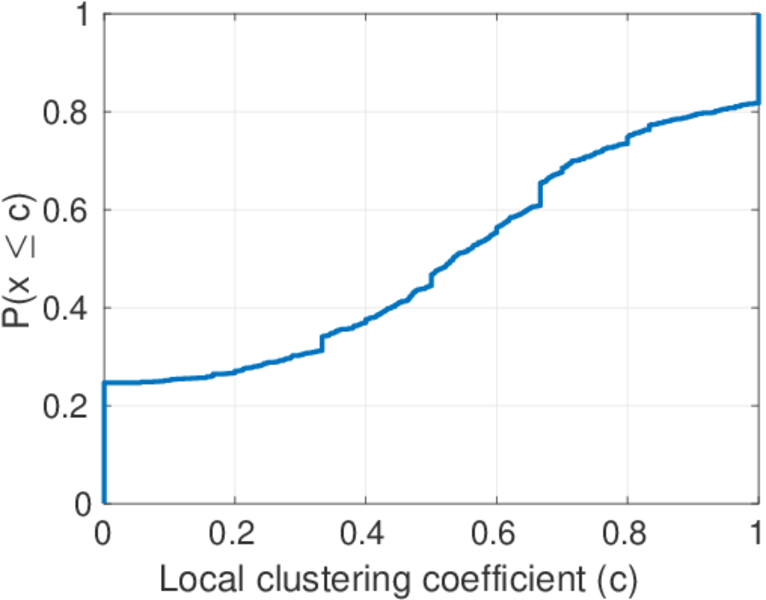
| Clustering coefficient | c = | 0.384 143
|
| Directed clustering coefficient | c± = | 0.363 179
|
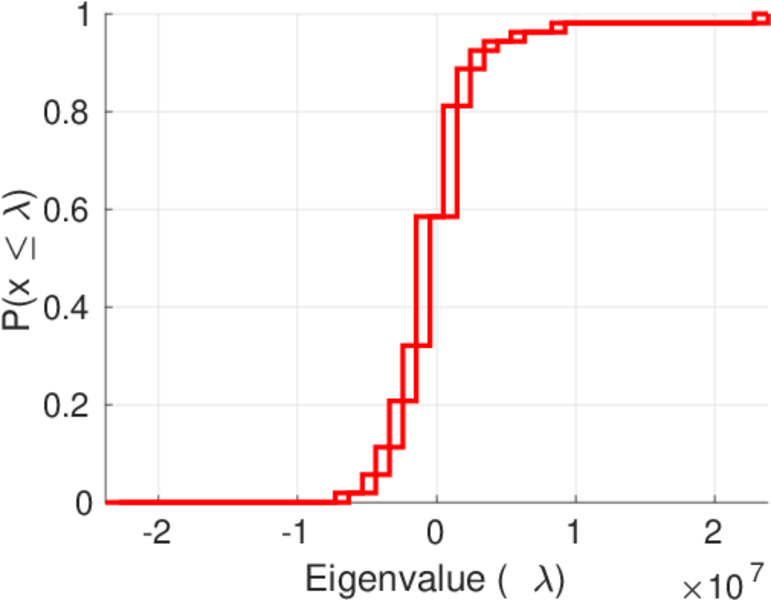
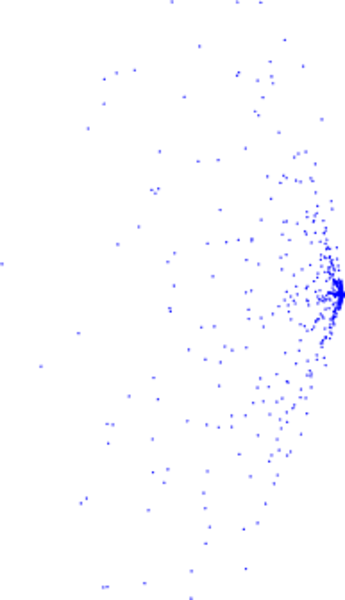
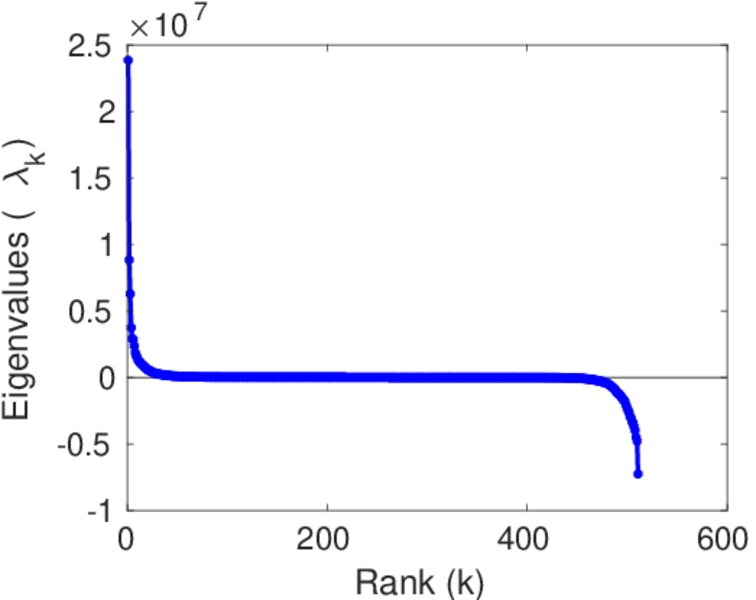
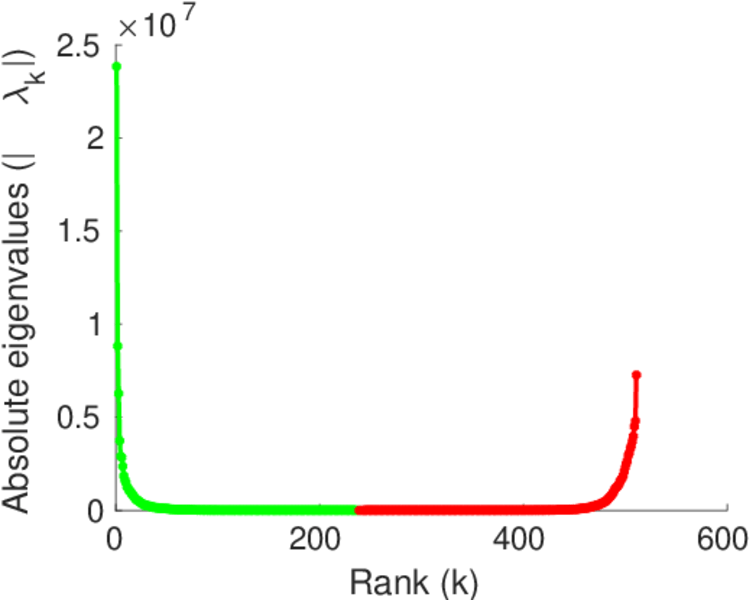
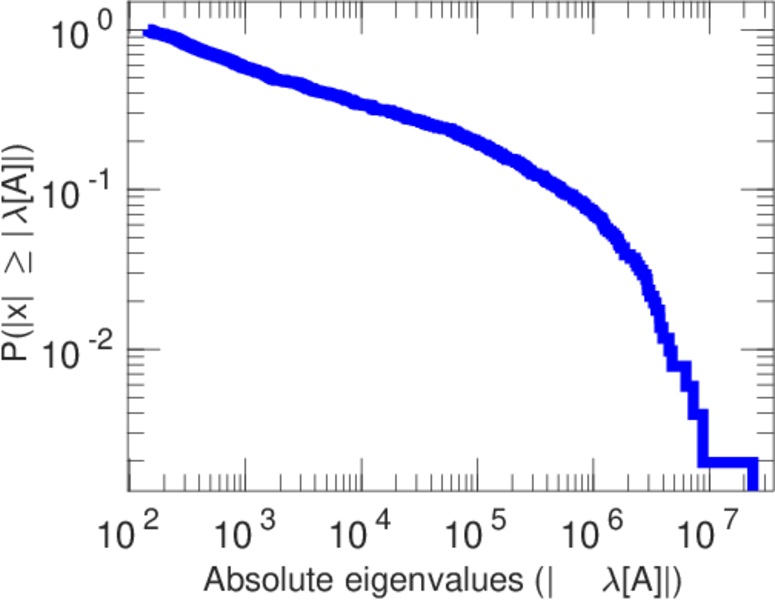
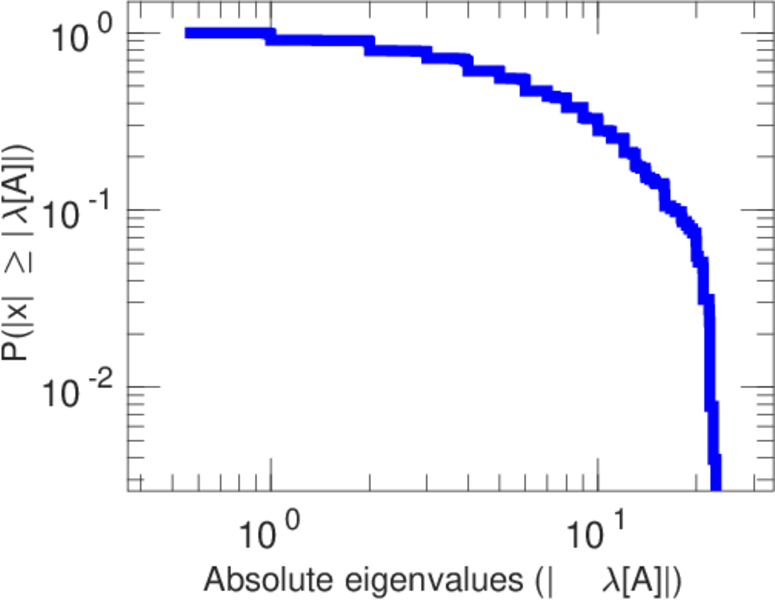
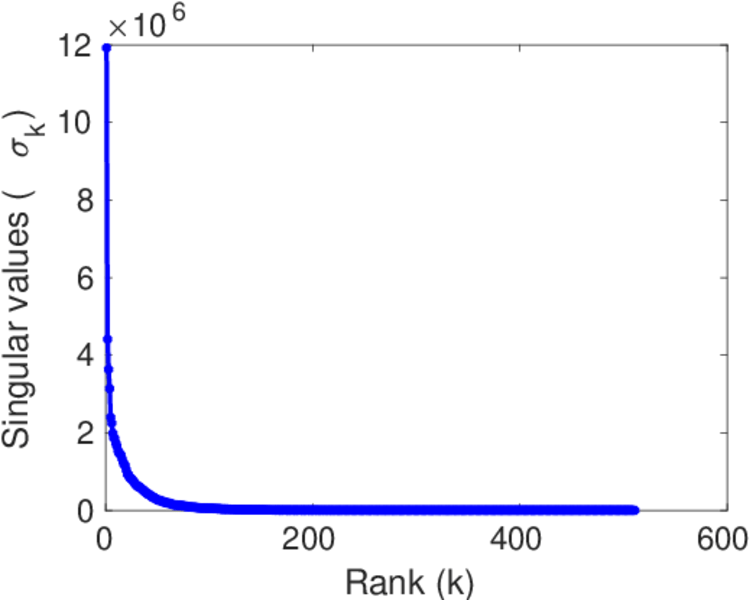
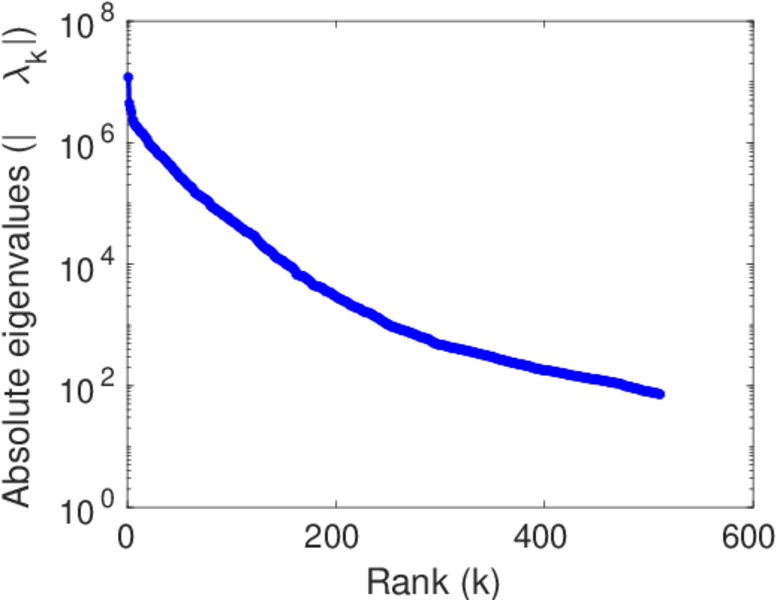
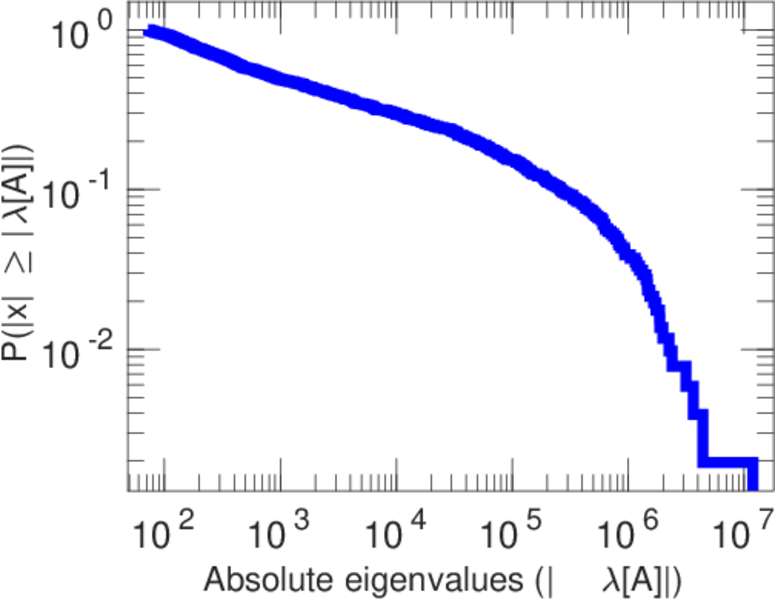
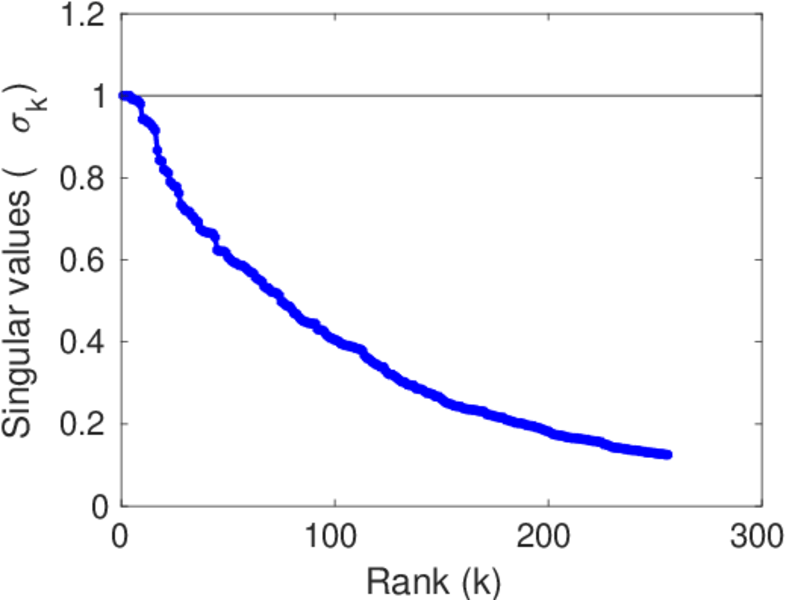
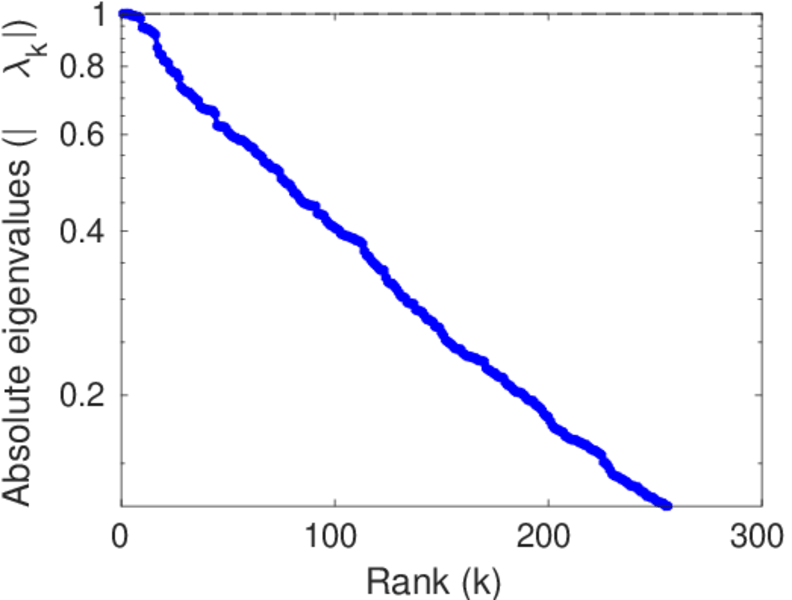
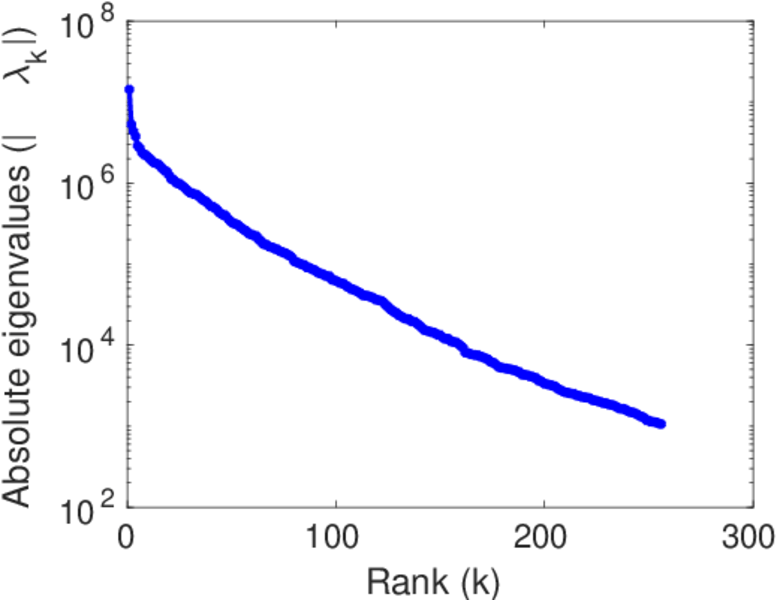
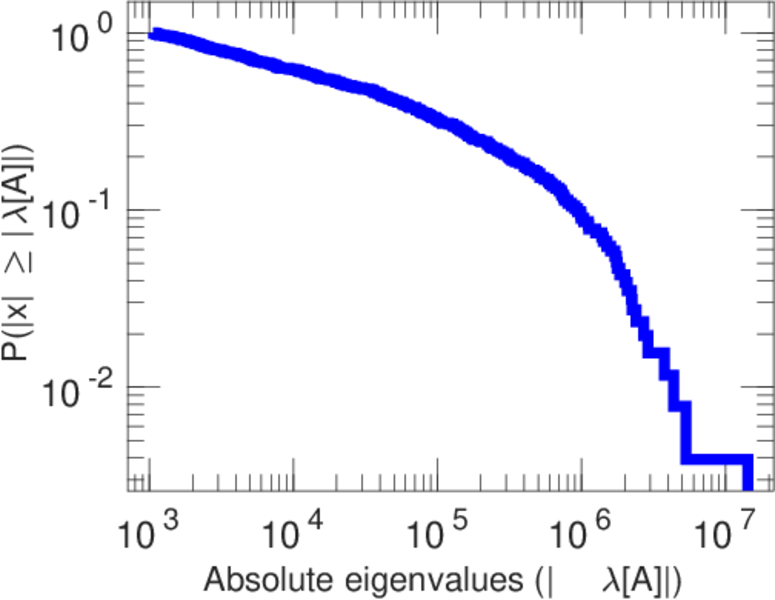
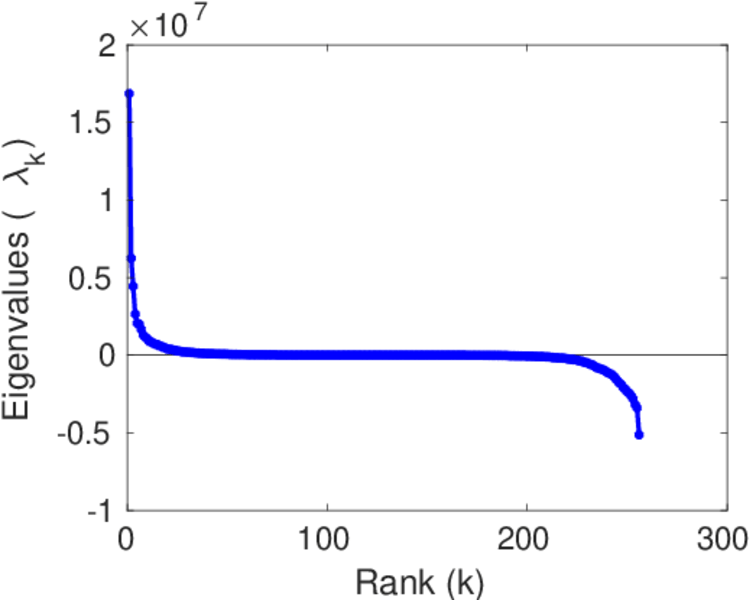
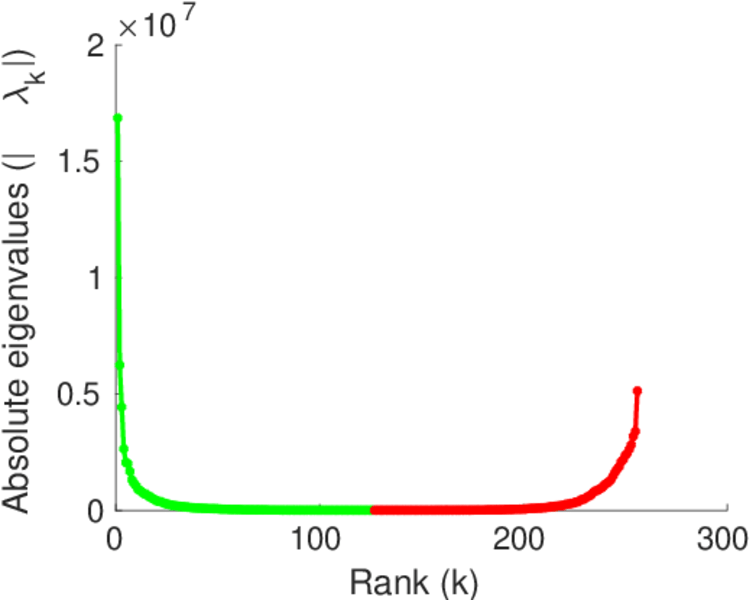
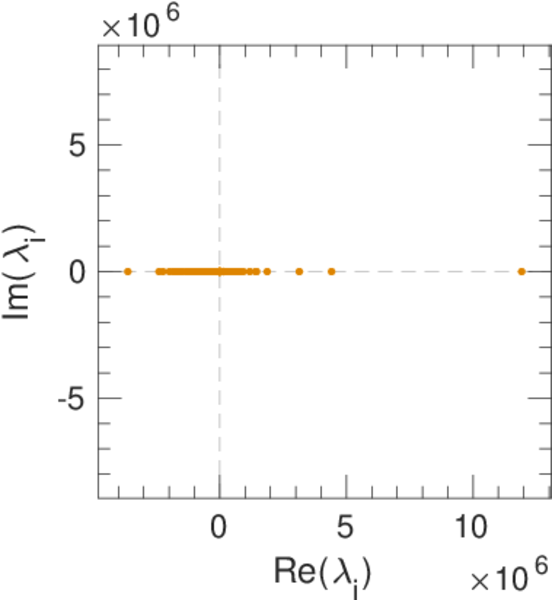
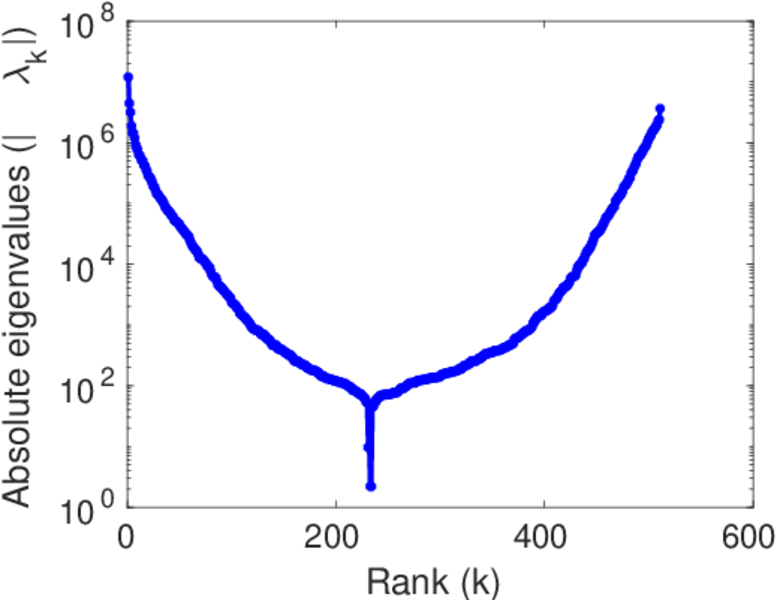
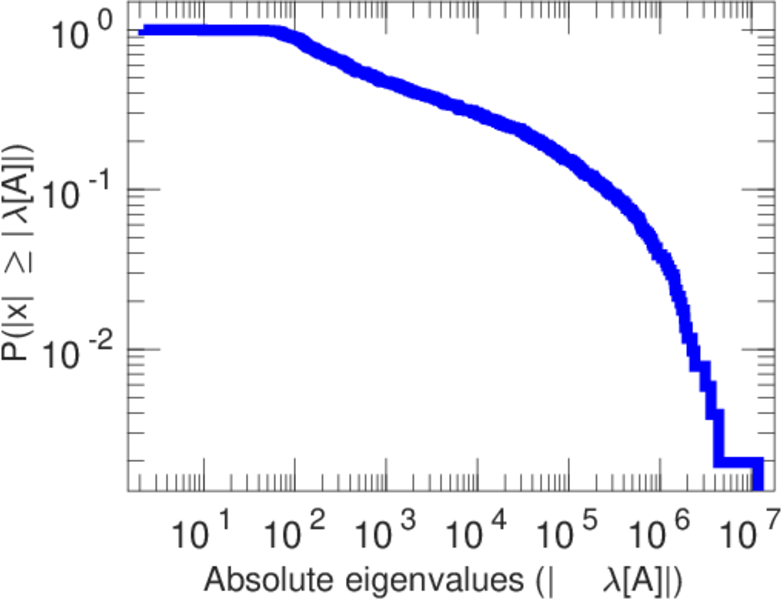
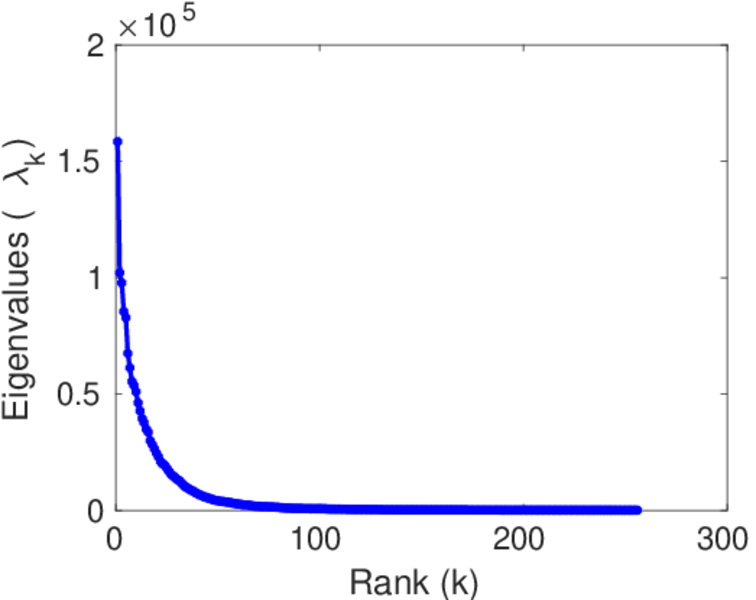
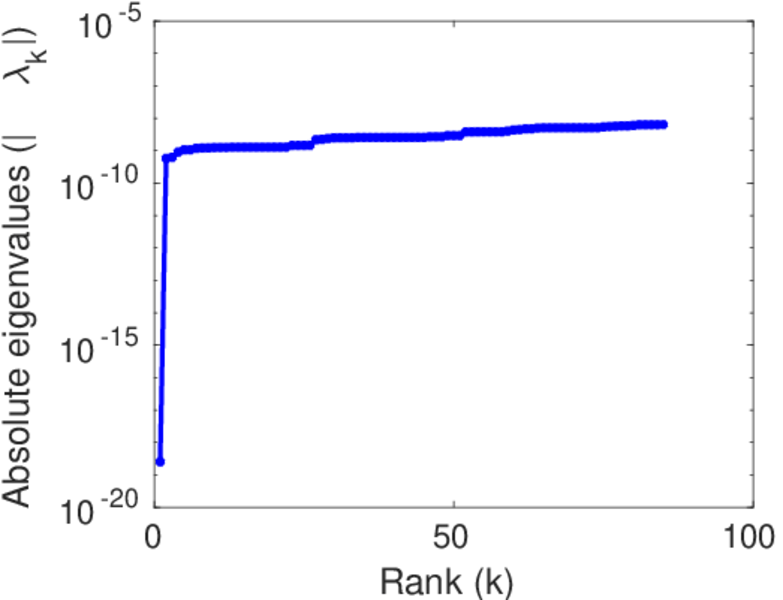
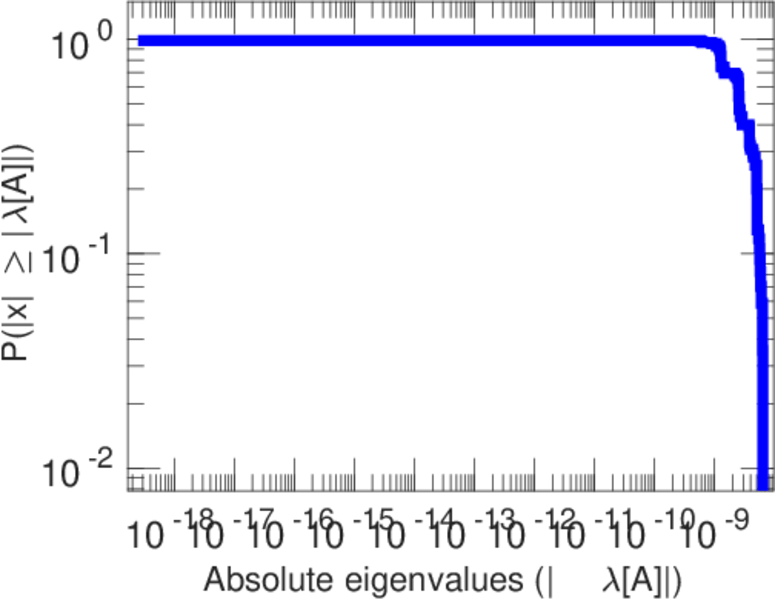
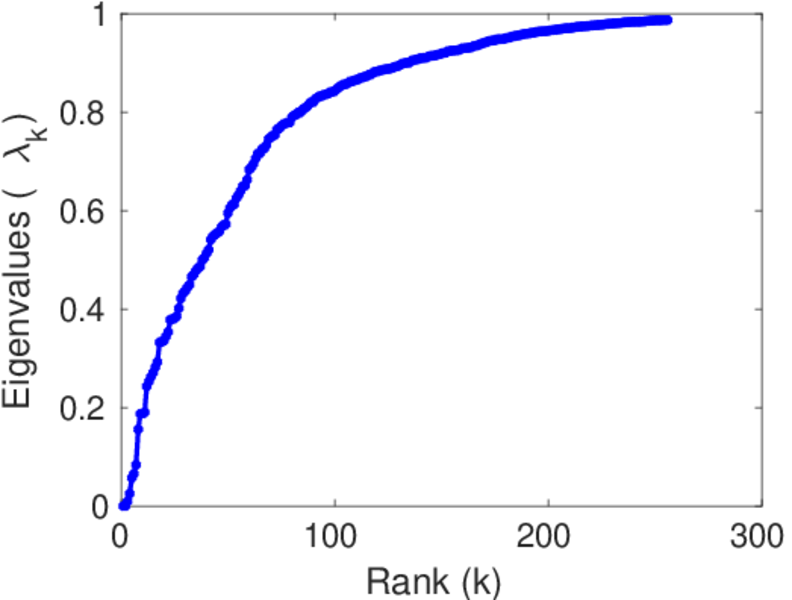
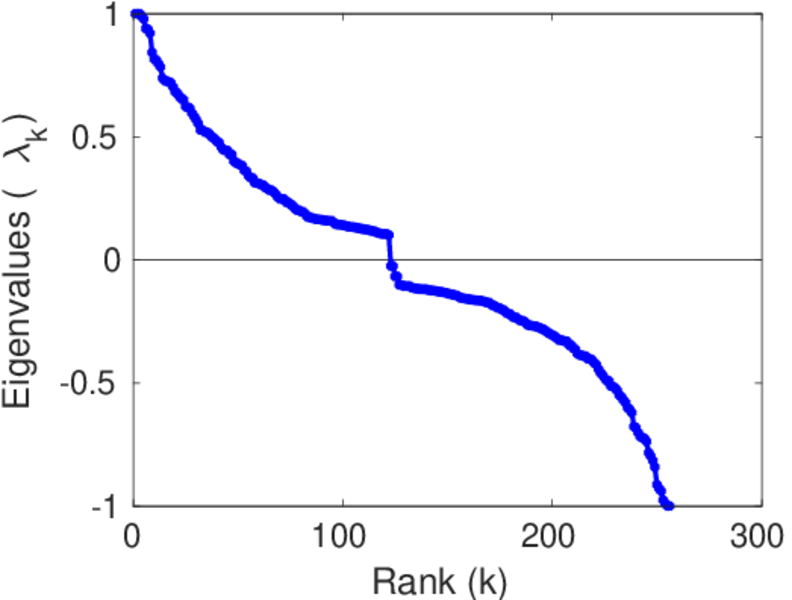
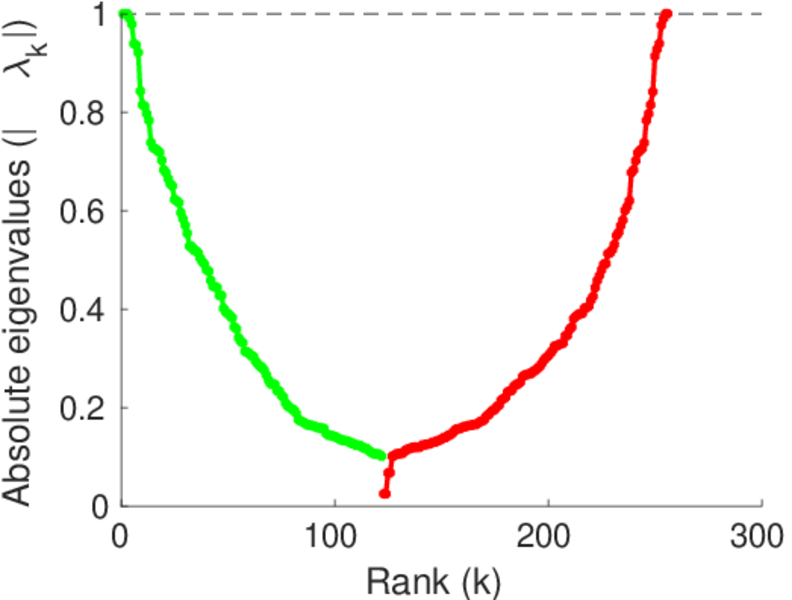
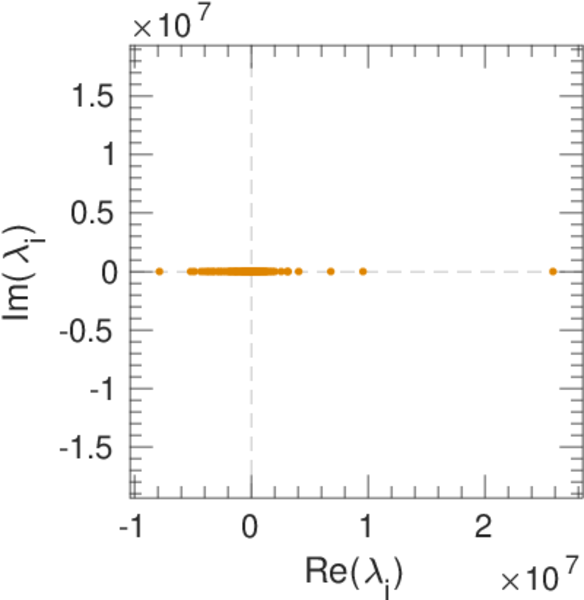
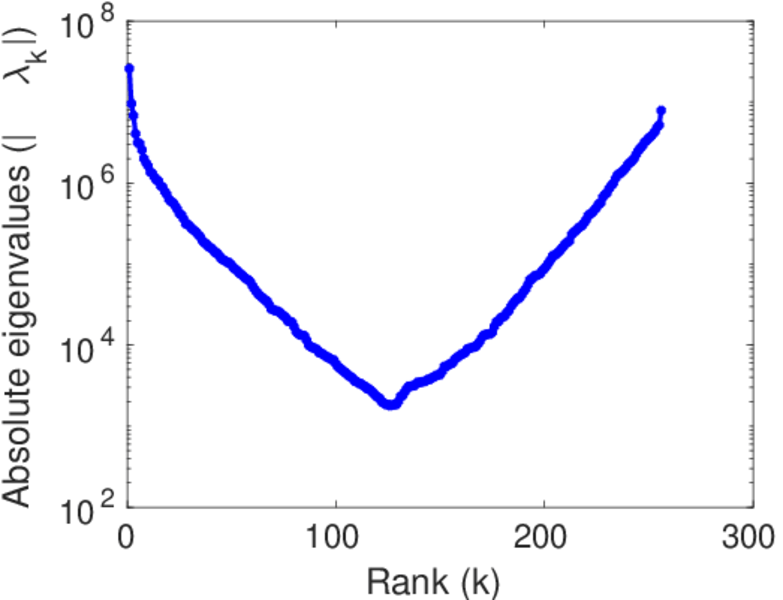
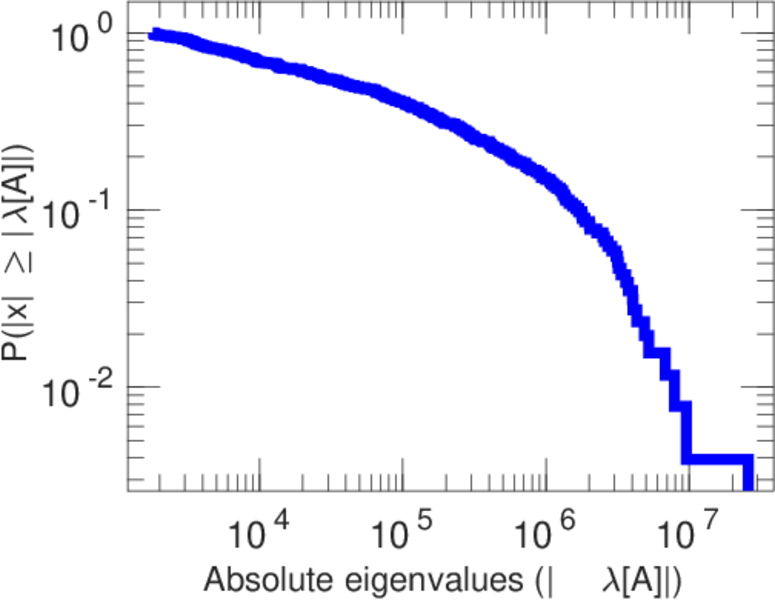
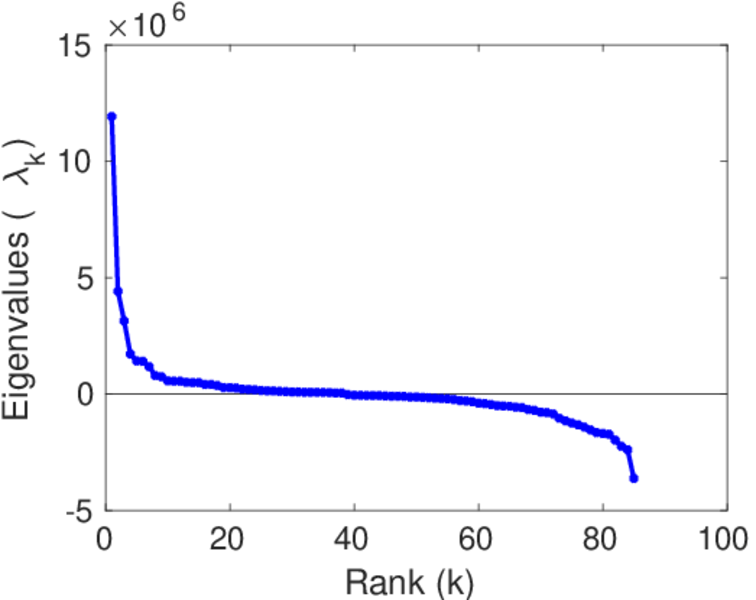
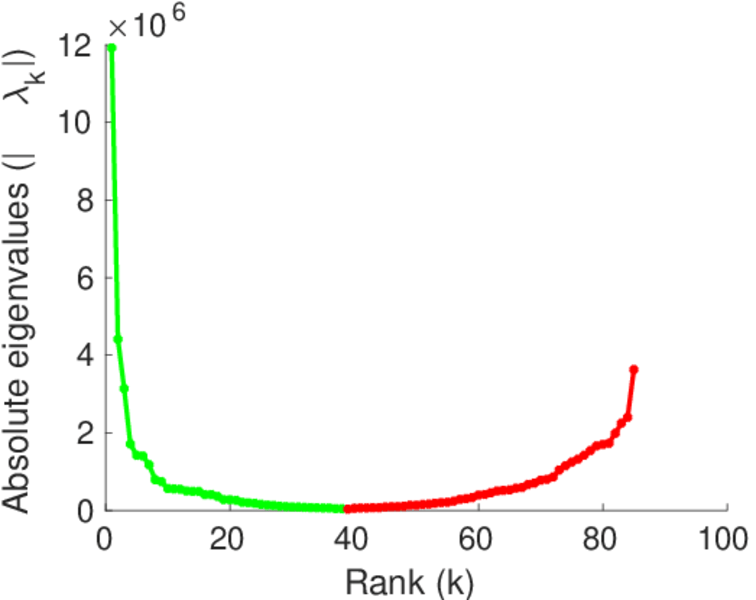
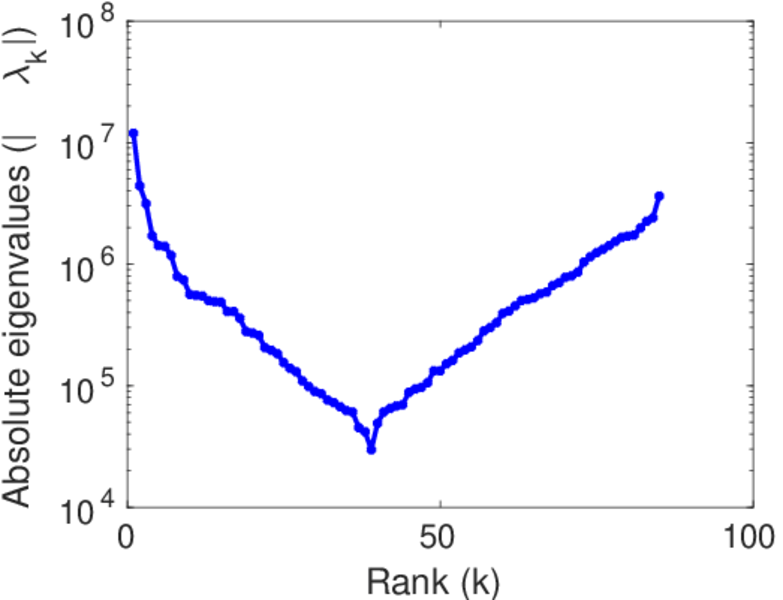
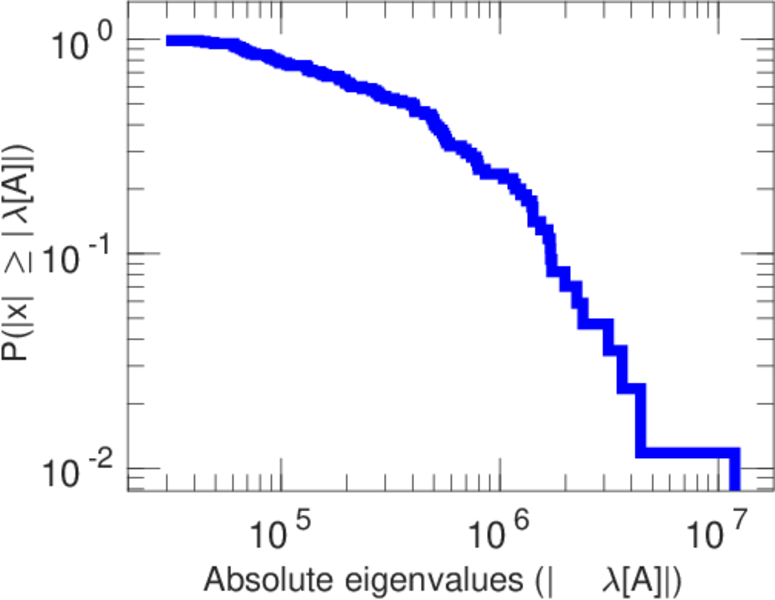
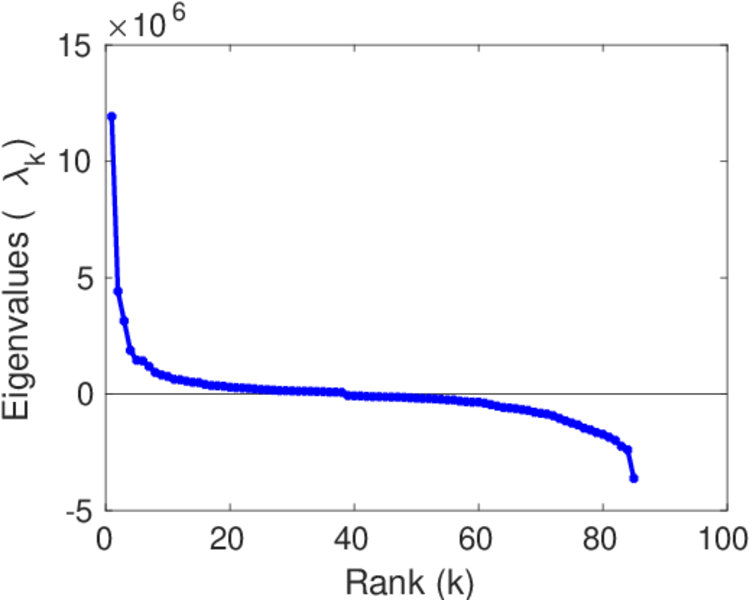
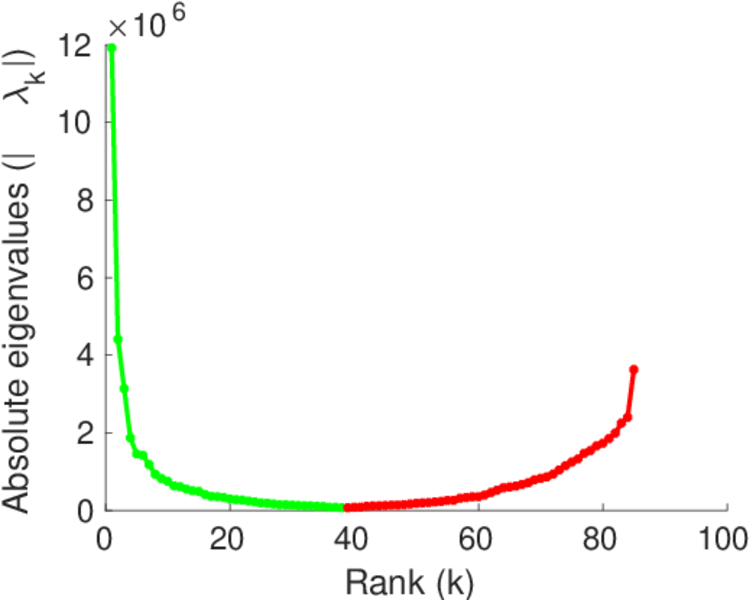
| Spectral norm | α = | 2.383 76 × 107
|
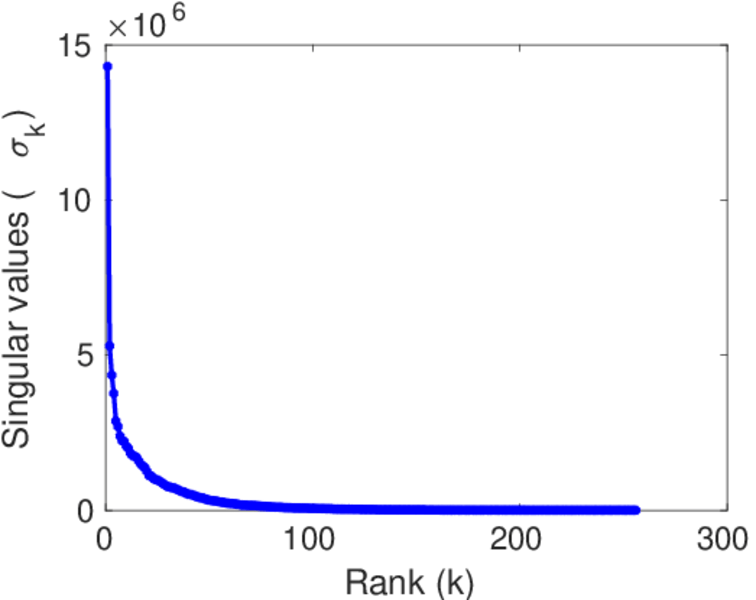
| Operator 2-norm | ν = | 1.191 89 × 107
|
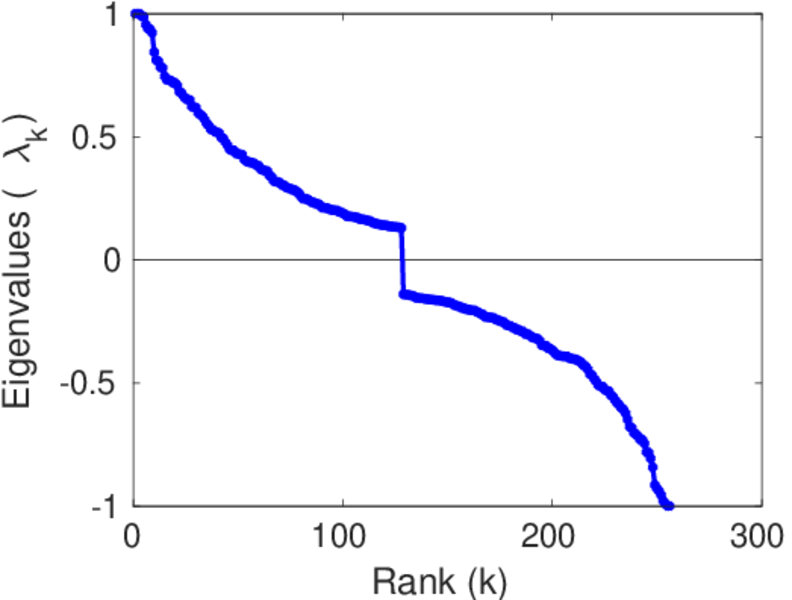
| Cyclic eigenvalue | π = | 1.191 87 × 107
|
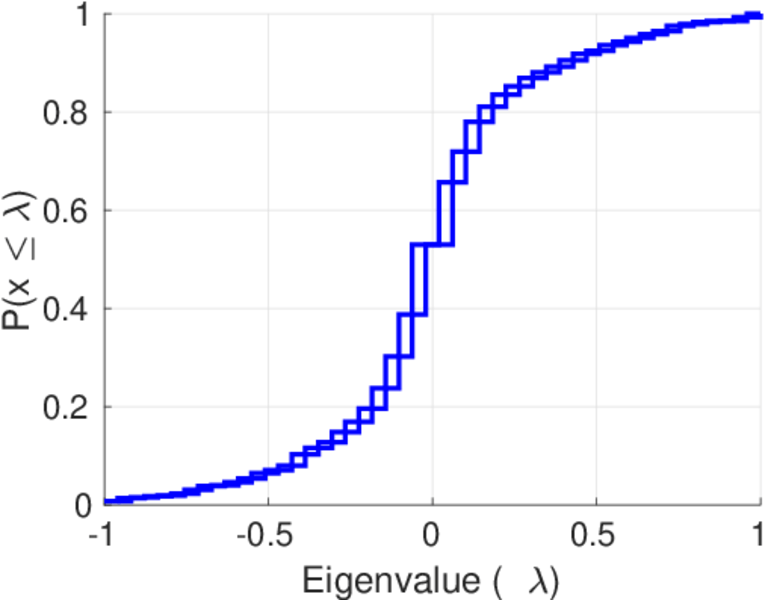
| Algebraic connectivity | a = | 0.547 408
|
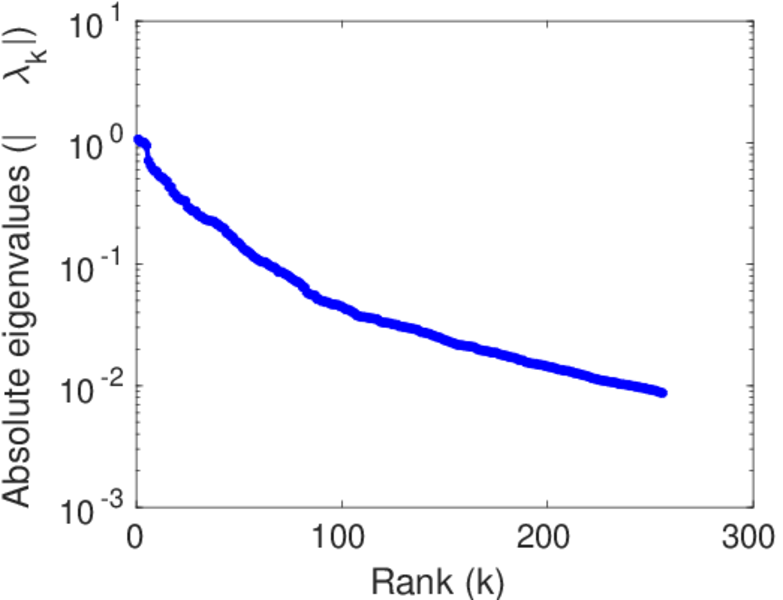
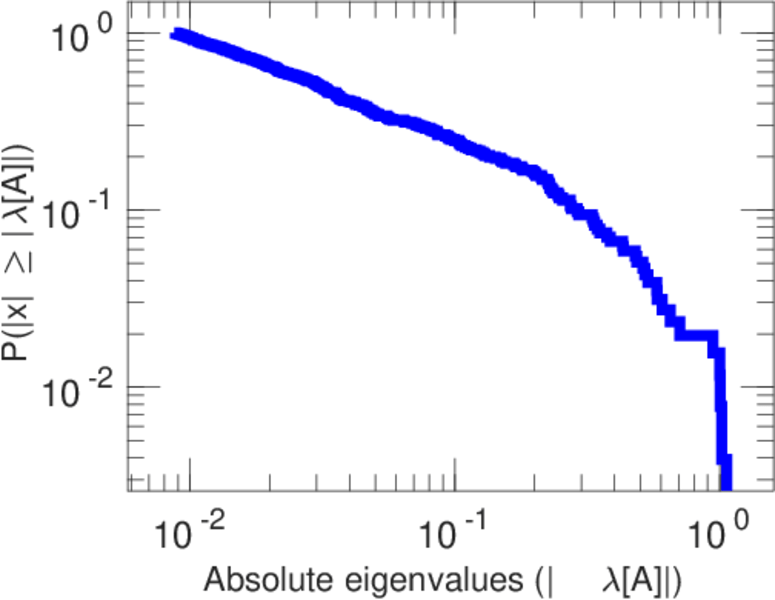
| Spectral separation | |λ1[A] / λ2[A]| = | 2.701 67
|
| Reciprocity | y = | 0.780 635
|
| Non-bipartivity | bA = | 0.723 066
|
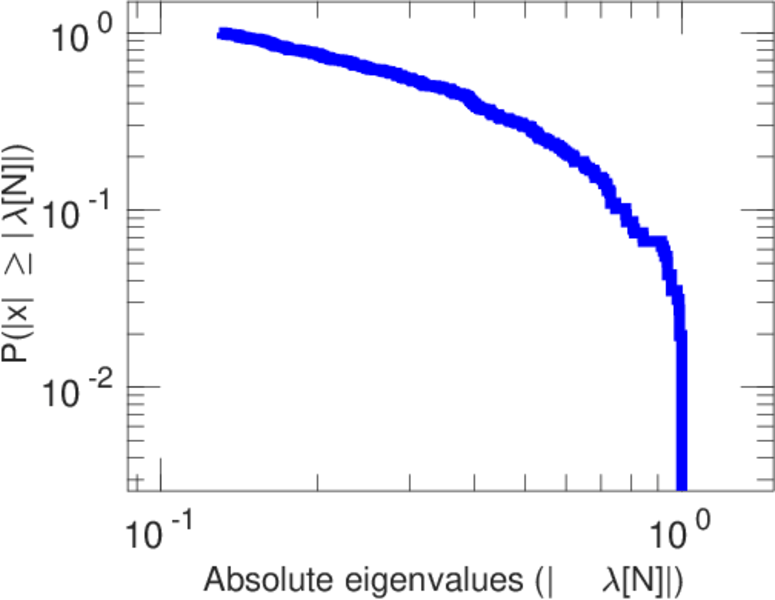
| Normalized non-bipartivity | bN = | 0.160 504
|
| Algebraic non-bipartivity | χ = | 0.246 652
|
| Spectral bipartite frustration | bK = | 0.002 815 56
|
| Controllability | C = | 597
|
| Relative controllability | Cr = | 0.379 288
|
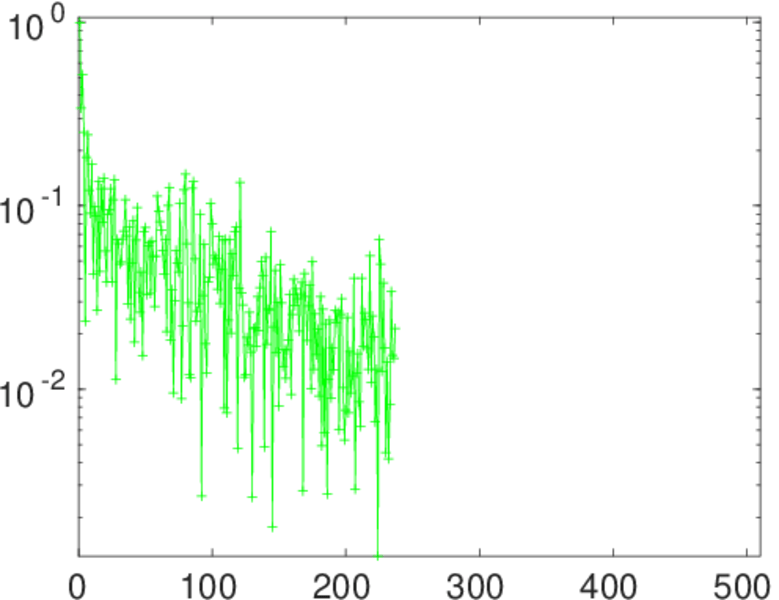
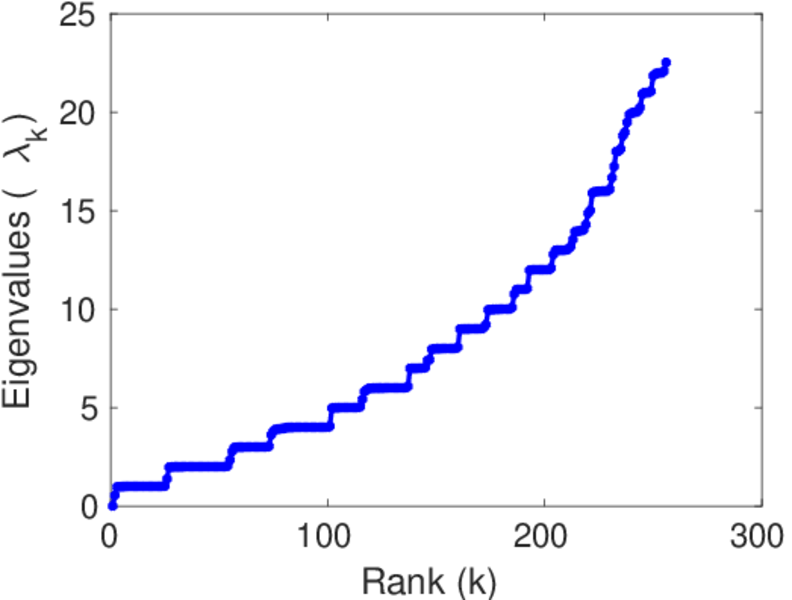
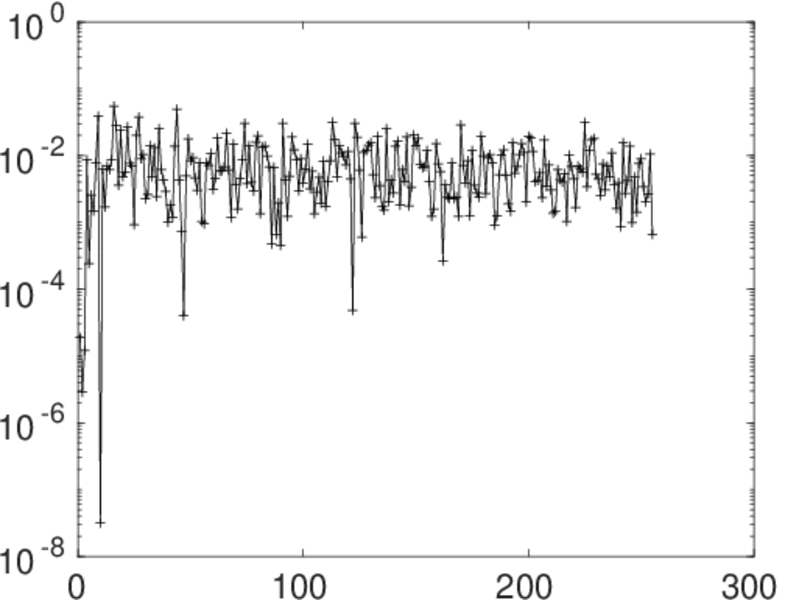
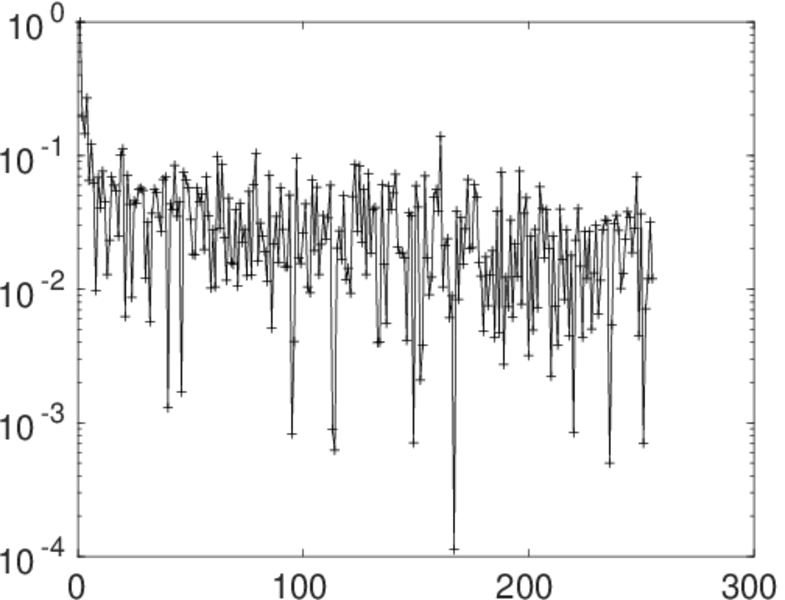
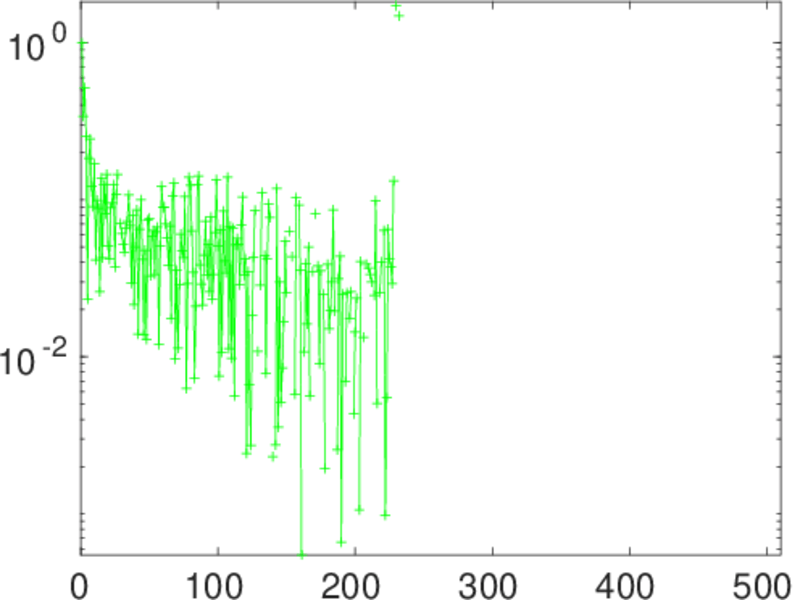
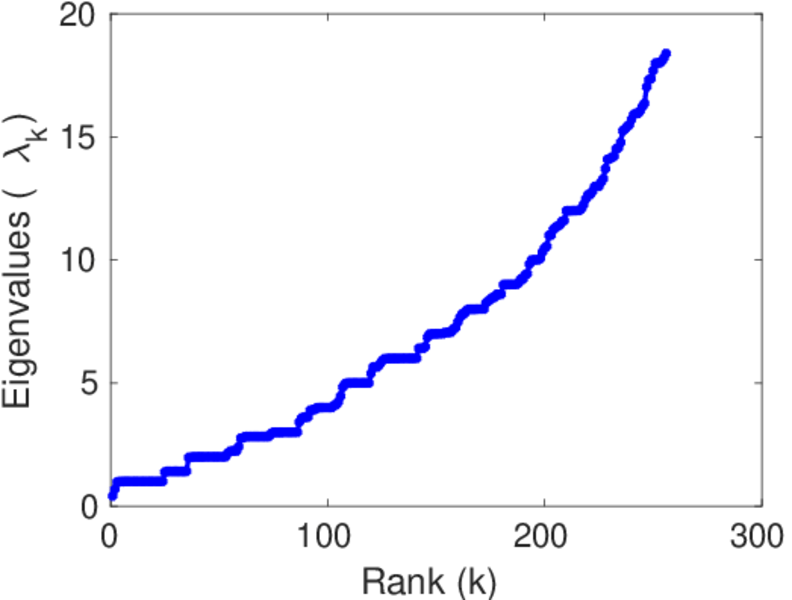
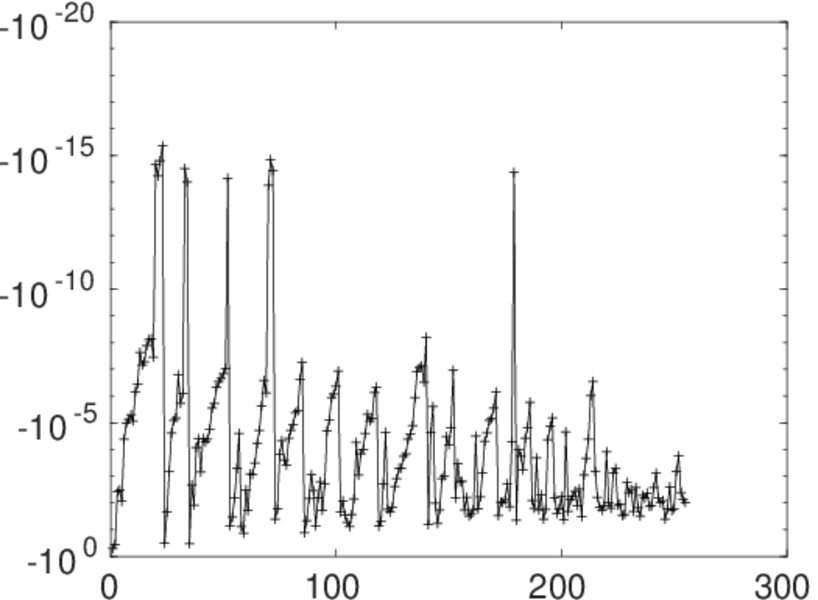
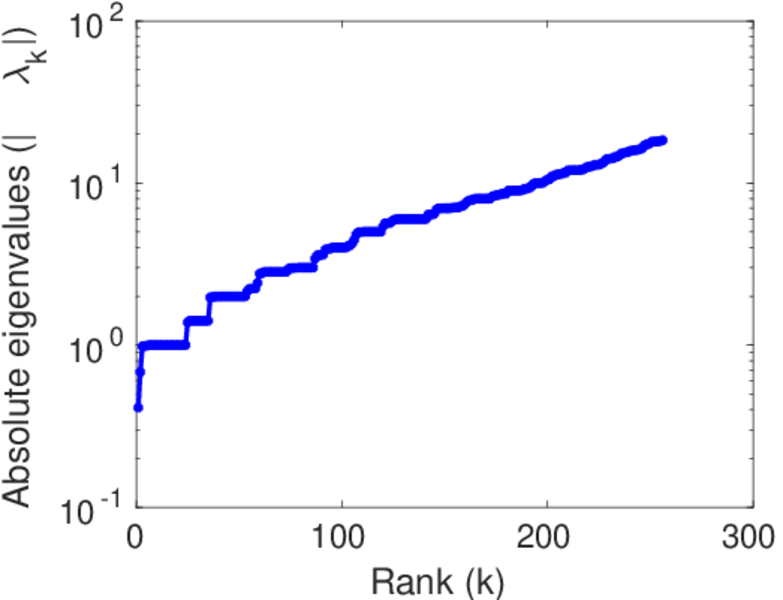
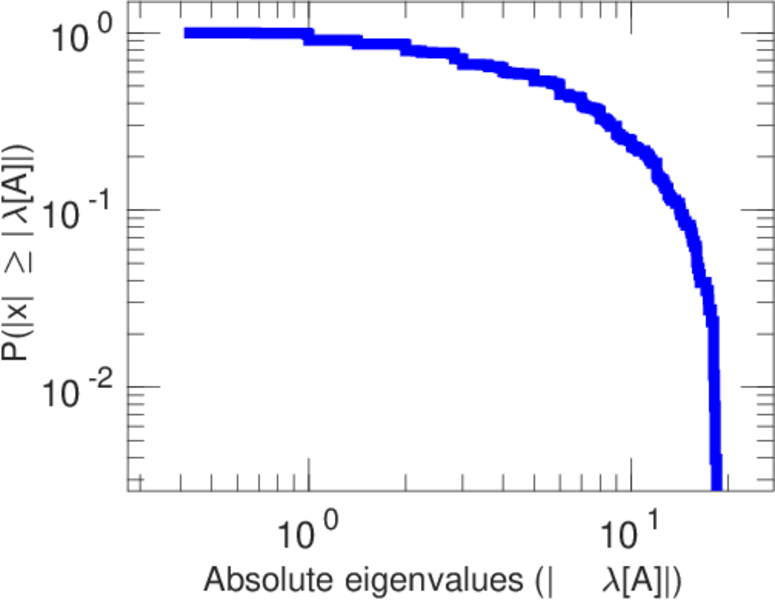
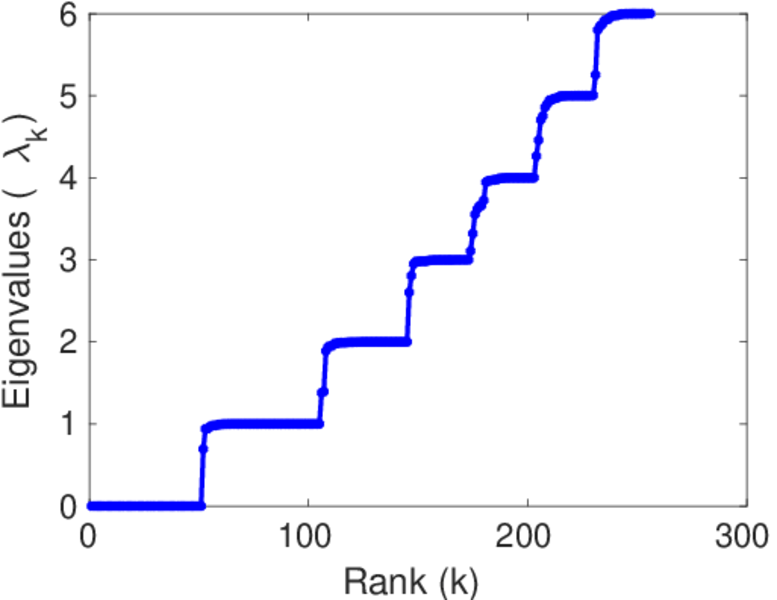
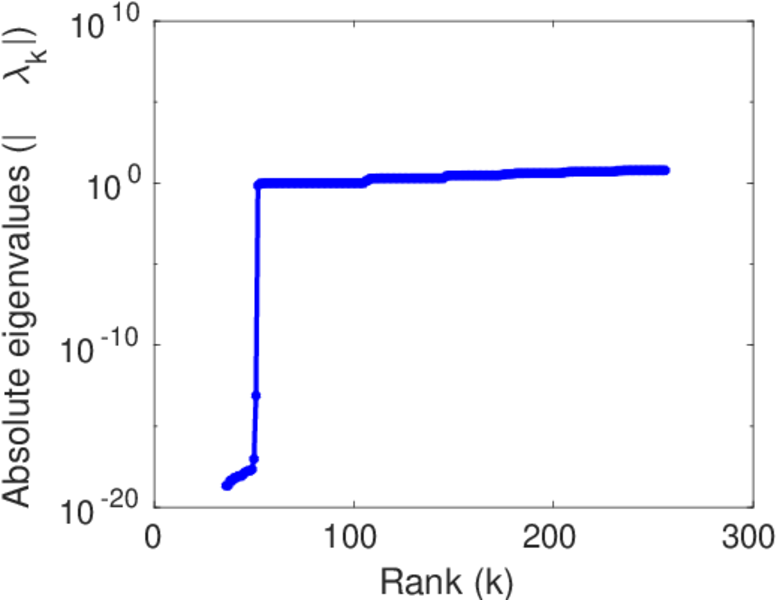
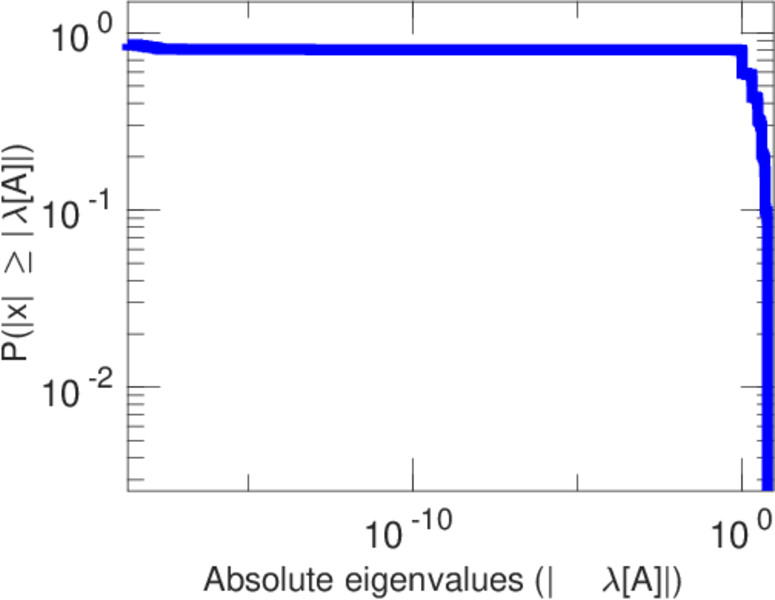
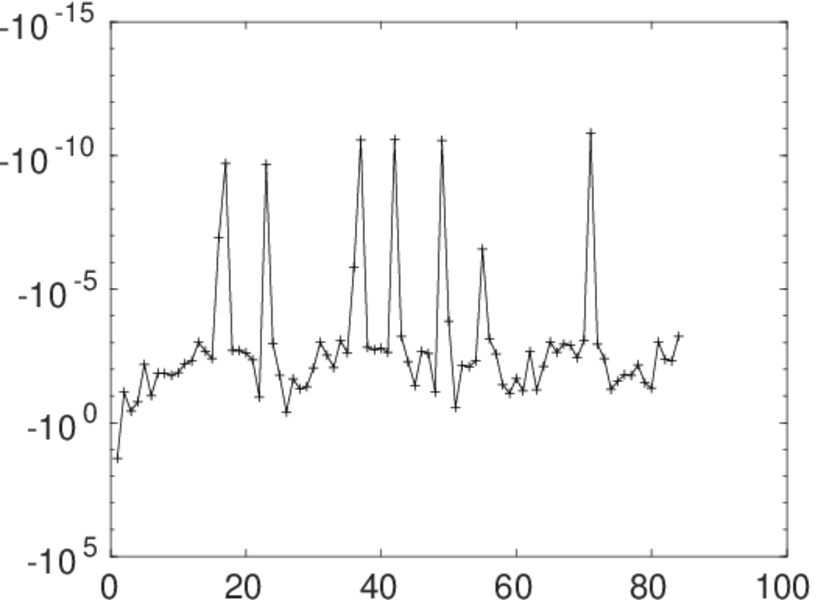
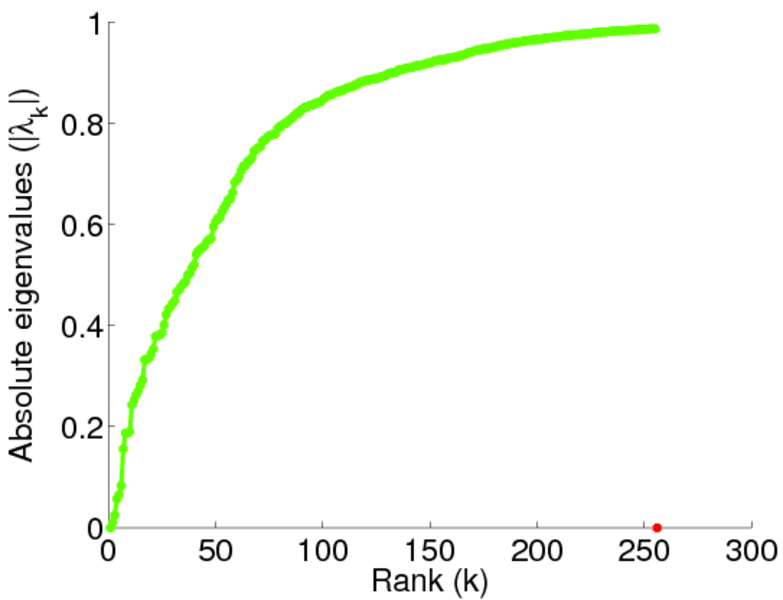
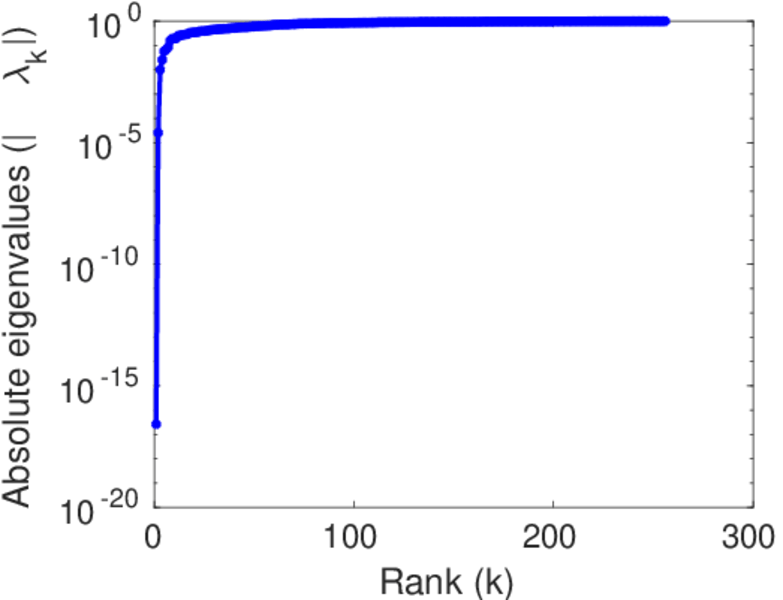
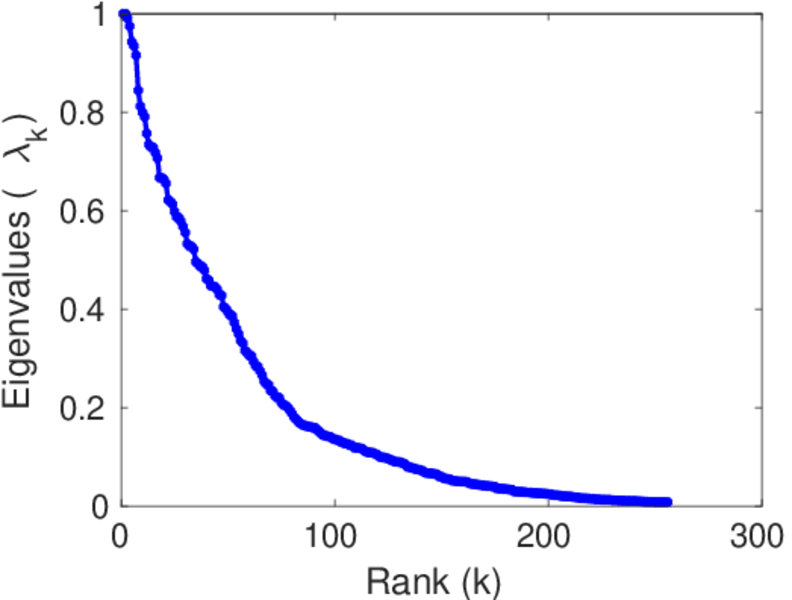
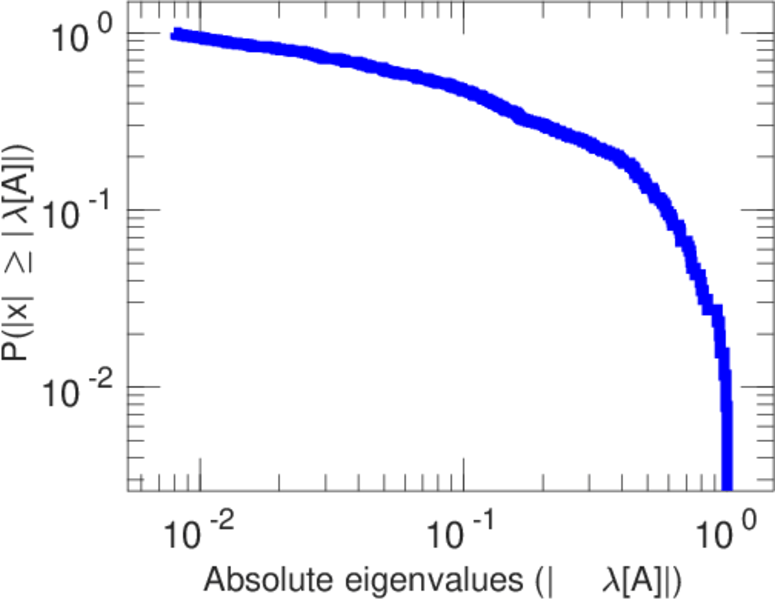
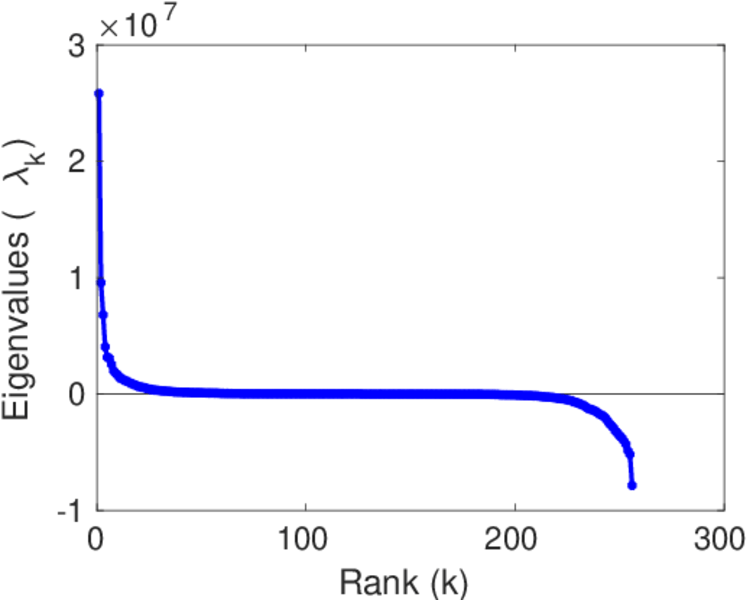
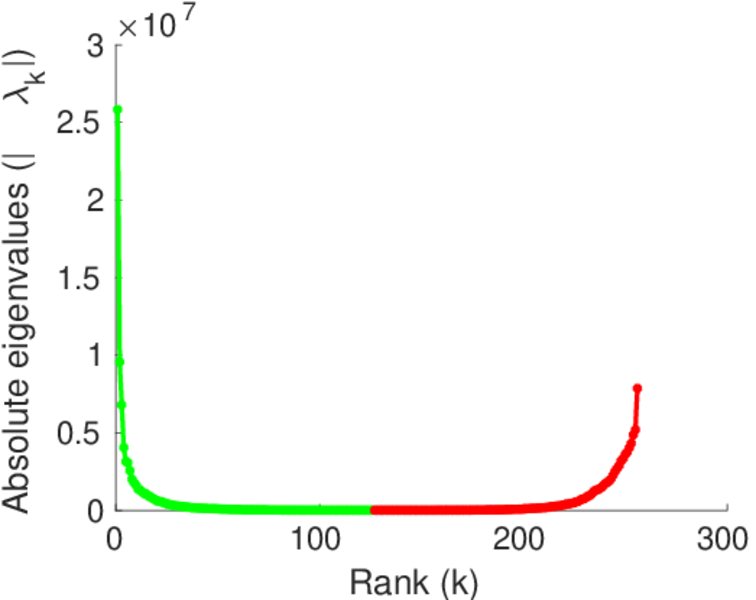
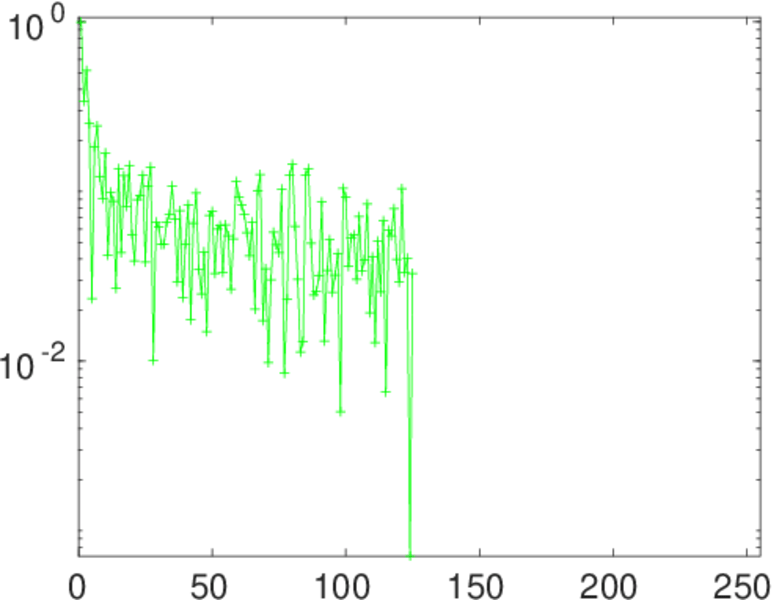
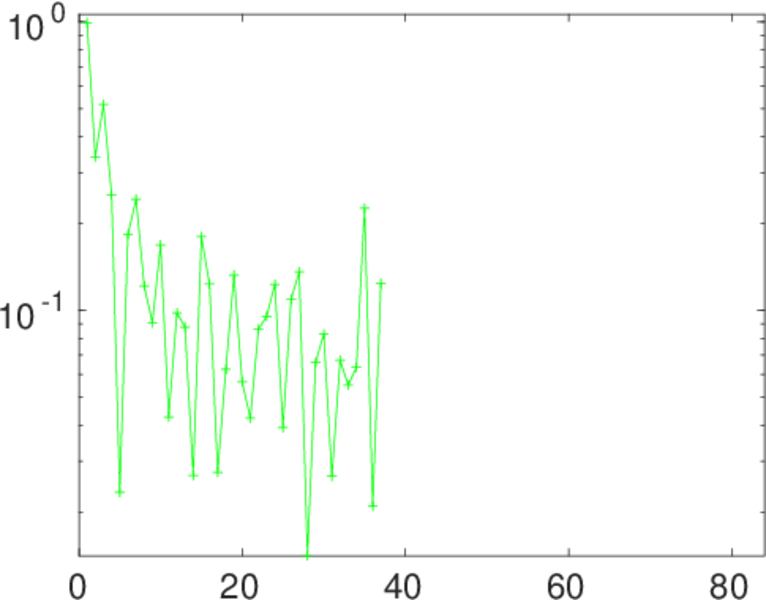
Plots


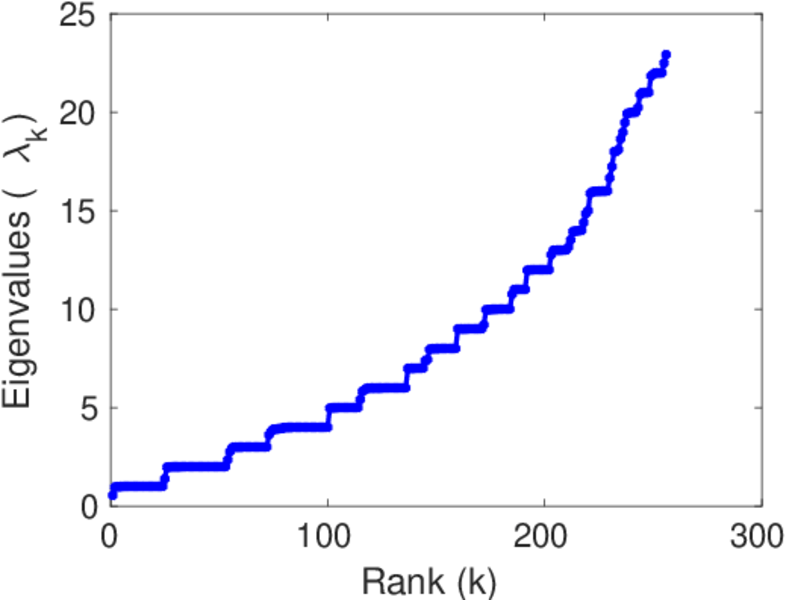
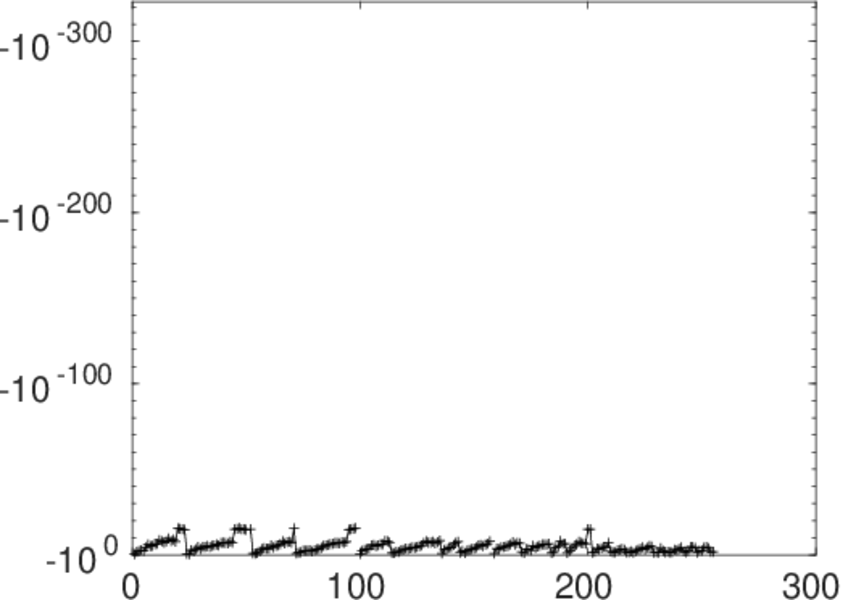
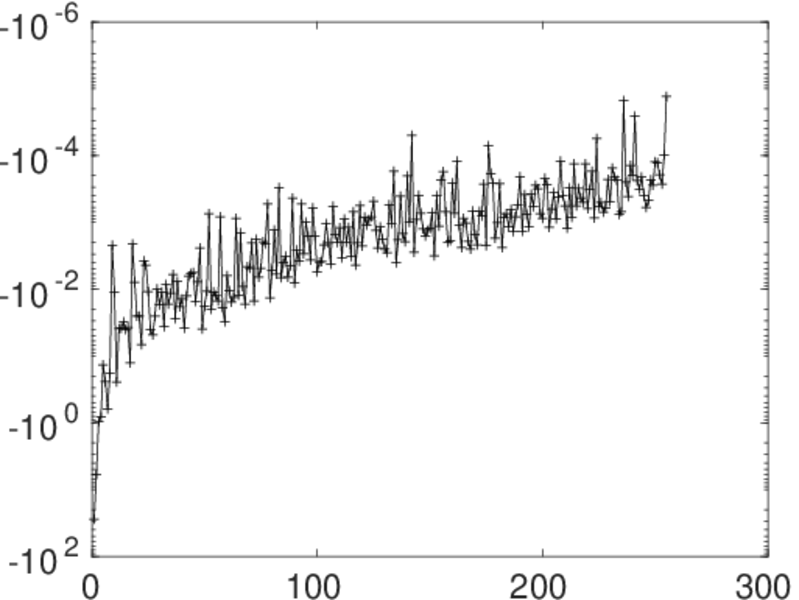
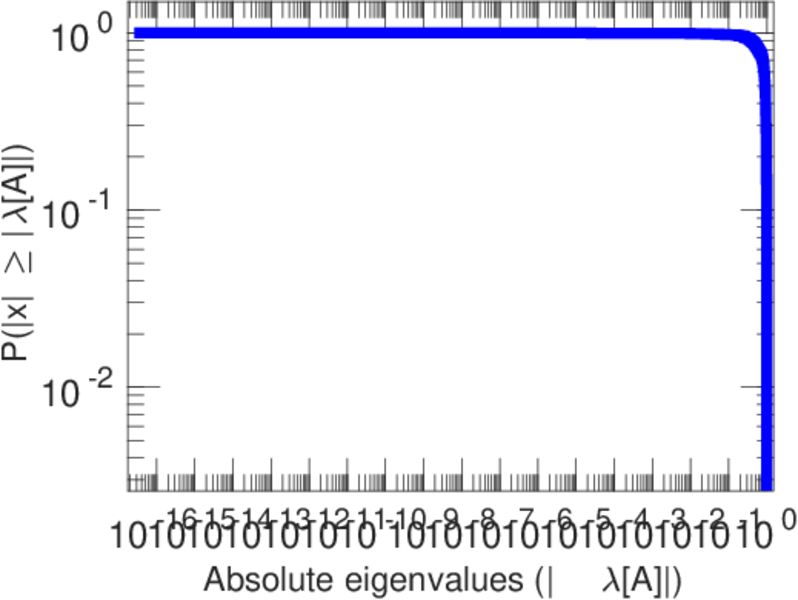
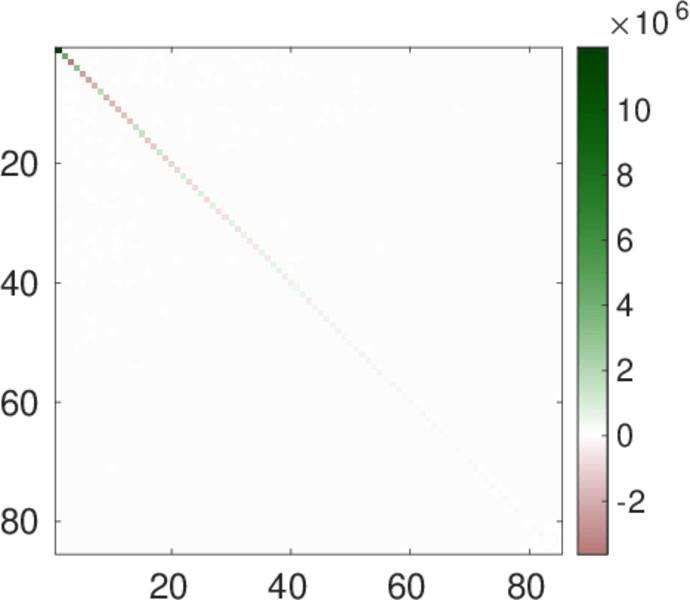
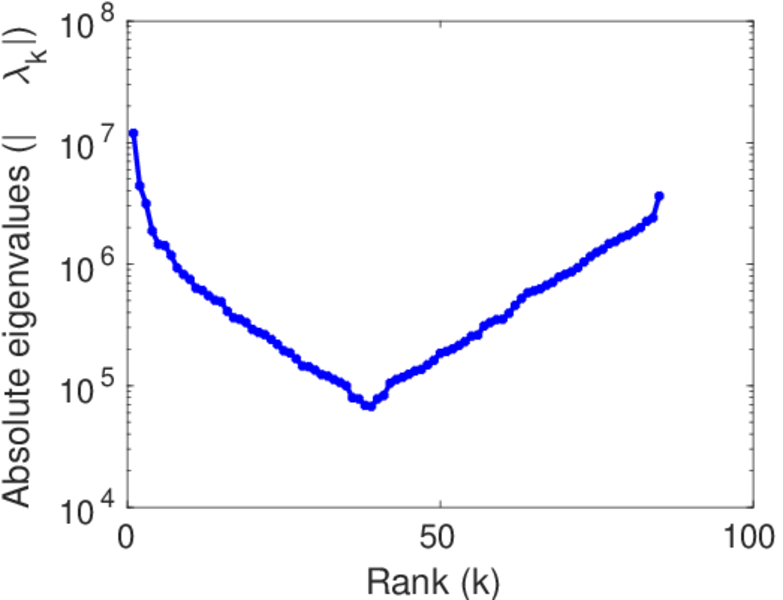
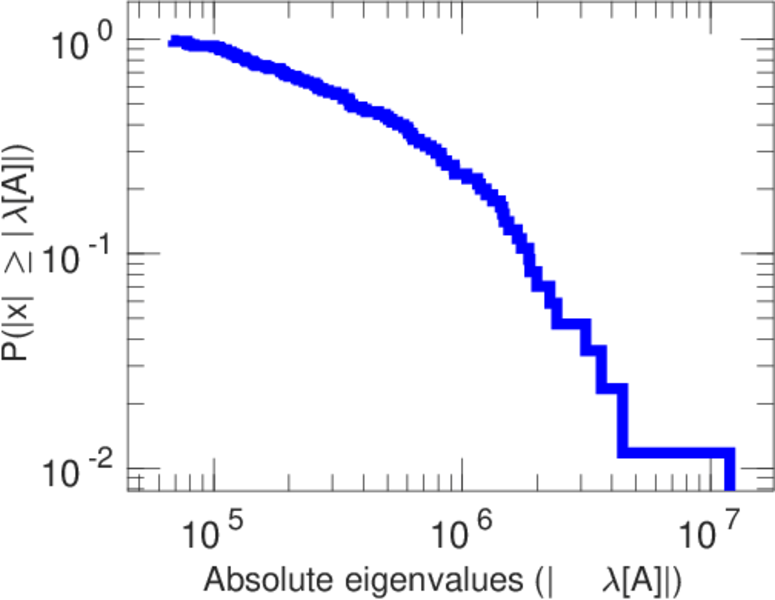
Matrix decompositions plots


Downloads
References
|
[1]
|
Jérôme Kunegis.
KONECT – The Koblenz Network Collection.
In Proc. Int. Conf. on World Wide Web Companion, pages
1343–1350, 2013.
[ http ]
|
|
[2]
|
Tore Opsahl.
Why anchorage is not (that) important: Binary ties and sample
selection, 2011.
[ http ]
|
 KONECT ‣ Networks ‣
Buy Me a Coffee
KONECT ‣ Networks ‣
Buy Me a Coffee