Catster
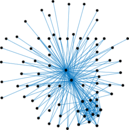
This Network contains friendships between users of the website catster.com.
Metadata
Statistics
| Size | n = | 149,700
|
| Volume | m = | 5,449,275
|
| Wedge count | s = | 50,615,774,277
|
| Cross count | x = | 2.026 55 × 1019
|
| Triangle count | t = | 185,462,177
|
| Square count | q = | 427,574,757,984
|
| 4-Tour count | T4 = | 3,623,072,057,374
|
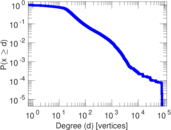
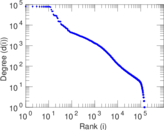
| Maximum degree | dmax = | 80,635
|
| Average degree | d = | 72.802 6
|
| Fill | p = | 0.000 486 320
|
| Size of LCC | N = | 148,826
|
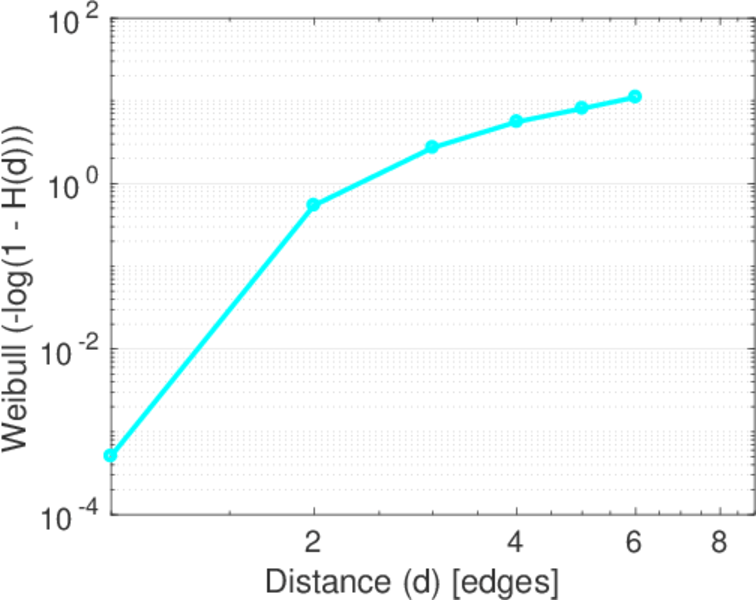
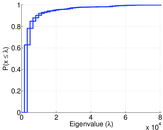
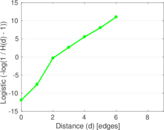
| Diameter | δ = | 10
|
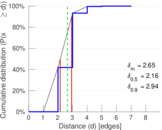
| 50-Percentile effective diameter | δ0.5 = | 2.157 25
|
| 90-Percentile effective diameter | δ0.9 = | 2.935 24
|
| Median distance | δM = | 3
|
| Mean distance | δm = | 2.651 22
|
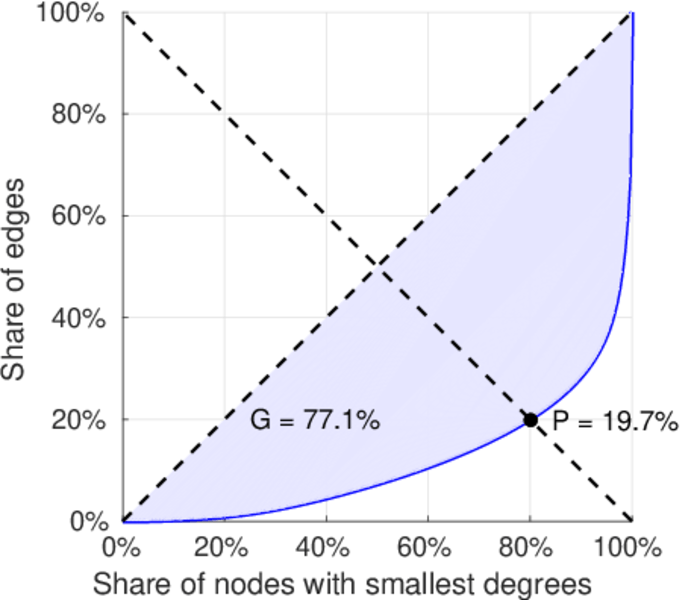
| Gini coefficient | G = | 0.770 961
|
| Balanced inequality ratio | P = | 0.197 126
|
| Relative edge distribution entropy | Her = | 0.826 455
|
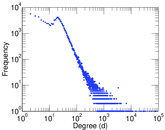
| Power law exponent | γ = | 1.335 16
|
| Tail power law exponent | γt = | 2.121 00
|
| Tail power law exponent with p | γ3 = | 2.121 00
|
| p-value | p = | 0.000 00
|
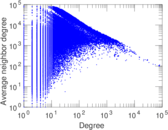
| Degree assortativity | ρ = | −0.164 158
|
| Degree assortativity p-value | pρ = | 0.000 00
|
| Clustering coefficient | c = | 0.010 992 4
|
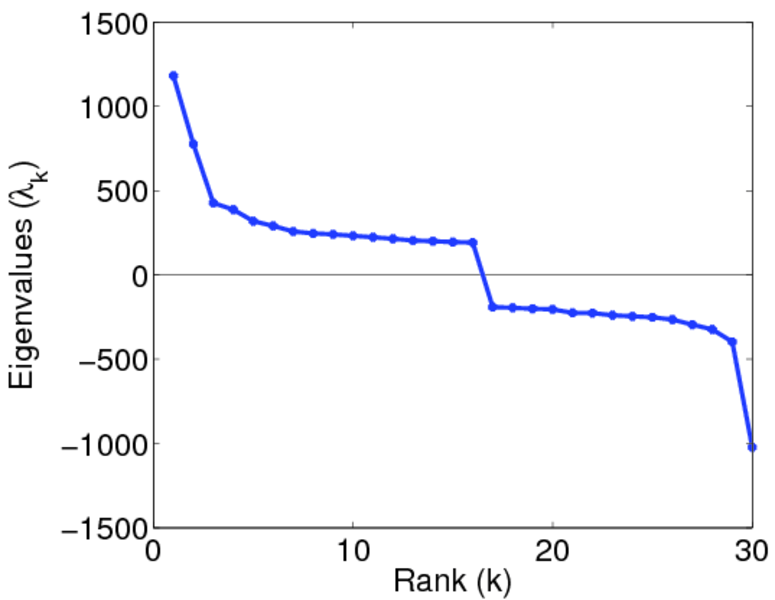
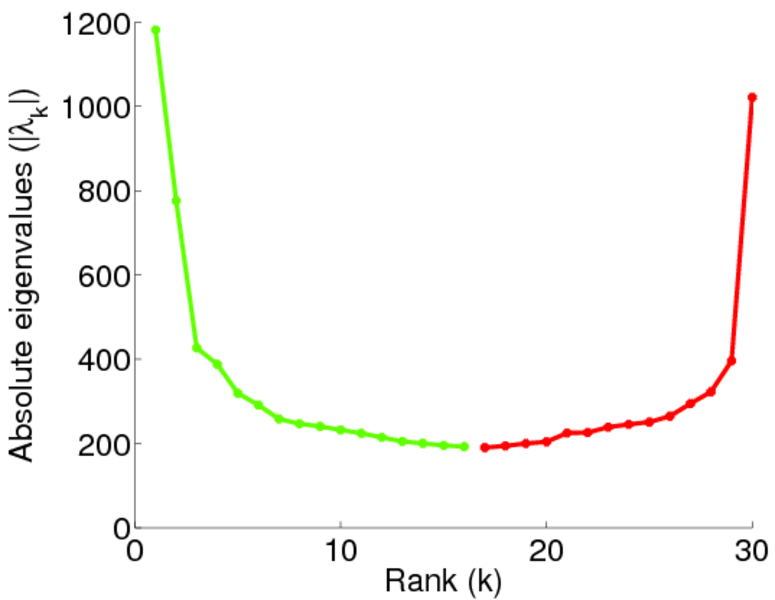
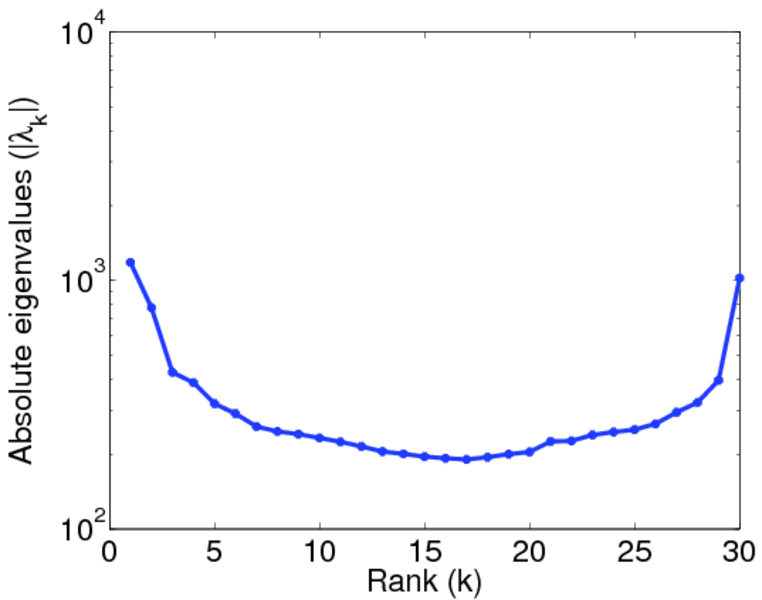
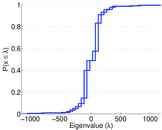
| Spectral norm | α = | 1,181.57
|
| Algebraic connectivity | a = | 0.106 892
|
| Spectral separation | |λ1[A] / λ2[A]| = | 1.156 46
|
| Non-bipartivity | bA = | 0.135 295
|
| Normalized non-bipartivity | bN = | 0.025 052 7
|
| Algebraic non-bipartivity | χ = | 0.107 570
|
| Spectral bipartite frustration | bK = | 0.000 367 287
|
| Controllability | C = | 70,066
|
| Relative controllability | Cr = | 0.468 043
|
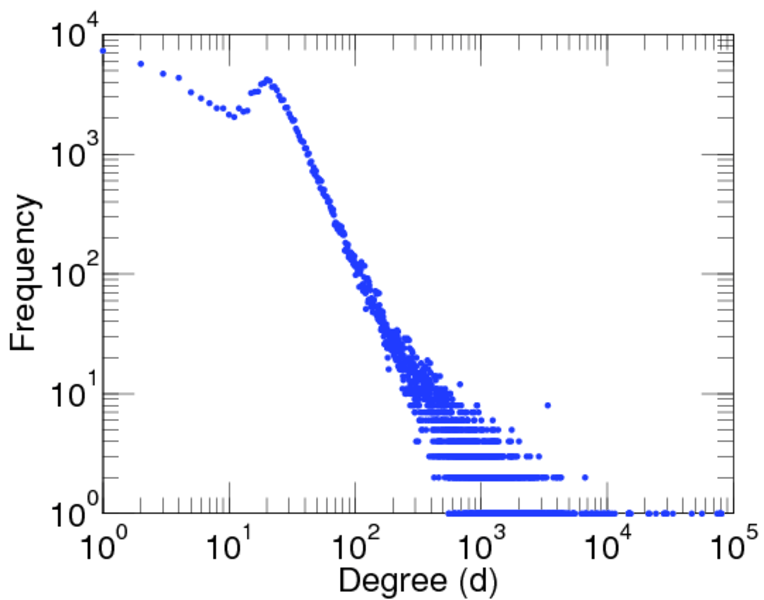
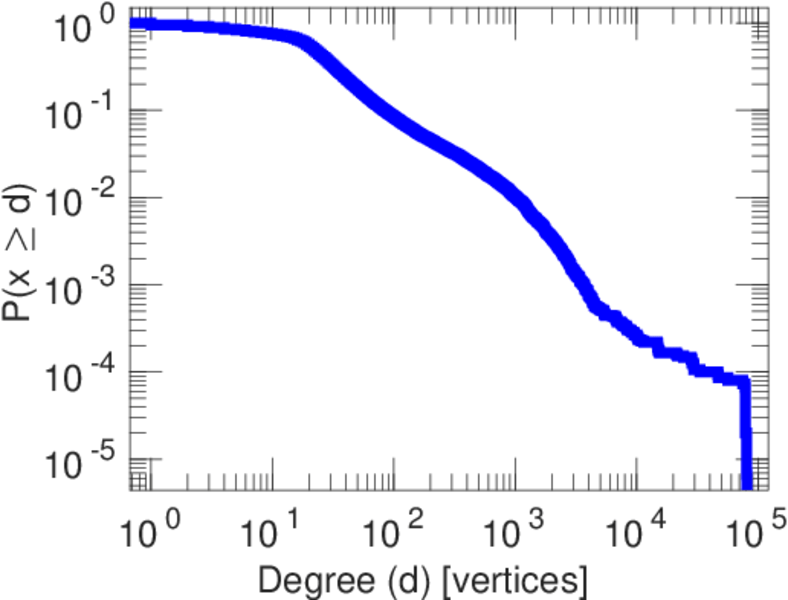
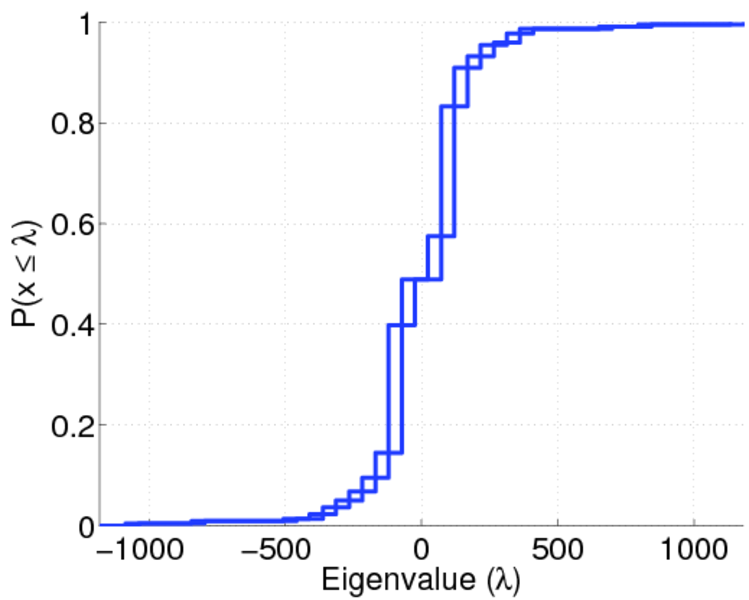
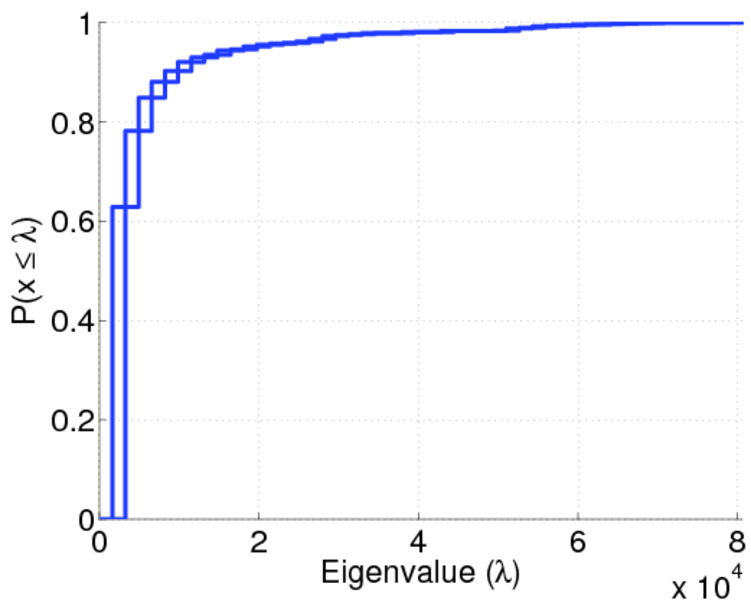
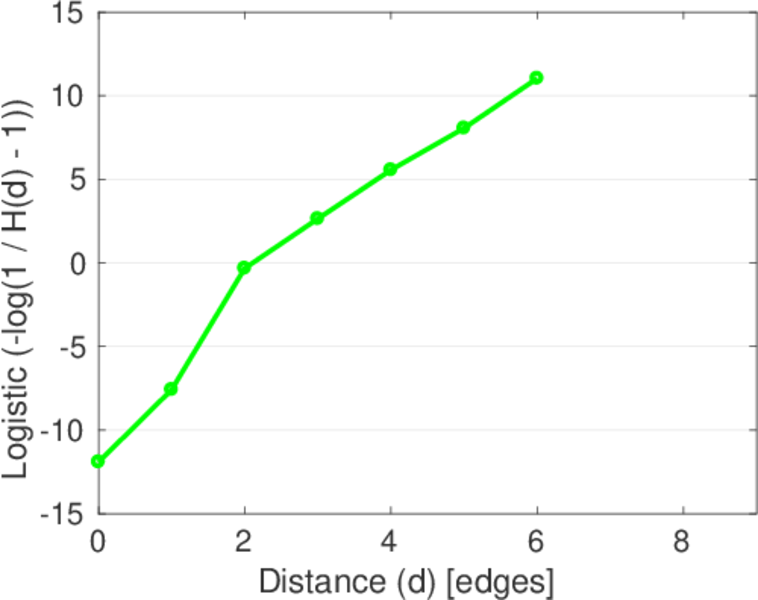
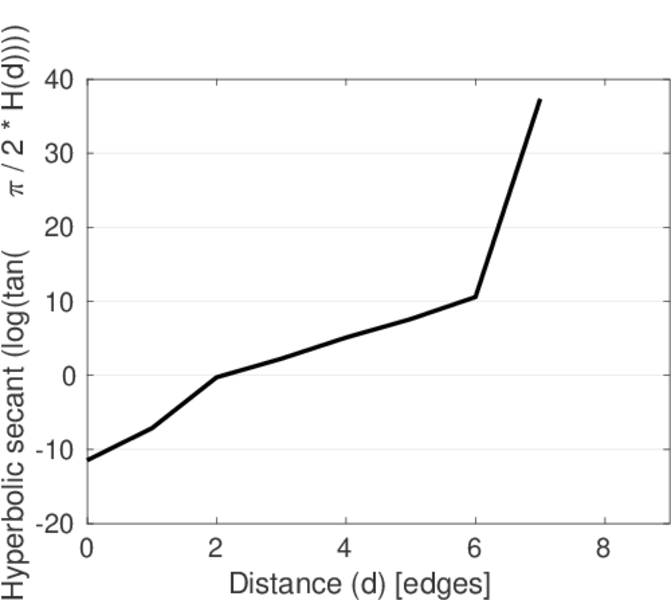
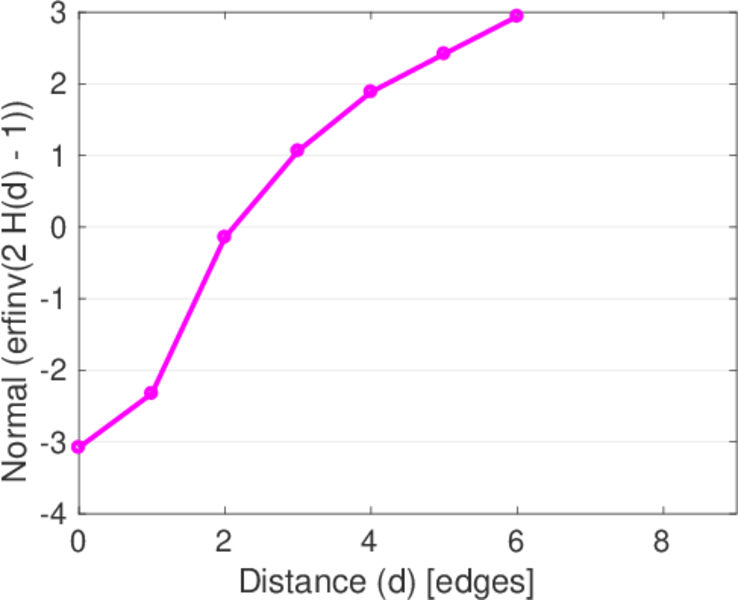
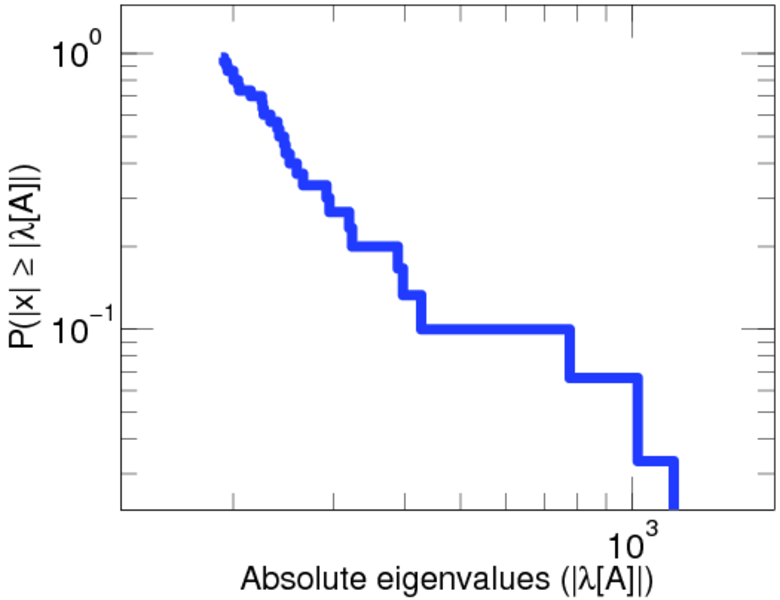
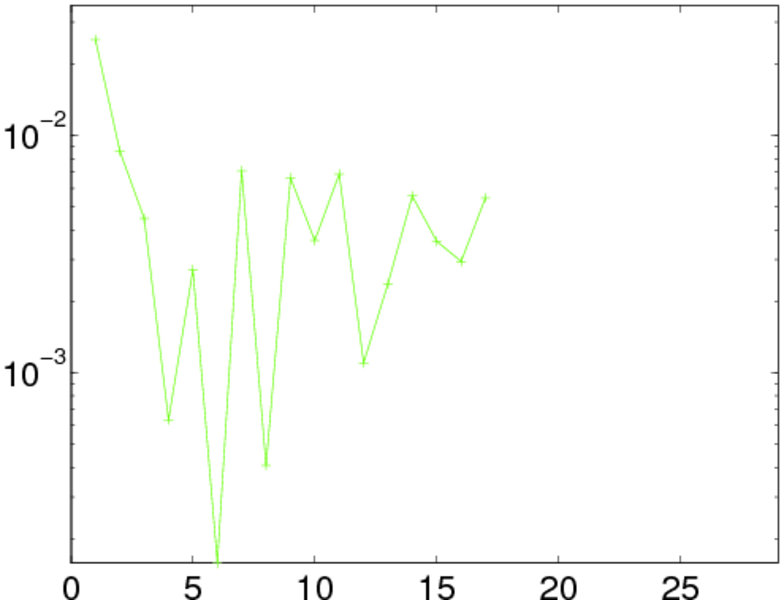
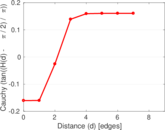
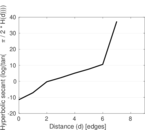
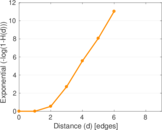
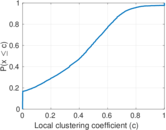
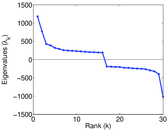
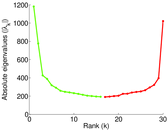
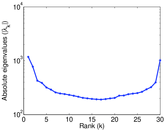
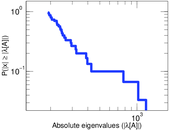
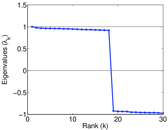
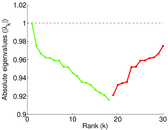
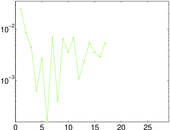
Plots

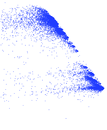
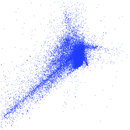
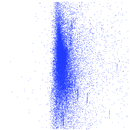


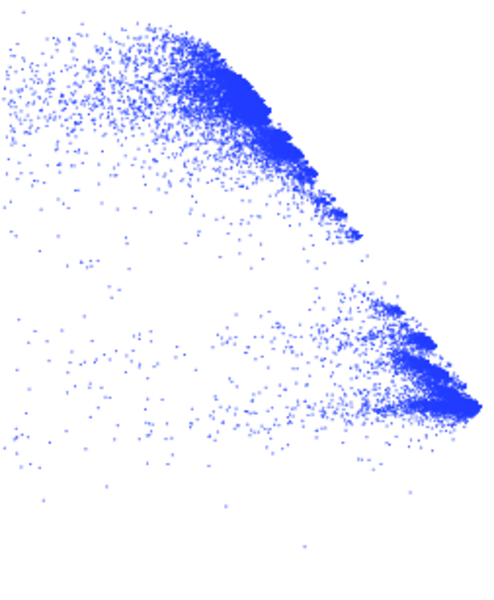
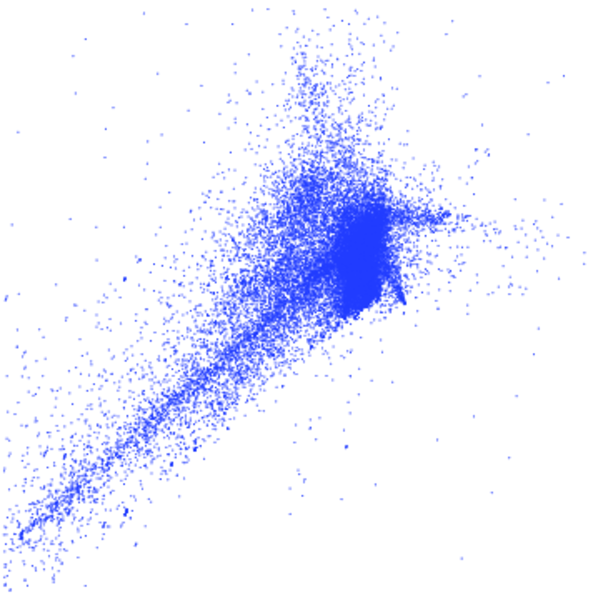
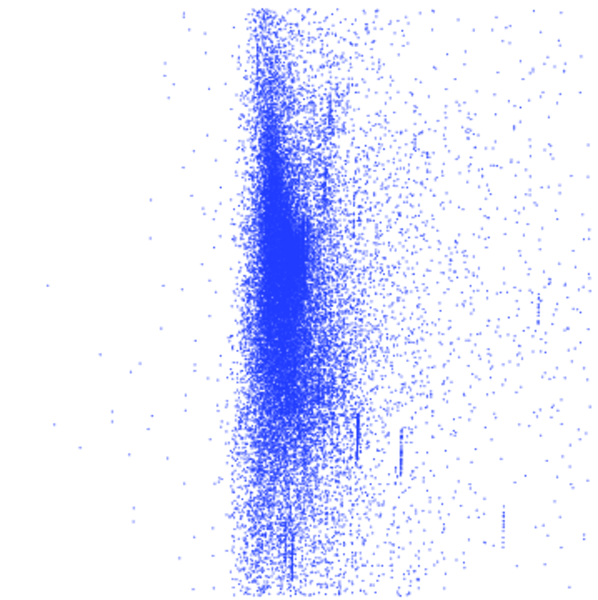
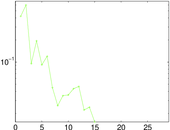
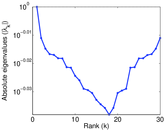
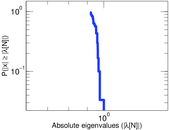
Matrix decompositions plots
Downloads
References
|
[1]
|
Jérôme Kunegis.
KONECT – The Koblenz Network Collection.
In Proc. Int. Conf. on World Wide Web Companion, pages
1343–1350, 2013.
[ http ]
|
 KONECT ‣ Networks ‣
Buy Me a Coffee
KONECT ‣ Networks ‣
Buy Me a Coffee