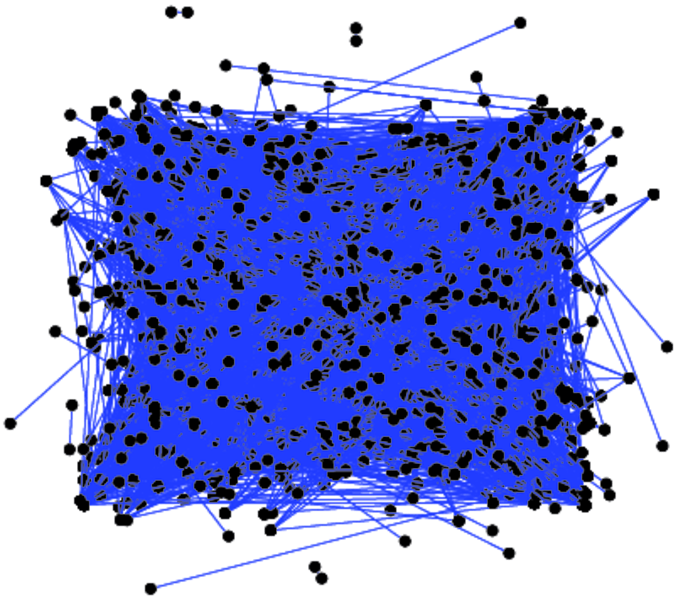
Hamsterster friendships
This Network contains friendships between users of the website hamsterster.com.
Metadata
Statistics
| Size | n = | 1,858
|
| Volume | m = | 12,534
|
| Loop count | l = | 0
|
| Wedge count | s = | 555,842
|
| Claw count | z = | 17,140,733
|
| Cross count | x = | 611,850,068
|
| Triangle count | t = | 16,750
|
| Square count | q = | 780,549
|
| 4-Tour count | T4 = | 8,492,828
|
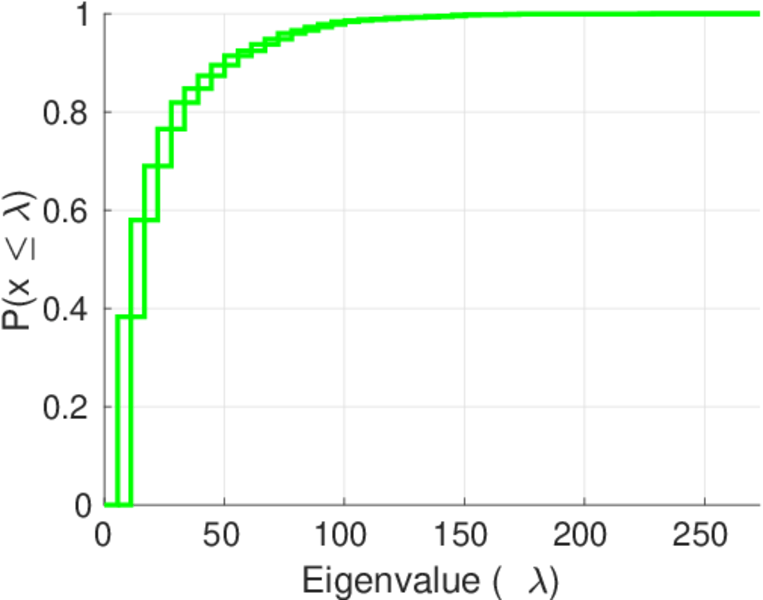
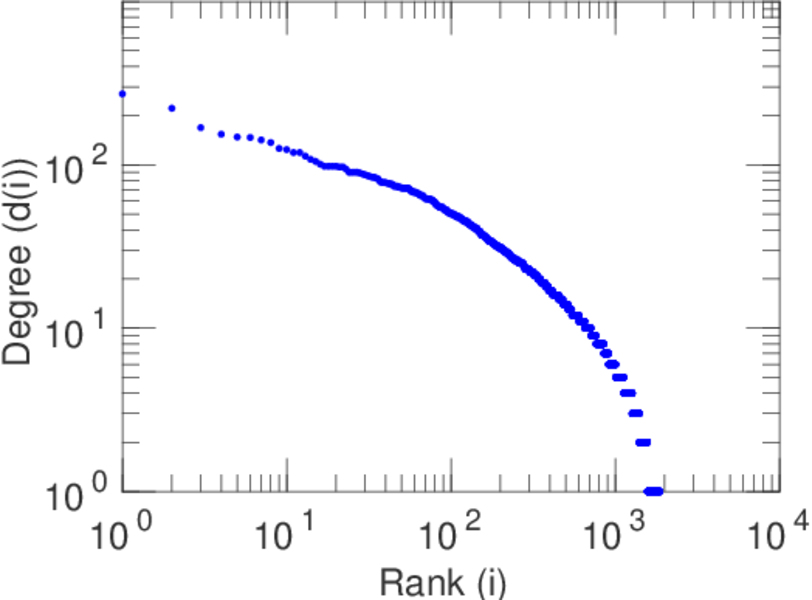
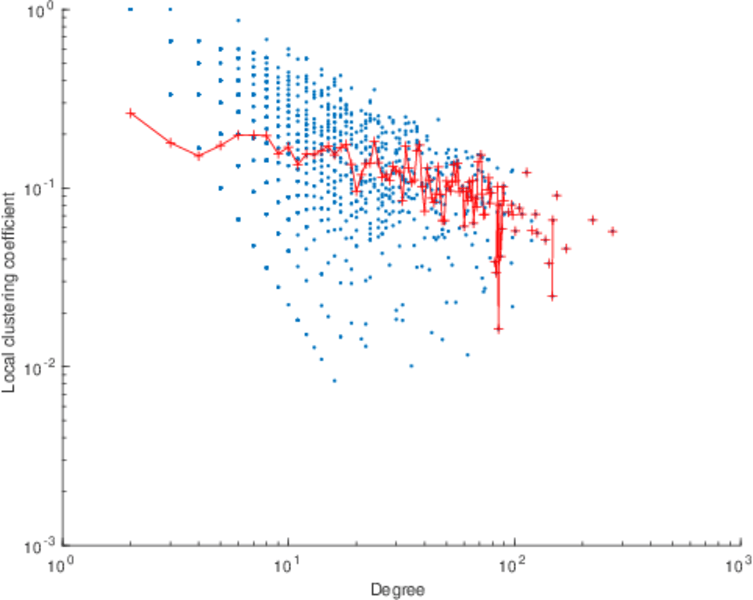
| Maximum degree | dmax = | 272
|
| Average degree | d = | 13.491 9
|
| Fill | p = | 0.007 265 44
|
| Size of LCC | N = | 1,788
|
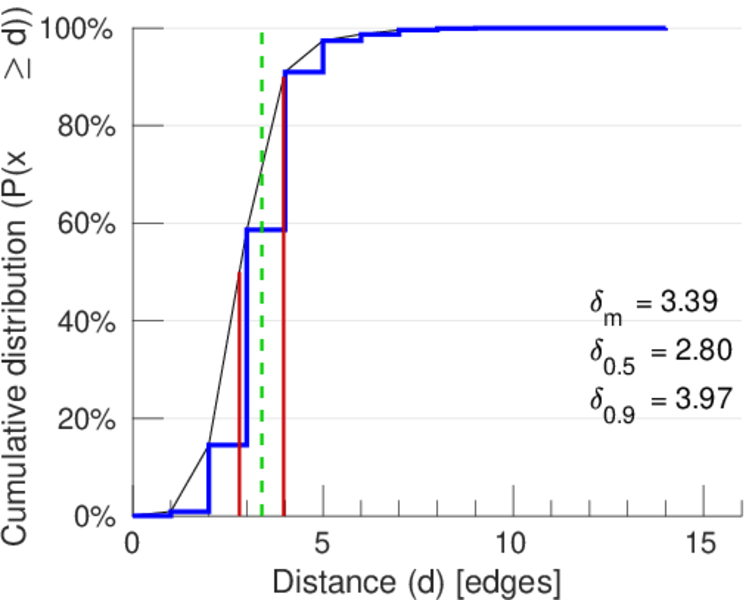
| Diameter | δ = | 14
|
| 50-Percentile effective diameter | δ0.5 = | 2.804 48
|
| 90-Percentile effective diameter | δ0.9 = | 3.969 87
|
| Median distance | δM = | 3
|
| Mean distance | δm = | 3.394 24
|
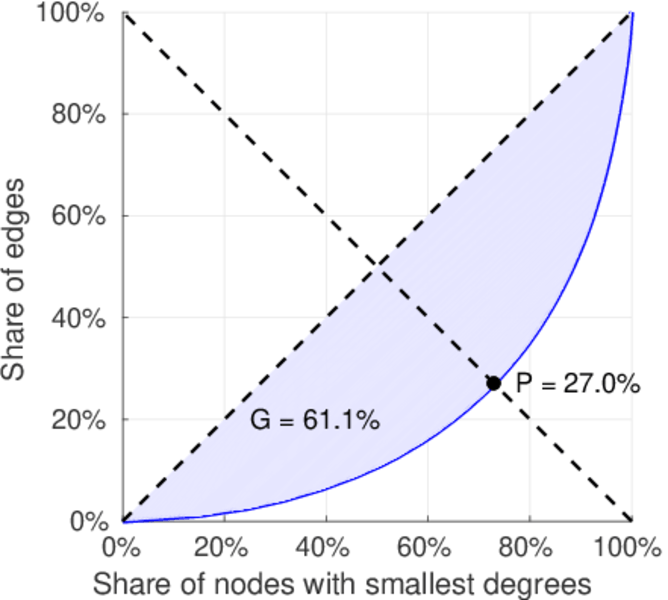
| Gini coefficient | G = | 0.610 625
|
| Balanced inequality ratio | P = | 0.269 507
|
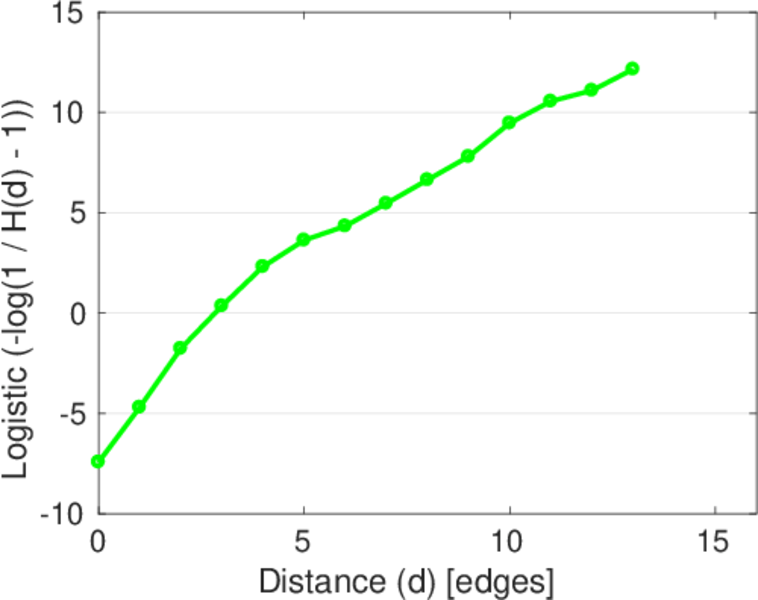
| Relative edge distribution entropy | Her = | 0.907 612
|
| Power law exponent | γ = | 1.538 24
|
| Tail power law exponent | γt = | 2.461 00
|
| Tail power law exponent with p | γ3 = | 2.461 00
|
| p-value | p = | 0.000 00
|
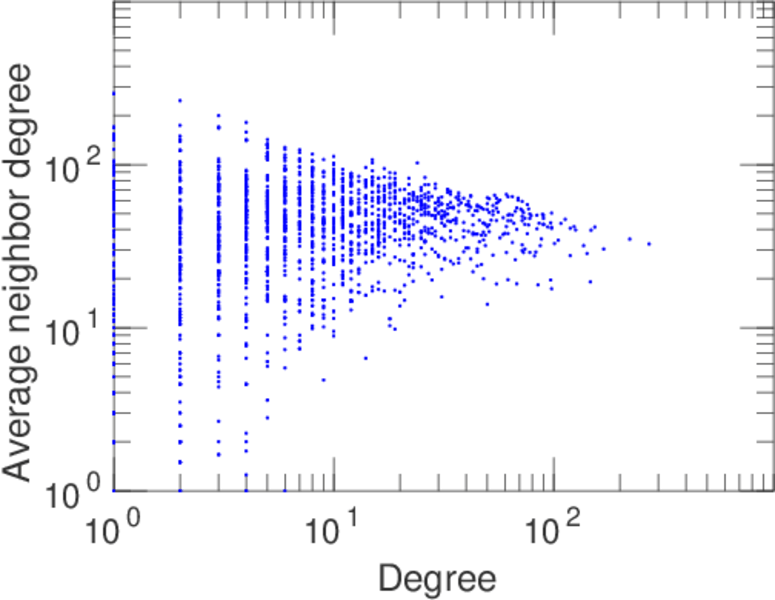
| Degree assortativity | ρ = | −0.084 659 1
|
| Degree assortativity p-value | pρ = | 4.177 26 × 10−41
|
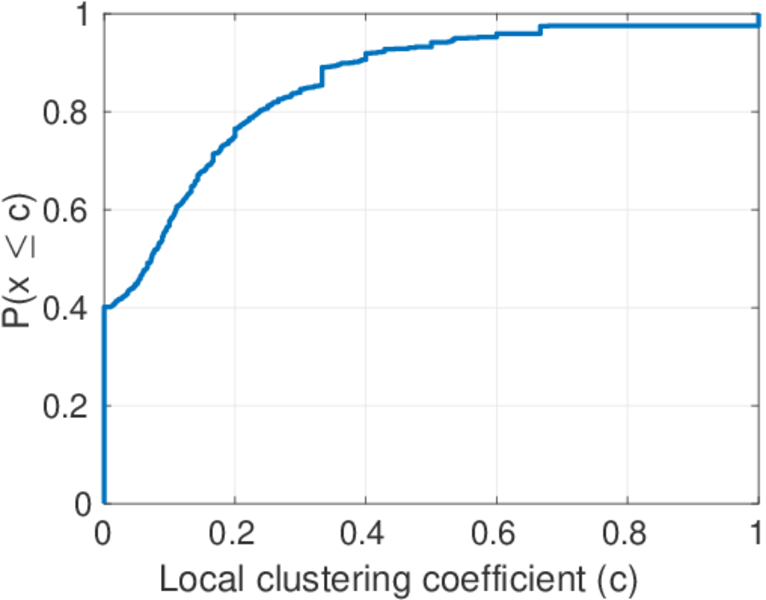
| Clustering coefficient | c = | 0.090 403 4
|
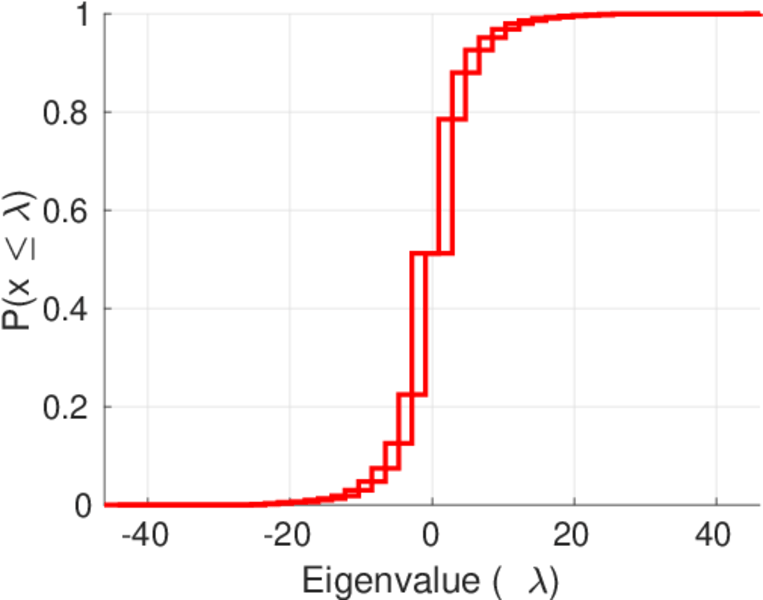
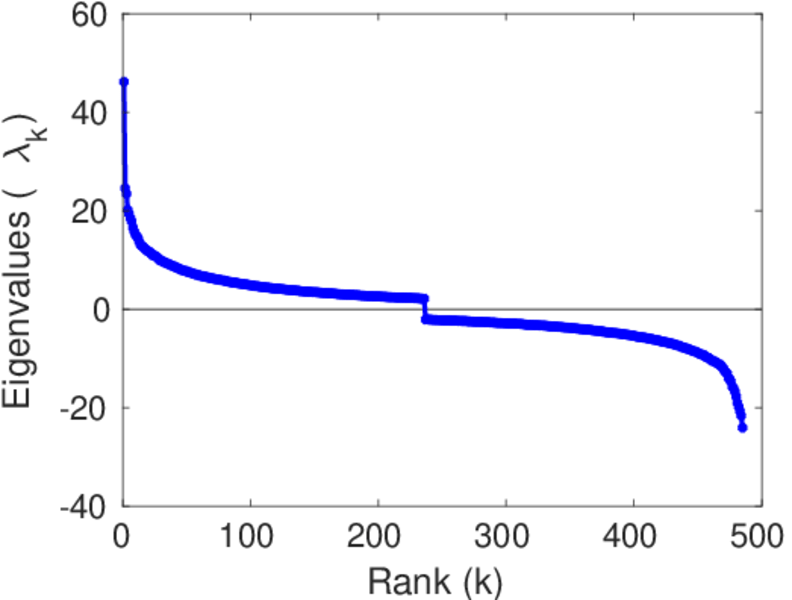
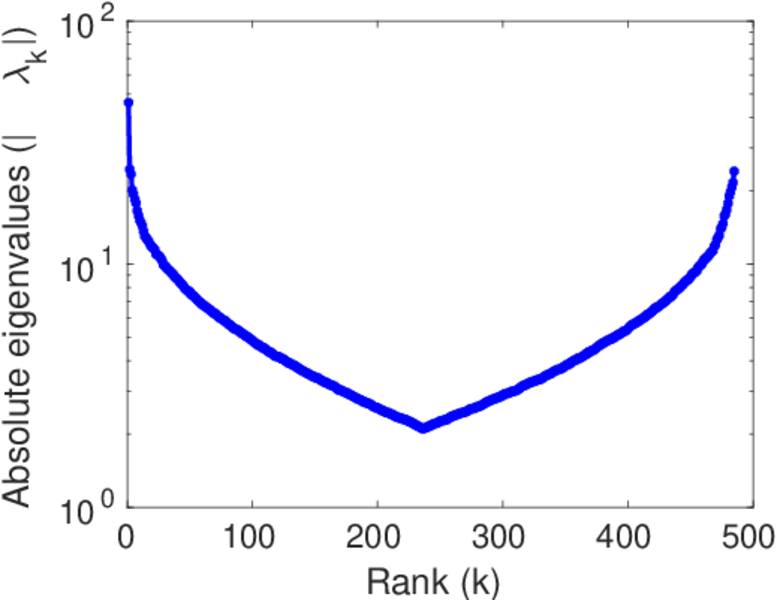
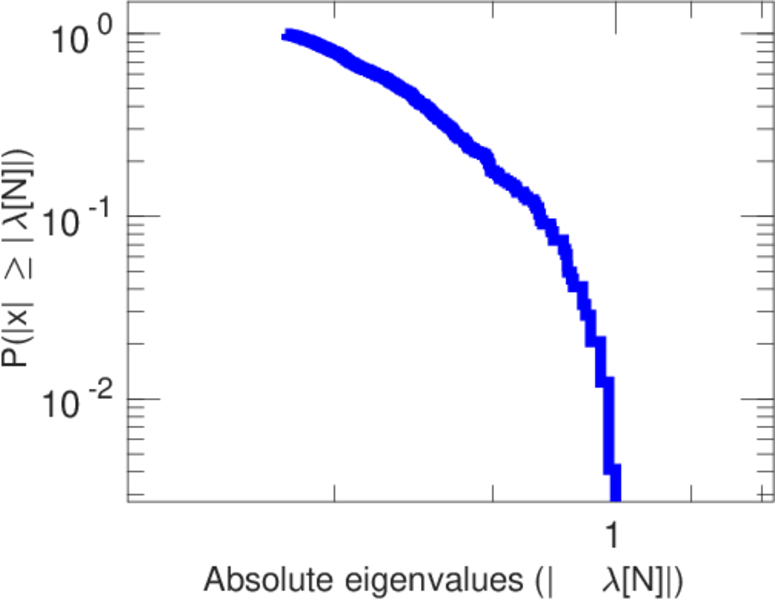
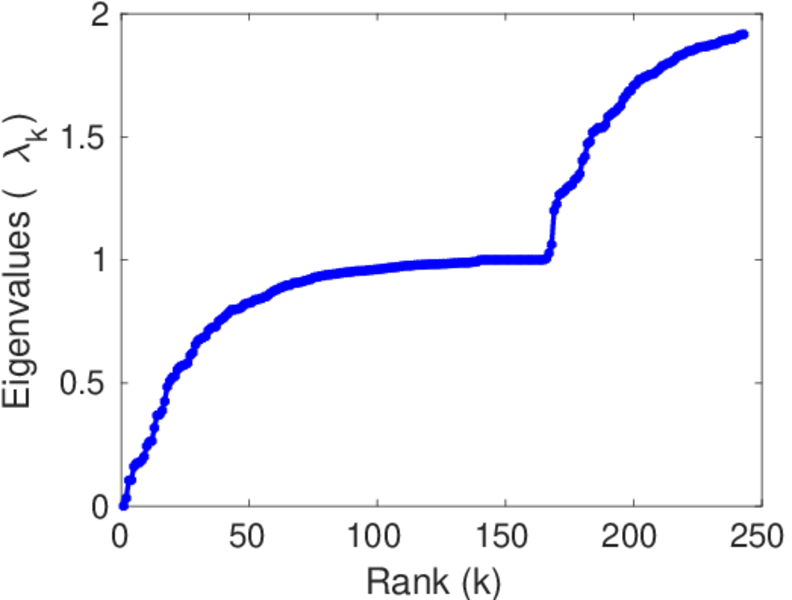
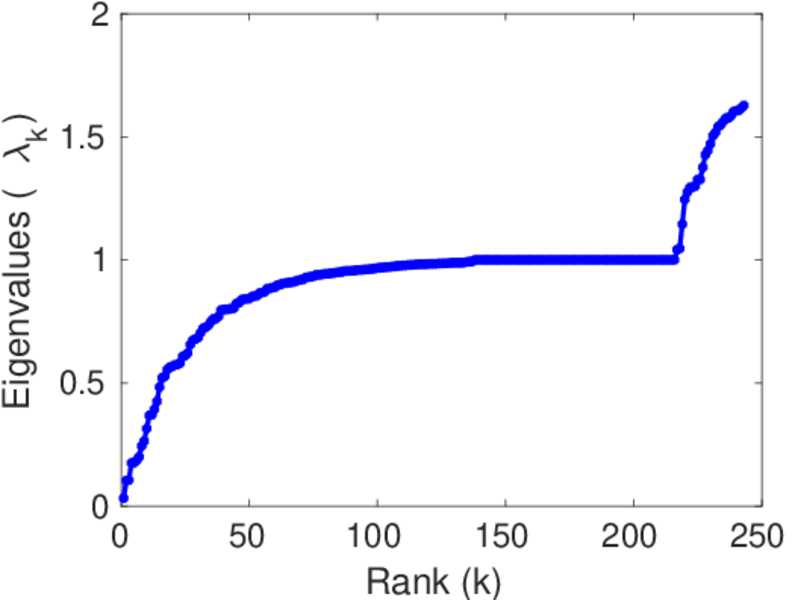
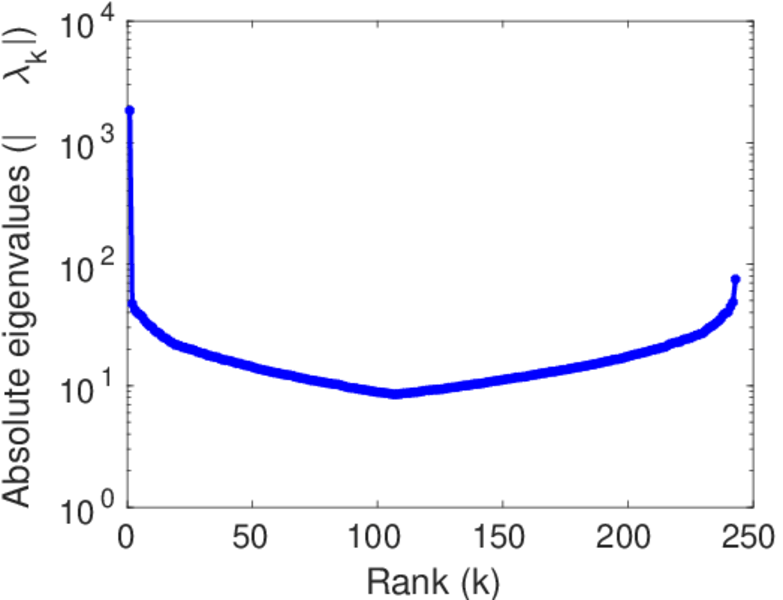
| Spectral norm | α = | 46.162 3
|
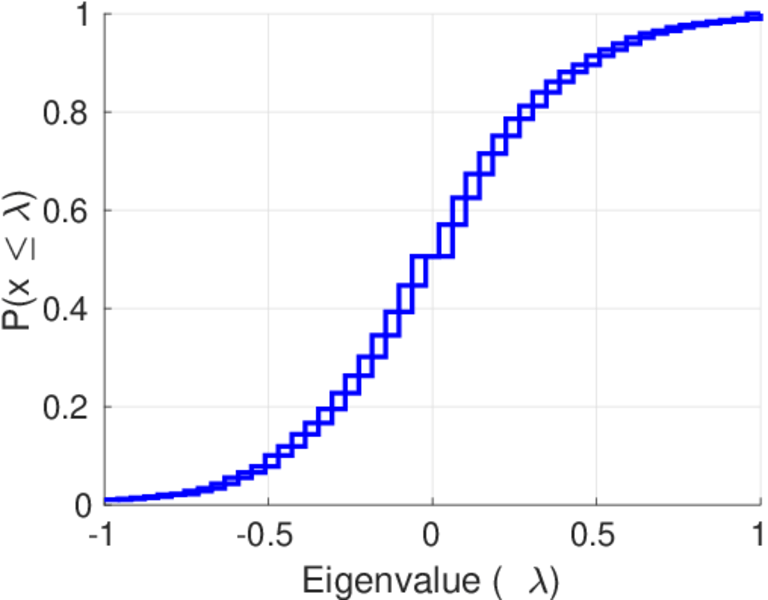
| Algebraic connectivity | a = | 0.032 310 7
|
| Spectral separation | |λ1[A] / λ2[A]| = | 1.880 58
|
| Non-bipartivity | bA = | 0.478 324
|
| Normalized non-bipartivity | bN = | 0.017 586 7
|
| Algebraic non-bipartivity | χ = | 0.032 135 6
|
| Spectral bipartite frustration | bK = | 0.000 575 690
|
| Controllability | C = | 430
|
| Relative controllability | Cr = | 0.231 432
|
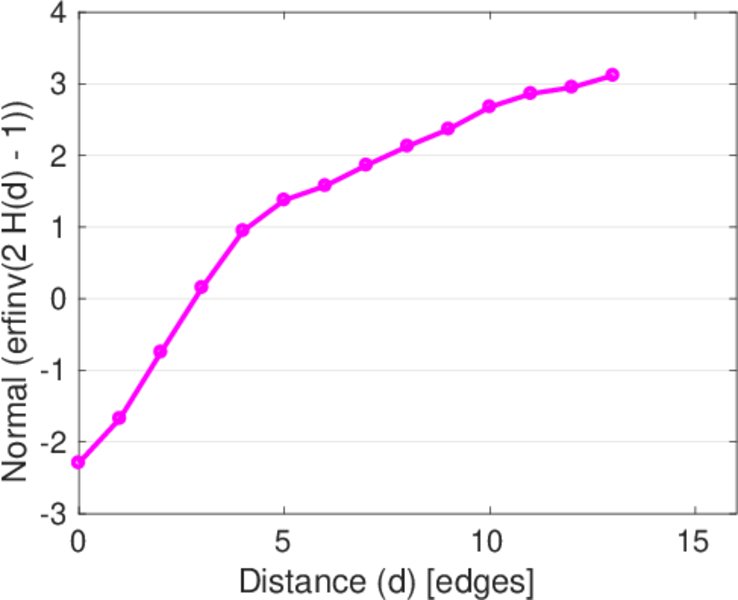
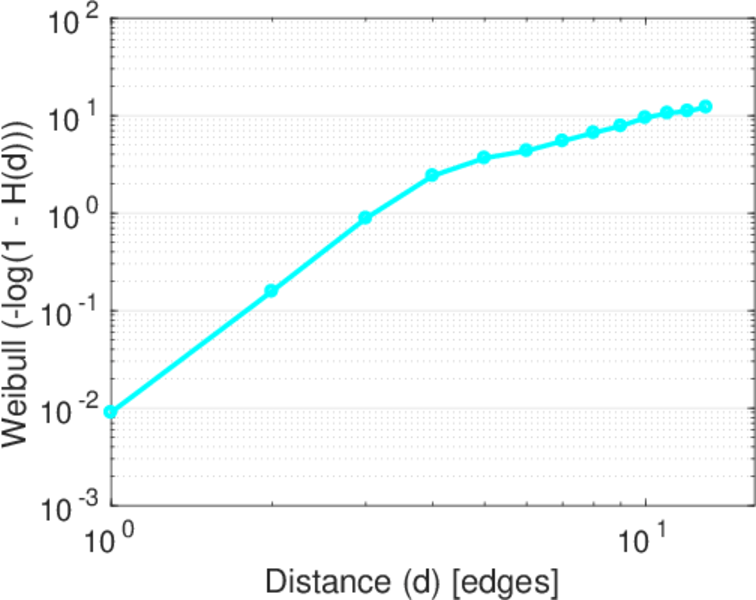
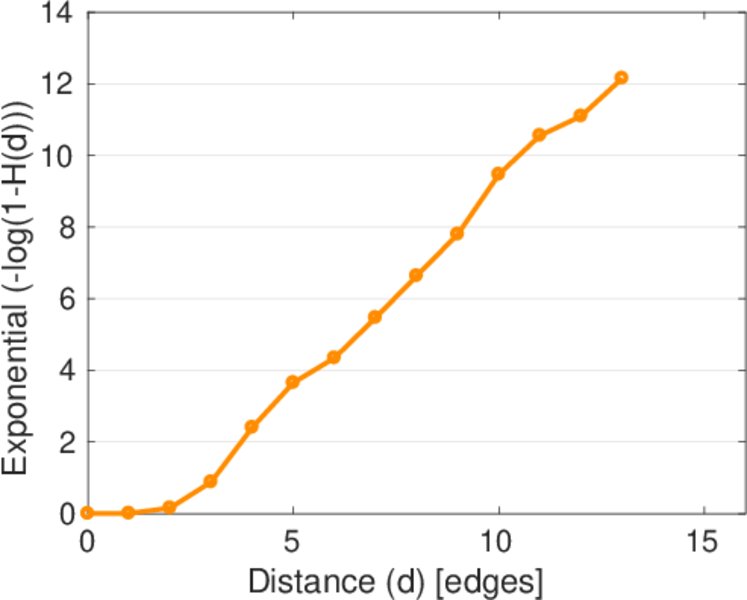
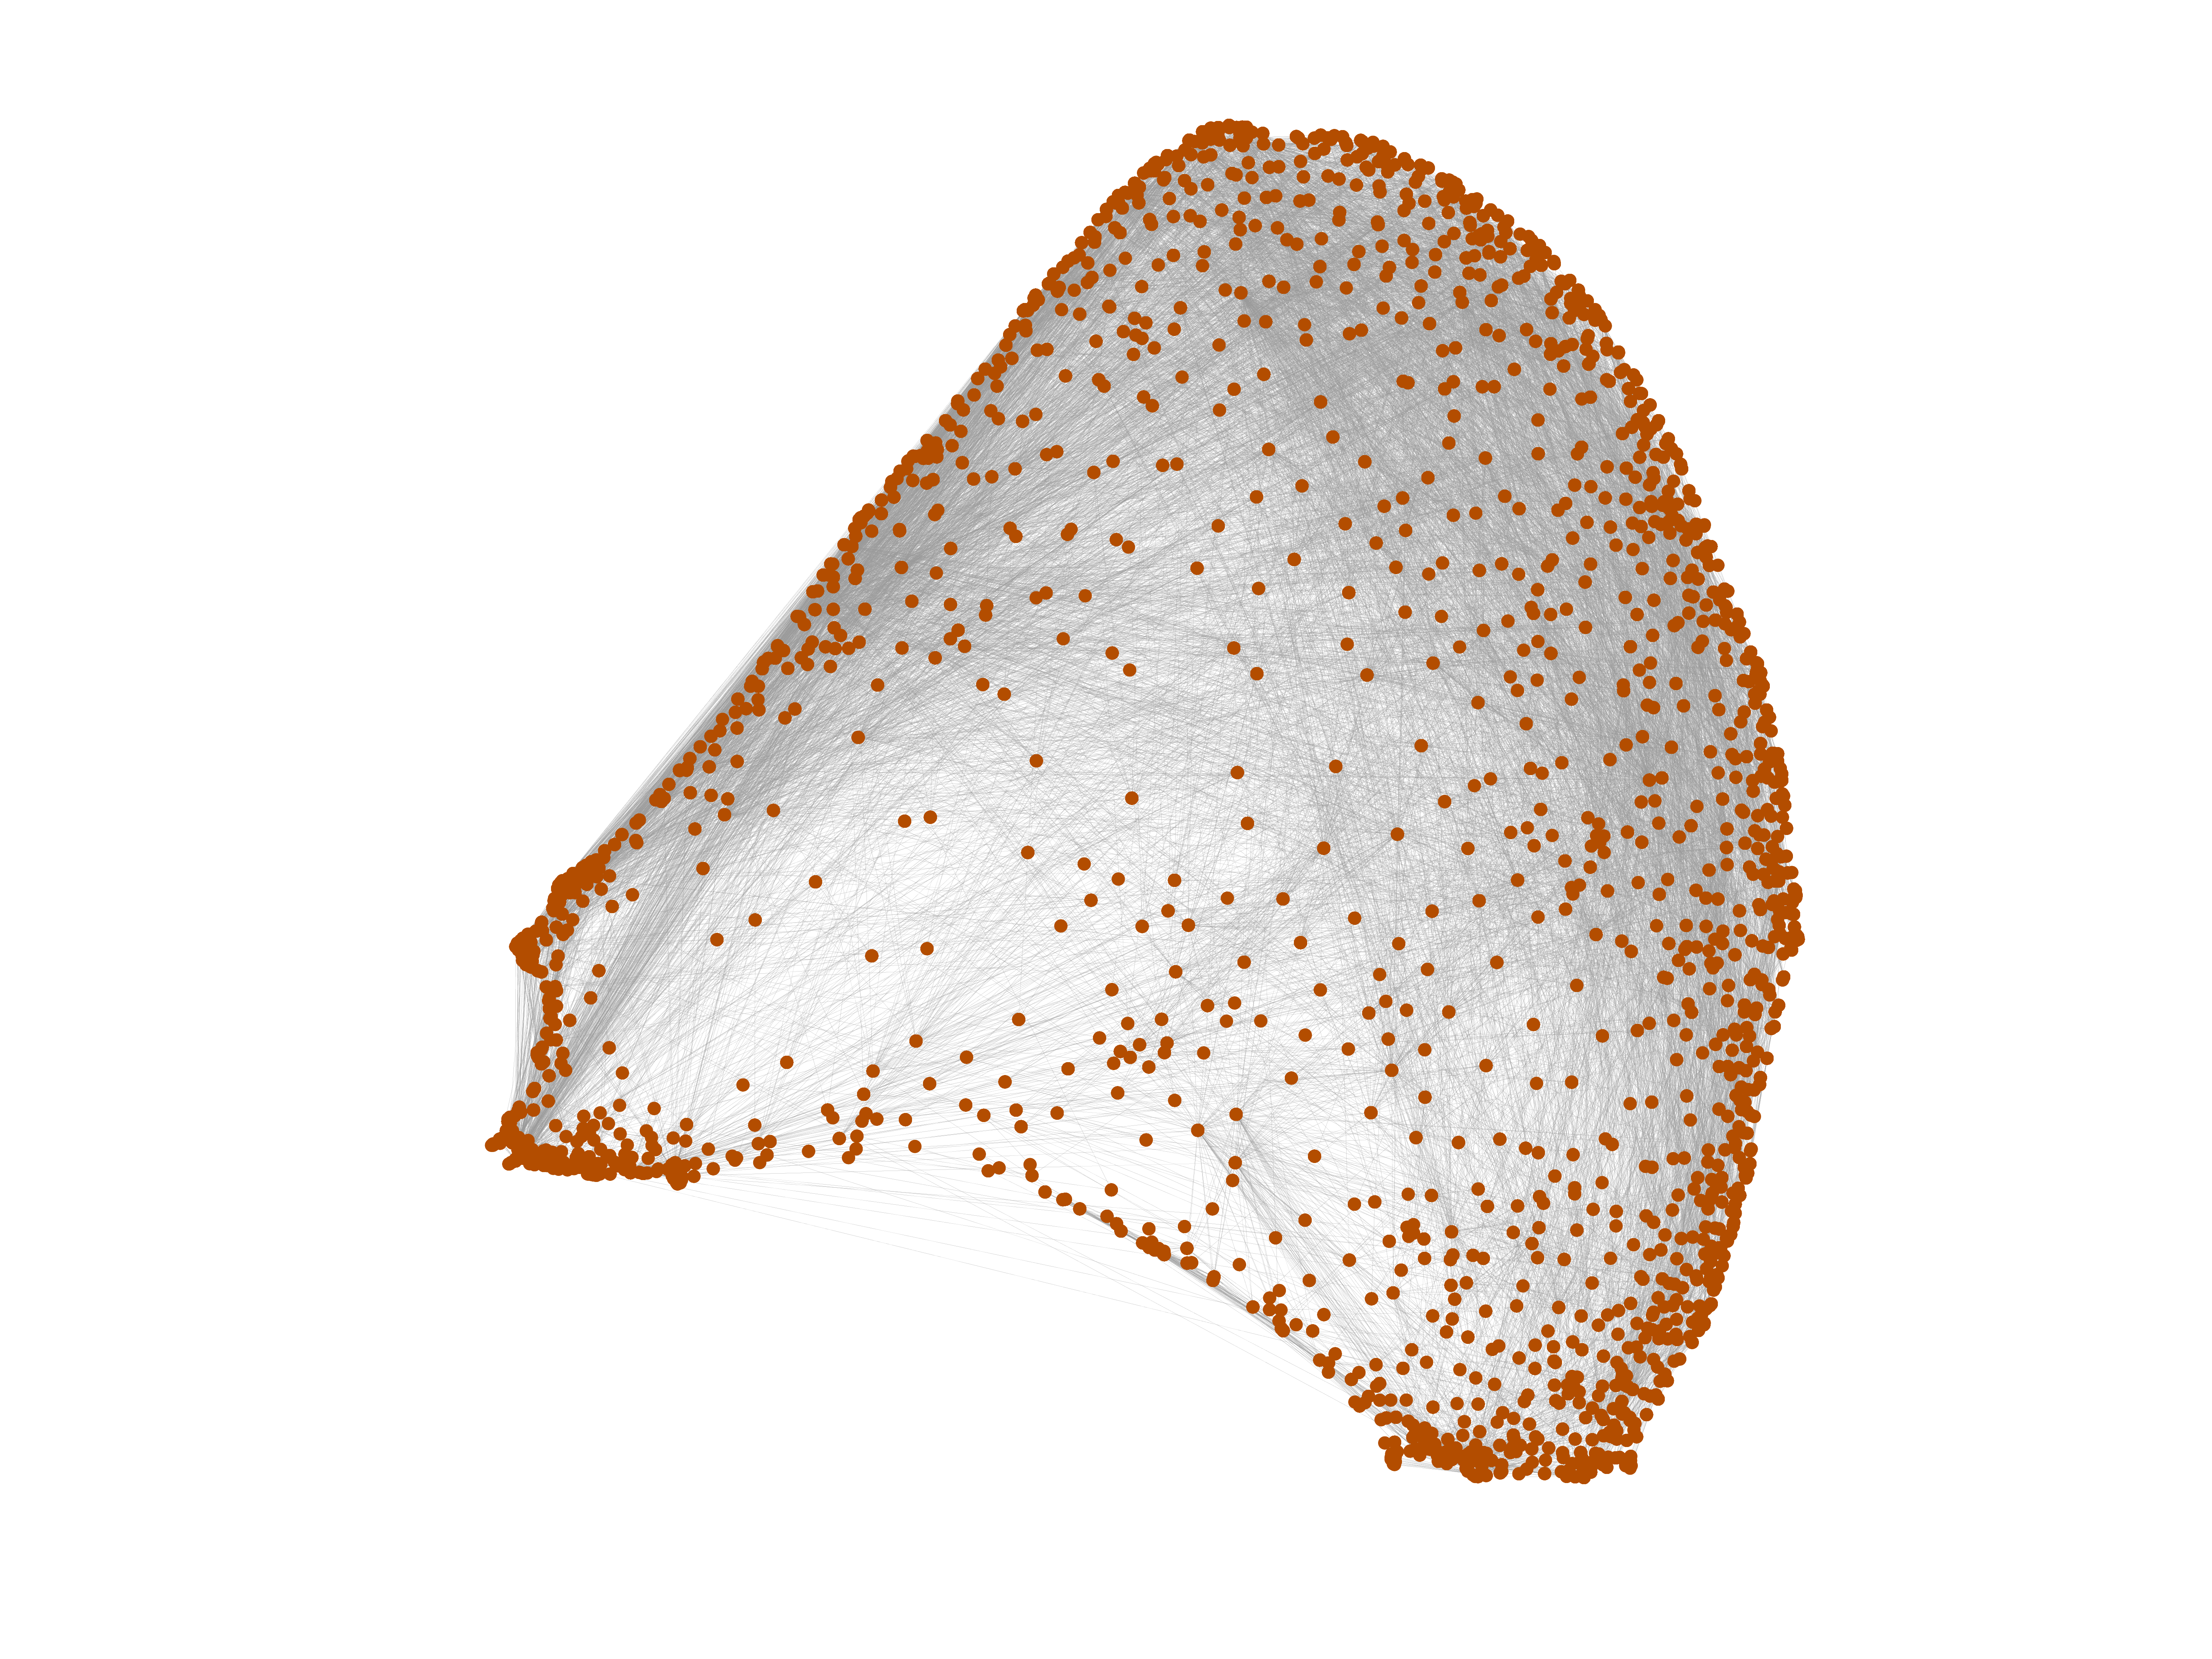
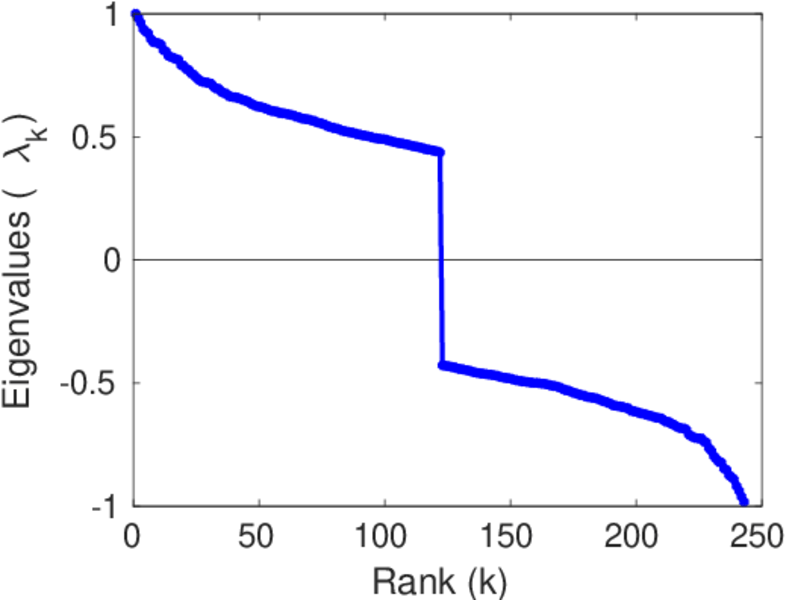
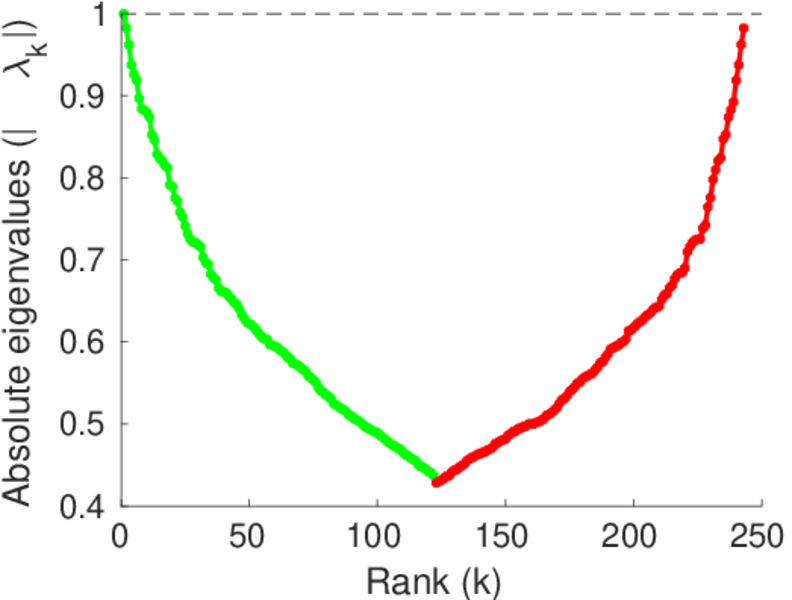
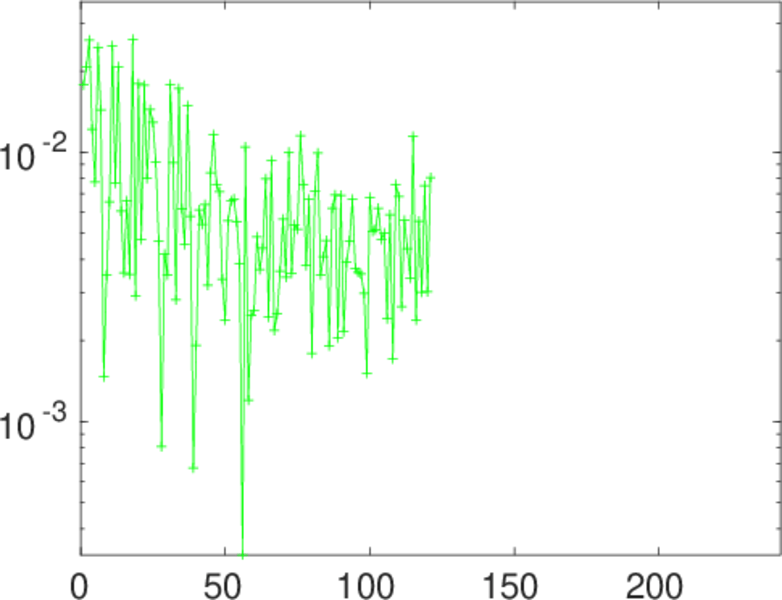
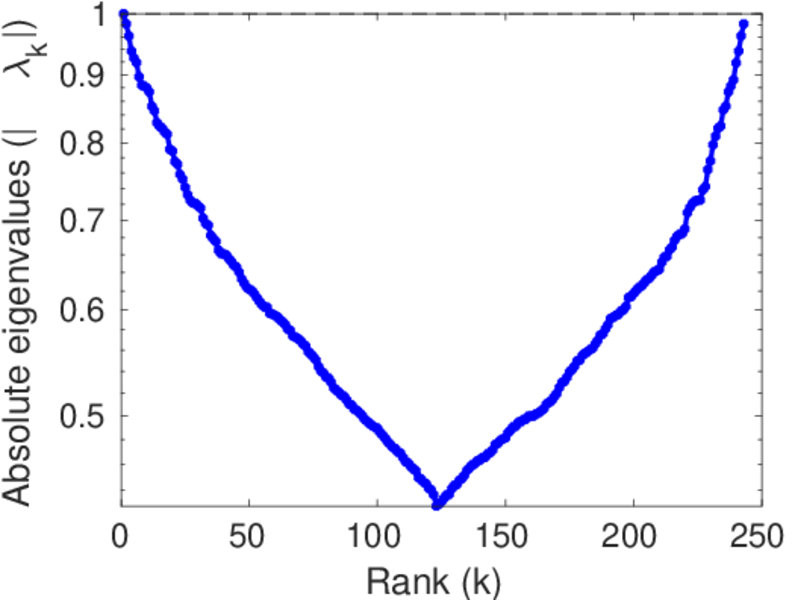
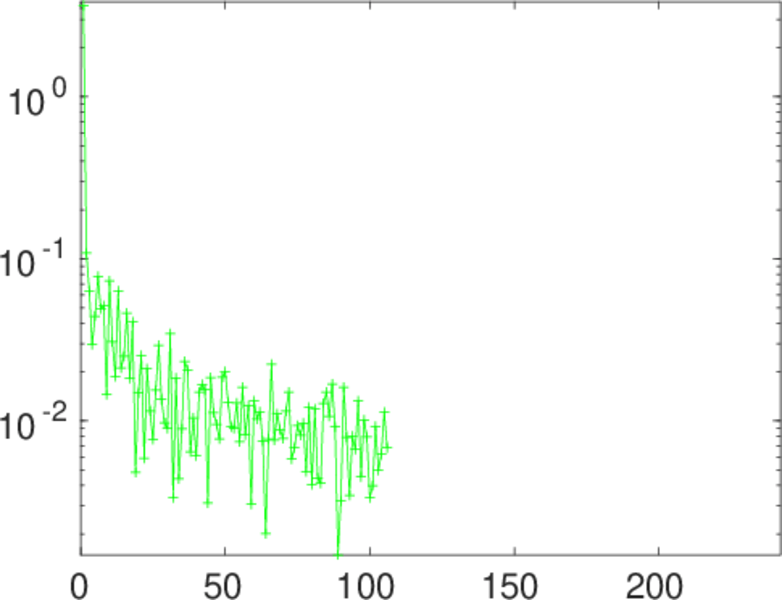
Plots


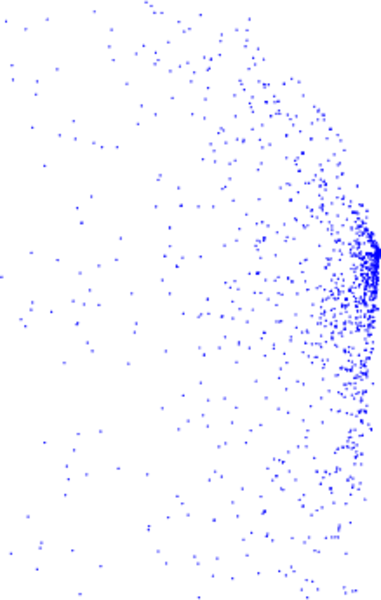
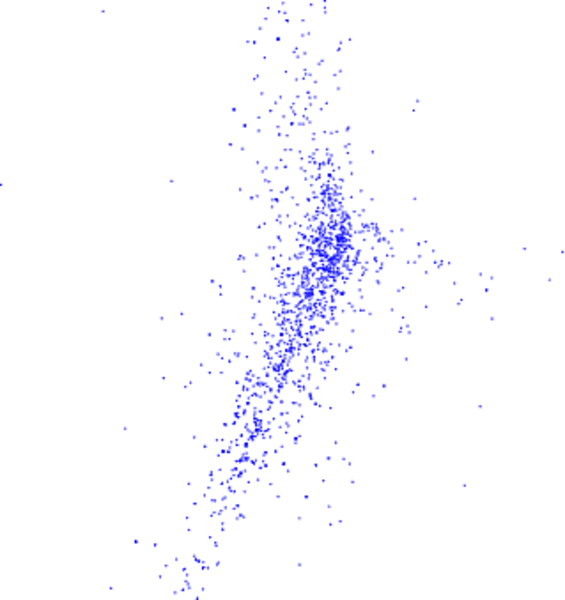
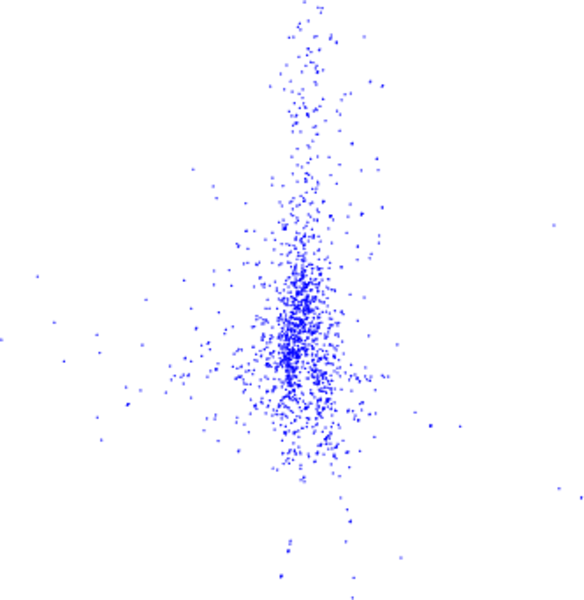
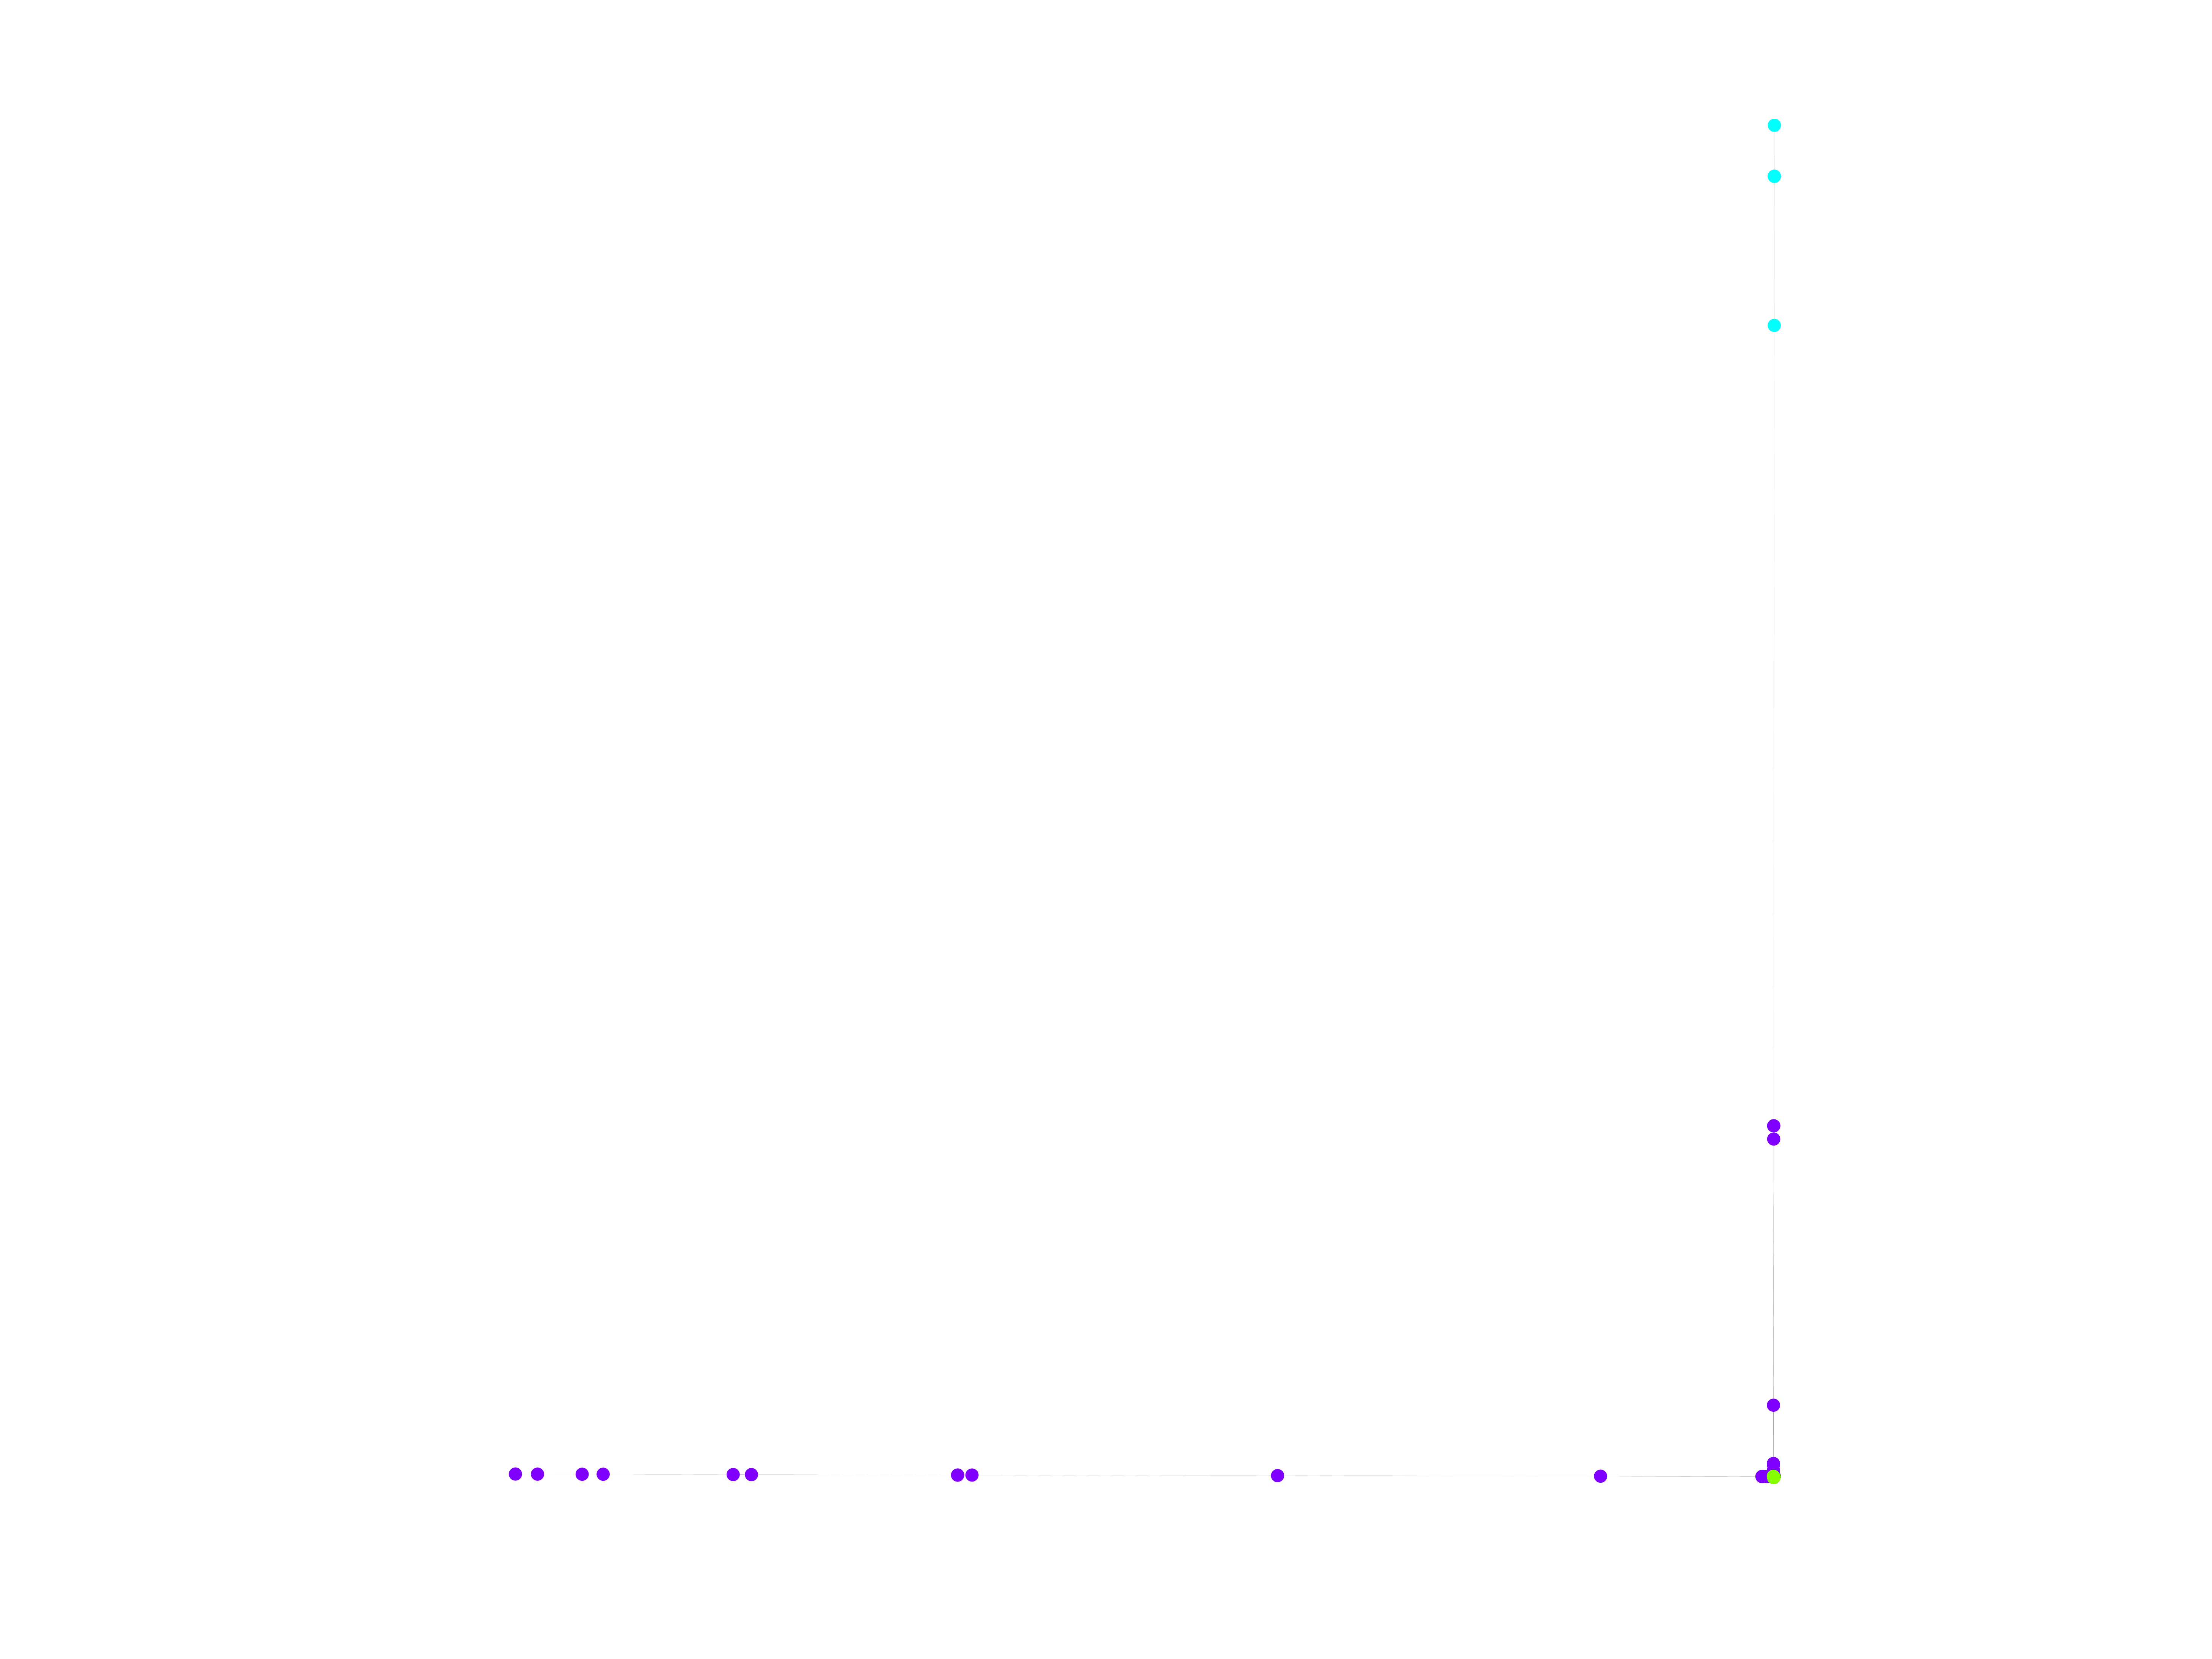
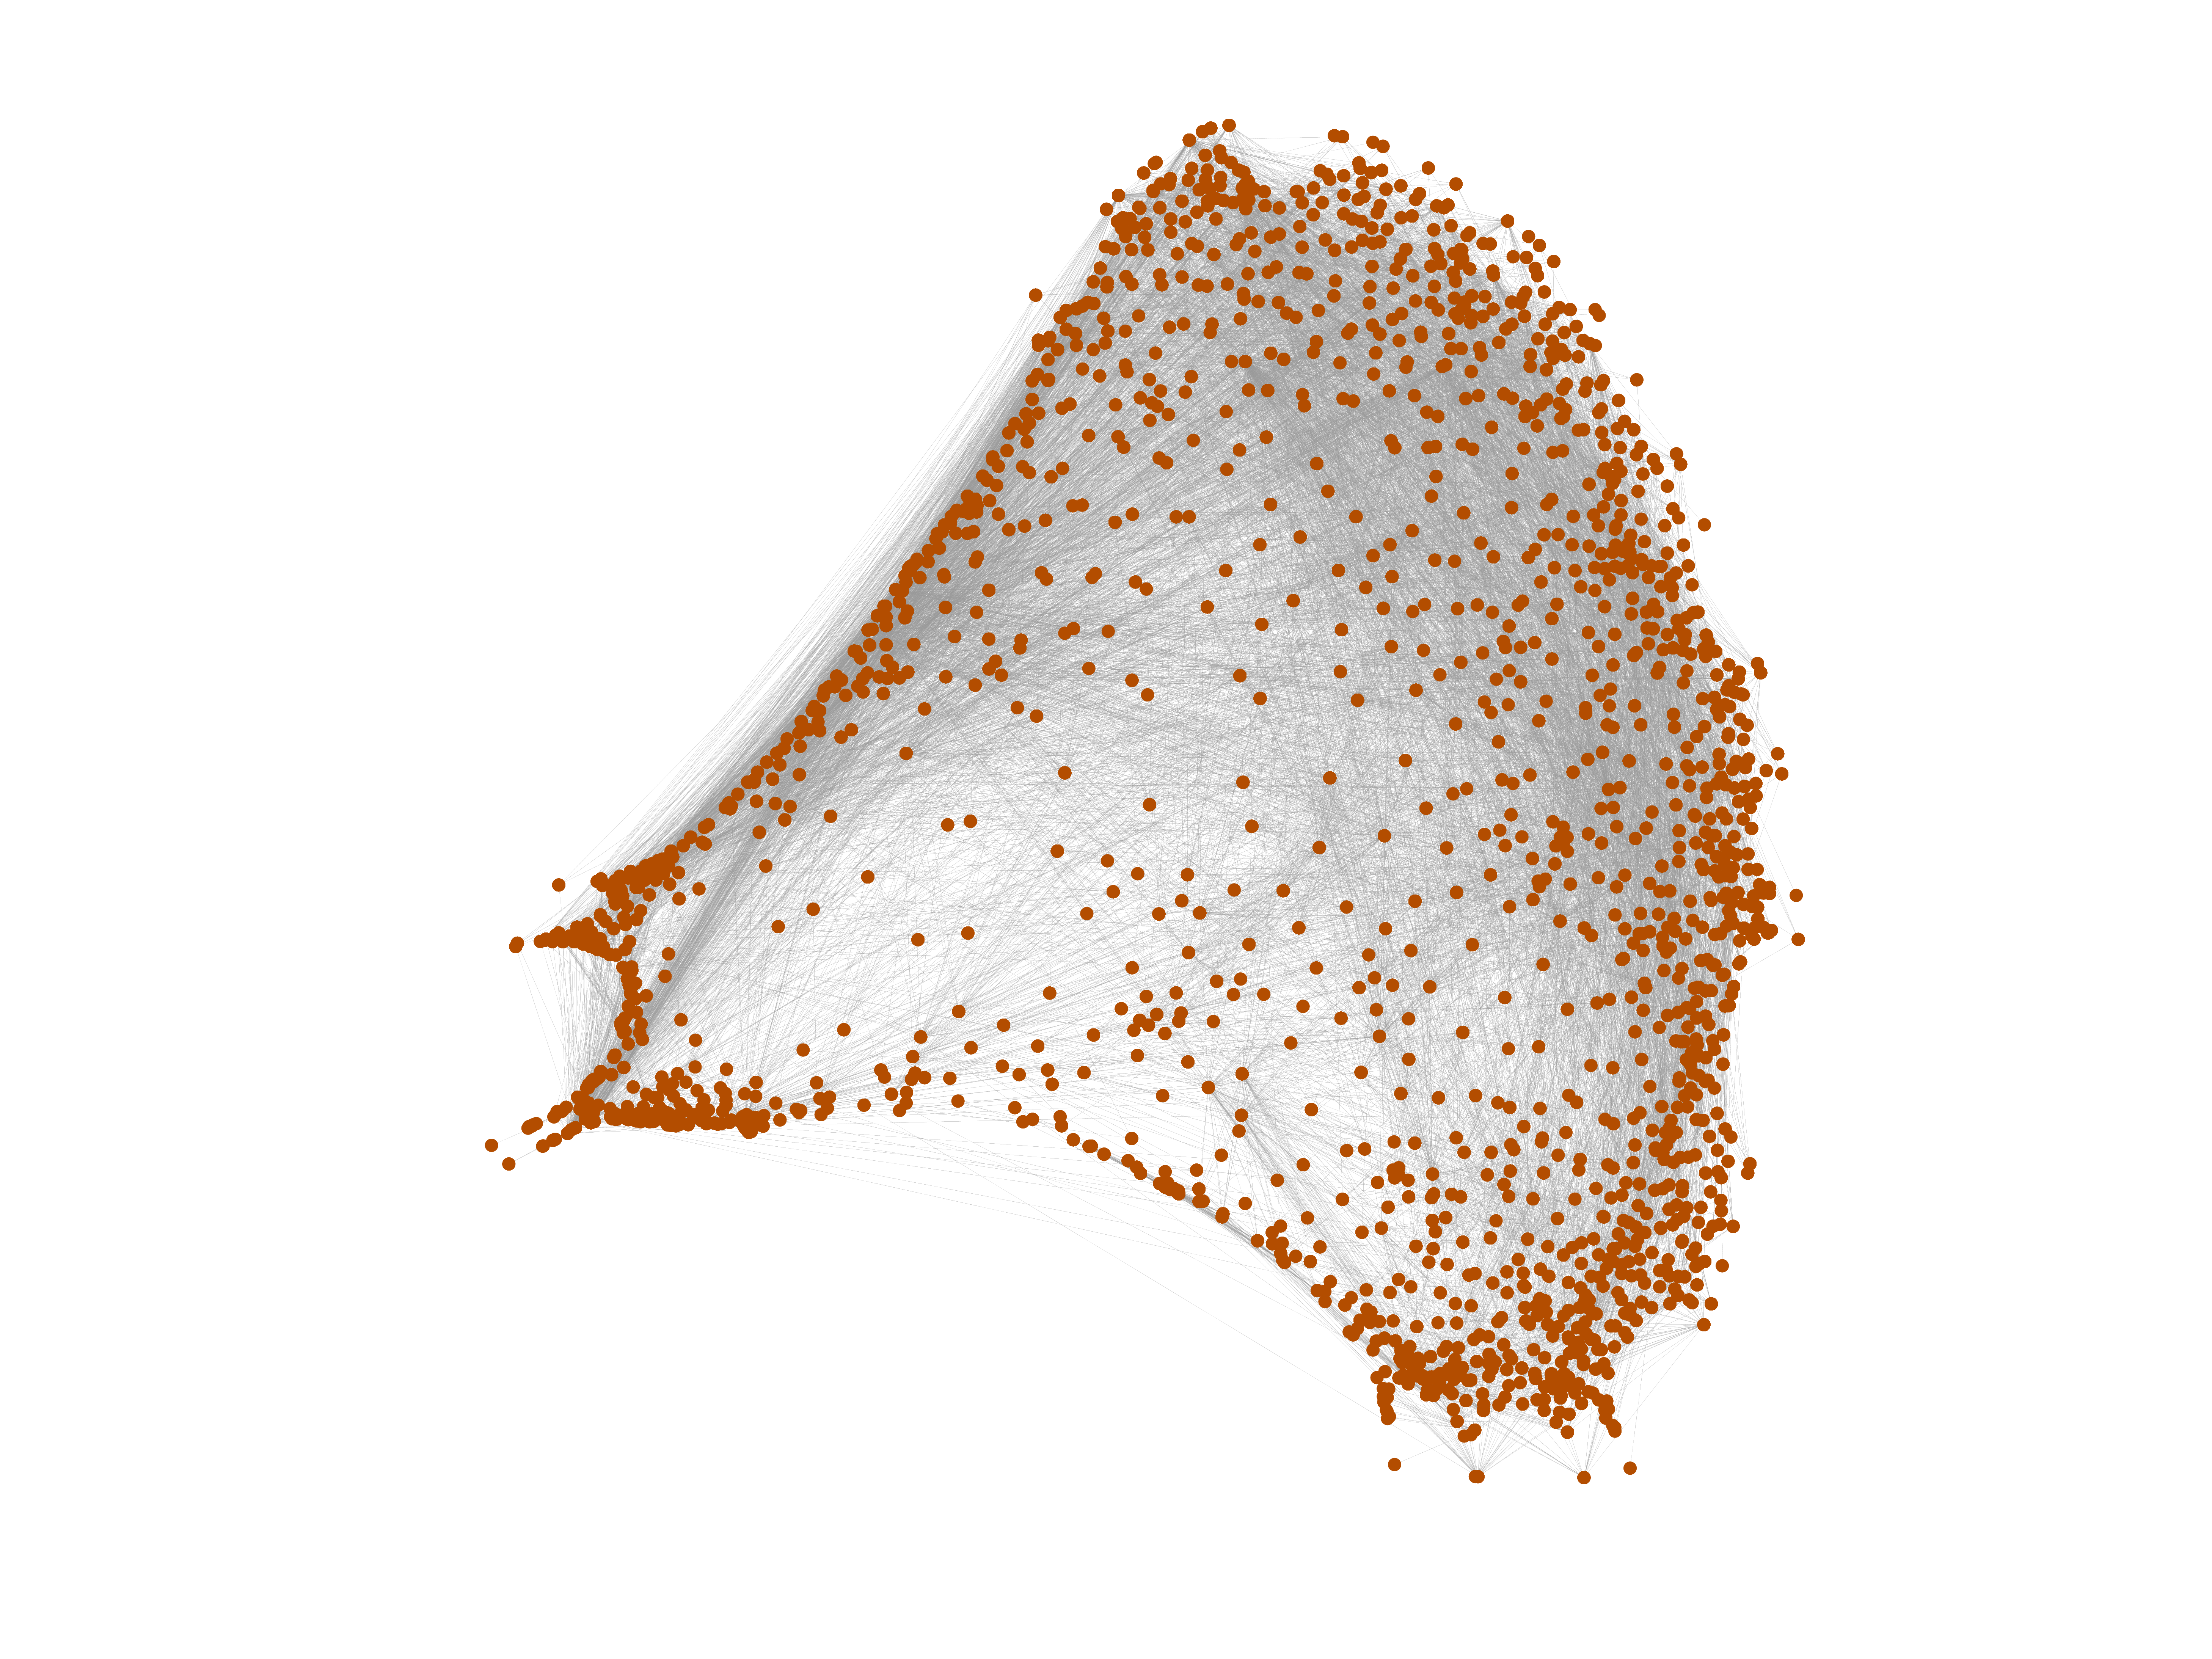
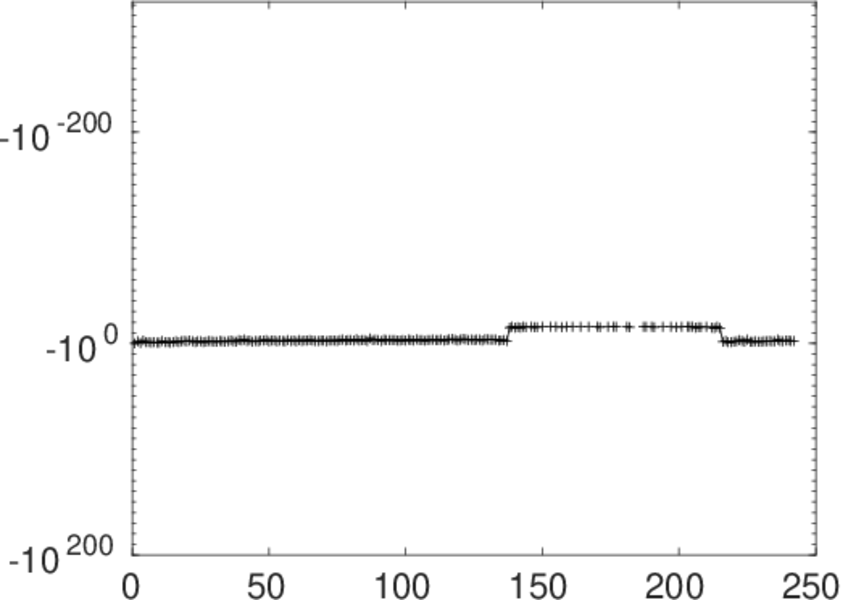
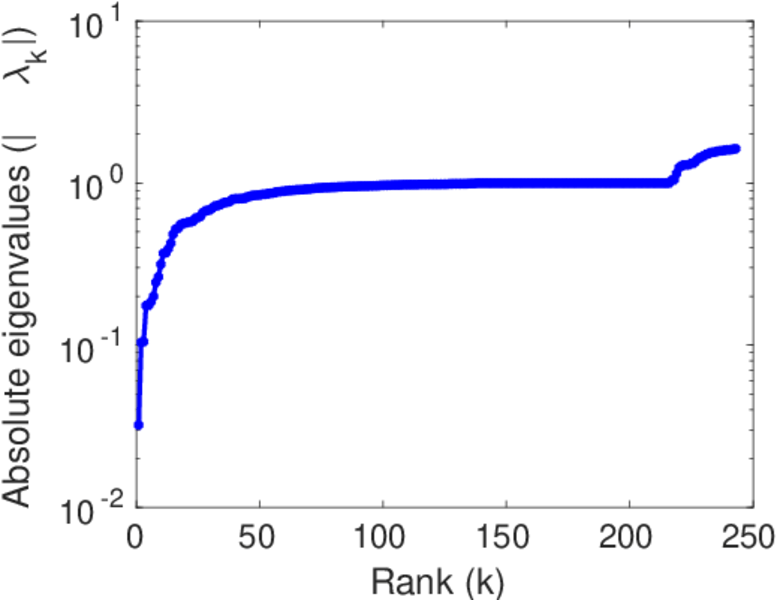
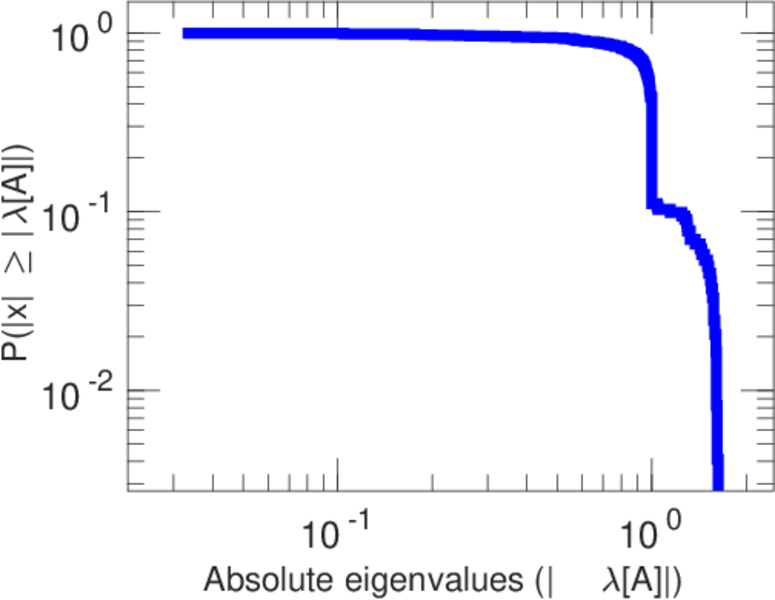
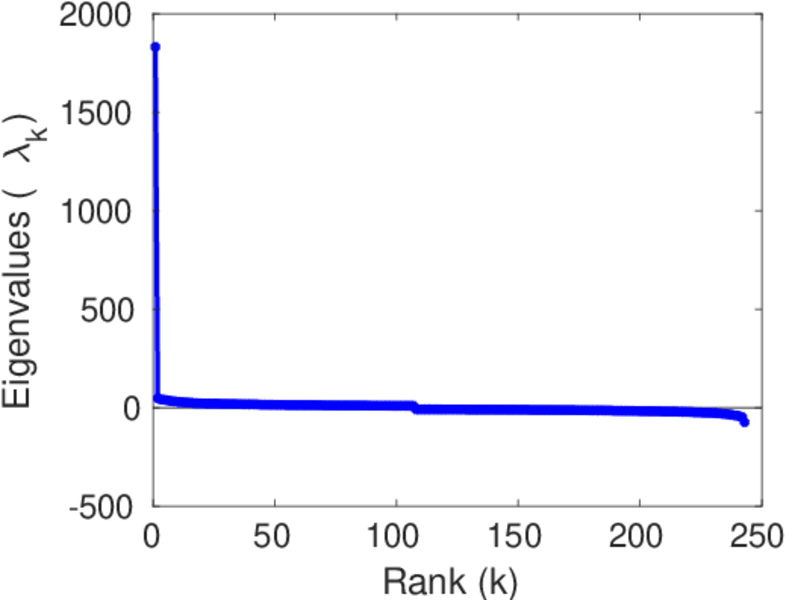
Matrix decompositions plots


Downloads
References
|
[1]
|
Jérôme Kunegis.
KONECT – The Koblenz Network Collection.
In Proc. Int. Conf. on World Wide Web Companion, pages
1343–1350, 2013.
[ http ]
|
 KONECT ‣ Networks ‣
Buy Me a Coffee
KONECT ‣ Networks ‣
Buy Me a Coffee