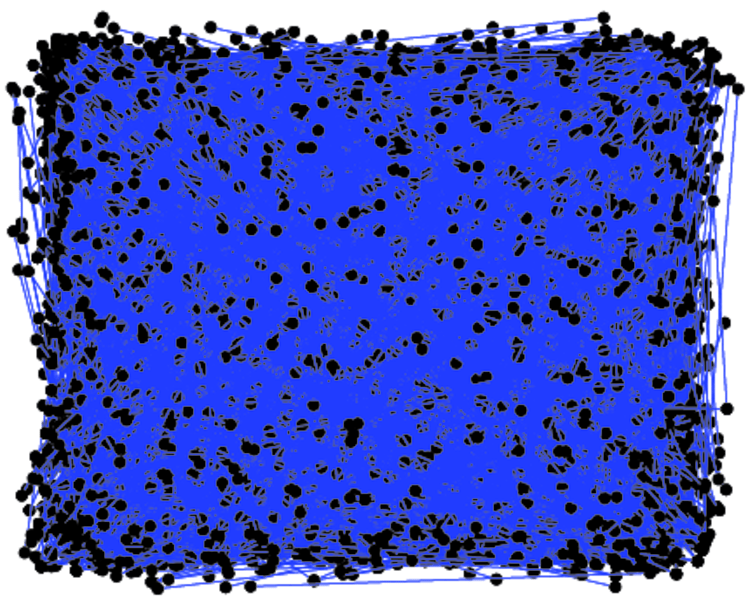
Prosper groups
This is the bipartite network of Prosper.com users and the groups they support.
Metadata
Statistics
| Size | n = | 7,595
|
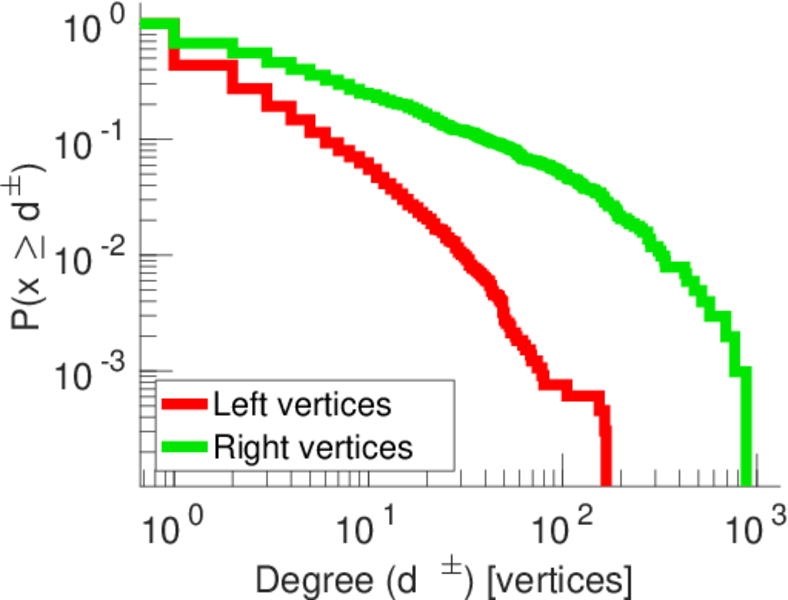
| Left size | n1 = | 6,582
|
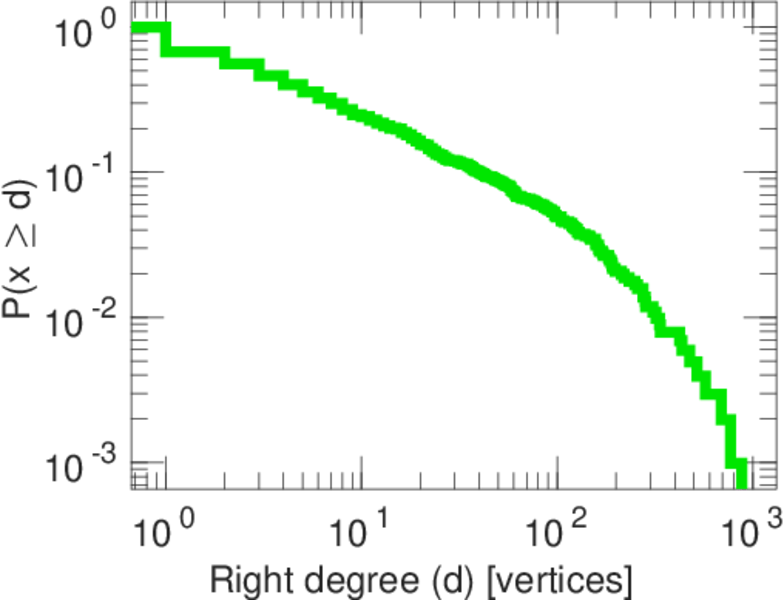
| Right size | n2 = | 1,013
|
| Volume | m = | 21,017
|
| Wedge count | s = | 2,663,394
|
| Claw count | z = | 410,799,393
|
| Cross count | x = | 64,598,135,790
|
| Square count | q = | 1,474,982
|
| 4-Tour count | T4 = | 22,497,618
|
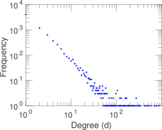
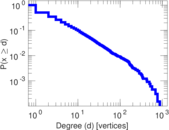
| Maximum degree | dmax = | 877
|
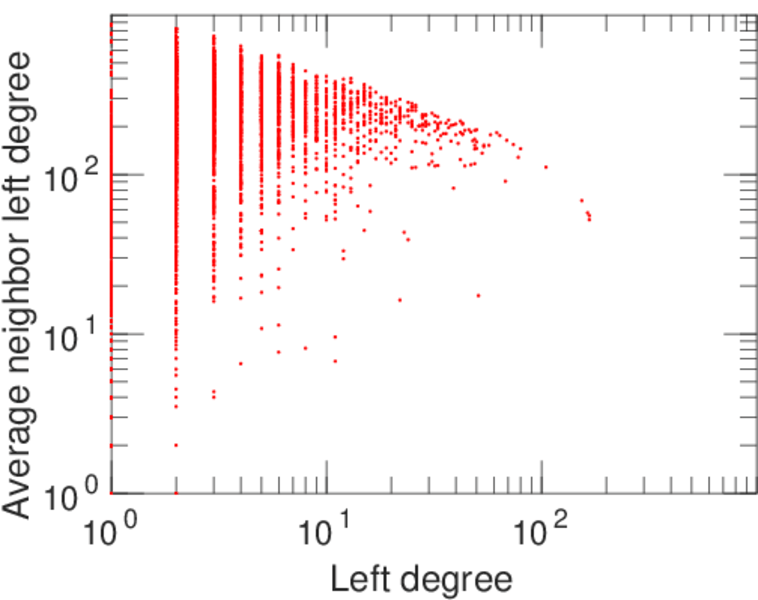
| Maximum left degree | d1max = | 167
|
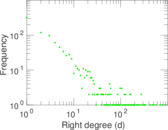
| Maximum right degree | d2max = | 877
|
| Average degree | d = | 5.534 43
|
| Average left degree | d1 = | 3.193 10
|
| Average right degree | d2 = | 20.747 3
|
| Fill | p = | 0.003 152 12
|
| Size of LCC | N = | 7,329
|
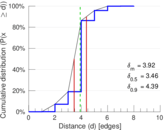
| Diameter | δ = | 10
|
| 50-Percentile effective diameter | δ0.5 = | 3.460 32
|
| 90-Percentile effective diameter | δ0.9 = | 4.390 04
|
| Median distance | δM = | 4
|
| Mean distance | δm = | 3.917 49
|
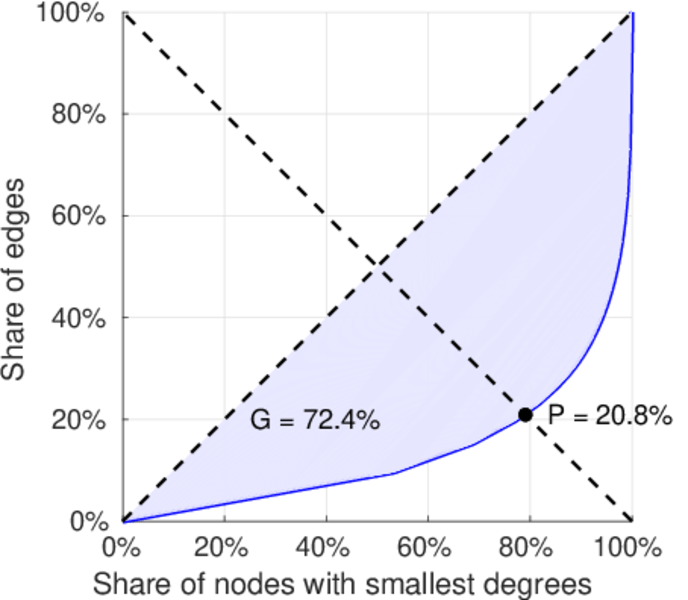
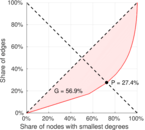
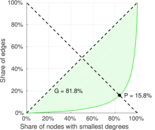
| Gini coefficient | G = | 0.737 608
|
| Balanced inequality ratio | P = | 0.204 311
|
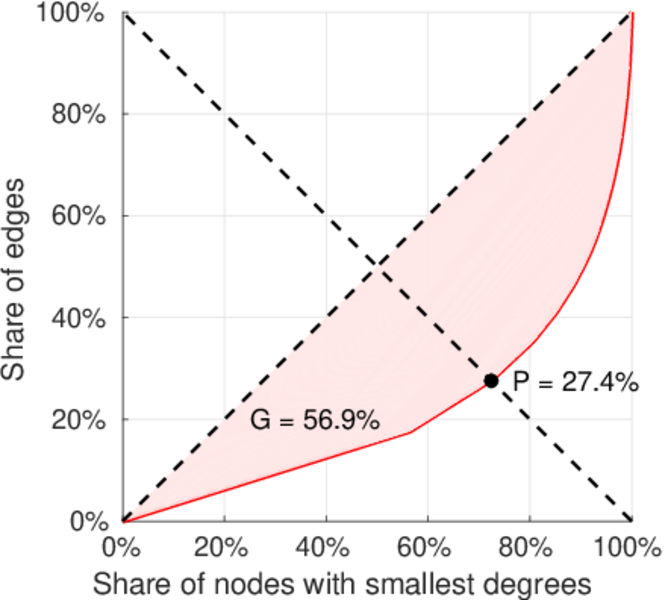
| Left balanced inequality ratio | P1 = | 0.274 207
|
| Right balanced inequality ratio | P2 = | 0.158 348
|
| Relative edge distribution entropy | Her = | 0.822 400
|
| Power law exponent | γ = | 2.400 92
|
| Tail power law exponent | γt = | 2.111 00
|
| Tail power law exponent with p | γ3 = | 2.111 00
|
| p-value | p = | 0.682 000
|
| Left tail power law exponent with p | γ3,1 = | 1.971 00
|
| Left p-value | p1 = | 0.000 00
|
| Right tail power law exponent with p | γ3,2 = | 1.651 00
|
| Right p-value | p2 = | 0.001 000 00
|
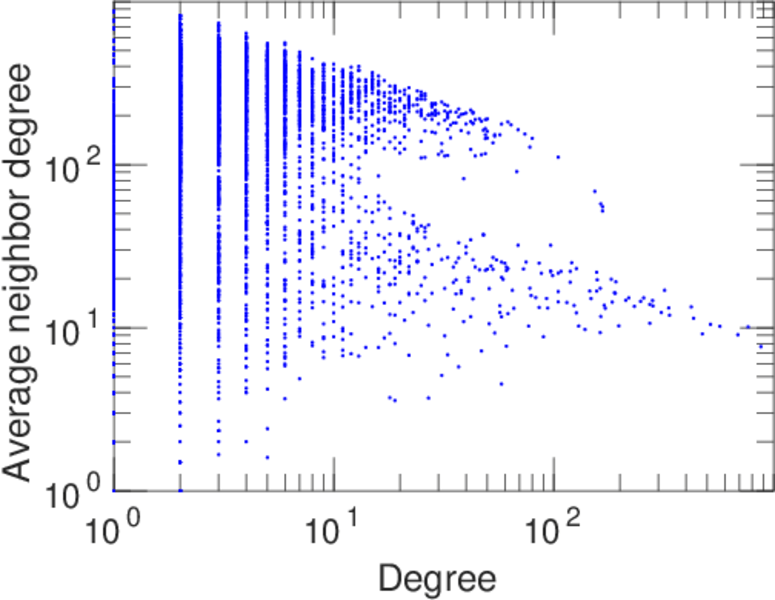
| Degree assortativity | ρ = | −0.194 926
|
| Degree assortativity p-value | pρ = | 4.792 53 × 10−179
|
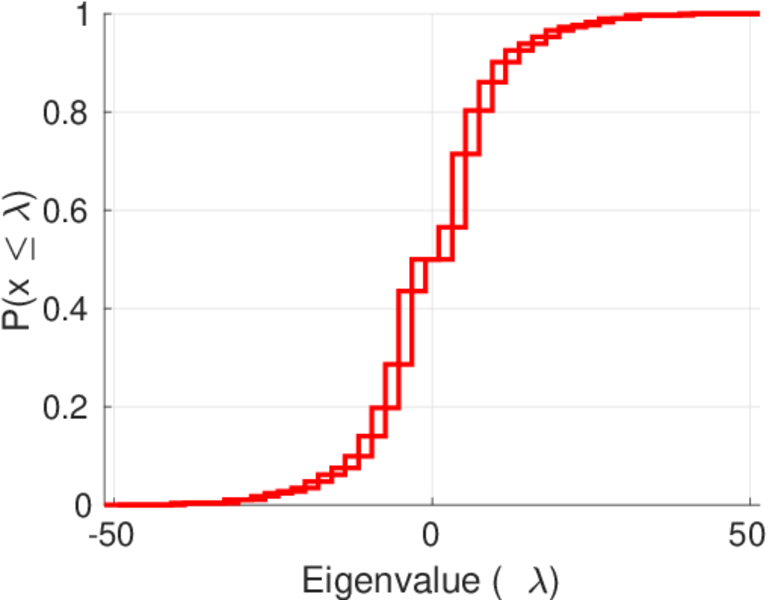
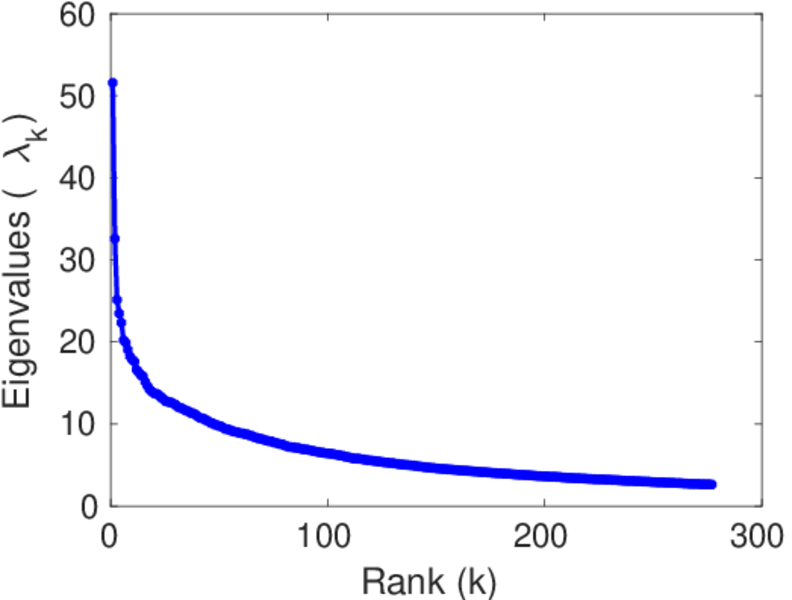
| Spectral norm | α = | 51.569 1
|
| Algebraic connectivity | a = | 0.116 844
|
| Spectral separation | |λ1[A] / λ2[A]| = | 1.582 95
|
| Controllability | C = | 5,836
|
| Relative controllability | Cr = | 0.768 400
|
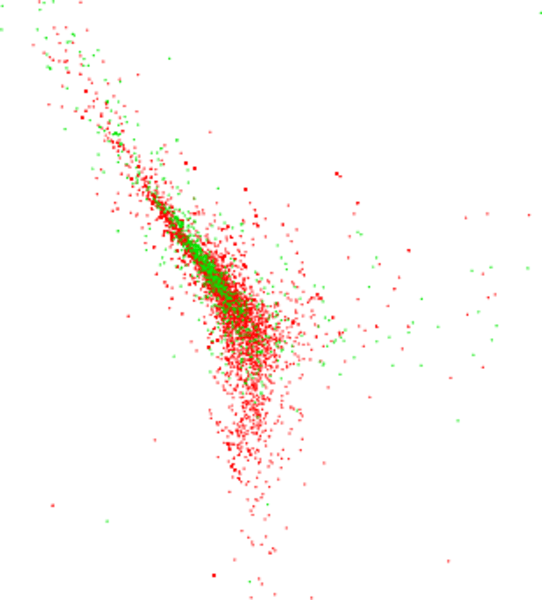
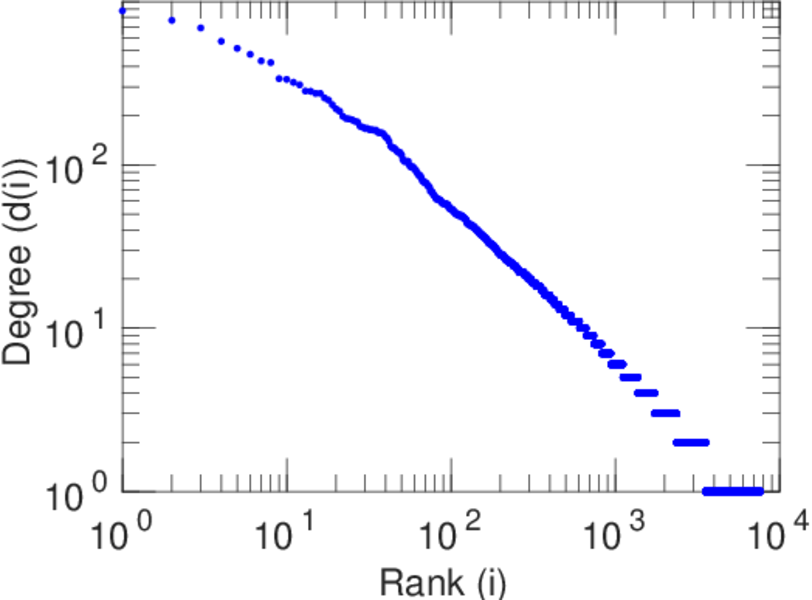
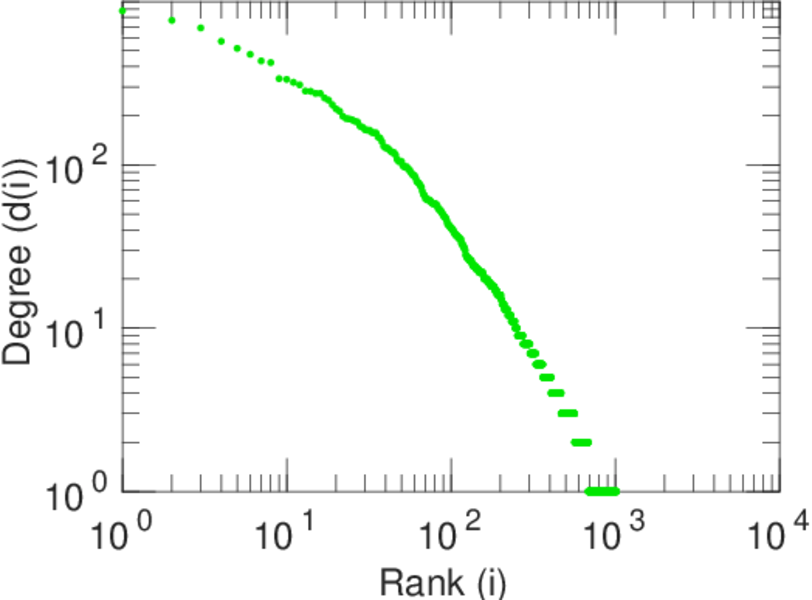
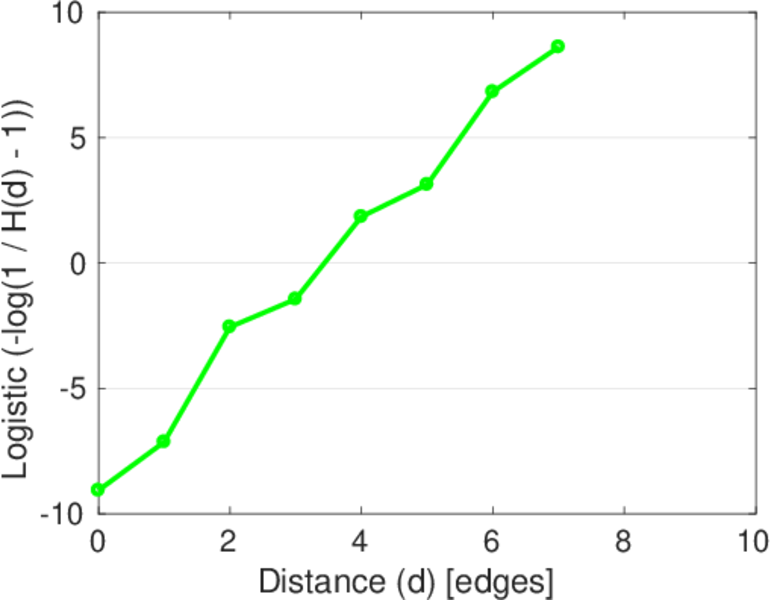
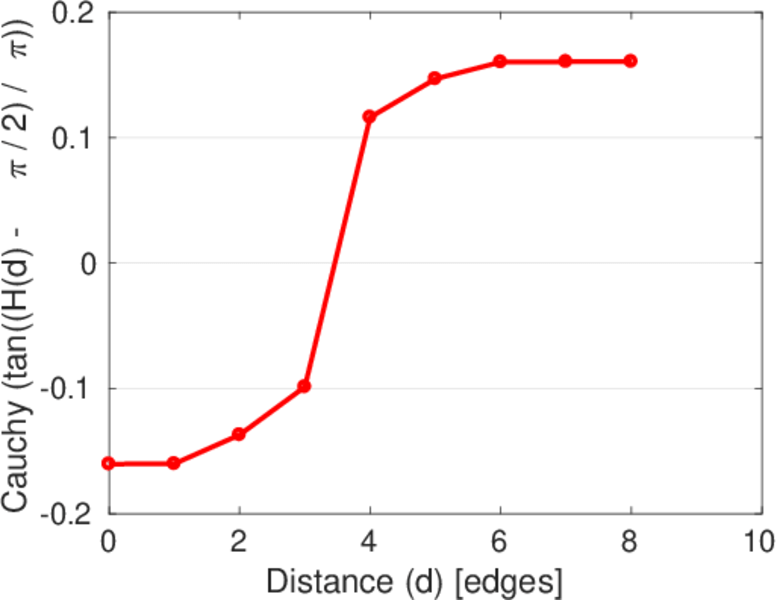
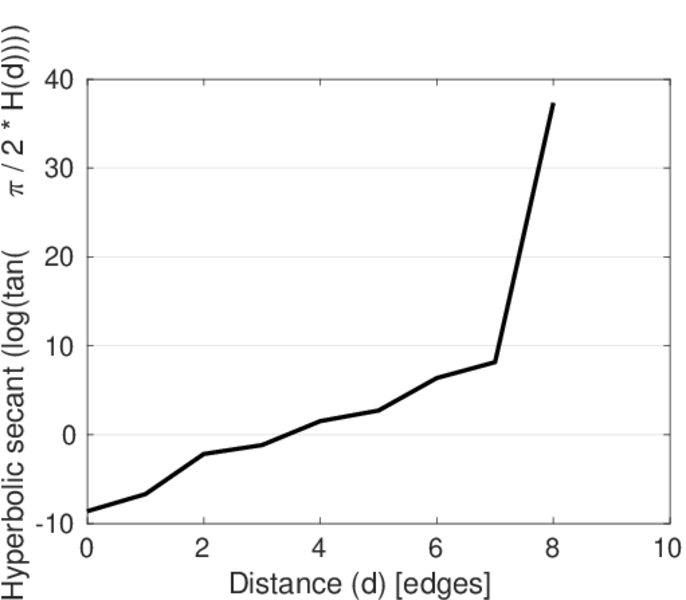
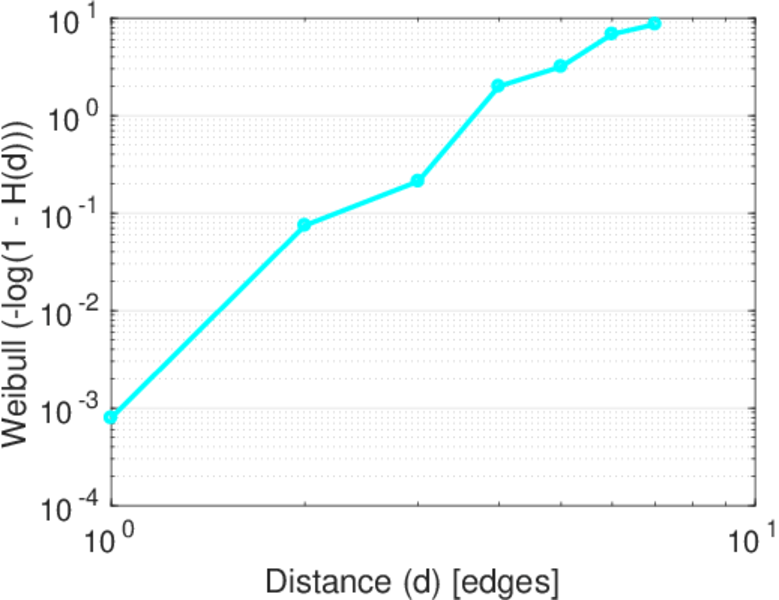
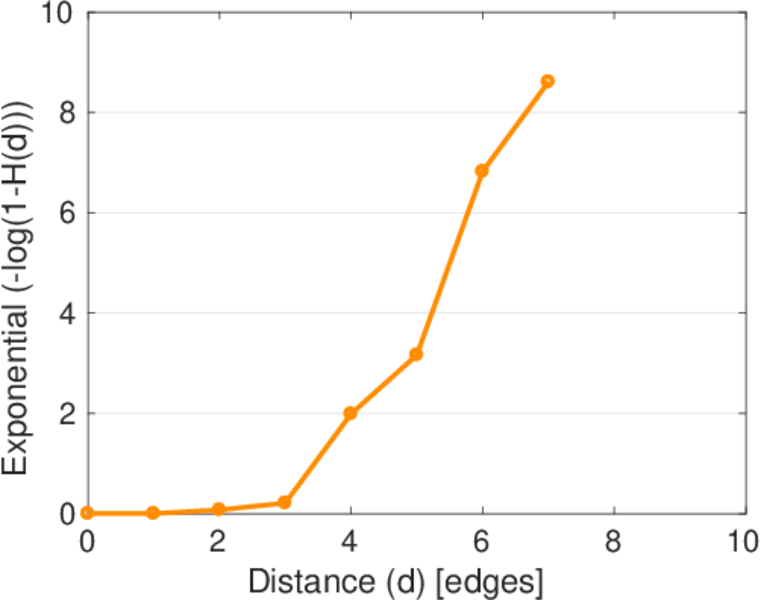
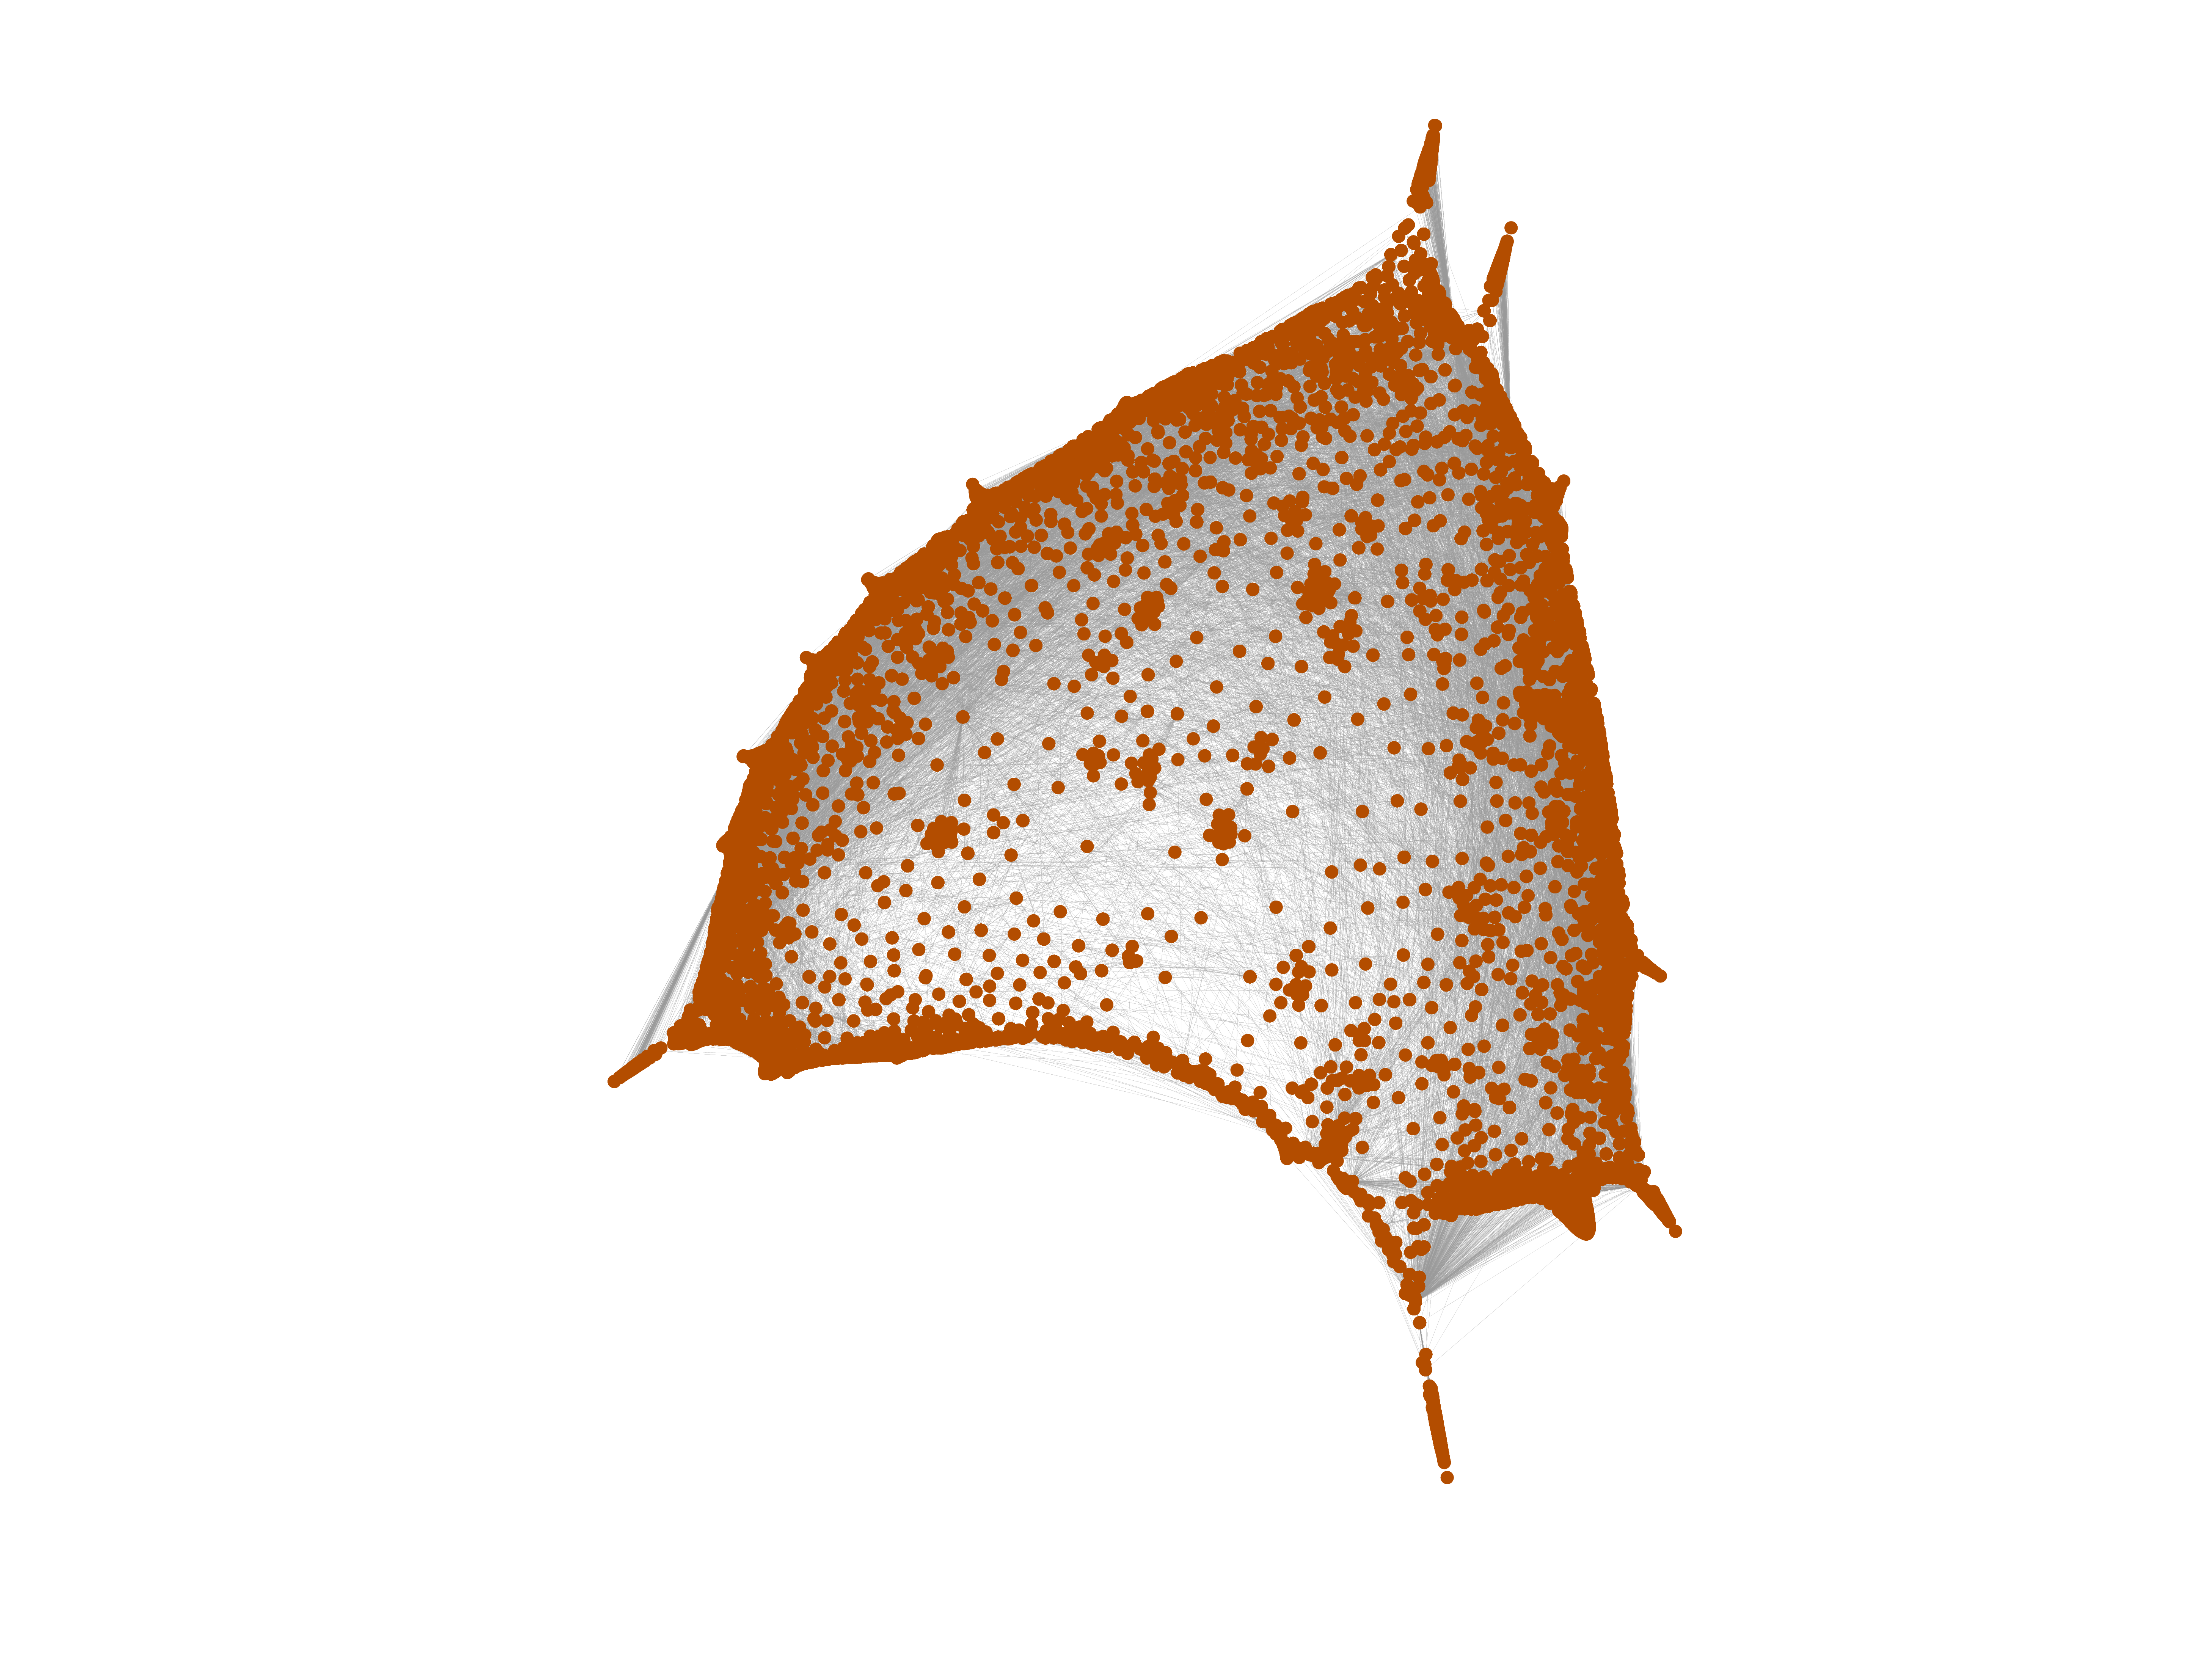
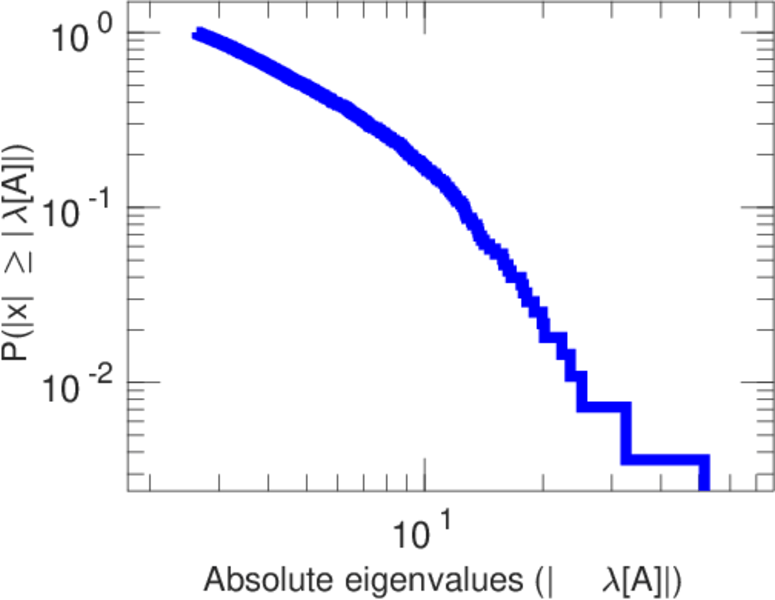
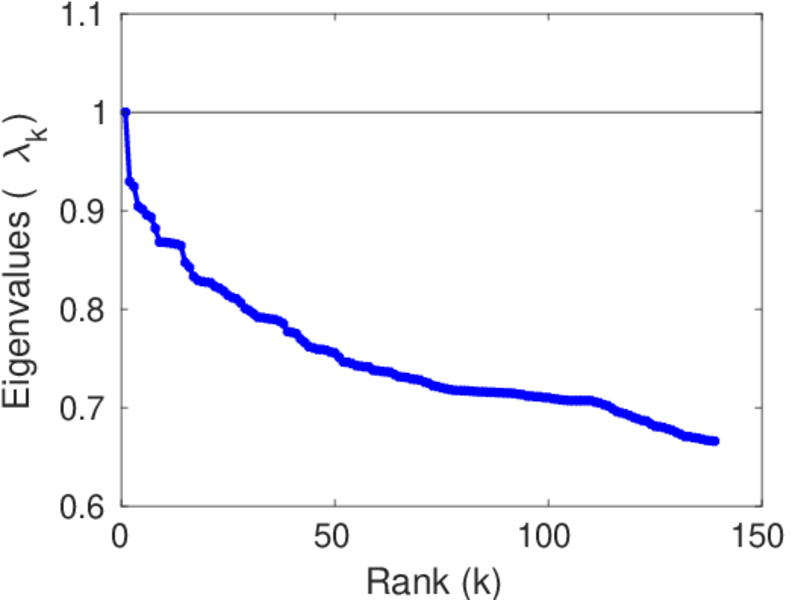
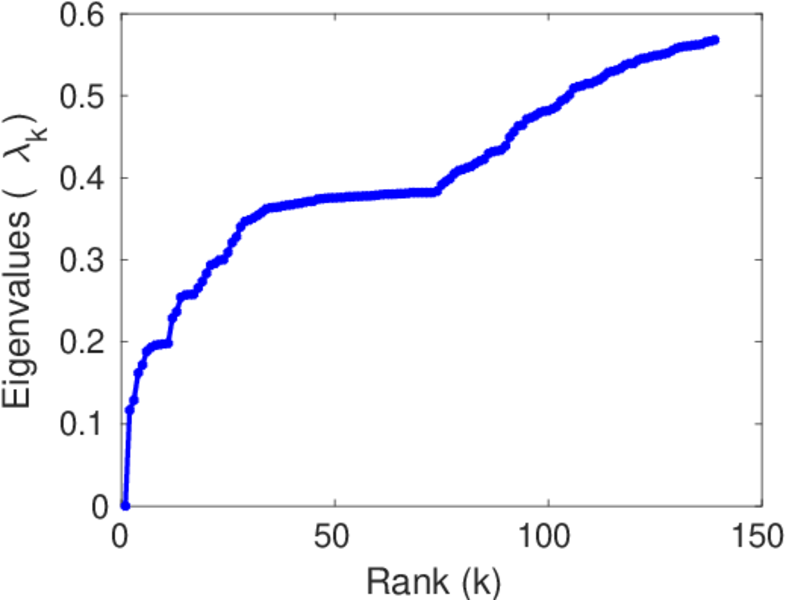
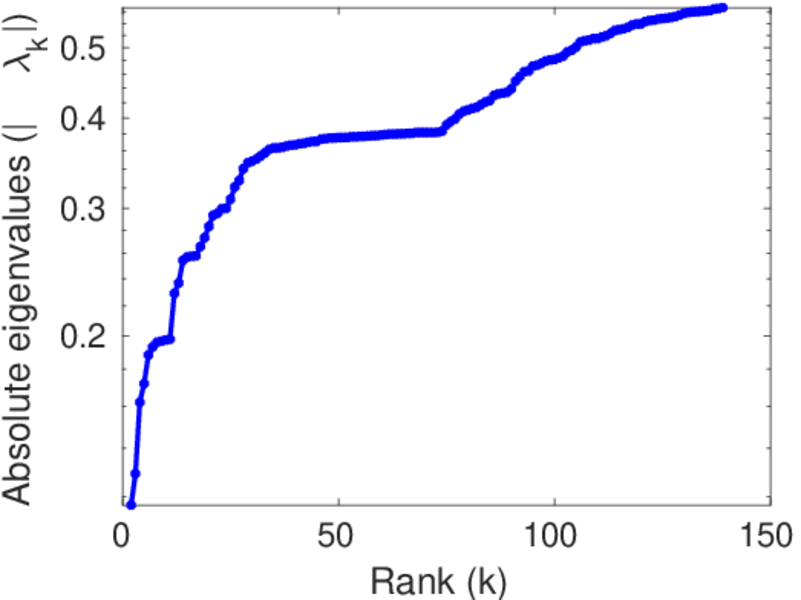
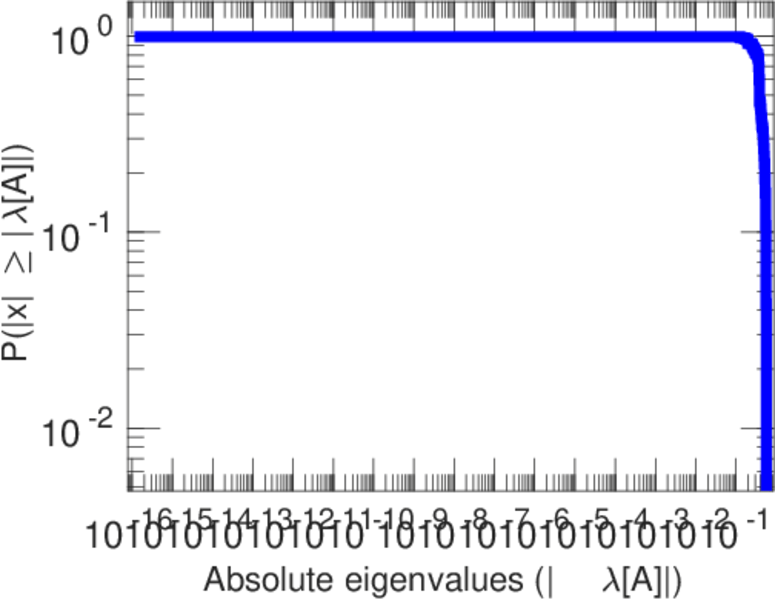
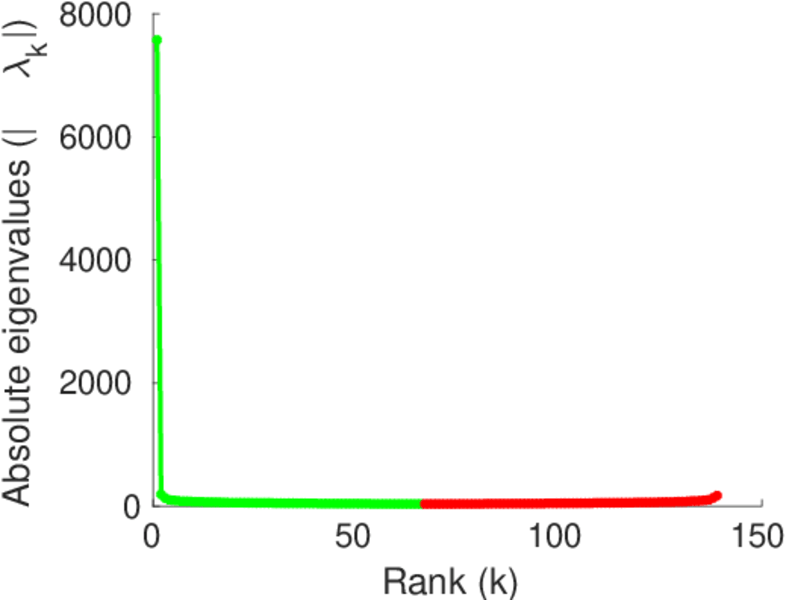
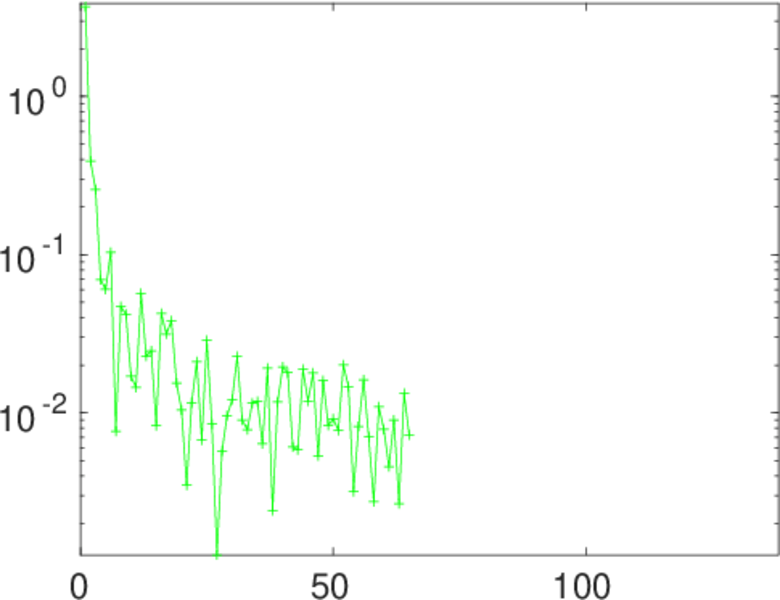
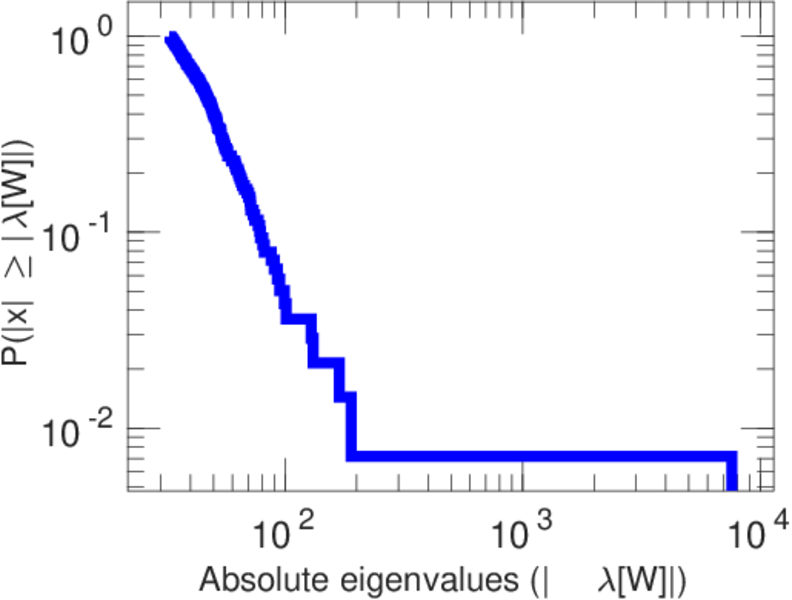
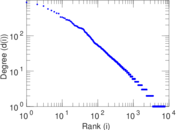
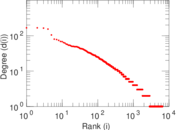
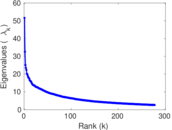
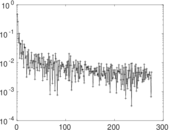
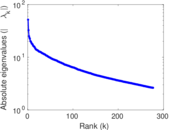
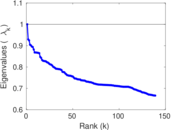
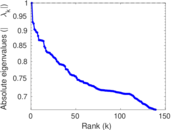
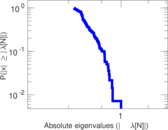
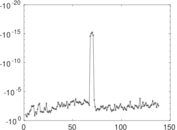
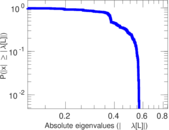
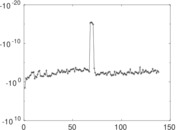
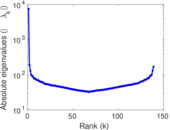
Plots
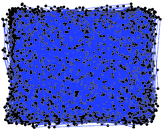


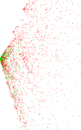

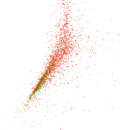


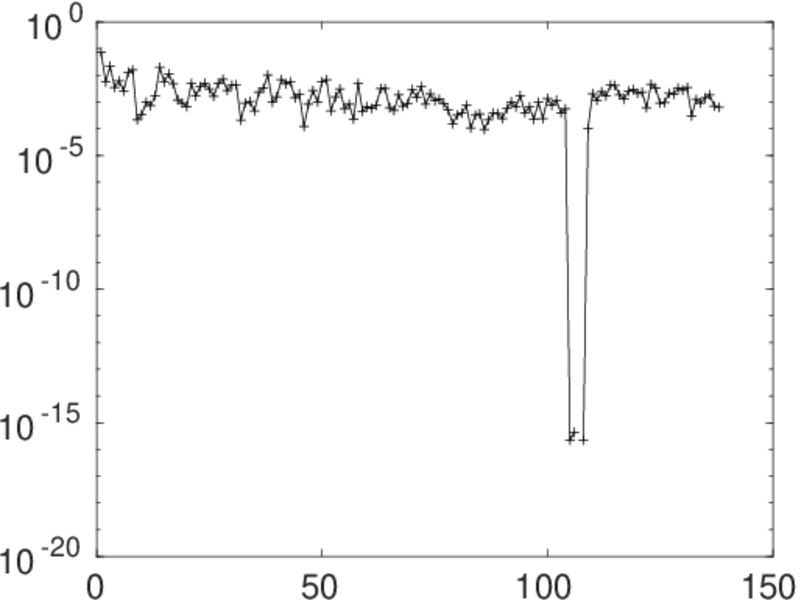
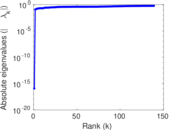
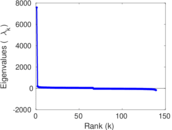
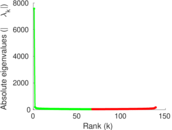
Matrix decompositions plots


Downloads
References
|
[1]
|
Jérôme Kunegis.
KONECT – The Koblenz Network Collection.
In Proc. Int. Conf. on World Wide Web Companion, pages
1343–1350, 2013.
[ http ]
|
|
[2]
|
Prosper Marketplace, Inc.
Prosper data export.
http://www.prosper.com/tools/DataExport.aspx, October 2010.
v1.2.6.
|
 KONECT ‣ Networks ‣
Buy Me a Coffee
KONECT ‣ Networks ‣
Buy Me a Coffee