Reactome
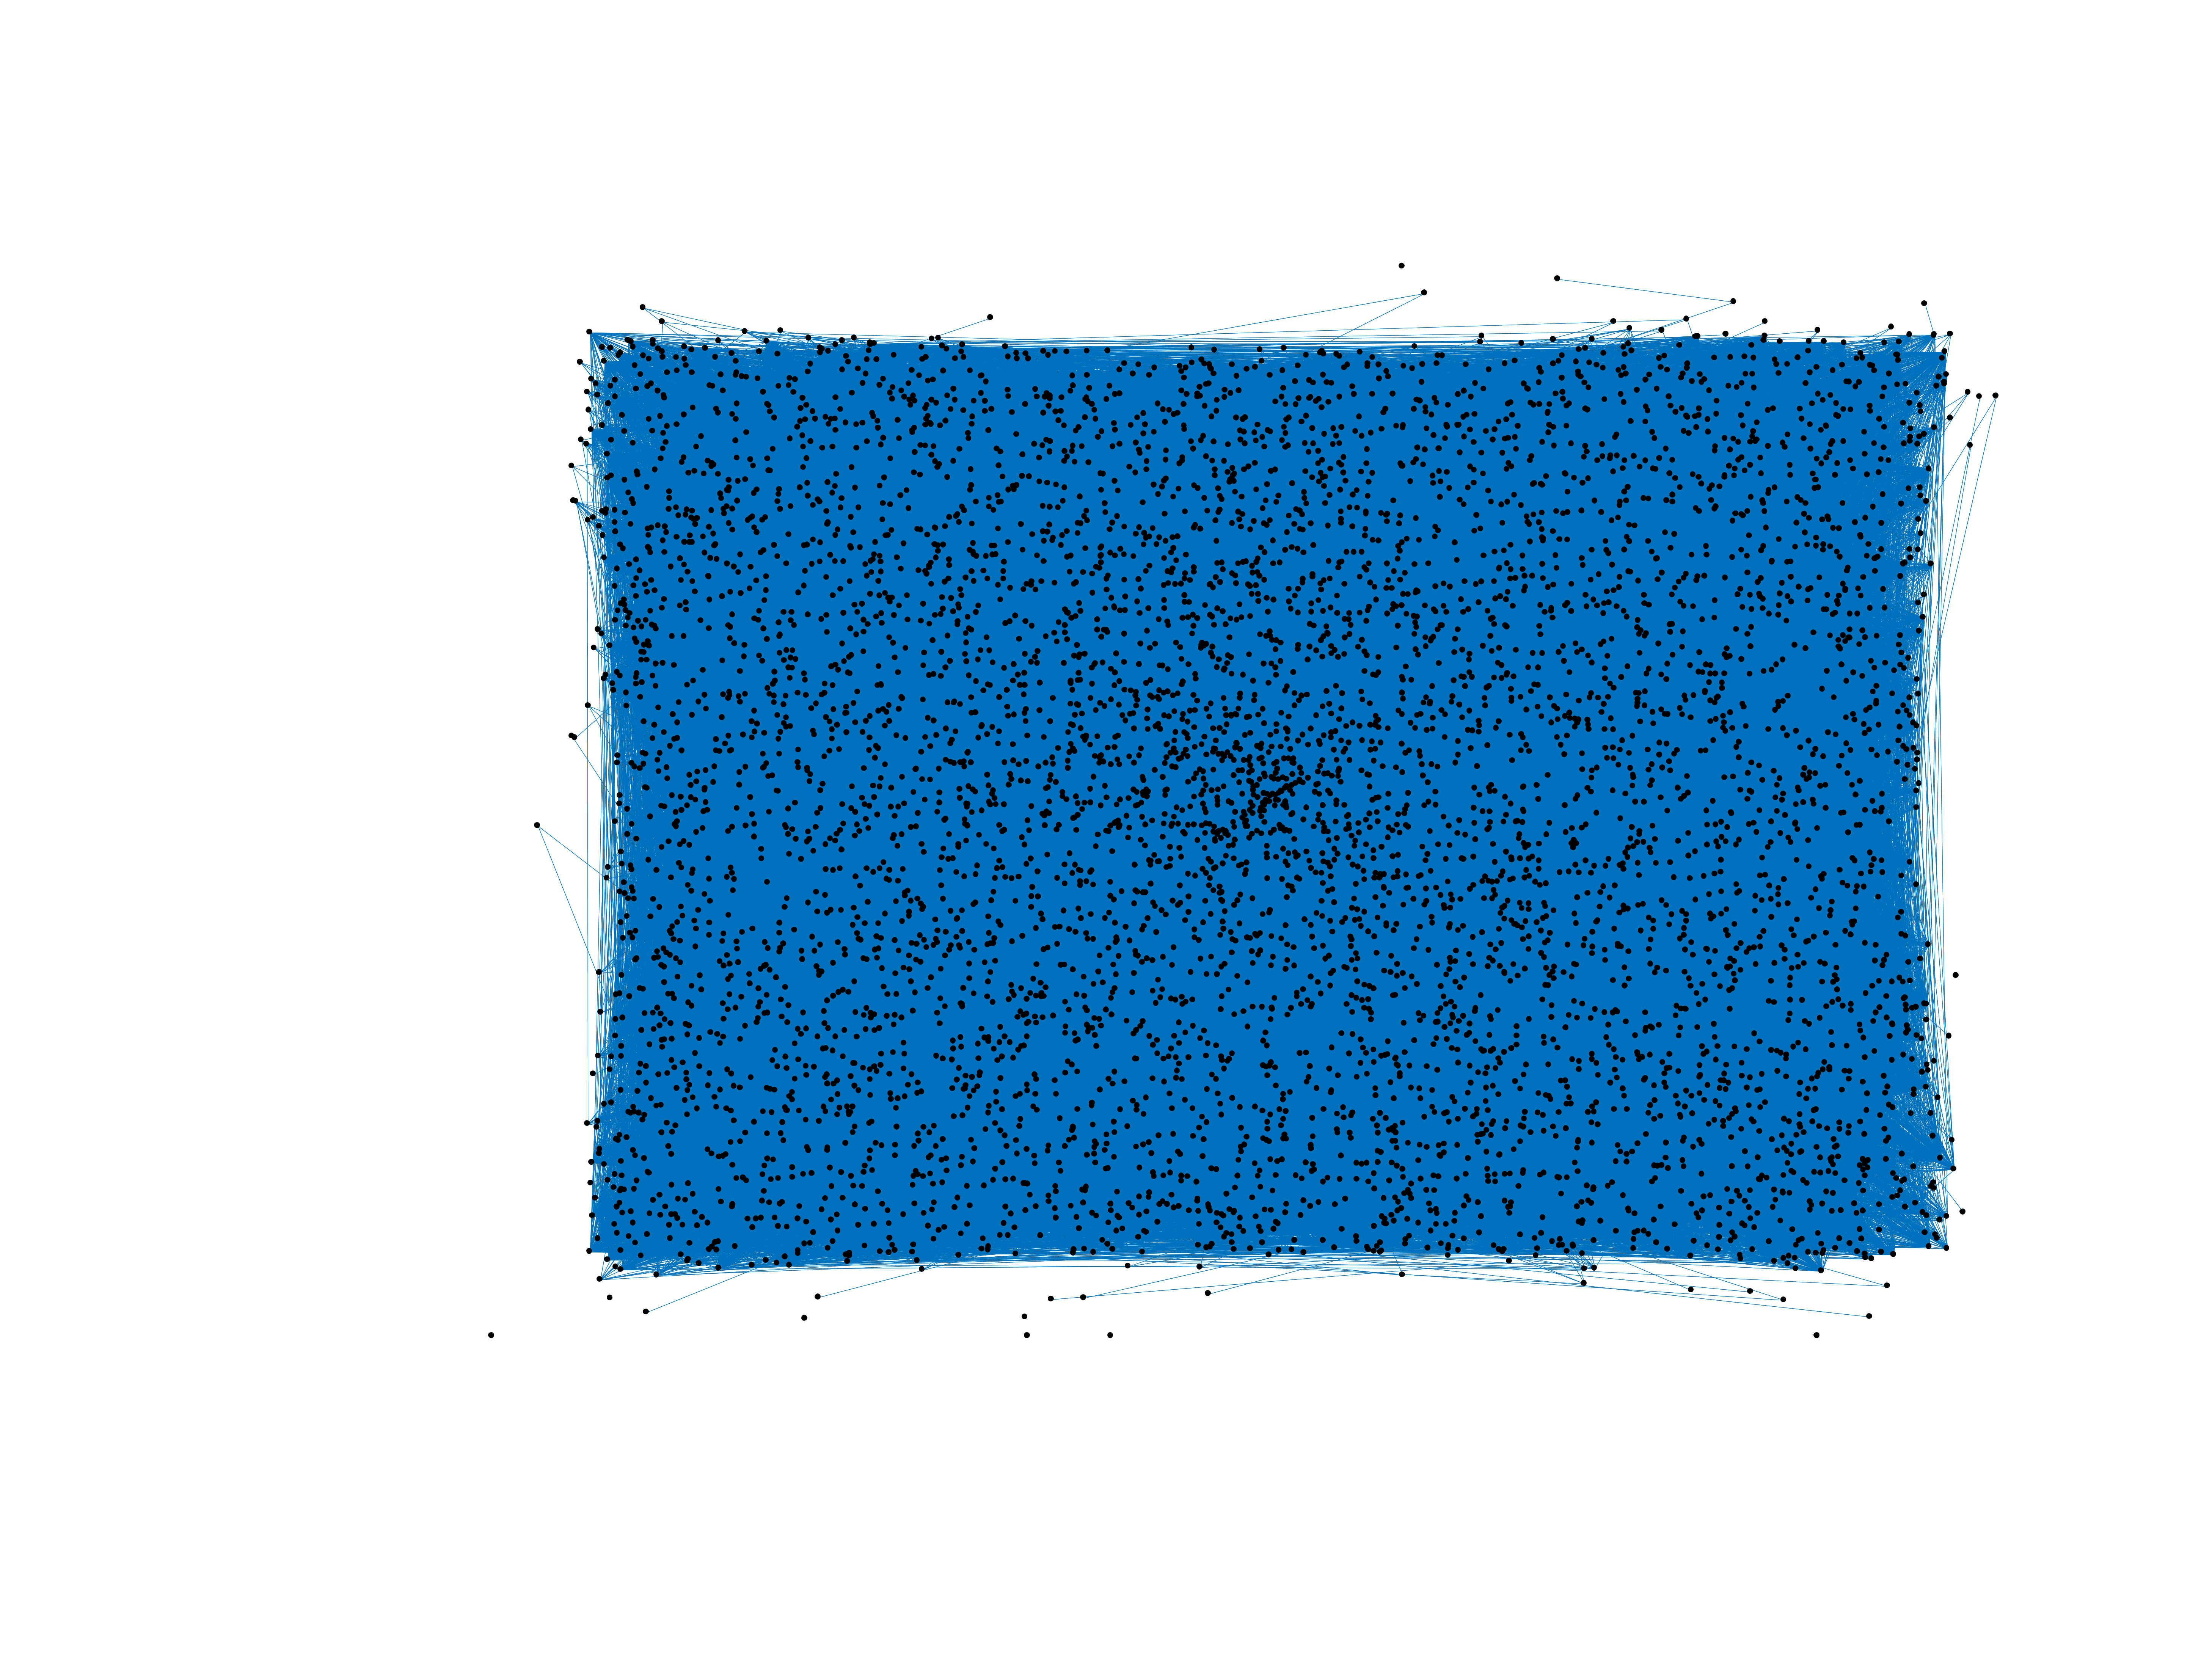
This is a network of protein–protein interactions in the species Homo
sapiens, i.e., in Humans. The data is curated by the Reactome project, an
open online database of biological pathways.
Metadata
Statistics
| Size | n = | 6,327
|
| Volume | m = | 147,547
|
| Loop count | l = | 1,387
|
| Wedge count | s = | 20,746,788
|
| Claw count | z = | 1,500,721,941
|
| Cross count | x = | 114,486,893,851
|
| Triangle count | t = | 4,187,734
|
| Square count | q = | 521,539,475
|
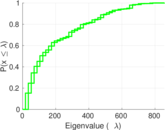
| 4-Tour count | T4 = | 4,255,595,272
|
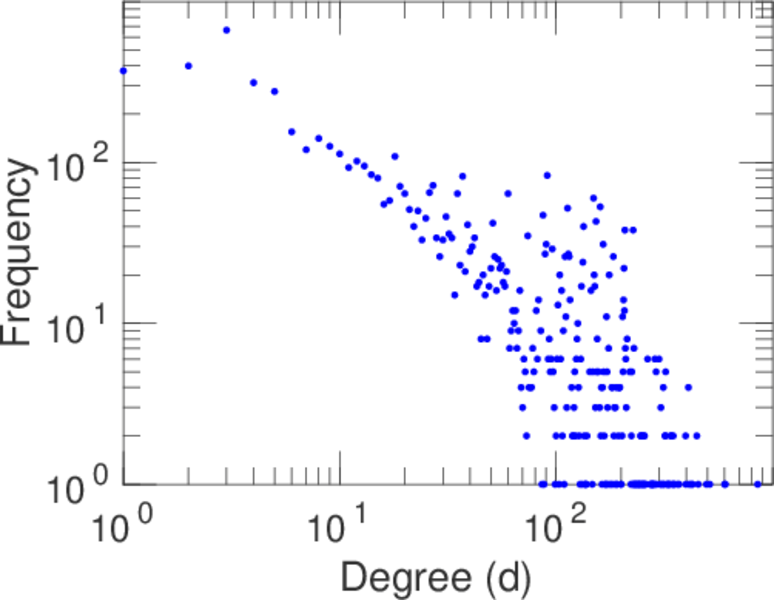
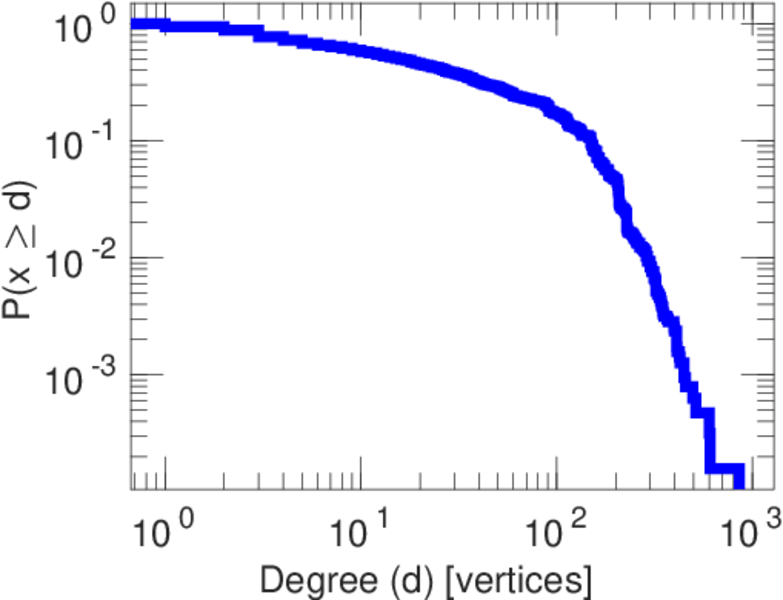
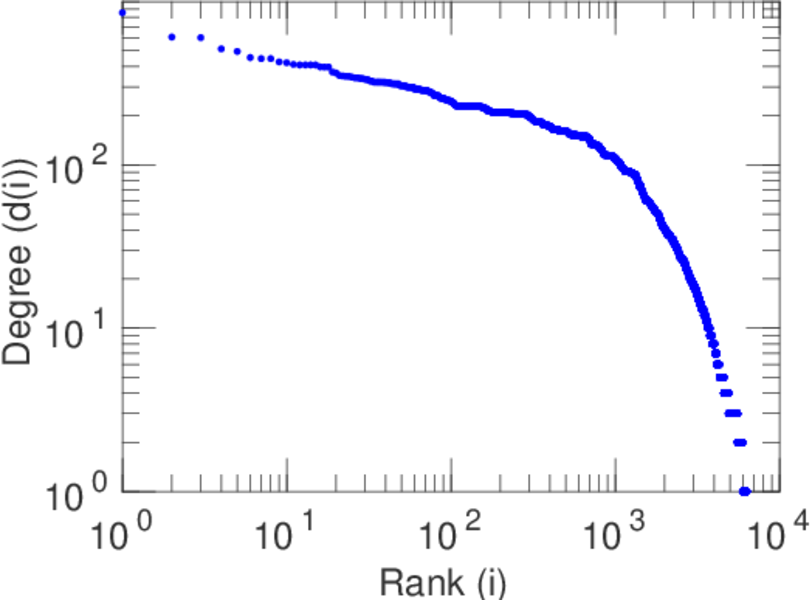
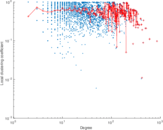
| Maximum degree | dmax = | 855
|
| Average degree | d = | 46.640 4
|
| Fill | p = | 0.007 370 49
|
| Size of LCC | N = | 5,973
|
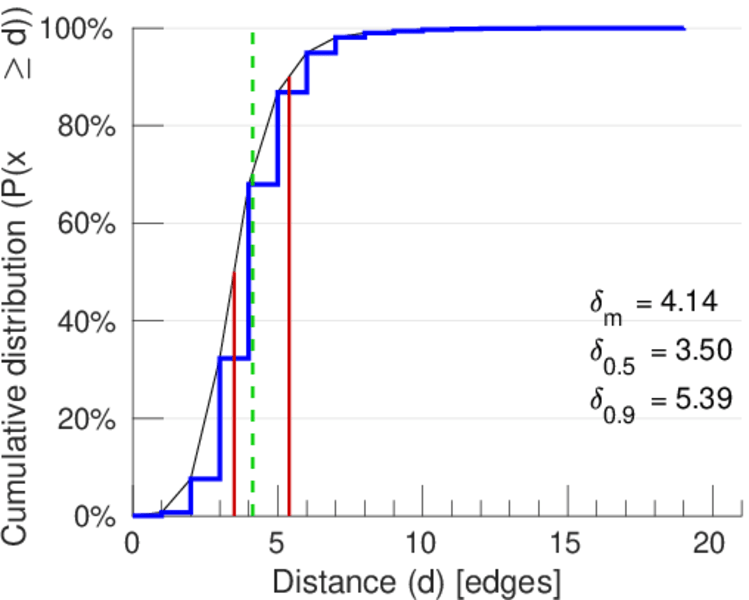
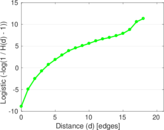
| Diameter | δ = | 24
|
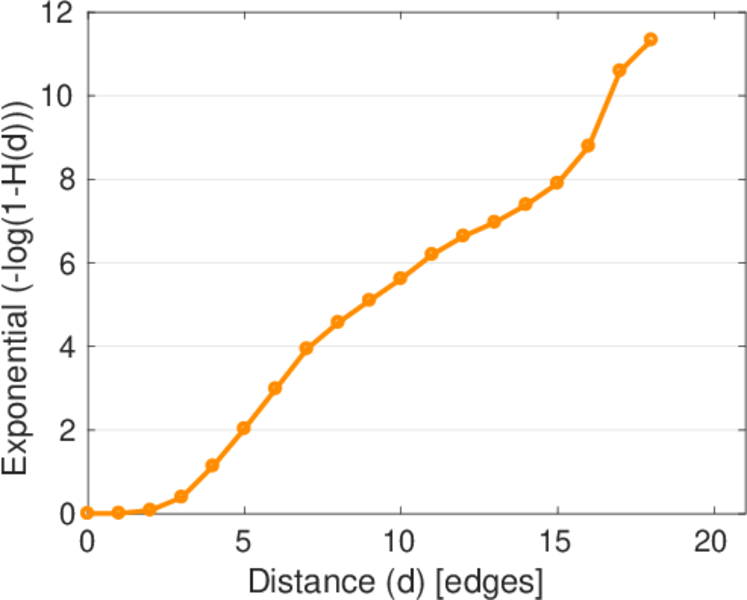
| 50-Percentile effective diameter | δ0.5 = | 3.497 02
|
| 90-Percentile effective diameter | δ0.9 = | 5.390 42
|
| Median distance | δM = | 4
|
| Mean distance | δm = | 4.142 04
|
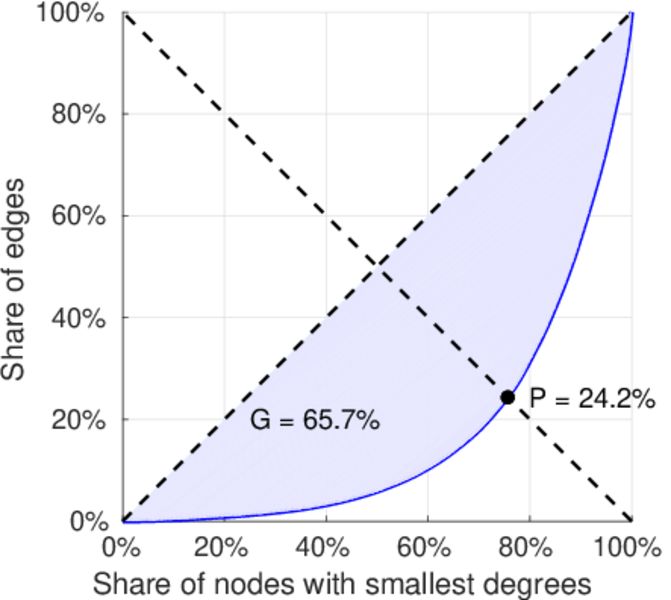
| Gini coefficient | G = | 0.656 737
|
| Balanced inequality ratio | P = | 0.241 852
|
| Relative edge distribution entropy | Her = | 0.911 682
|
| Power law exponent | γ = | 1.364 51
|
| Tail power law exponent | γt = | 1.741 00
|
| Tail power law exponent with p | γ3 = | 1.741 00
|
| p-value | p = | 0.000 00
|
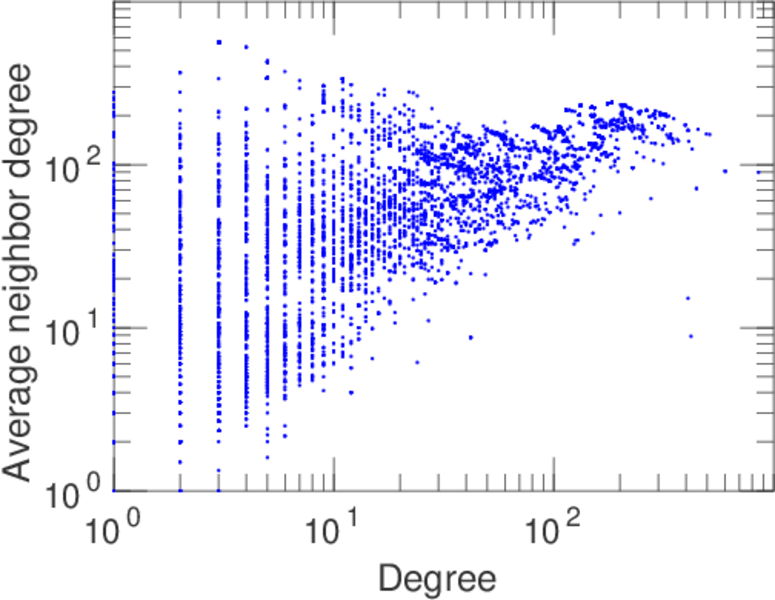
| Degree assortativity | ρ = | +0.244 874
|
| Degree assortativity p-value | pρ = | 0.000 00
|
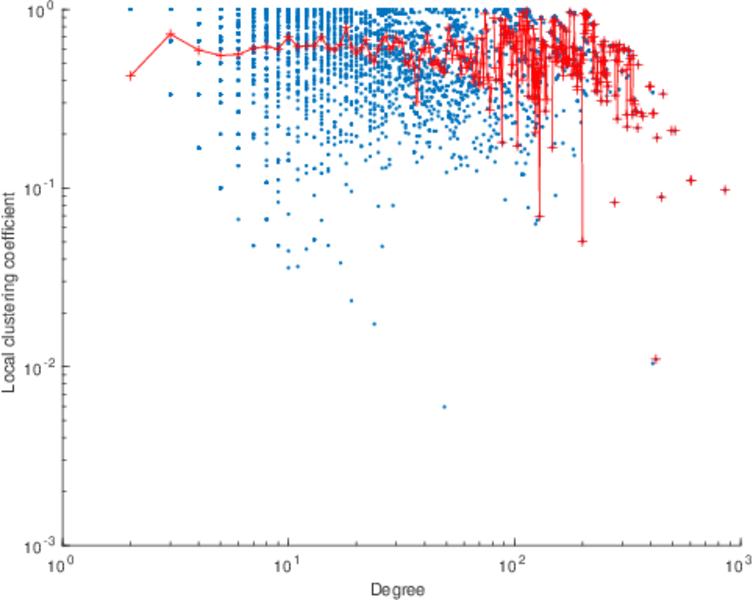
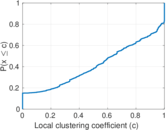
| Clustering coefficient | c = | 0.605 549
|
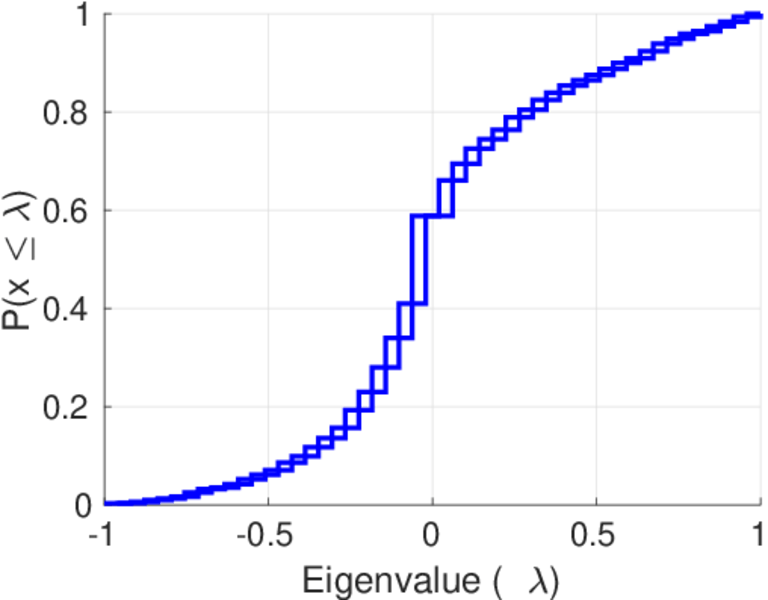
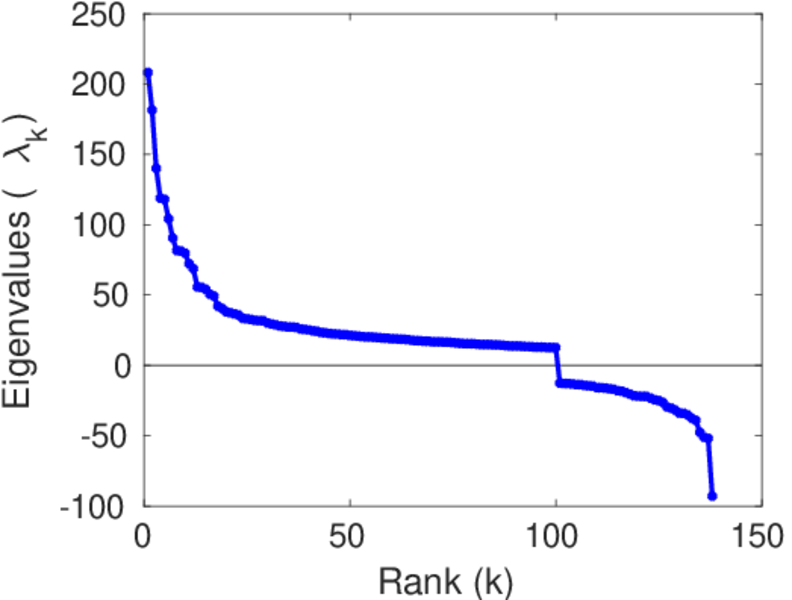
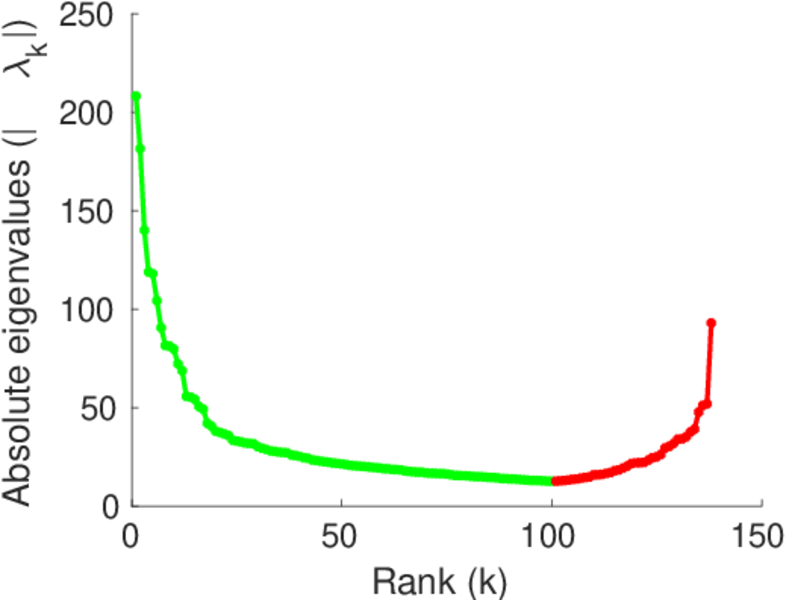
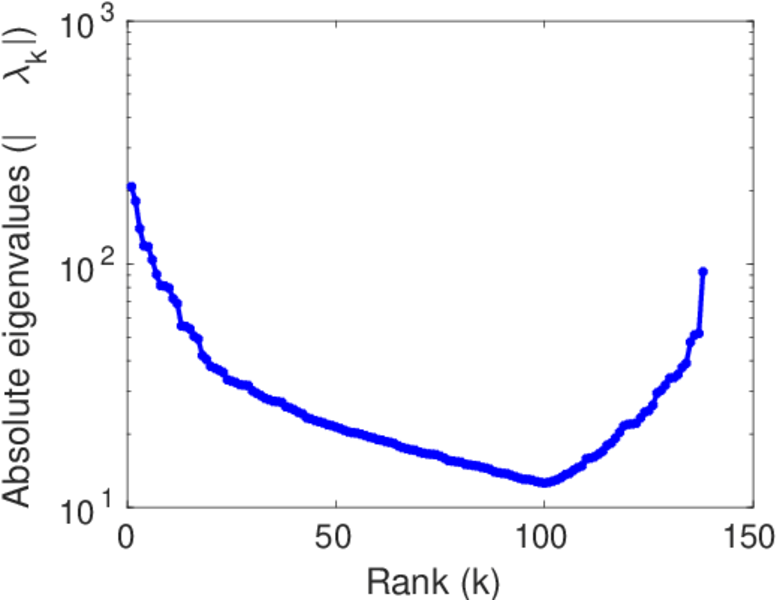
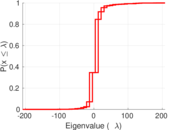
| Spectral norm | α = | 208.170
|
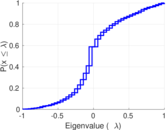
| Algebraic connectivity | a = | 0.013 403 5
|
| Spectral separation | |λ1[A] / λ2[A]| = | 1.147 27
|
| Non-bipartivity | bA = | 0.553 695
|
| Normalized non-bipartivity | bN = | 0.027 970 9
|
| Algebraic non-bipartivity | χ = | 0.086 155 4
|
| Spectral bipartite frustration | bK = | 0.000 437 614
|
| Controllability | C = | 783
|
| Relative controllability | Cr = | 0.123 755
|
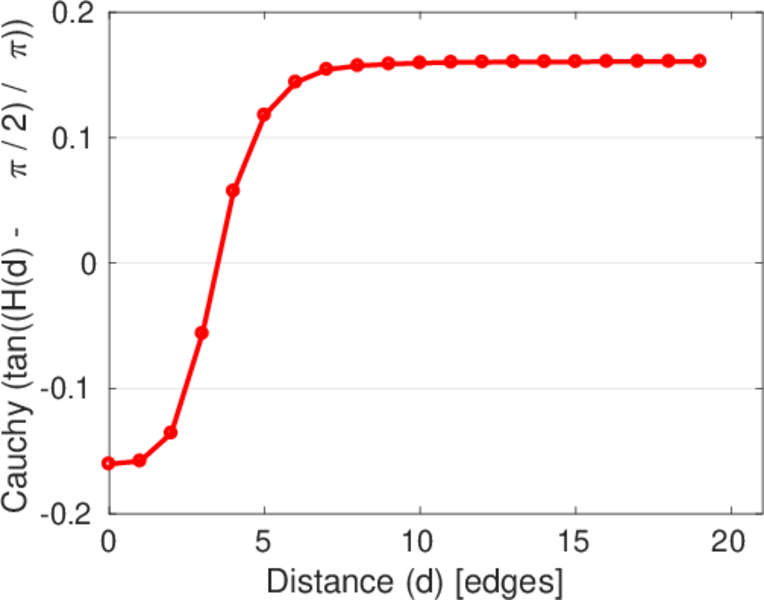
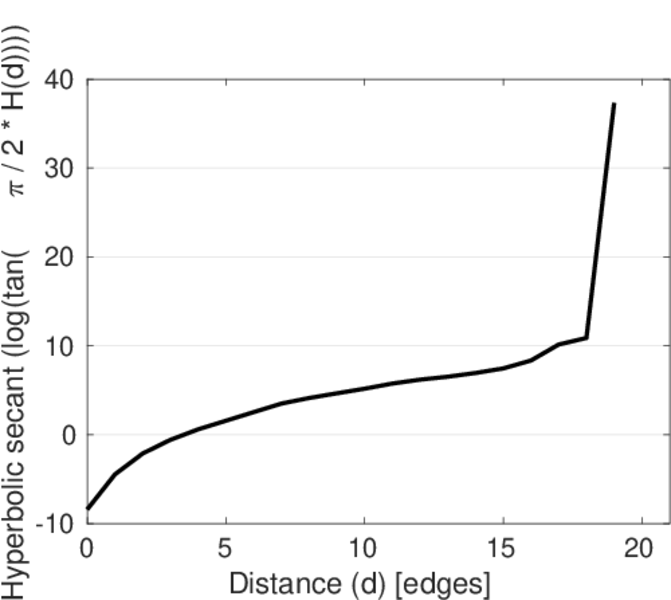
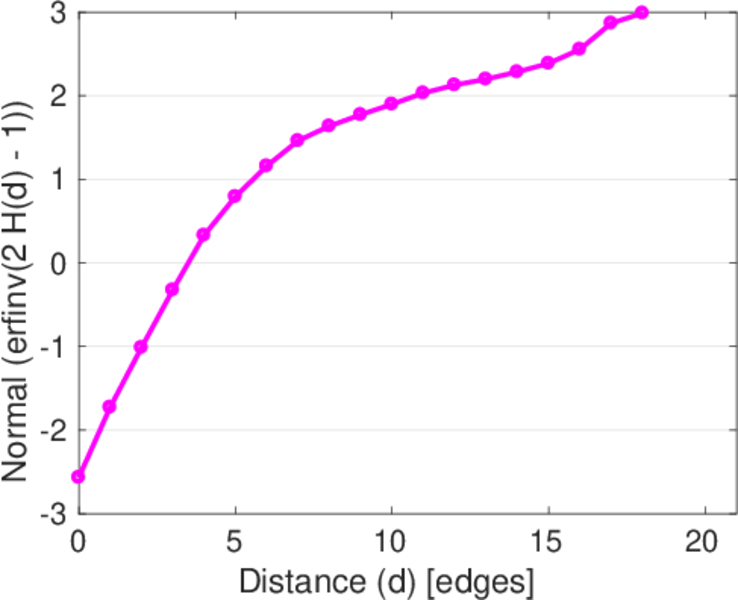
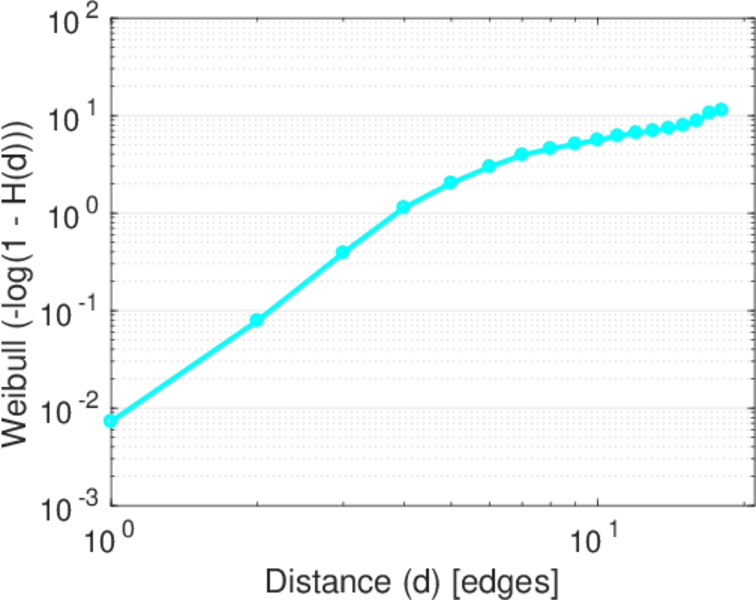
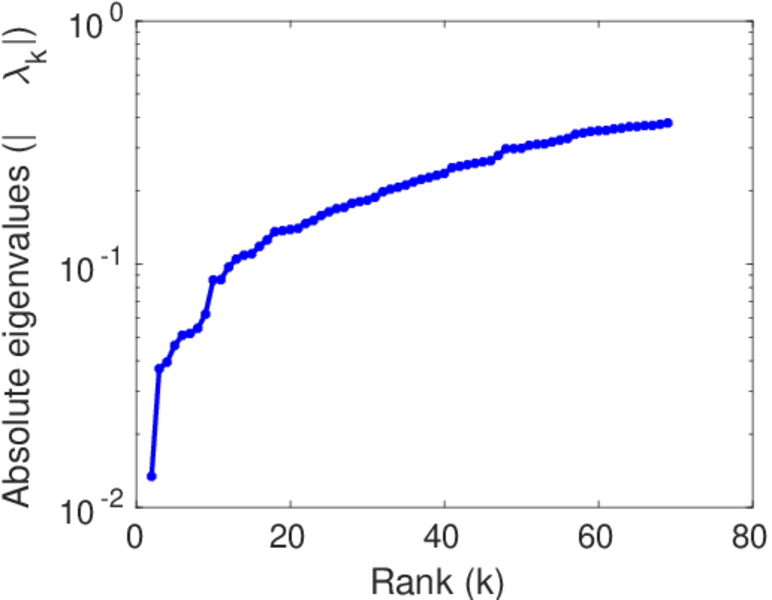
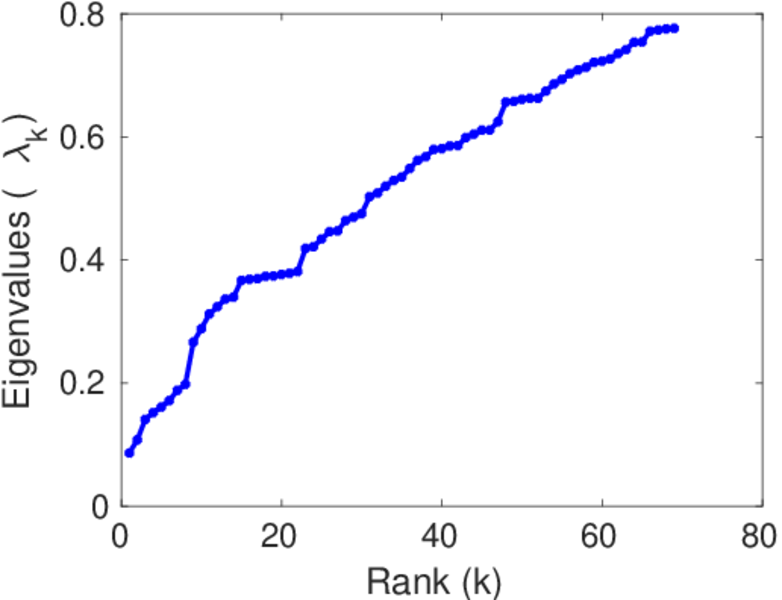
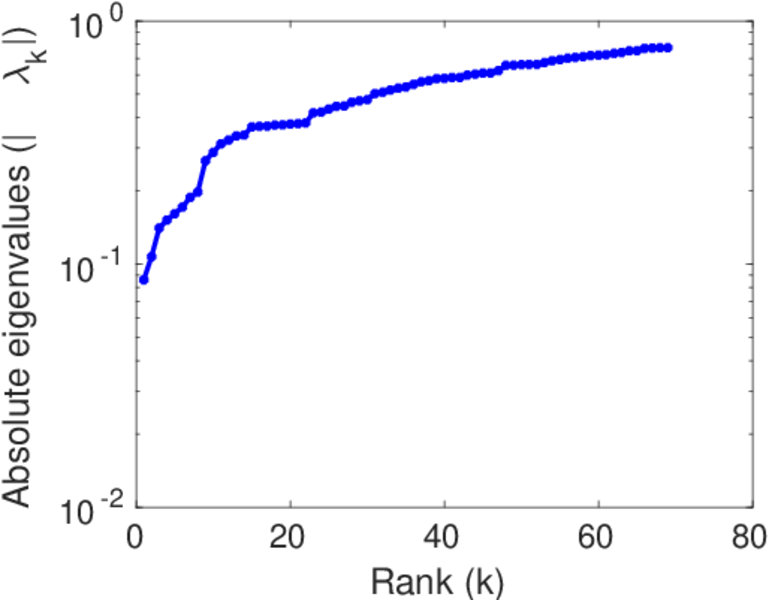
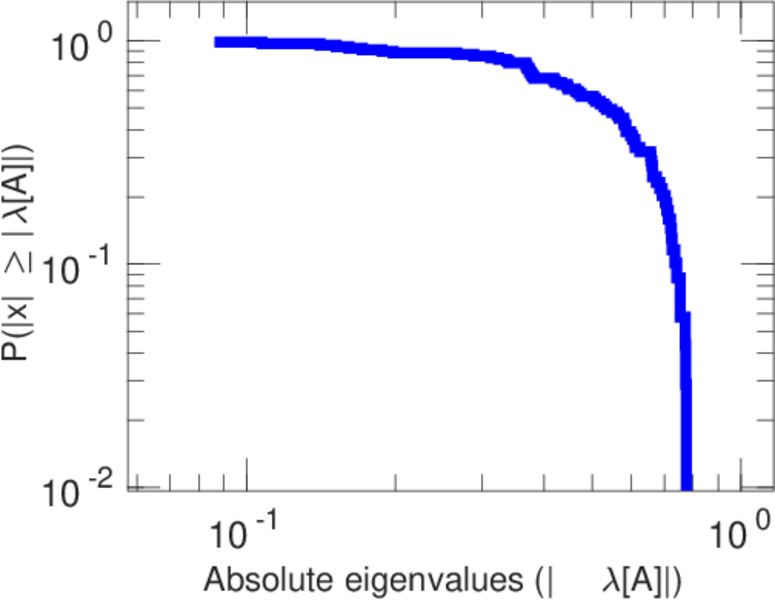
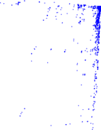
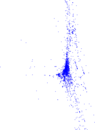
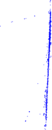
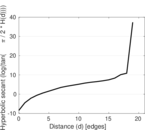
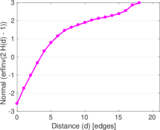
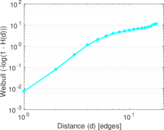
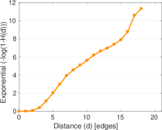
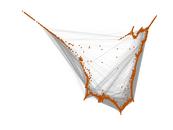
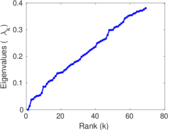
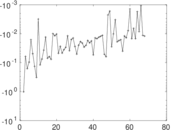
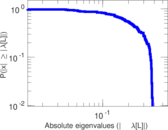
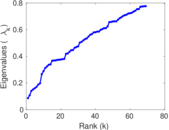
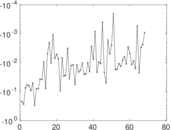
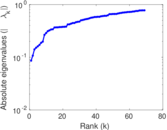
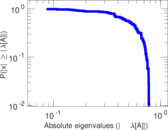
Plots


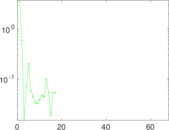
Matrix decompositions plots


Downloads
References
|
[1]
|
Jérôme Kunegis.
KONECT – The Koblenz Network Collection.
In Proc. Int. Conf. on World Wide Web Companion, pages
1343–1350, 2013.
[ http ]
|
|
[2]
|
Geeta Joshi-Topé, Marc Gillespie, Imre Vastrik, Peter D'Eustachio, Esther
Schmidt, Bernard de Bono, Bijay Jassal, Gopal Gopinath, Guanming Wu, Lisa
Matthews, Suzanna Lewis, Ewan Birney, and Lincoln Stein.
Reactome: A knowledgebase of biological pathways.
Nucleic Acids Res., 33(Database):D428–D432, 2005.
|
 KONECT ‣ Networks ‣
Buy Me a Coffee
KONECT ‣ Networks ‣
Buy Me a Coffee