California
This is the road network of the State of California in the United States of
America. The nodes of the network are the intersections between roads and road
endpoints, and the edges are road segments between intersections and road
endpoints. The network is undirected.
Metadata
Statistics
| Size | n = | 1,965,206
|
| Volume | m = | 2,766,607
|
| Loop count | l = | 0
|
| Wedge count | s = | 5,995,090
|
| Claw count | z = | 2,952,147
|
| Cross count | x = | 550,344
|
| Triangle count | t = | 120,676
|
| Square count | q = | 262,339
|
| 4-Tour count | T4 = | 31,612,286
|
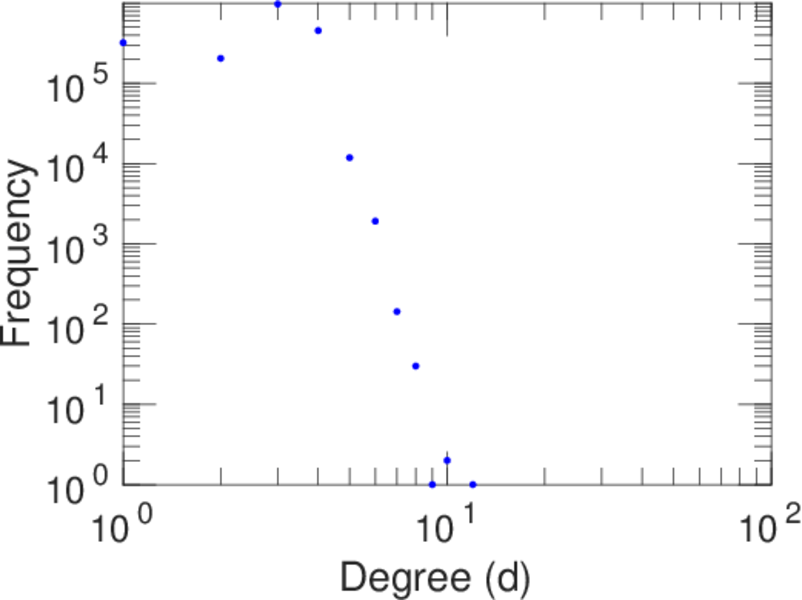
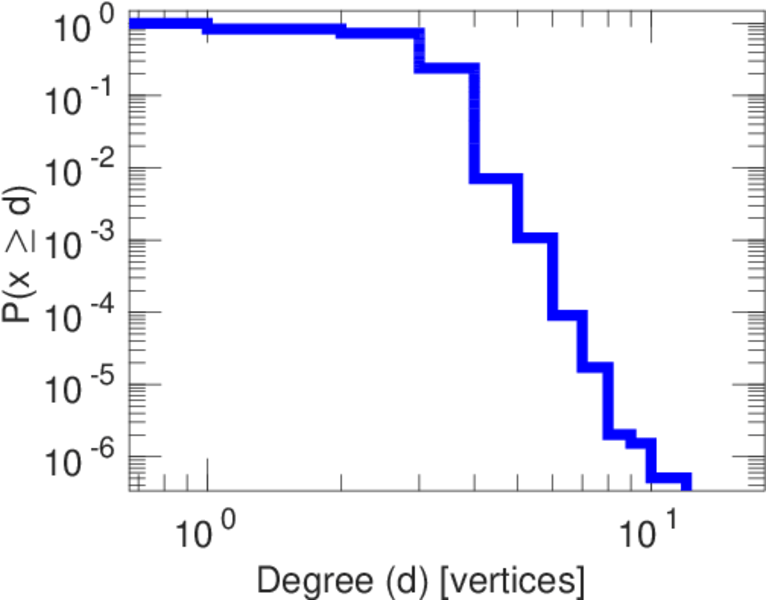
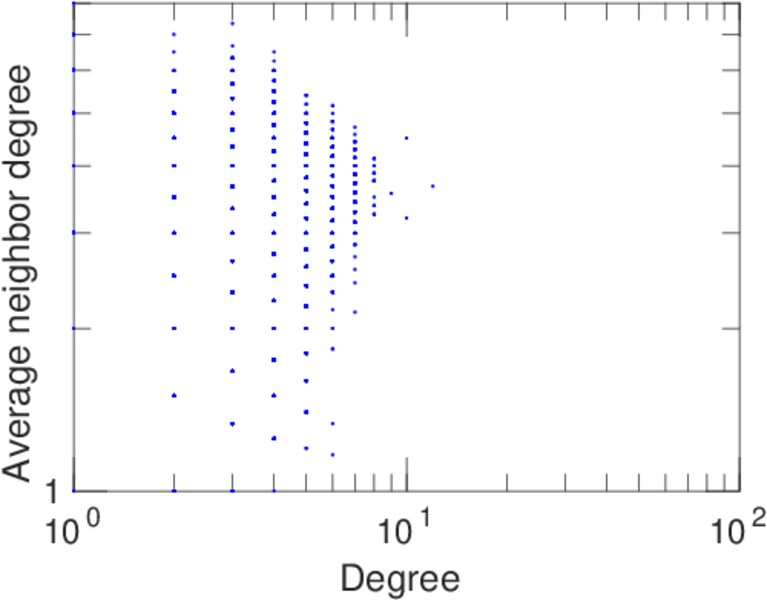
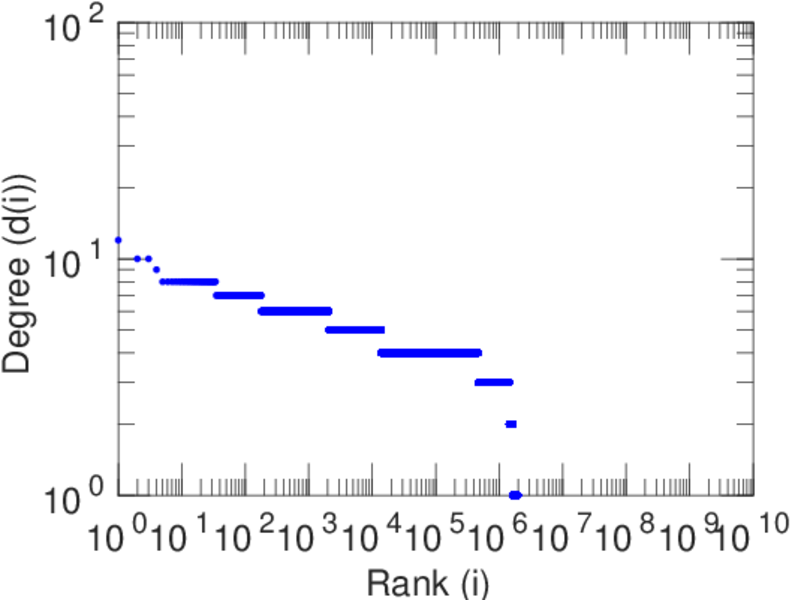
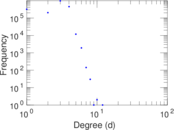
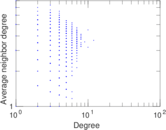
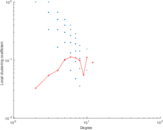
| Maximum degree | dmax = | 12
|
| Average degree | d = | 2.815 59
|
| Fill | p = | 1.432 72 × 10−6
|
| Size of LCC | N = | 1,957,027
|
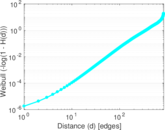
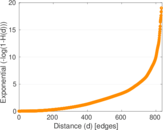
| Diameter | δ = | 865
|
| 50-Percentile effective diameter | δ0.5 = | 303.852
|
| 90-Percentile effective diameter | δ0.9 = | 511.075
|
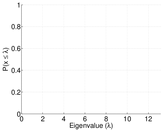
| Median distance | δM = | 304
|
| Mean distance | δm = | 315.889
|
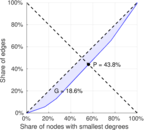
| Gini coefficient | G = | 0.185 512
|
| Balanced inequality ratio | P = | 0.438 309
|
| Relative edge distribution entropy | Her = | 0.995 082
|
| Power law exponent | γ = | 2.055 71
|
| Tail power law exponent | γt = | 8.991 00
|
| Tail power law exponent with p | γ3 = | 8.991 00
|
| p-value | p = | 0.000 00
|
| Degree assortativity | ρ = | +0.126 042
|
| Degree assortativity p-value | pρ = | 0.000 00
|
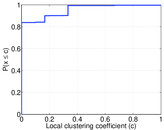
| Clustering coefficient | c = | 0.060 387 4
|
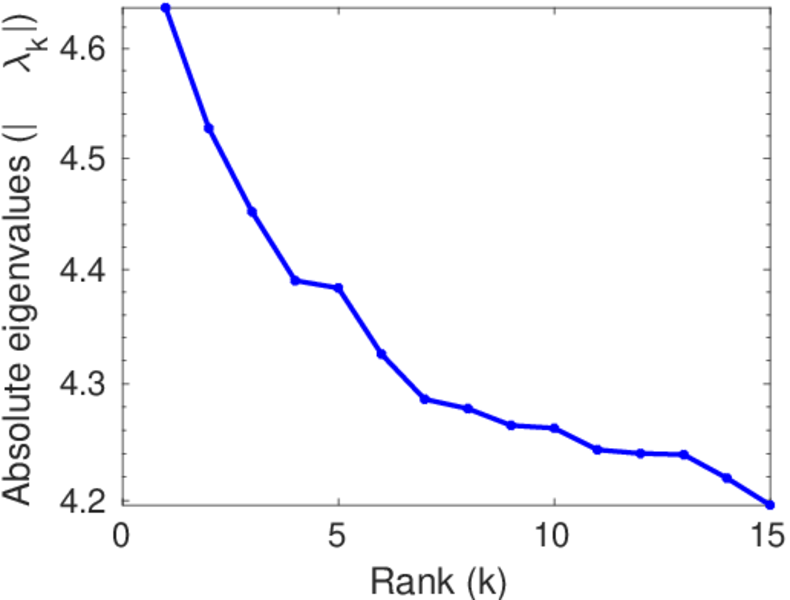
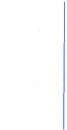
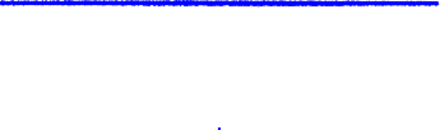
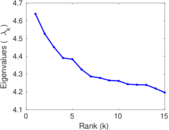
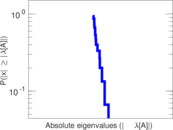
| Spectral norm | α = | 4.638 36
|
| Algebraic connectivity | a = | 5.646 78 × 10−7
|
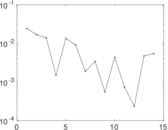
| Spectral separation | |λ1[A] / λ2[A]| = | 1.024 59
|
| Non-bipartivity | bA = | 0.152 274
|
| Normalized non-bipartivity | bN = | 0.000 418 791
|
| Algebraic non-bipartivity | χ = | 0.000 829 045
|
| Spectral bipartite frustration | bK = | 7.347 08 × 10−5
|
| Controllability | C = | 177,158
|
| Relative controllability | Cr = | 0.090 147 3
|
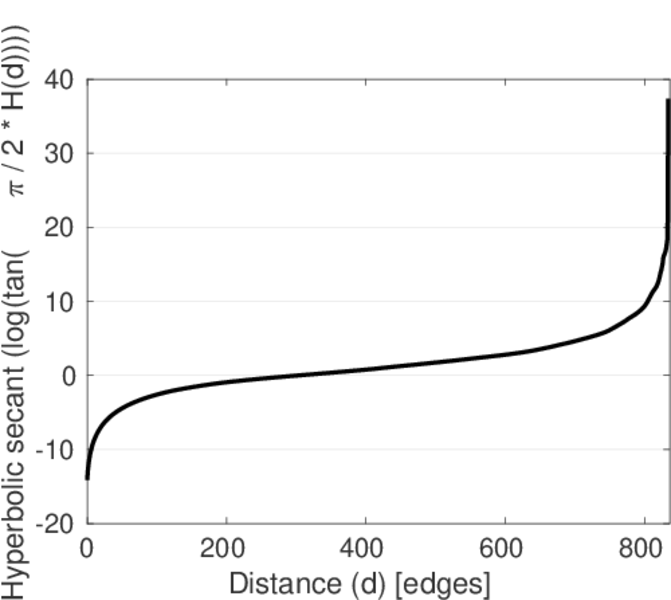
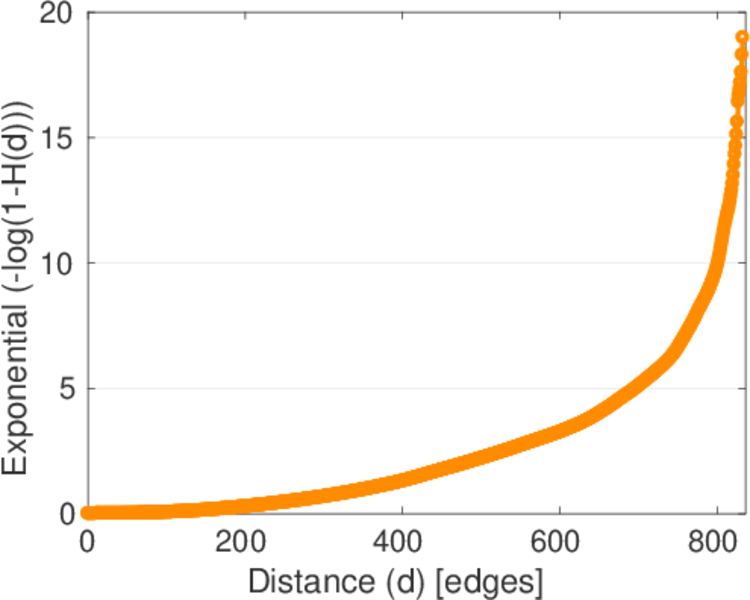
Plots


Matrix decompositions plots

Downloads
References
|
[1]
|
Jérôme Kunegis.
KONECT – The Koblenz Network Collection.
In Proc. Int. Conf. on World Wide Web Companion, pages
1343–1350, 2013.
[ http ]
|
|
[2]
|
Jure Leskovec, Kevin J. Lang, Anirban Dasgupta, and Michael W. Mahoney.
Statistical properties of community structure in large social and
information networks.
In Proc. Int. World Wide Web Conf., pages 695–704, 2008.
|
 KONECT ‣ Networks ‣
Buy Me a Coffee
KONECT ‣ Networks ‣
Buy Me a Coffee