Pennsylvania
This is the road network of Pennsylvania in the United States of America. The
nodes of the network are the intersections between roads and road endpoints,
and the edges are road segments between intersections and road endpoints. The
network is undirected.
Metadata
Statistics
| Size | n = | 1,088,092
|
| Volume | m = | 1,541,898
|
| Loop count | l = | 0
|
| Wedge count | s = | 3,390,667
|
| Claw count | z = | 1,707,904
|
| Cross count | x = | 328,820
|
| Triangle count | t = | 67,150
|
| Square count | q = | 157,802
|
| 4-Tour count | T4 = | 17,908,880
|
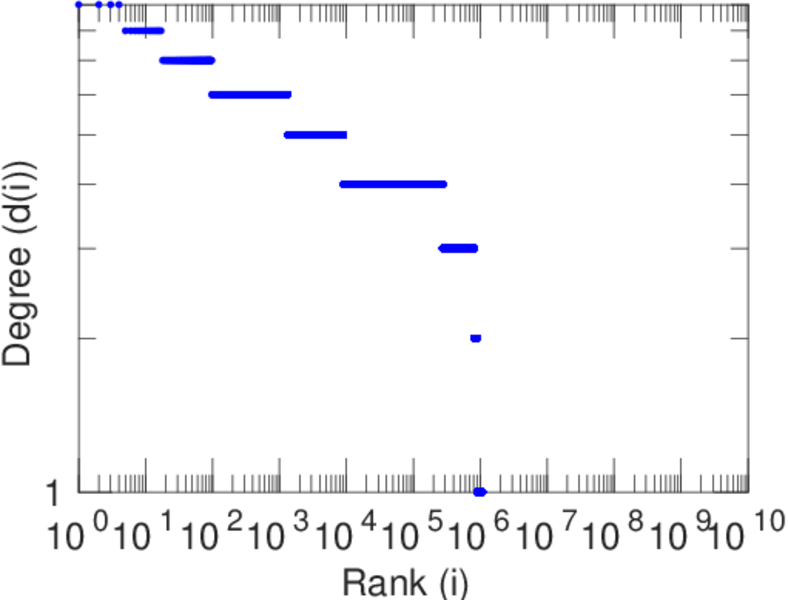
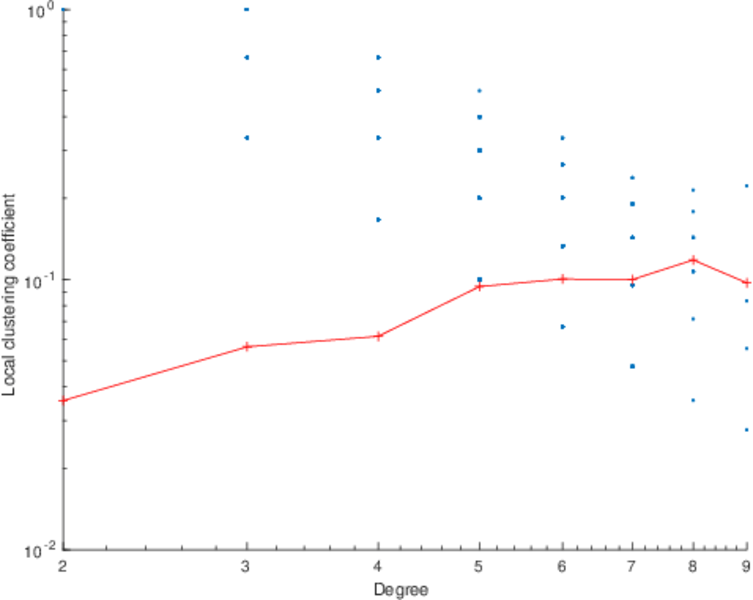
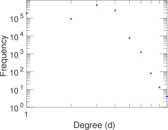
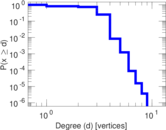
| Maximum degree | dmax = | 9
|
| Average degree | d = | 2.834 13
|
| Size of LCC | N = | 1,087,562
|
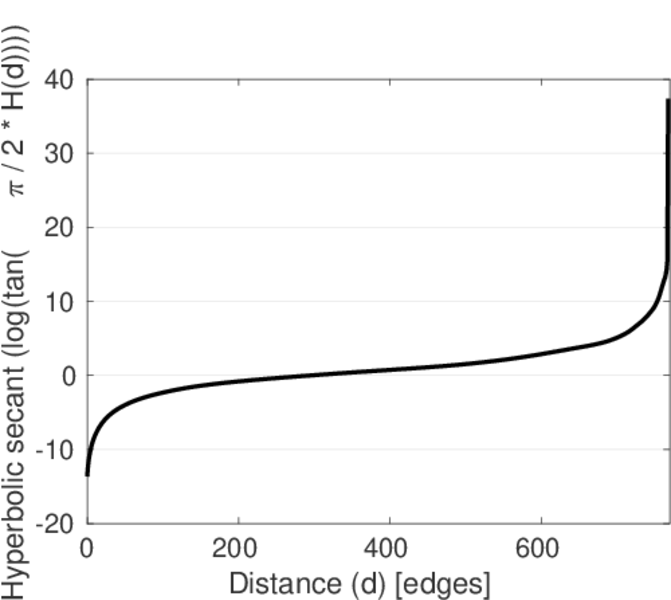
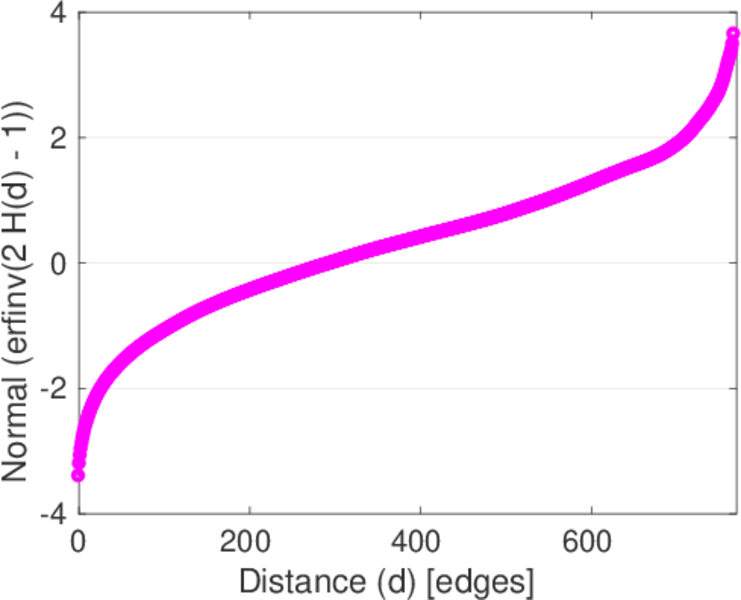
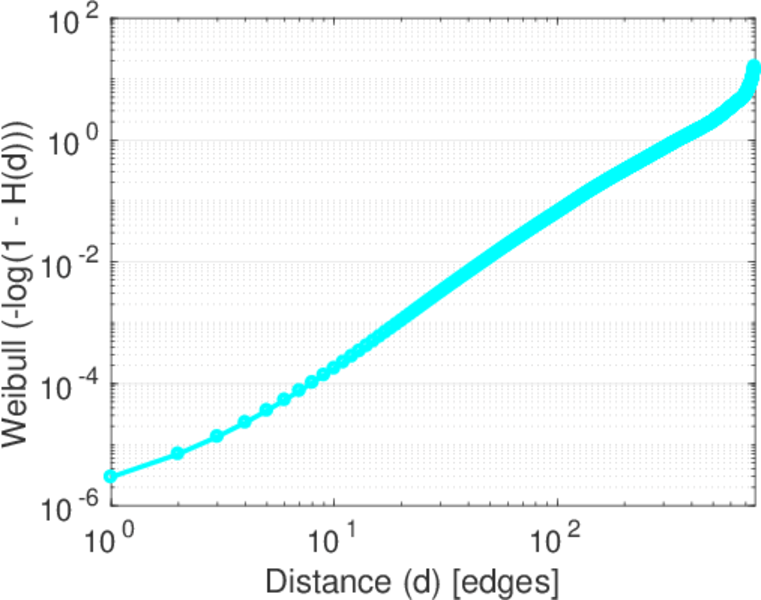
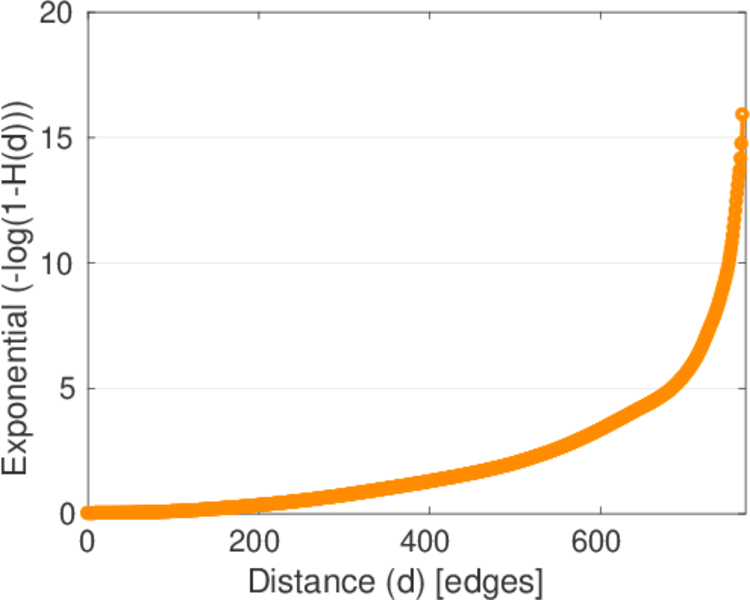
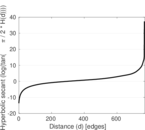
| Diameter | δ = | 794
|
| 50-Percentile effective diameter | δ0.5 = | 296.231
|
| 90-Percentile effective diameter | δ0.9 = | 528.609
|
| Median distance | δM = | 297
|
| Mean distance | δm = | 312.578
|
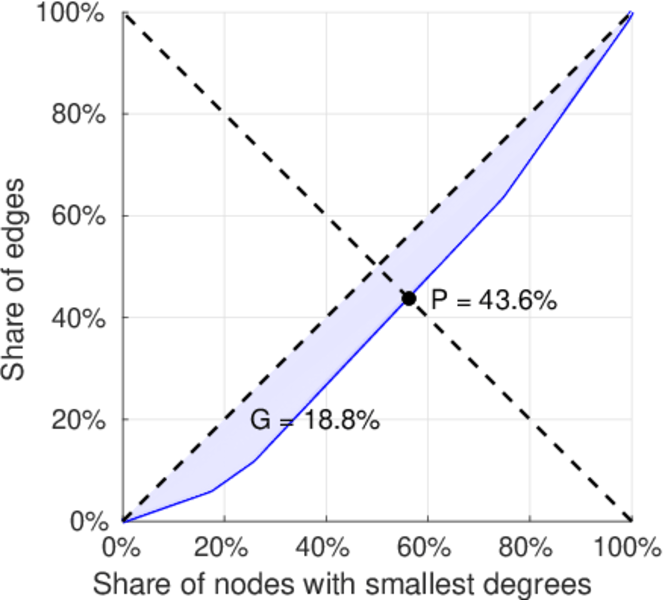
| Gini coefficient | G = | 0.188 029
|
| Balanced inequality ratio | P = | 0.435 923
|
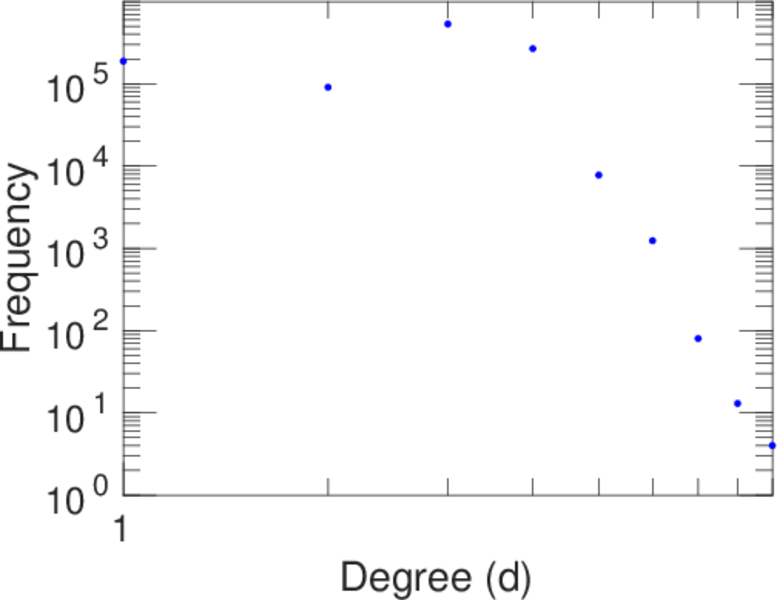
| Power law exponent | γ = | 2.052 82
|
| Tail power law exponent | γt = | 8.991 00
|
| Tail power law exponent with p | γ3 = | 8.991 00
|
| p-value | p = | 0.000 00
|
| Degree assortativity | ρ = | +0.122 749
|
| Degree assortativity p-value | pρ = | 0.000 00
|
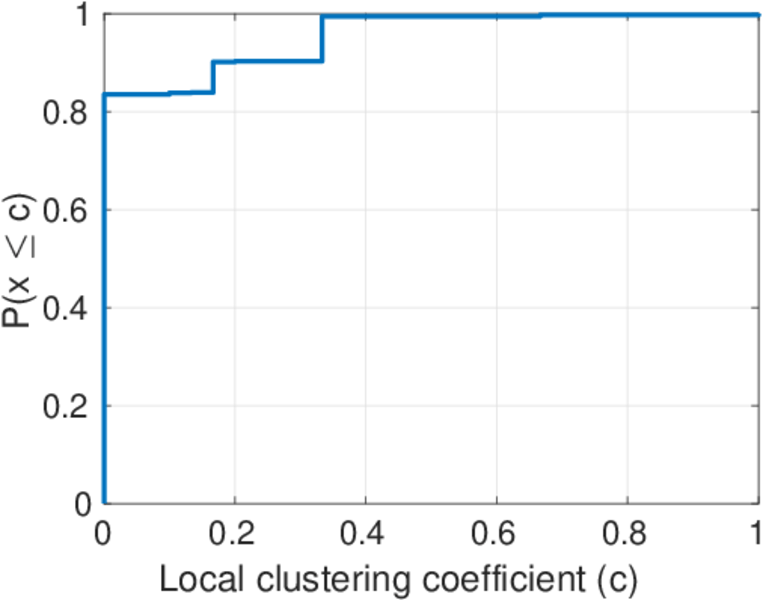
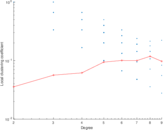
| Clustering coefficient | c = | 0.059 413 1
|
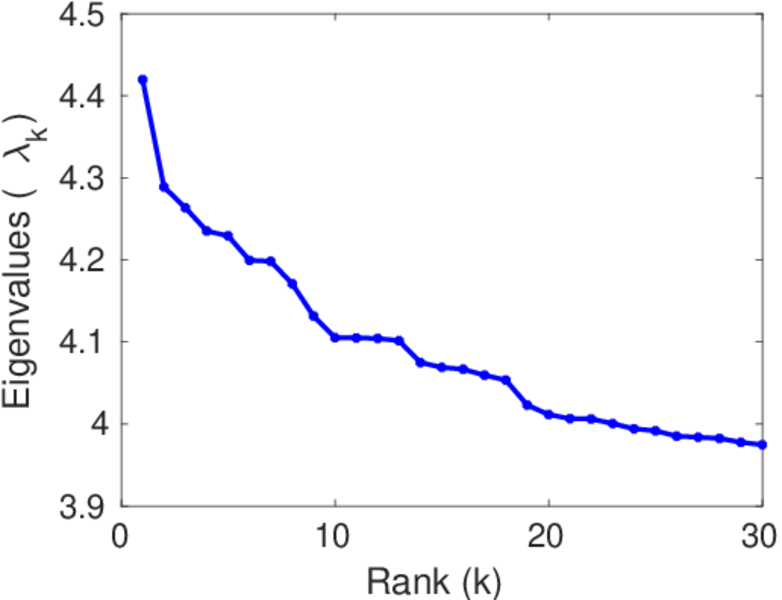
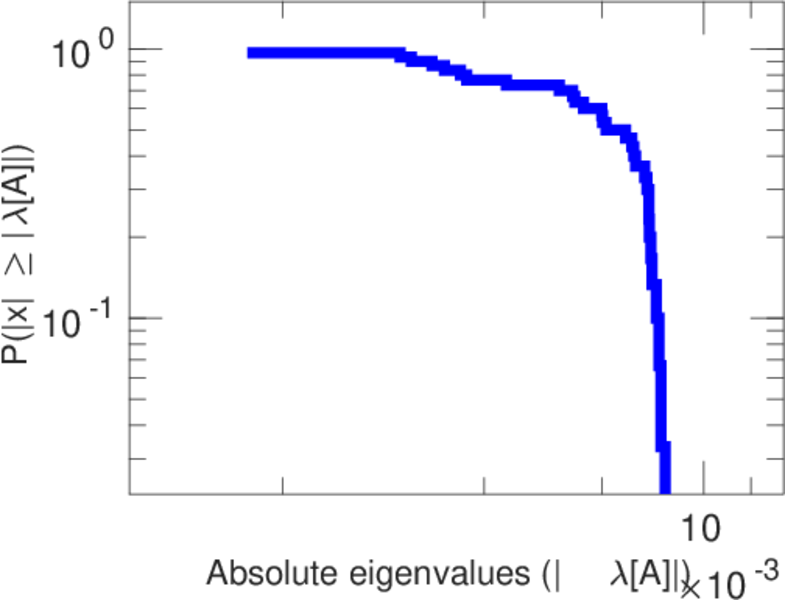
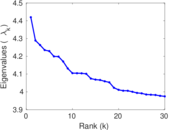
| Spectral norm | α = | 4.419 54
|
| Algebraic connectivity | a = | 1.708 84 × 10−6
|
| Spectral separation | |λ1[A] / λ2[A]| = | 1.030 50
|
| Non-bipartivity | bA = | 0.111 397
|
| Normalized non-bipartivity | bN = | 0.001 041 12
|
| Spectral bipartite frustration | bK = | 0.000 183 671
|
| Controllability | C = | 94,779
|
| Relative controllability | Cr = | 0.087 105 7
|
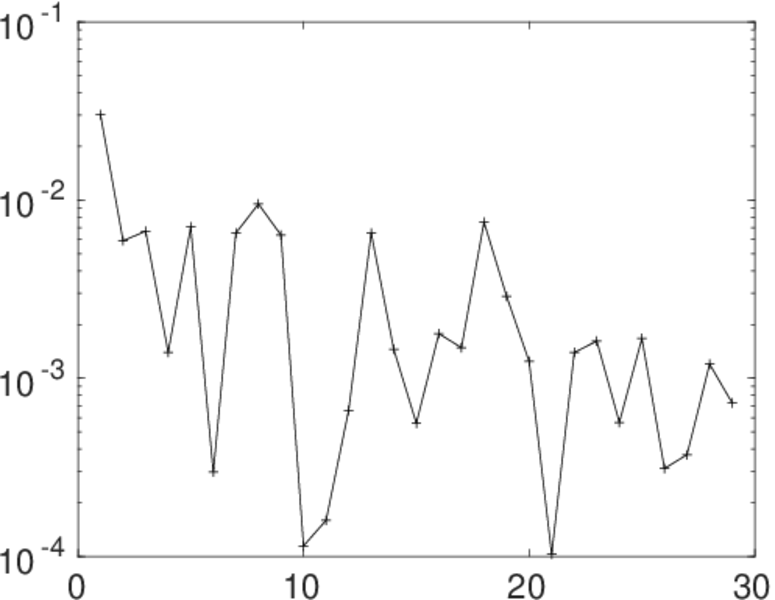
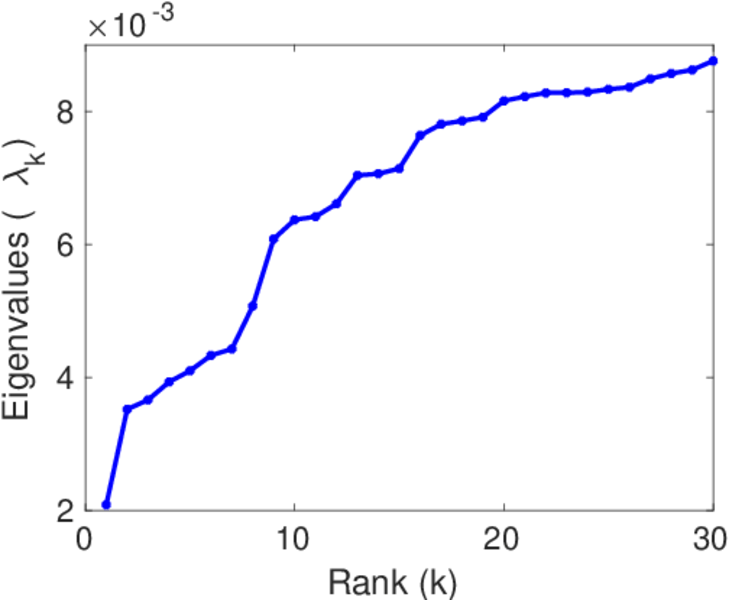
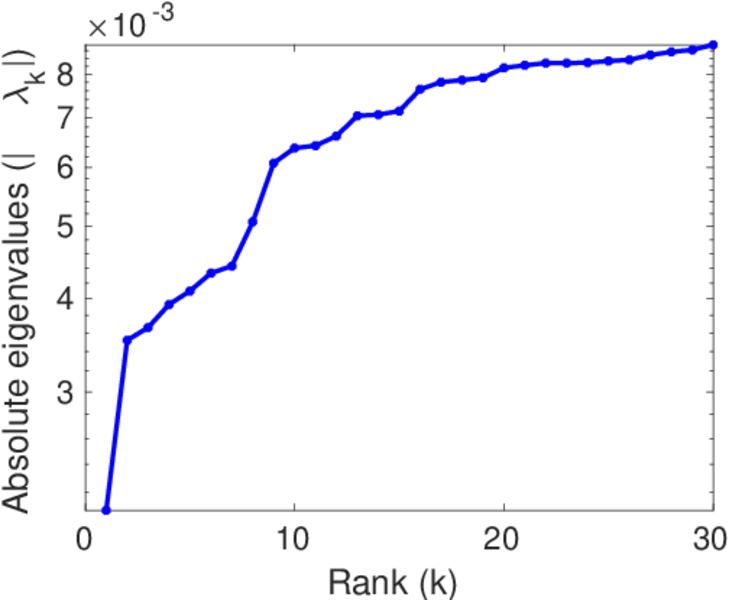
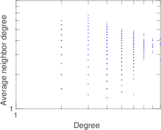
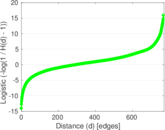
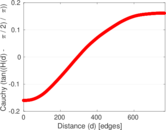
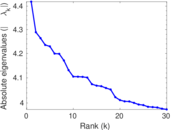
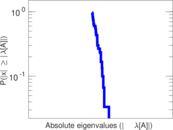
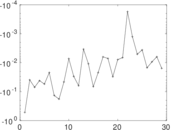
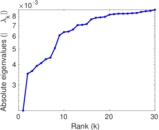
Plots


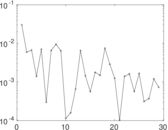
Matrix decompositions plots


Downloads
References
|
[1]
|
Jérôme Kunegis.
KONECT – The Koblenz Network Collection.
In Proc. Int. Conf. on World Wide Web Companion, pages
1343–1350, 2013.
[ http ]
|
|
[2]
|
Jure Leskovec, Kevin Lang, Anirban Dasgupta, and Michael W. Mahoney.
Community structure in large networks: Natural cluster sizes and the
absence of large well-defined clusters.
Internet Math., 6(1):29–123, 2009.
|
 KONECT ‣ Networks ‣
Buy Me a Coffee
KONECT ‣ Networks ‣
Buy Me a Coffee