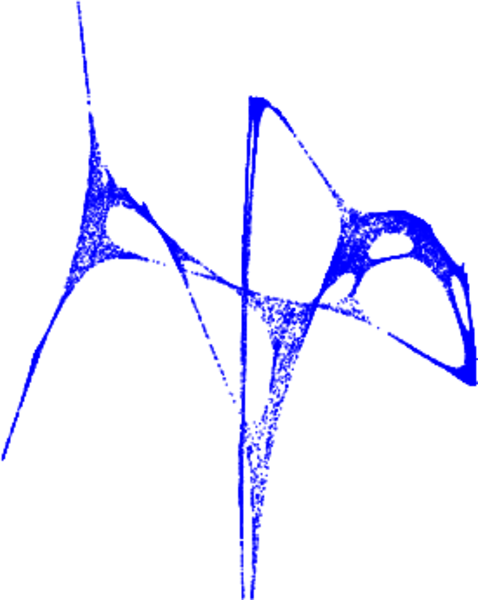
Texas
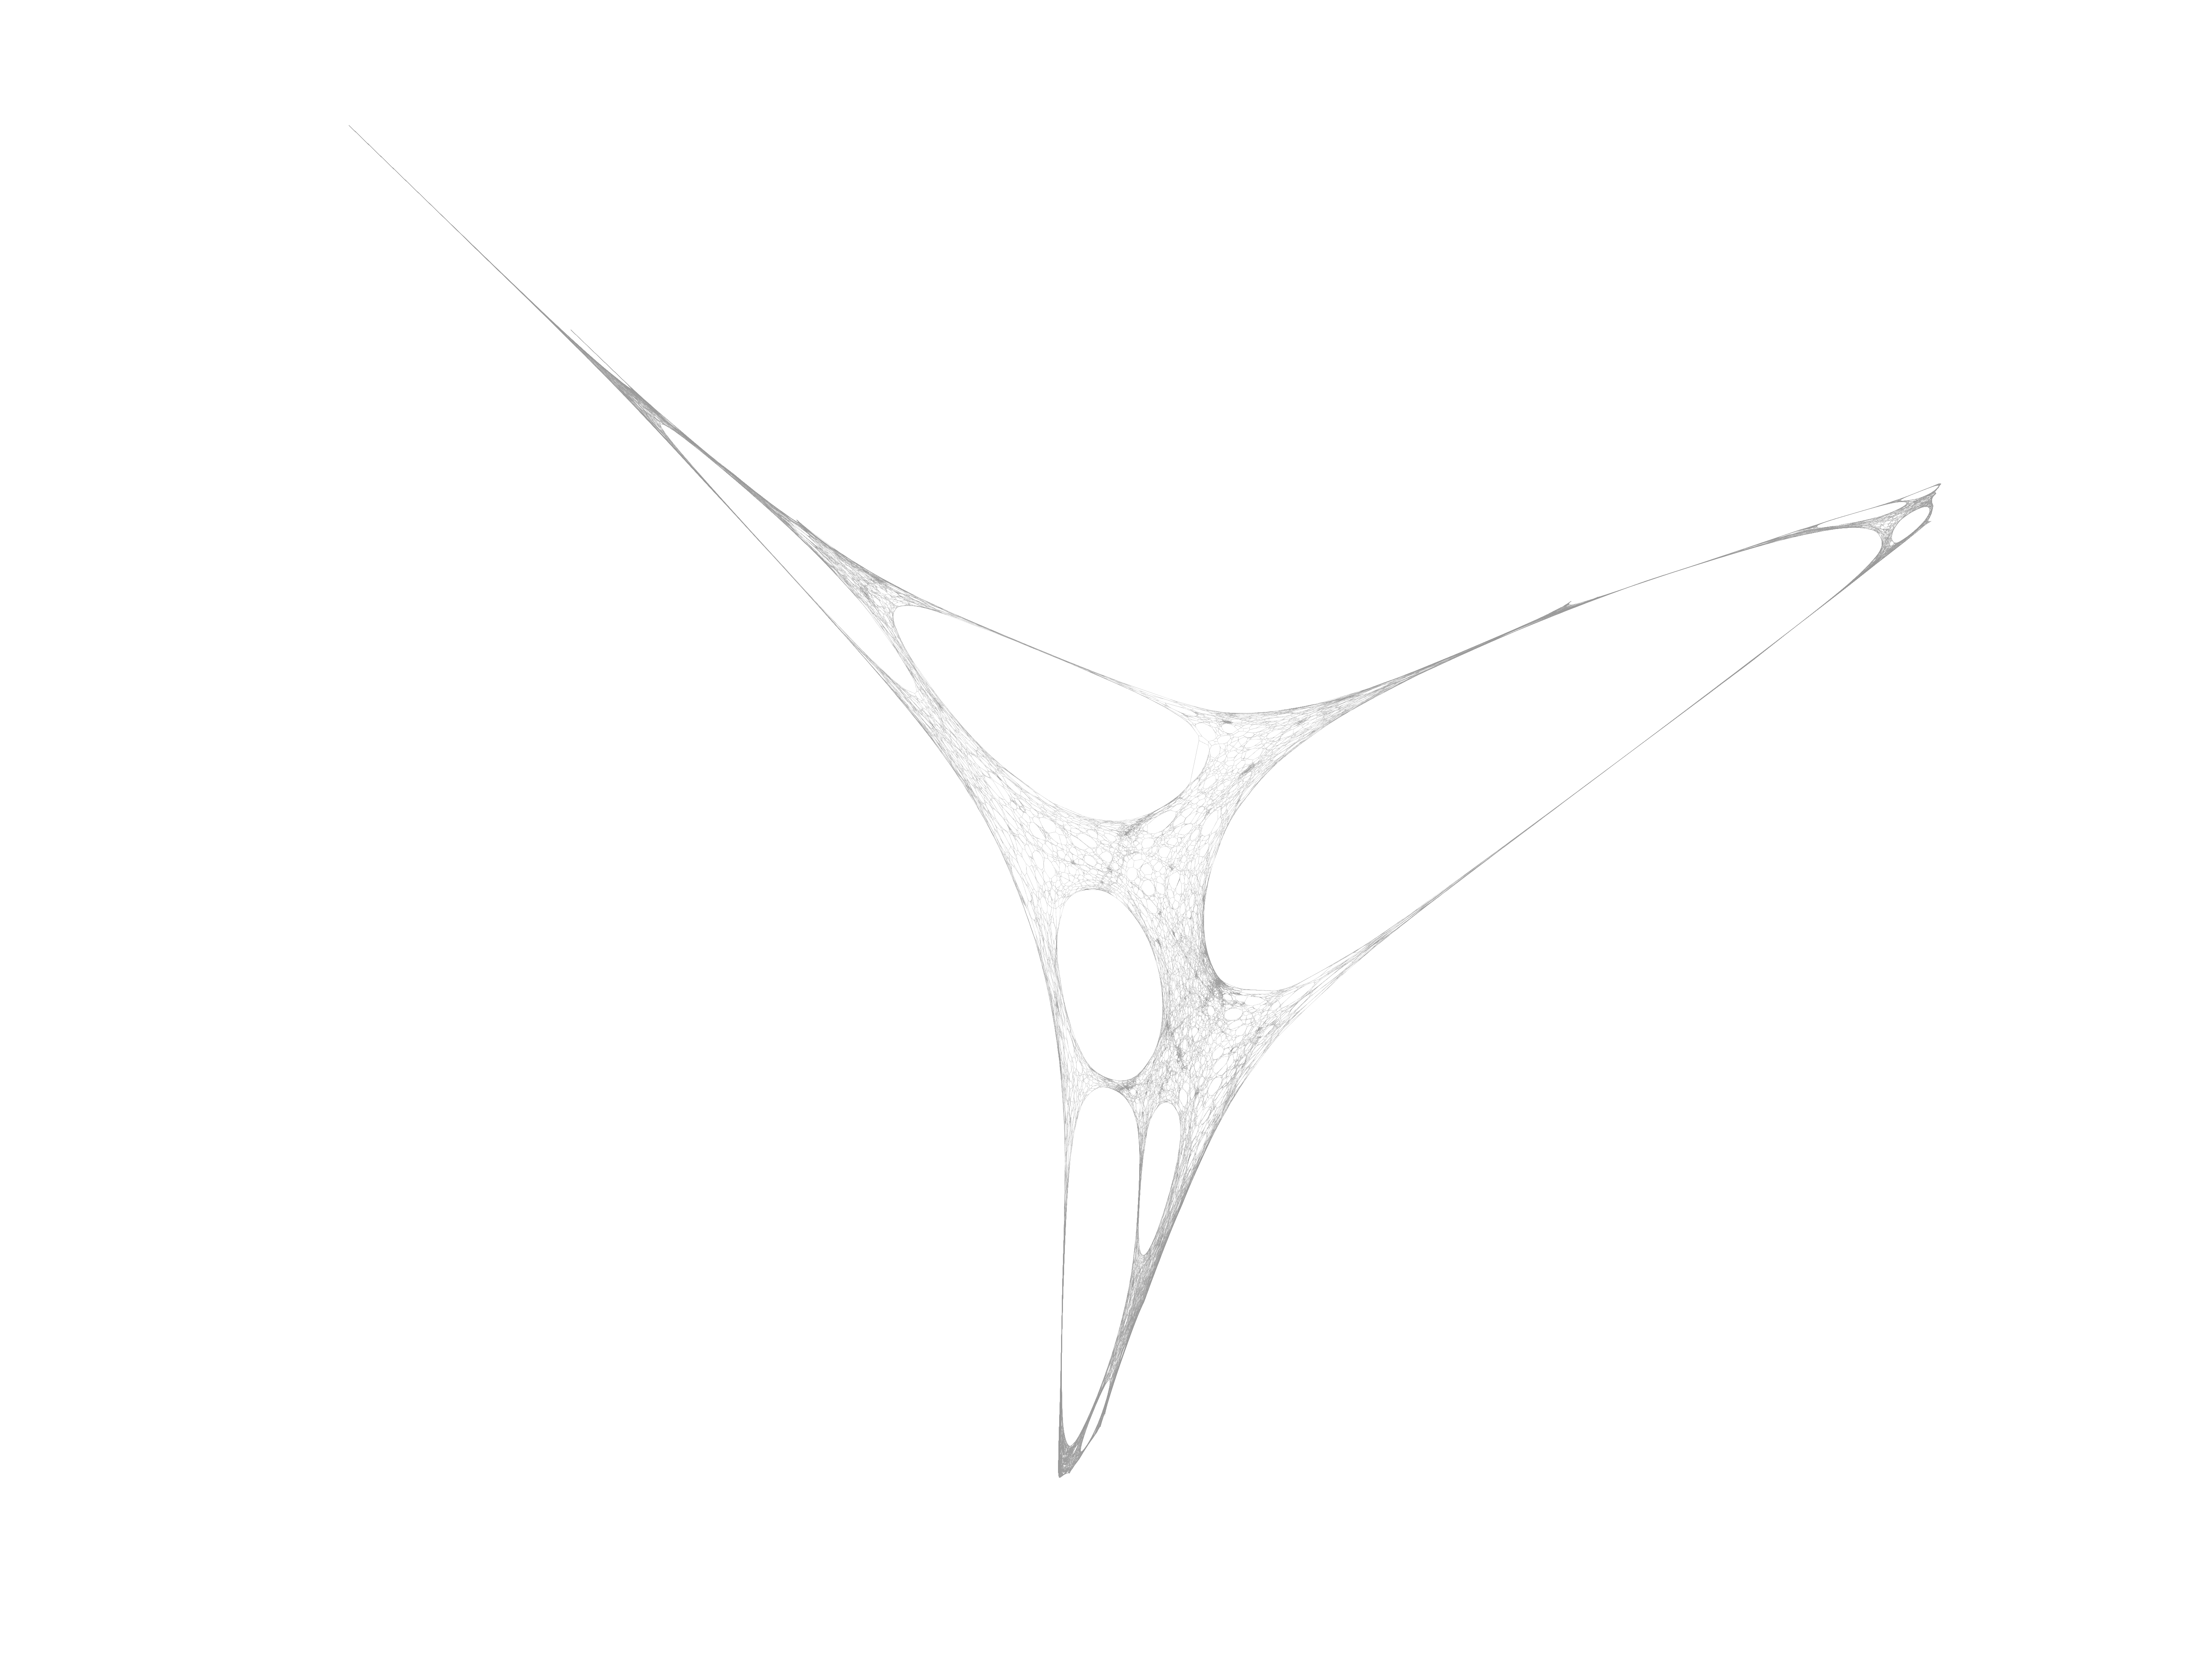
This is the road network of Texas in the United States of America. The nodes of
the network are the intersections between roads and road endpoints, and the
edges are road segments between intersections and road endpoints. The network
is undirected.
Metadata
Statistics
| Size | n = | 1,379,917
|
| Volume | m = | 1,921,660
|
| Wedge count | s = | 4,128,025
|
| Claw count | z = | 2,004,918
|
| Cross count | x = | 352,846
|
| Triangle count | t = | 82,869
|
| Square count | q = | 183,252
|
| 4-Tour count | T4 = | 21,821,436
|
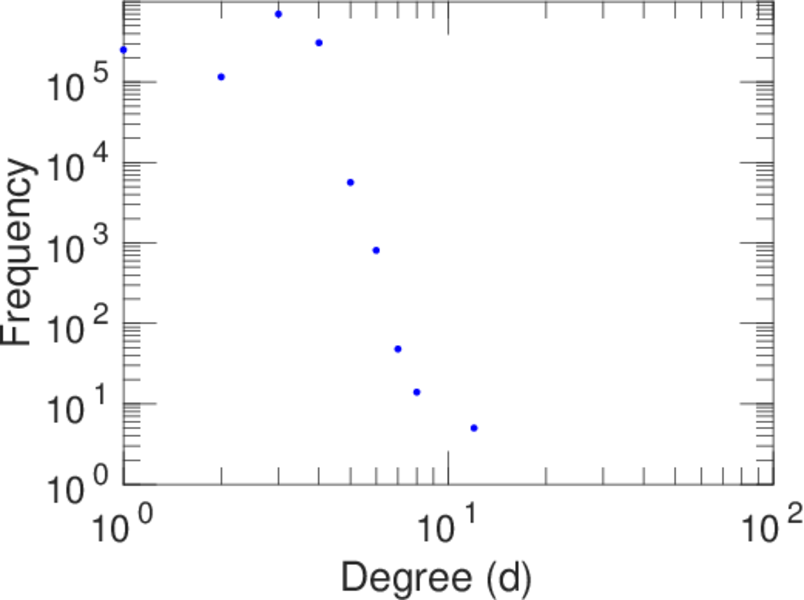
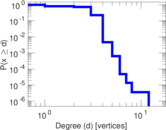
| Maximum degree | dmax = | 12
|
| Average degree | d = | 2.785 18
|
| Fill | p = | 2.018 37 × 10−6
|
| Size of LCC | N = | 1,351,137
|
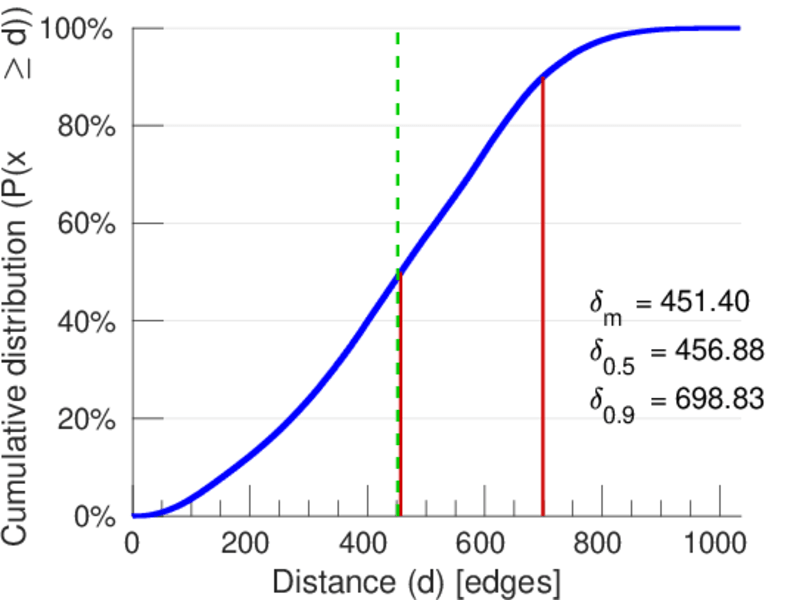
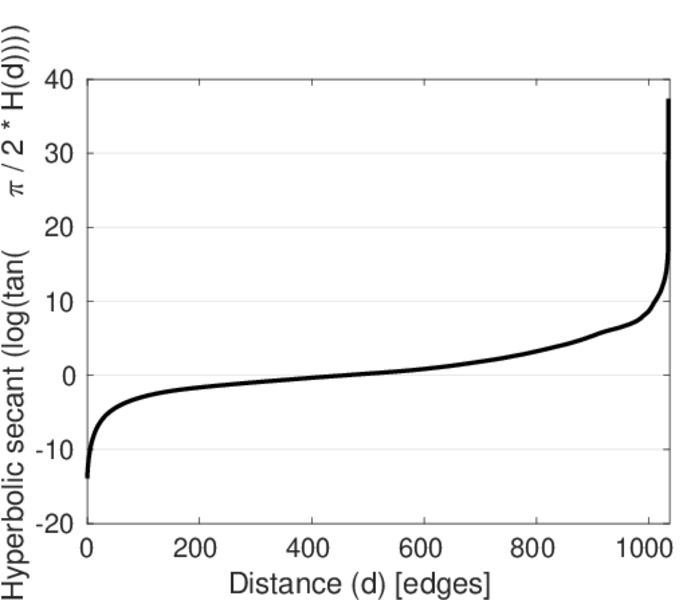
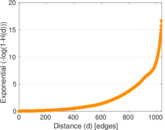
| Diameter | δ = | 1,064
|
| 50-Percentile effective diameter | δ0.5 = | 456.877
|
| 90-Percentile effective diameter | δ0.9 = | 698.834
|
| Median distance | δM = | 457
|
| Mean distance | δm = | 451.397
|
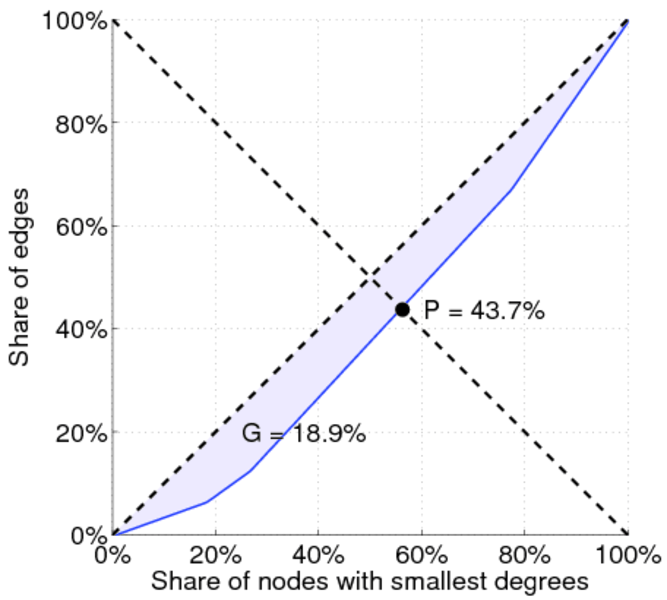
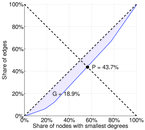
| Gini coefficient | G = | 0.188 538
|
| Balanced inequality ratio | P = | 0.437 059
|
| Relative edge distribution entropy | Her = | 0.994 702
|
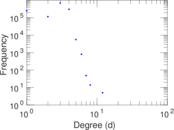
| Power law exponent | γ = | 2.073 71
|
| Tail power law exponent | γt = | 8.901 00
|
| Tail power law exponent with p | γ3 = | 8.901 00
|
| p-value | p = | 0.174 000
|
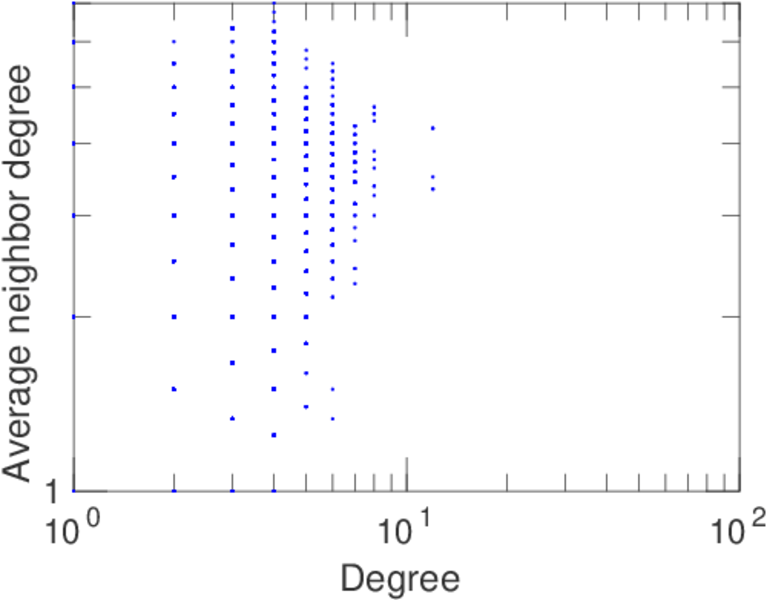
| Degree assortativity | ρ = | +0.130 404
|
| Degree assortativity p-value | pρ = | 0.000 00
|
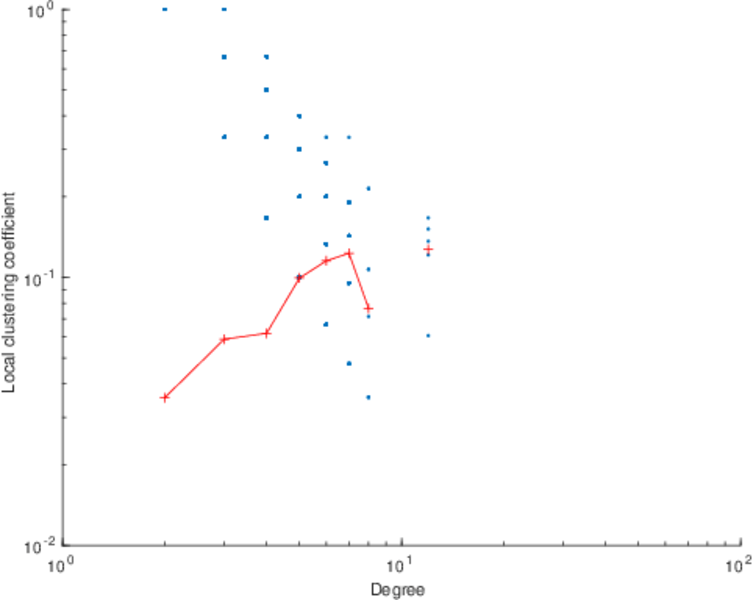
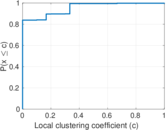
| Clustering coefficient | c = | 0.060 224 2
|
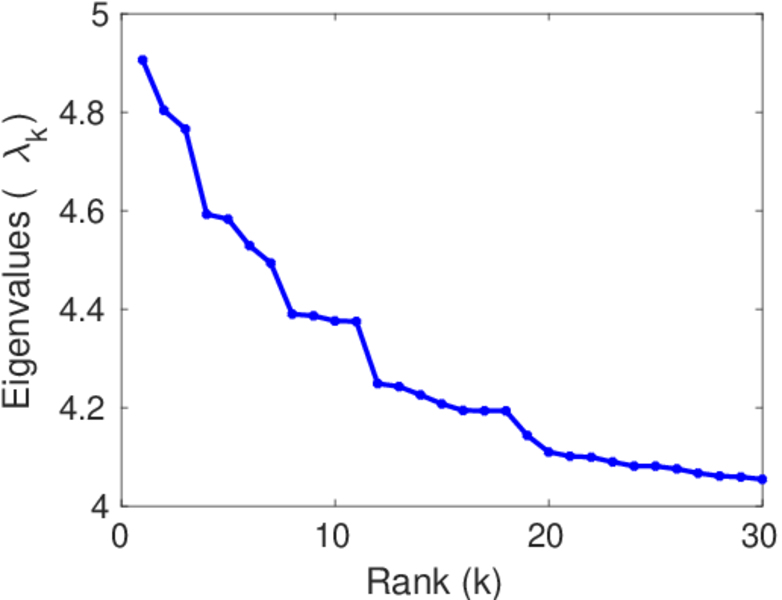
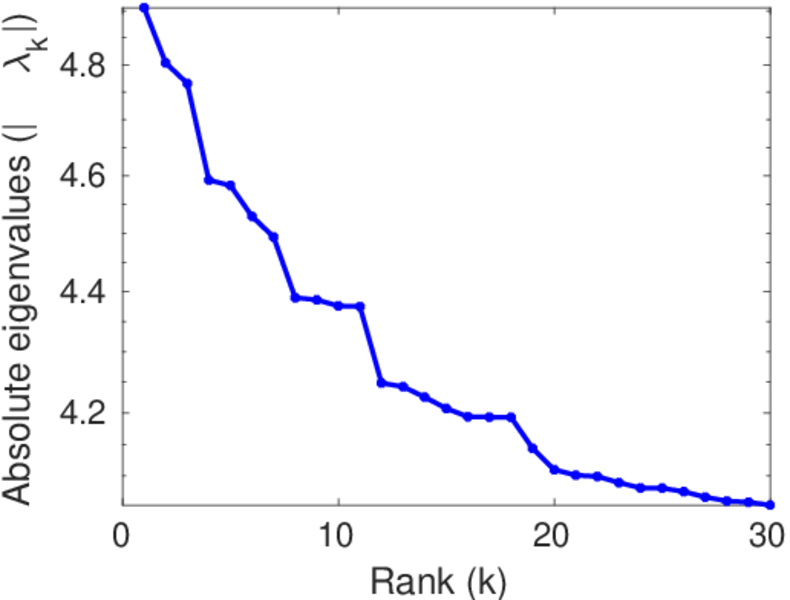
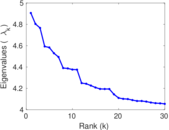
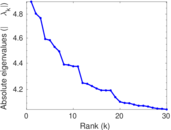
| Spectral norm | α = | 4.906 12
|
| Algebraic connectivity | a = | 7.378 96 × 10−7
|
| Spectral separation | |λ1[A] / λ2[A]| = | 1.021 38
|
| Non-bipartivity | bA = | 0.194 545
|
| Normalized non-bipartivity | bN = | 0.001 117 89
|
| Algebraic non-bipartivity | χ = | 0.002 196 90
|
| Spectral bipartite frustration | bK = | 0.000 197 445
|
| Controllability | C = | 121,393
|
| Relative controllability | Cr = | 0.087 971 2
|
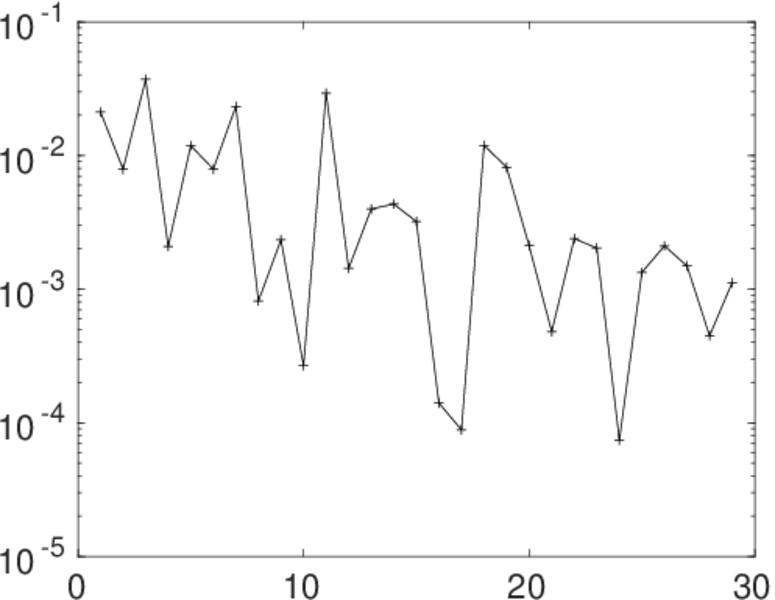
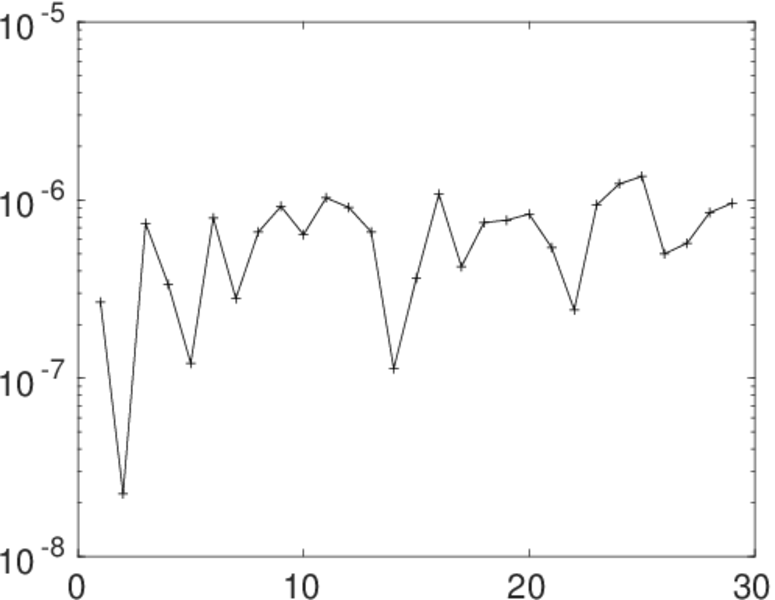
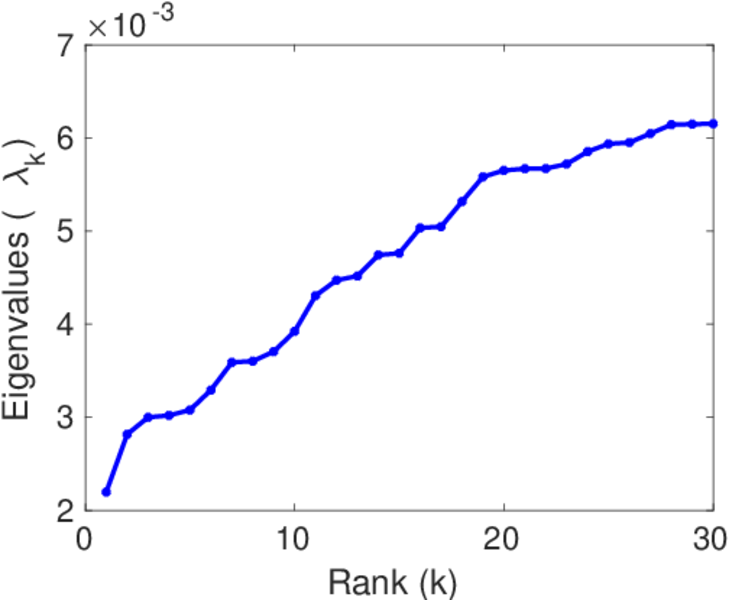
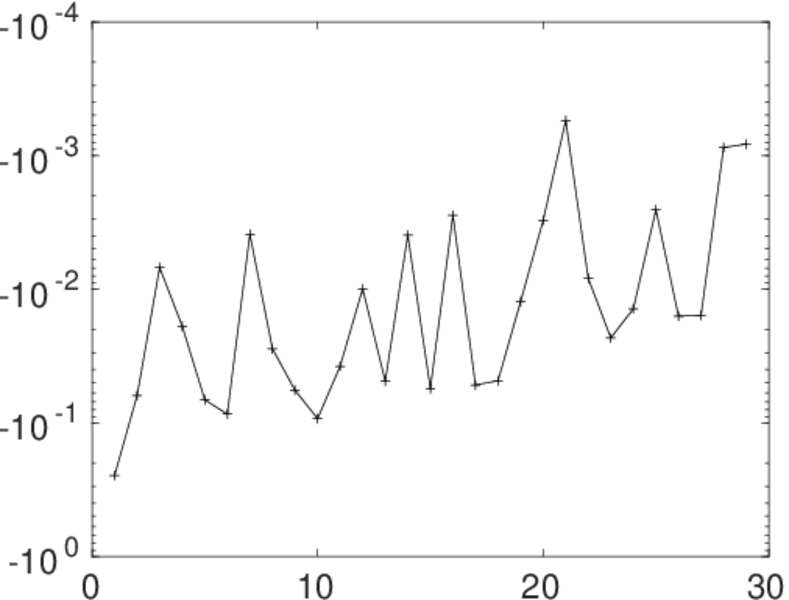
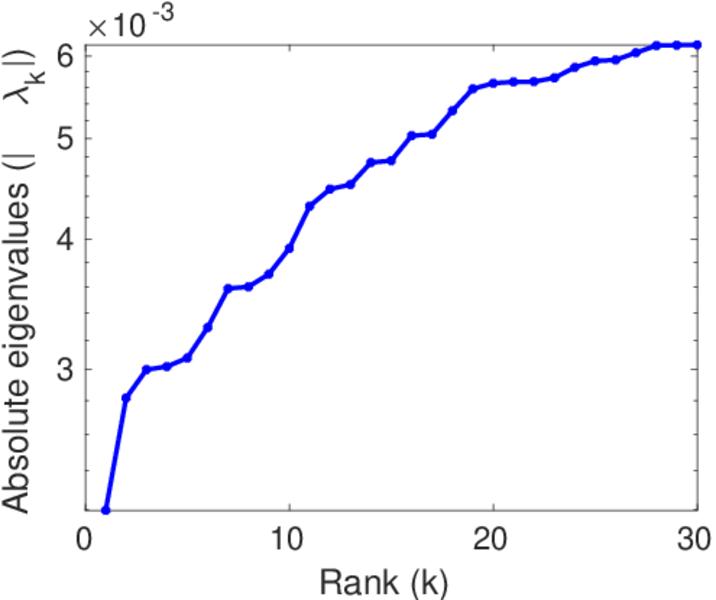
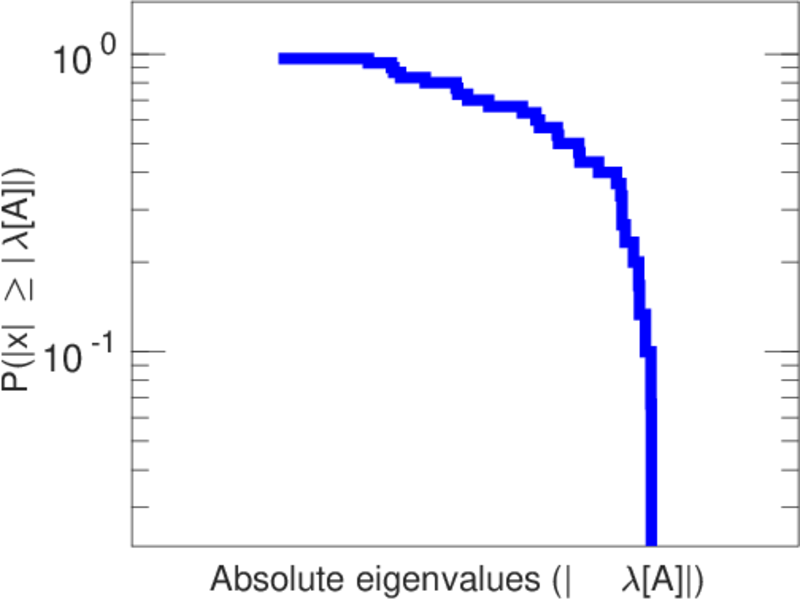
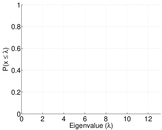
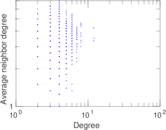
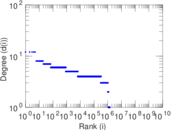
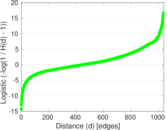
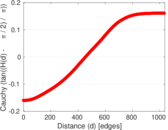
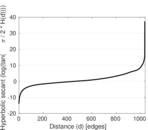
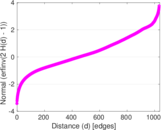
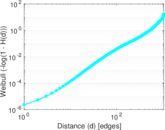
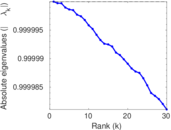
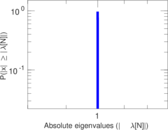
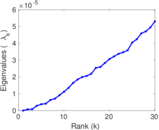
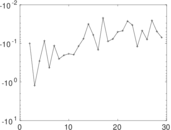
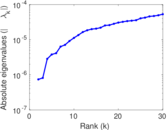
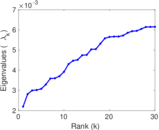
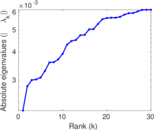
Plots


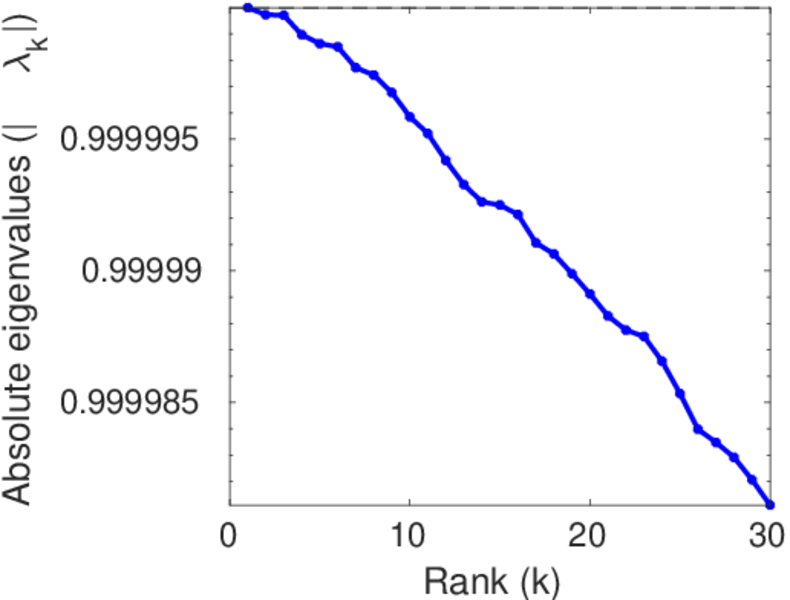
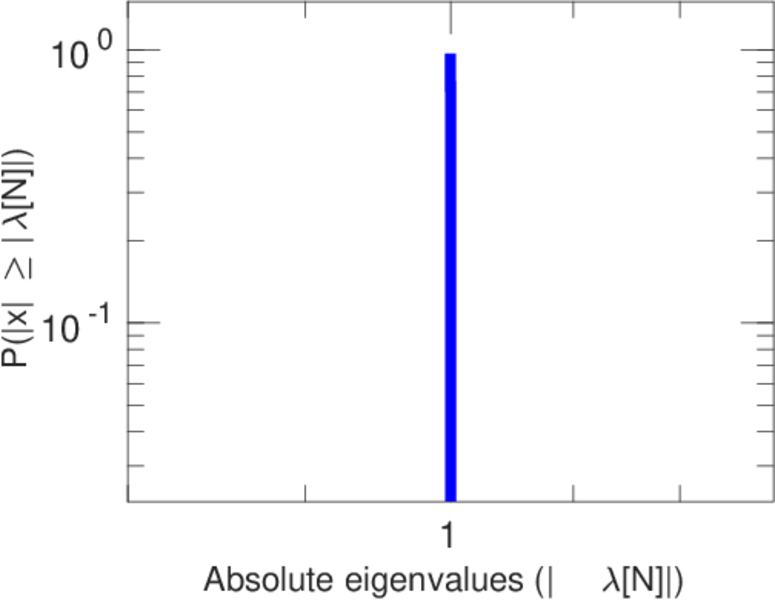
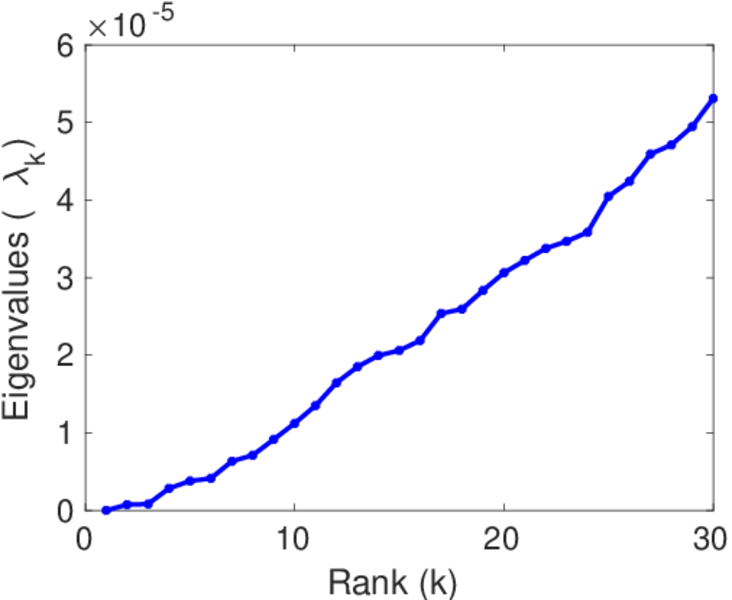
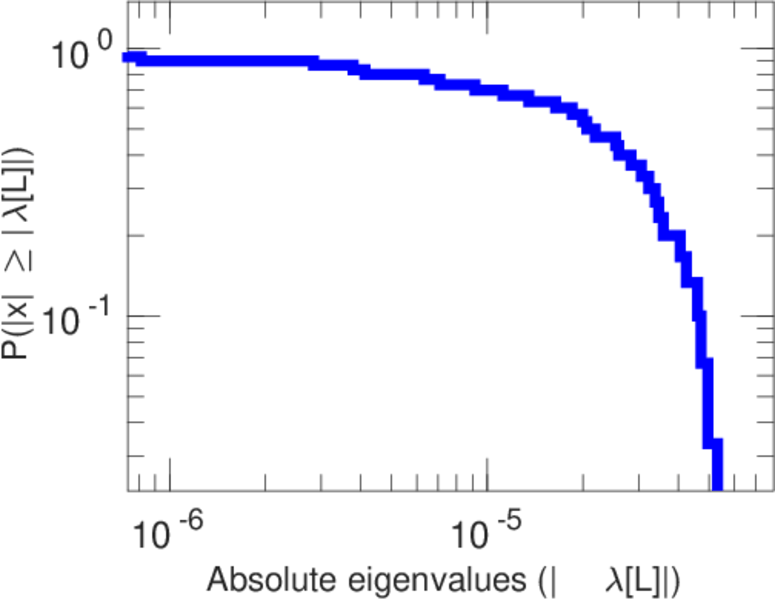
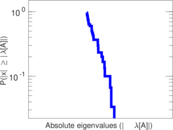
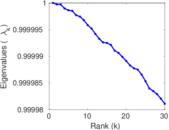
Matrix decompositions plots


Downloads
References
|
[1]
|
Jérôme Kunegis.
KONECT – The Koblenz Network Collection.
In Proc. Int. Conf. on World Wide Web Companion, pages
1343–1350, 2013.
[ http ]
|
|
[2]
|
Jure Leskovec, Kevin Lang, Anirban Dasgupta, and Michael W. Mahoney.
Community structure in large networks: Natural cluster sizes and the
absence of large well-defined clusters.
Internet Math., 6(1):29–123, 2009.
|
 KONECT ‣ Networks ‣
Buy Me a Coffee
KONECT ‣ Networks ‣
Buy Me a Coffee