Google+ (IMC12)
This directed network contains a snapshot of the Google+ social structure.
Nodes represent users. An edge shows social interaction between users.
Metadata
Statistics
| Size | n = | 28,943,739
|
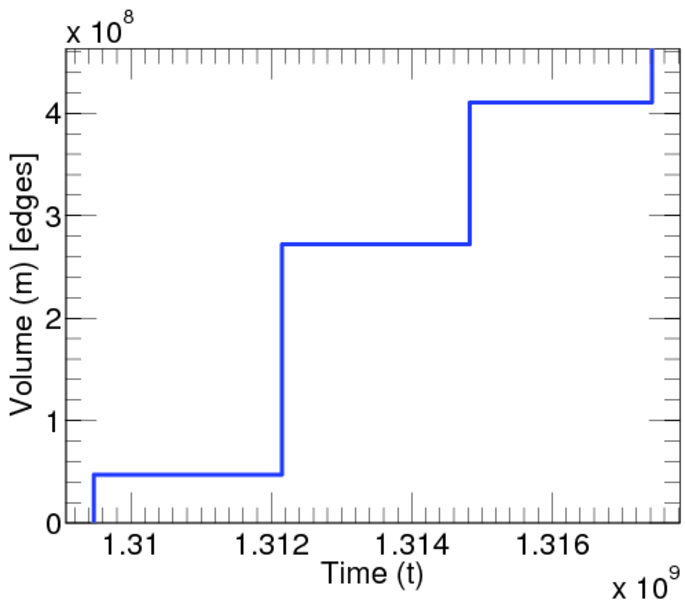
| Volume | m = | 462,994,069
|
| Loop count | l = | 0
|
| Wedge count | s = | 898,518,918,326
|
| Claw count | z = | 36,561,956,367,546,032
|
| Cross count | x = | 2.685 18 × 1021
|
| Triangle count | t = | 14,448,627,246
|
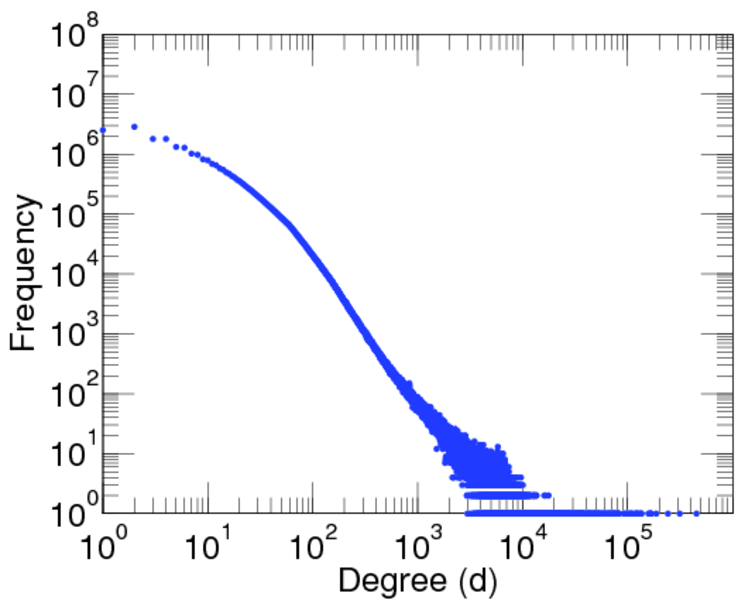
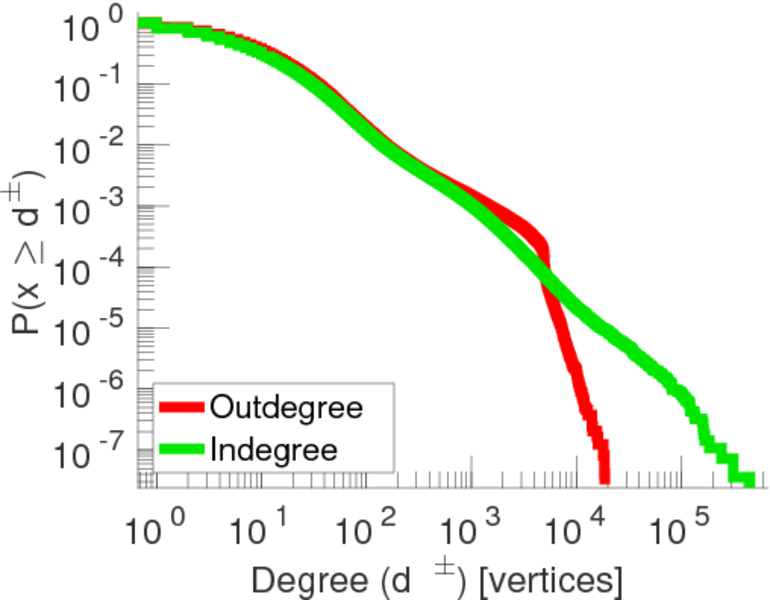
| Maximum degree | dmax = | 452,665
|
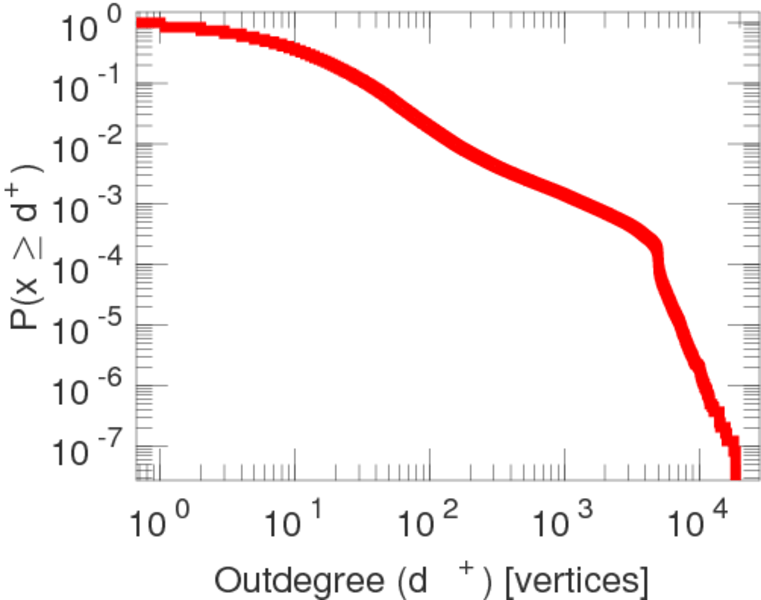
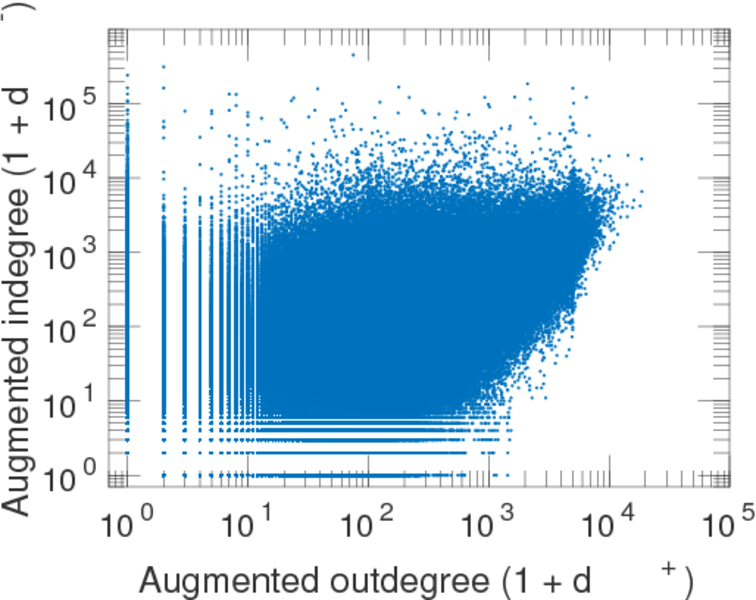
| Maximum outdegree | d+max = | 18,701
|
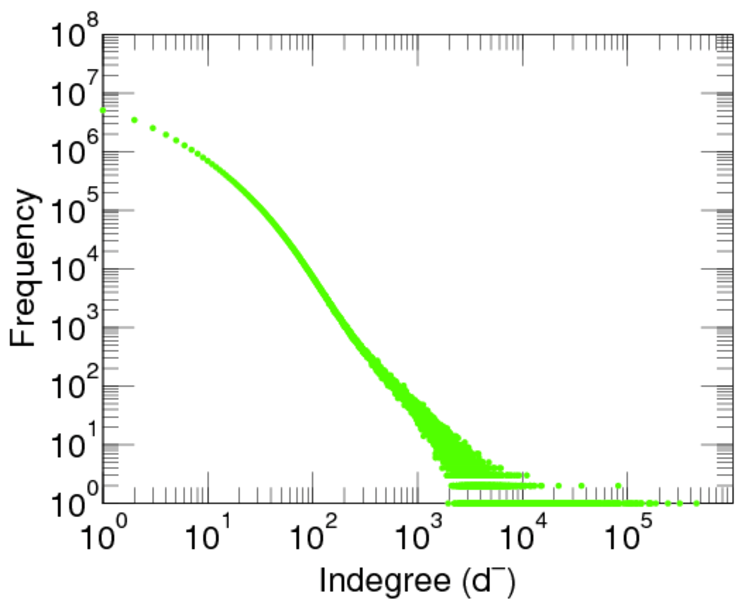
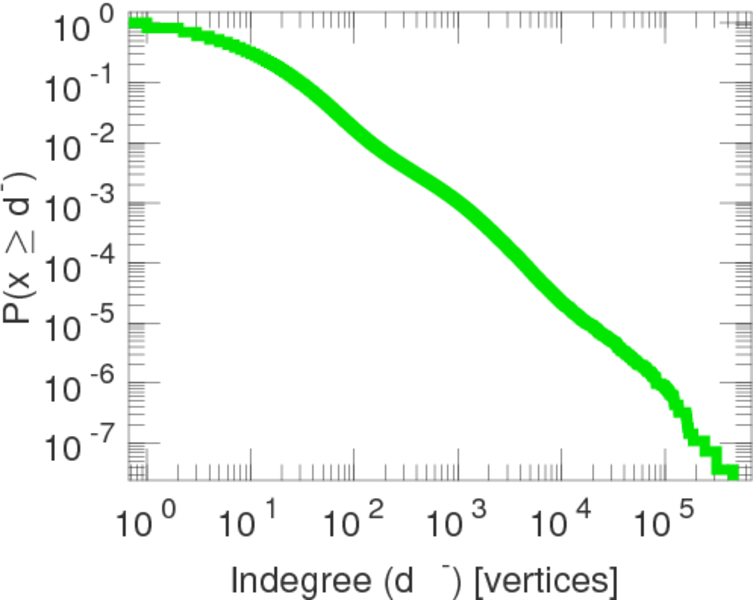
| Maximum indegree | d−max = | 452,591
|
| Average degree | d = | 31.992 7
|
| Fill | p = | 5.526 70 × 10−7
|
| Size of LCC | N = | 28,903,418
|
| Size of LSCC | Ns = | 22,444,688
|
| Relative size of LSCC | Nrs = | 0.775 459
|
| Diameter | δ = | 22
|
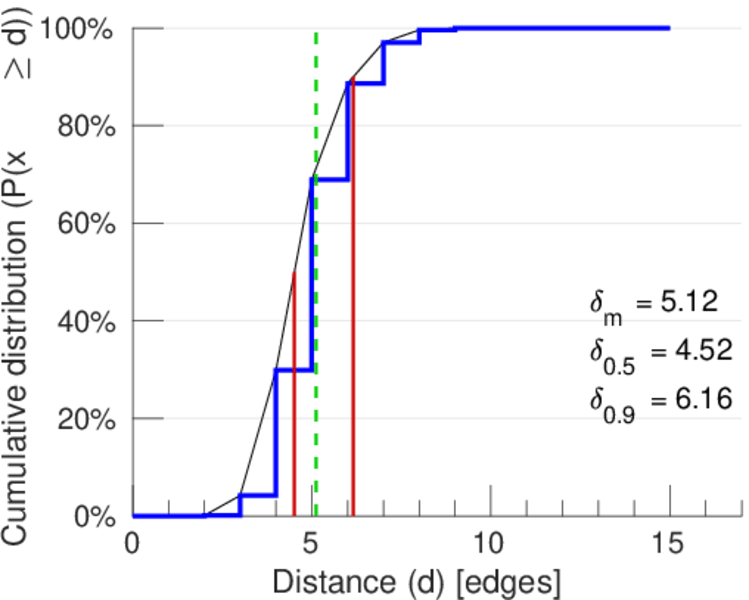
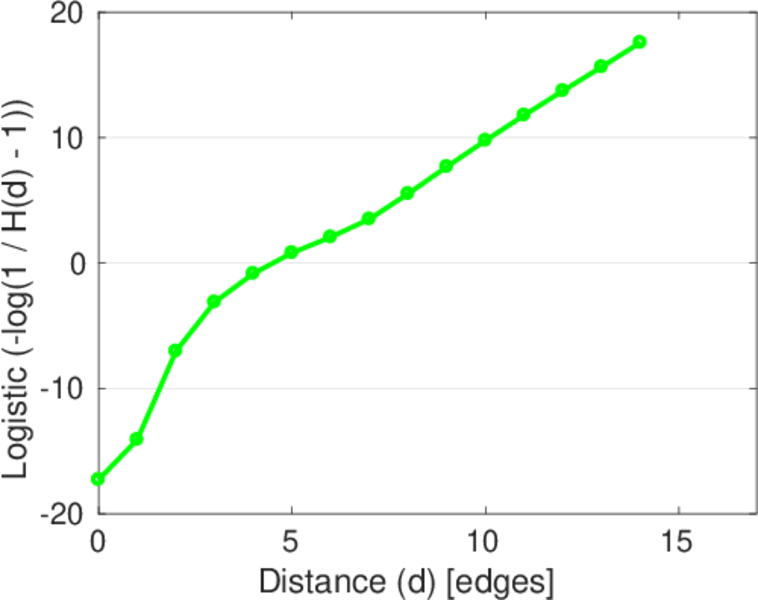
| 50-Percentile effective diameter | δ0.5 = | 4.515 60
|
| 90-Percentile effective diameter | δ0.9 = | 6.160 95
|
| Median distance | δM = | 5
|
| Mean distance | δm = | 5.117 18
|
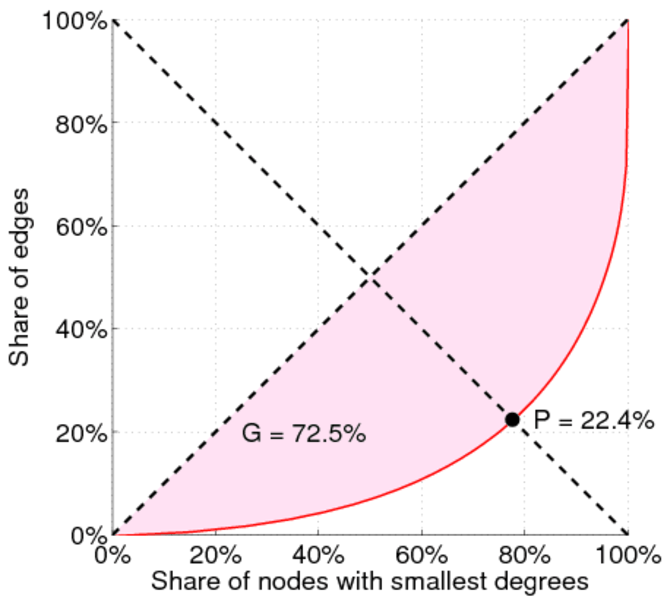
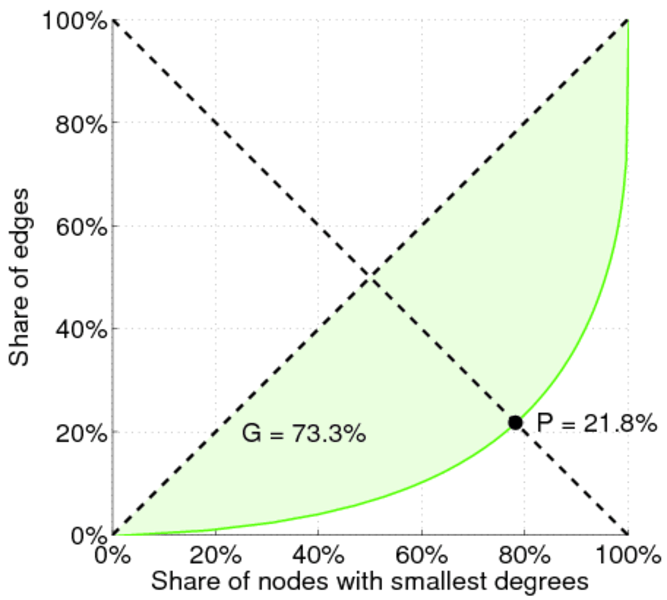
| Balanced inequality ratio | P = | 0.213 766
|
| Outdegree balanced inequality ratio | P+ = | 0.223 678
|
| Indegree balanced inequality ratio | P− = | 0.217 916
|
| Relative edge distribution entropy | Her = | 0.906 965
|
| Power law exponent | γ = | 1.518 51
|
| Clustering coefficient | c = | 0.048 241 5
|
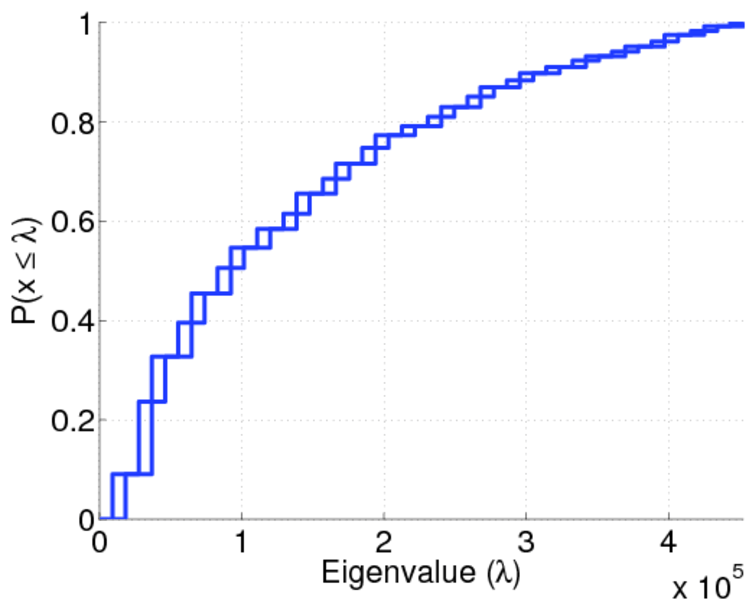
| Spectral norm | α = | 3,602.22
|
| Operator 2-norm | ν = | 2,447.21
|
| Reciprocity | y = | 0.550 040
|
| Non-bipartivity | bA = | 0.509 053
|
| Normalized non-bipartivity | bN = | 0.004 642 58
|
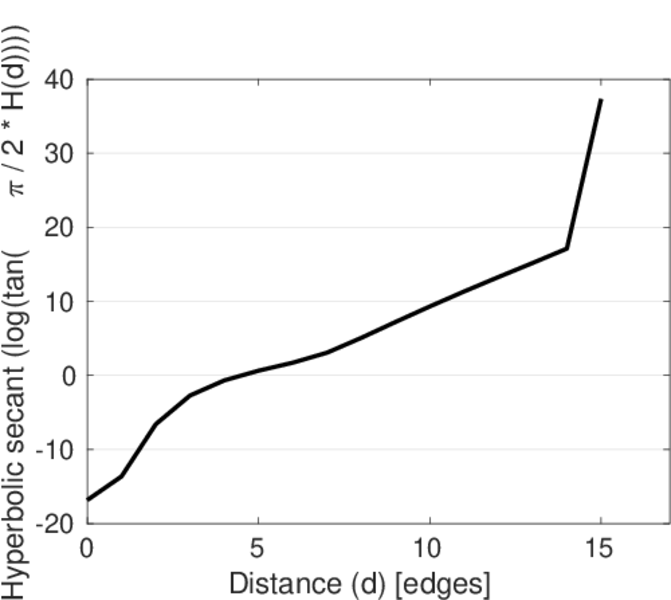
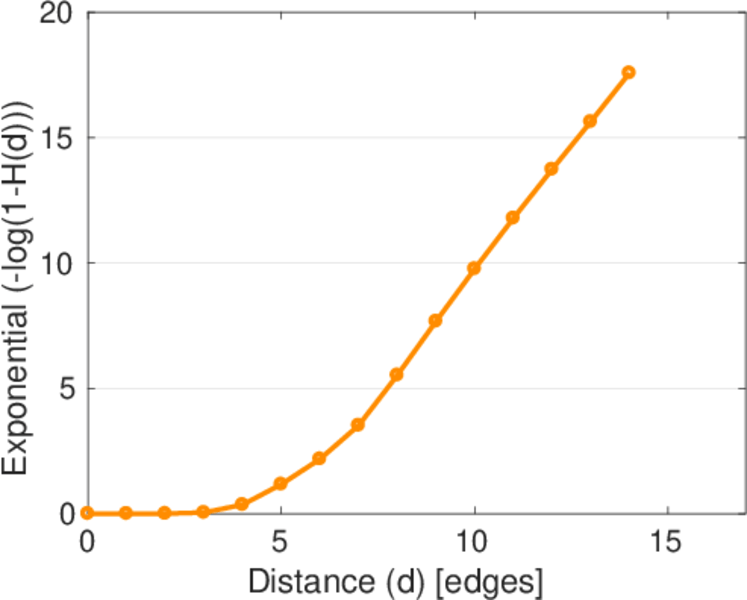
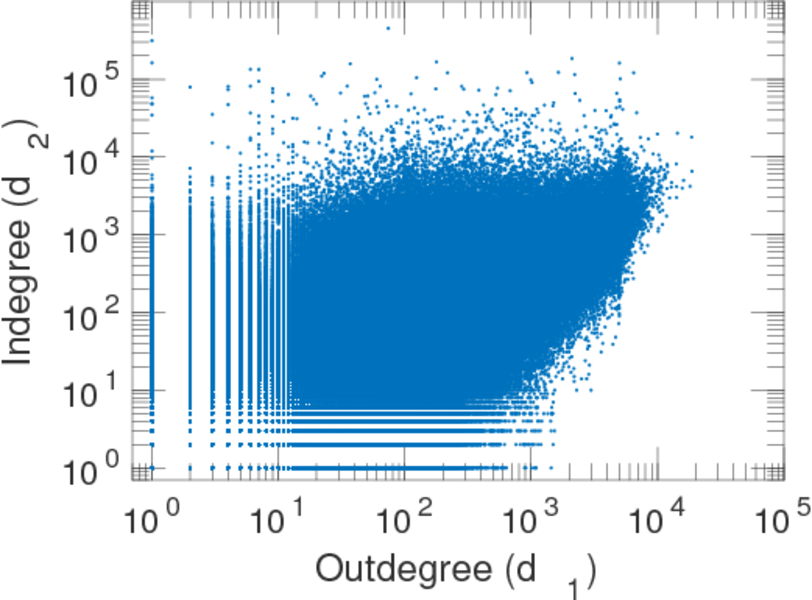
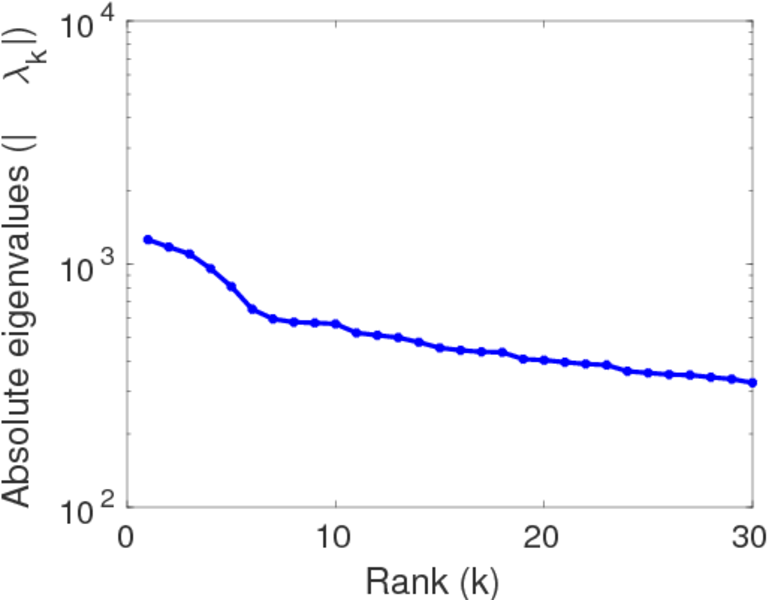
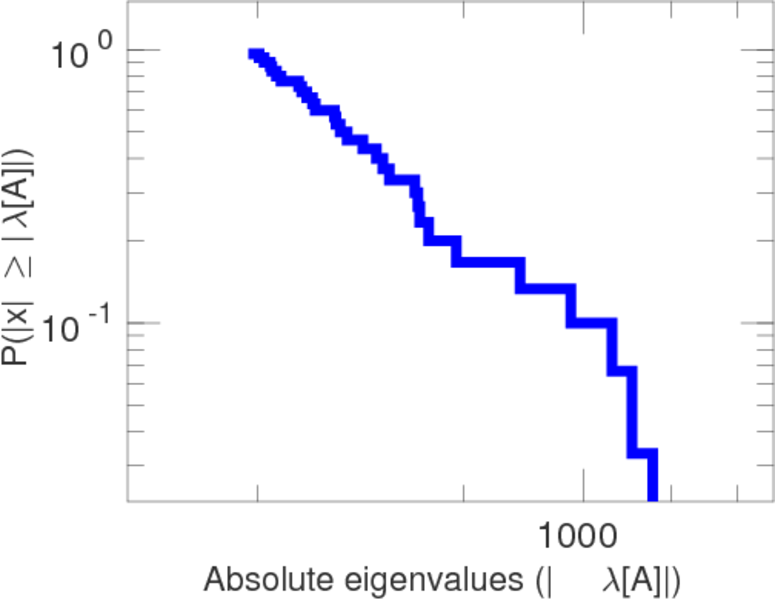
Plots


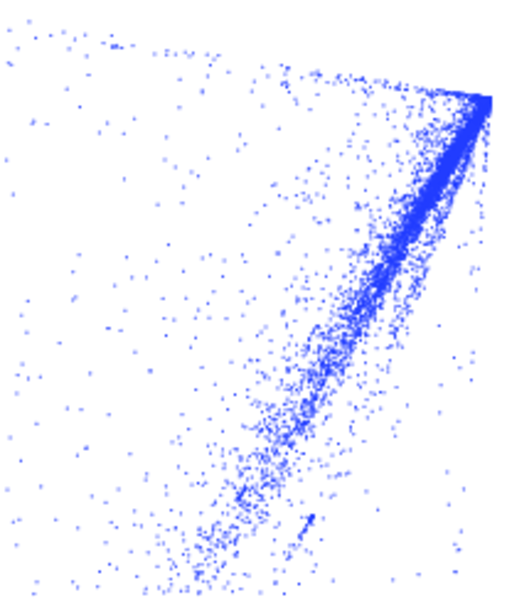
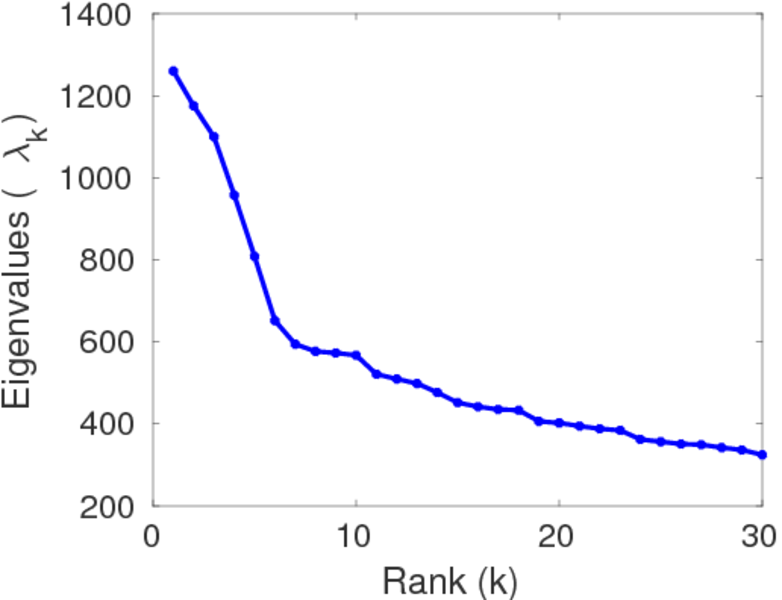
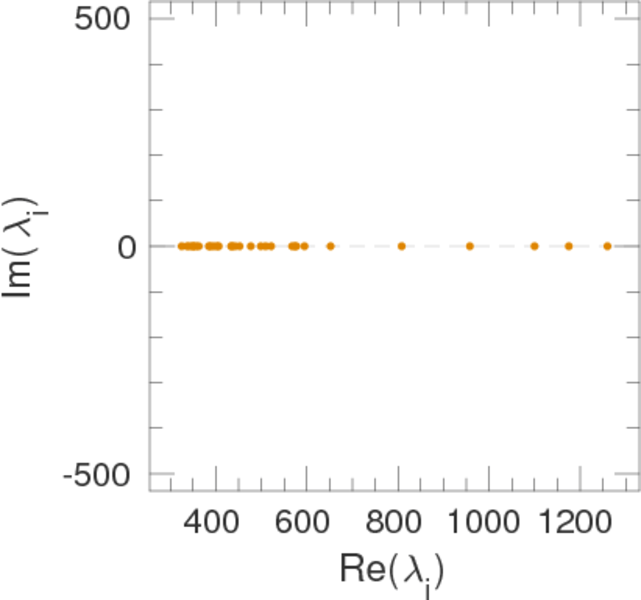
Matrix decompositions plots


Downloads
References
|
[1]
|
Jérôme Kunegis.
KONECT – The Koblenz Network Collection.
In Proc. Int. Conf. on World Wide Web Companion, pages
1343–1350, 2013.
[ http ]
|
|
[2]
|
Neil Zhenqiang Gong, Wenchang Xu, Ling Huang, Prateek Mittal, Emil Stefanov,
Vyas Sekar, and Dawn Song.
Evolution of social-attribute networks: Measurements, modeling, and
implications using Google+.
In Proc. Internet Measurement Conf., pages 131–144, 2012.
|
 KONECT ‣ Networks ‣
Buy Me a Coffee
KONECT ‣ Networks ‣
Buy Me a Coffee