Euroroads

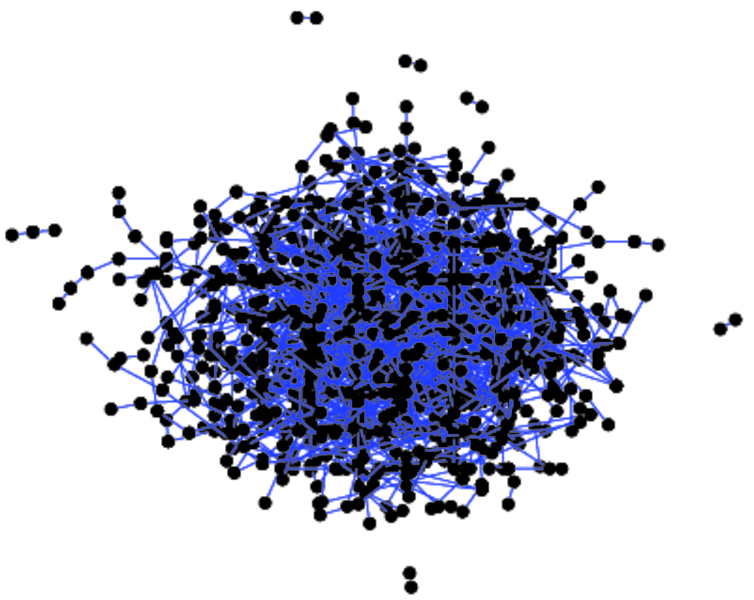
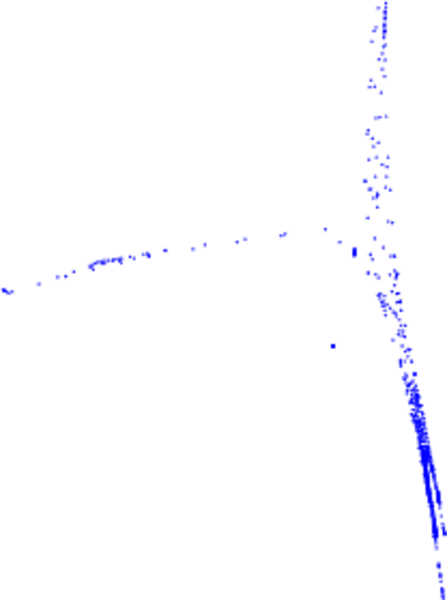
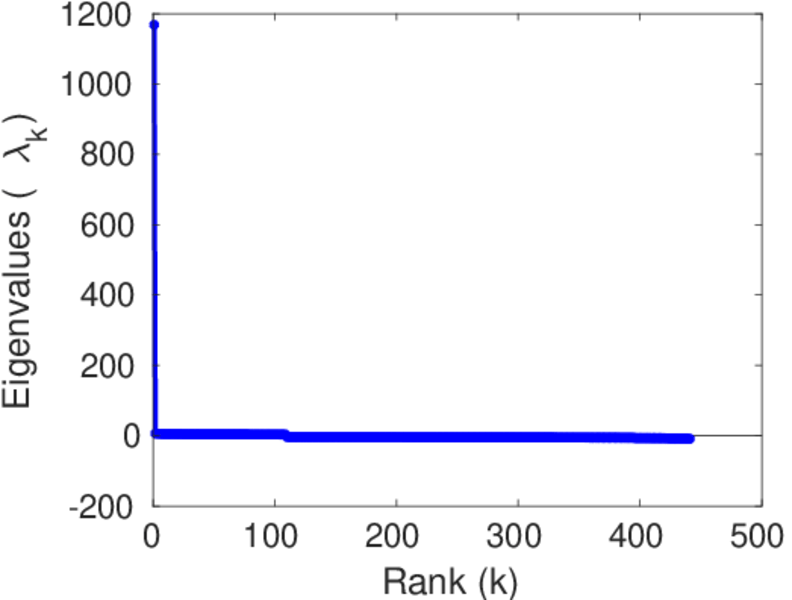
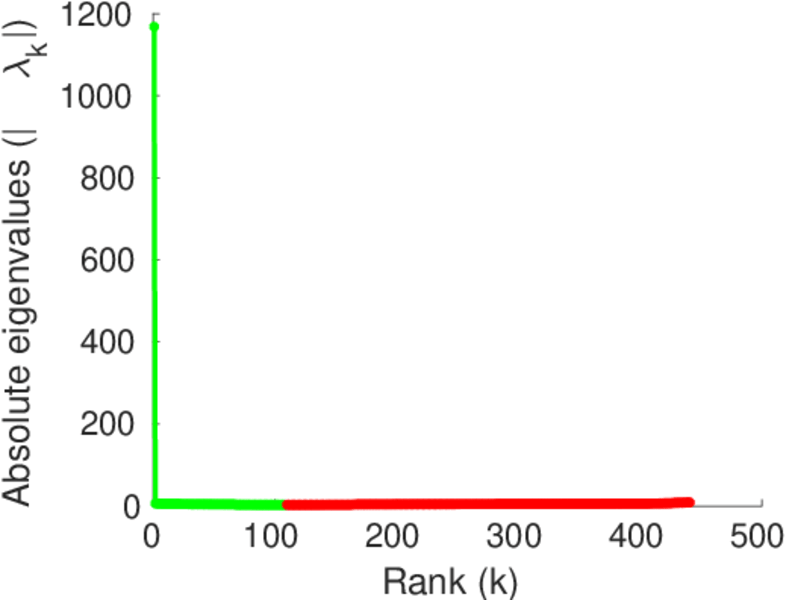
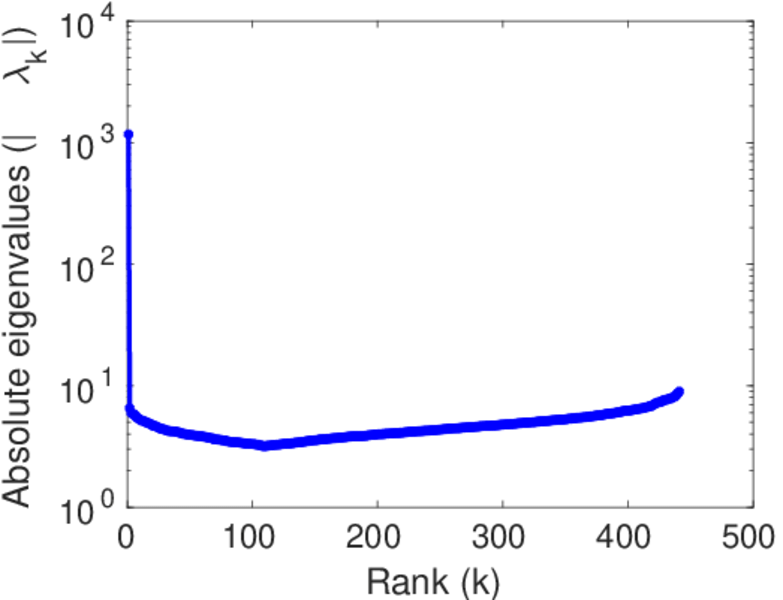
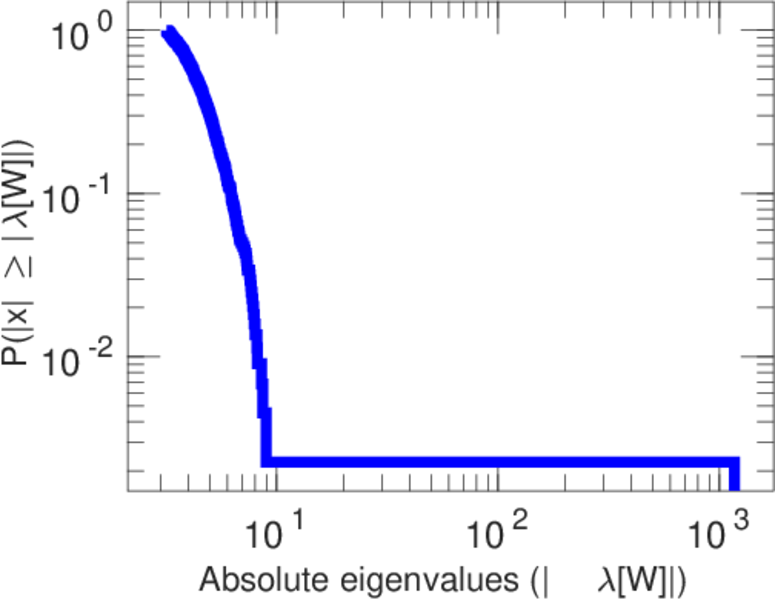
This is the international E-road network, a road network located mostly in Europe. The network is undirected; nodes represent cities and an edge between two nodes denotes that they are connected by an E-road.

Metadata

CodeET
Internal namesubelj_euroroad
NameEuroroads
Data sourcehttp://lovro.lpt.fri.uni-lj.si/support.jsp
AvailabilityDataset is available for download
Consistency checkDataset passed all tests
Category
Infrastructure network
Node meaningCity
Edge meaningRoad
Network formatUnipartite, undirected
Edge typeUnweighted, no multiple edges
LoopsDoes not contain loops

Statistics

Size n =1,174
Volume m =1,417
Loop count l =0
Wedge count s =2,833
Claw count z =1,983
Cross count x =1,308
Triangle count t =32
Square count q =41
4-Tour count T4 =14,494
Maximum degree dmax =10
Average degree d =2.413 97
Fill p =0.002 057 94
Size of LCC N =1,039
Diameter δ =62
50-Percentile effective diameter δ0.5 =16.935 8
90-Percentile effective diameter δ0.9 =33.340 5
Median distance δM =17
Mean distance δm =19.181 2
Gini coefficient G =0.240 881
Balanced inequality ratio P =0.412 844
Relative edge distribution entropy Her =0.984 809
Power law exponent γ =2.289 90
Tail power law exponent γt =6.401 00
Tail power law exponent with p γ3 =6.401 00
p-value p =0.713 000
Degree assortativity ρ =+0.126 684
Degree assortativity p-value pρ =1.302 58 × 10−11
Clustering coefficient c =0.033 886 3
Spectral norm α =4.010 44
Algebraic connectivity a =0.001 160 30
Spectral separation 1[A] / λ2[A]| =1.023 07
Non-bipartivity bA =0.061 239 9
Normalized non-bipartivity bN =0.004 177 77
Algebraic non-bipartivity χ =0.008 094 25
Spectral bipartite frustration bK =0.000 805 549
Controllability C =103
Relative controllability Cr =0.087 734 2

Plots

Fruchterman–Reingold graph drawing

Degree distribution

Cumulative degree distribution

Lorenz curve

Spectral distribution of the adjacency matrix

Spectral distribution of the normalized adjacency matrix

Spectral distribution of the Laplacian

Spectral graph drawing based on the adjacency matrix

Spectral graph drawing based on the Laplacian

Spectral graph drawing based on the normalized adjacency matrix

Degree assortativity

Zipf plot

Hop distribution

Double Laplacian graph drawing

Delaunay graph drawing

Clustering coefficient distribution

Average neighbor degree distribution

SynGraphy

Matrix decompositions plots

Downloads

References

[1] Jérôme Kunegis. KONECT – The Koblenz Network Collection. In Proc. Int. Conf. on World Wide Web Companion, pages 1343–1350, 2013. [ http ]
[2] Lovro Šubelj and Marko Bajec. Robust network community detection using balanced propagation. Eur. Phys. J. B, 81(3):353–362, 2011.