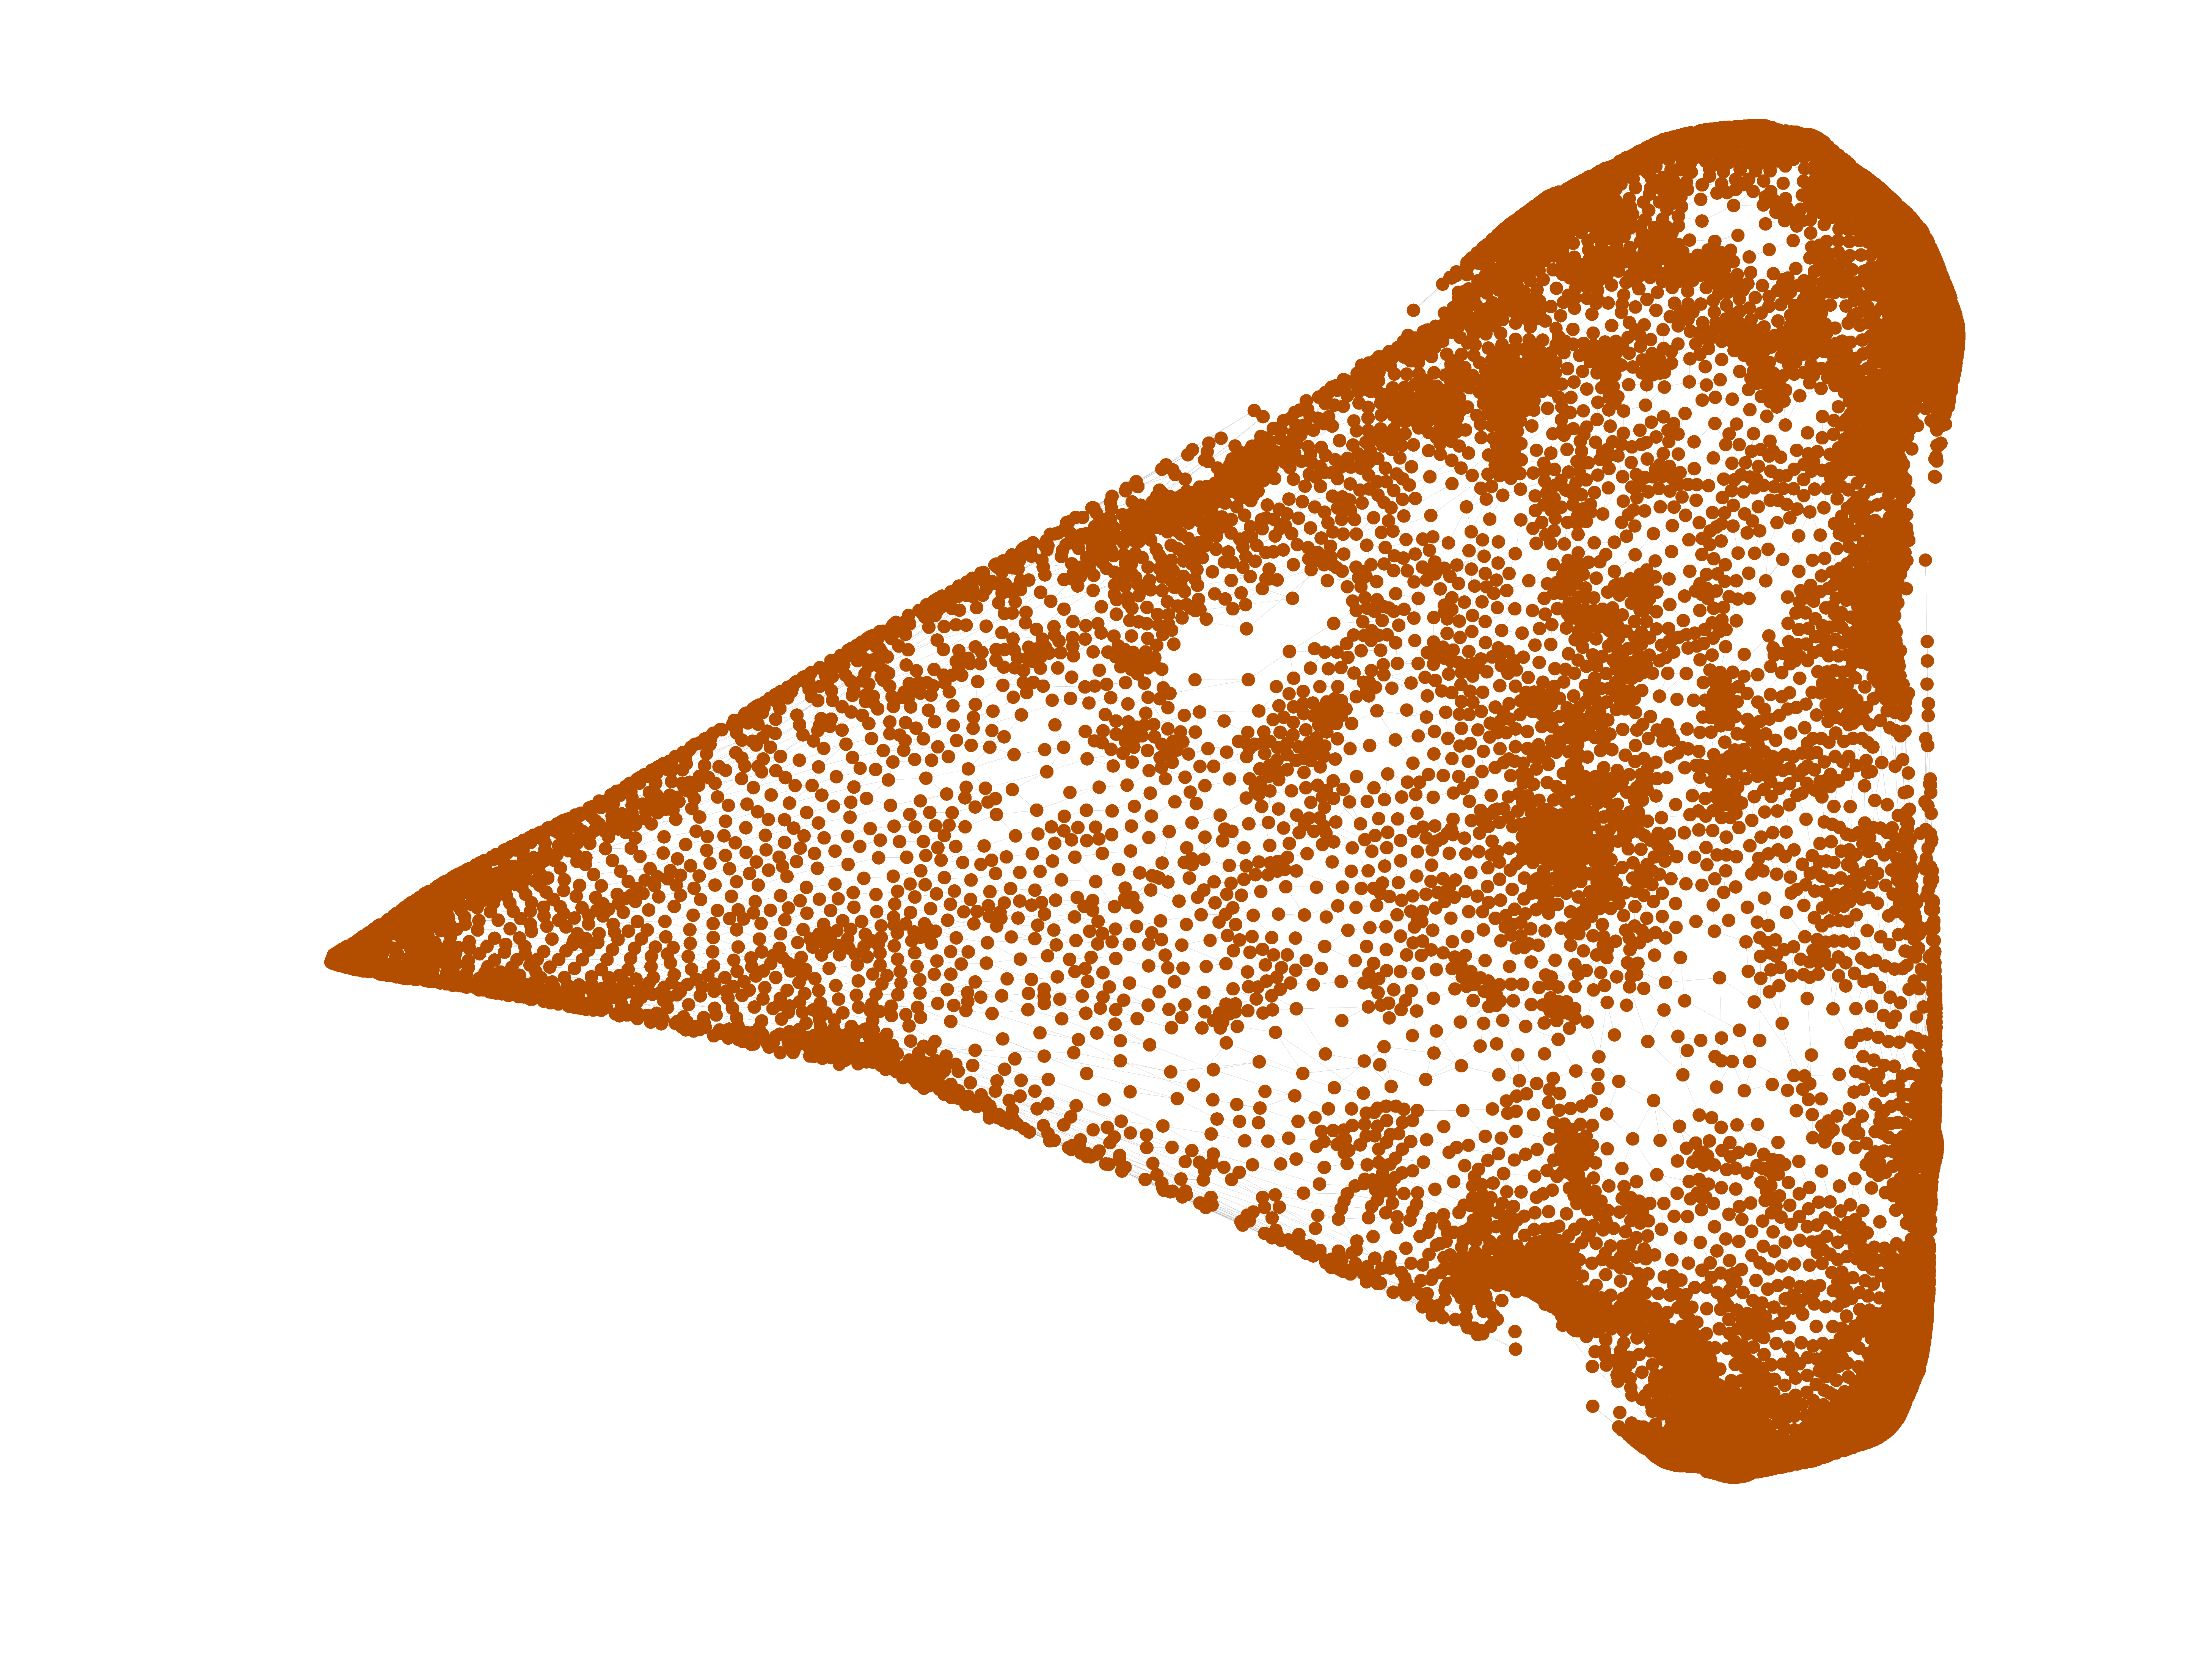
Chicago
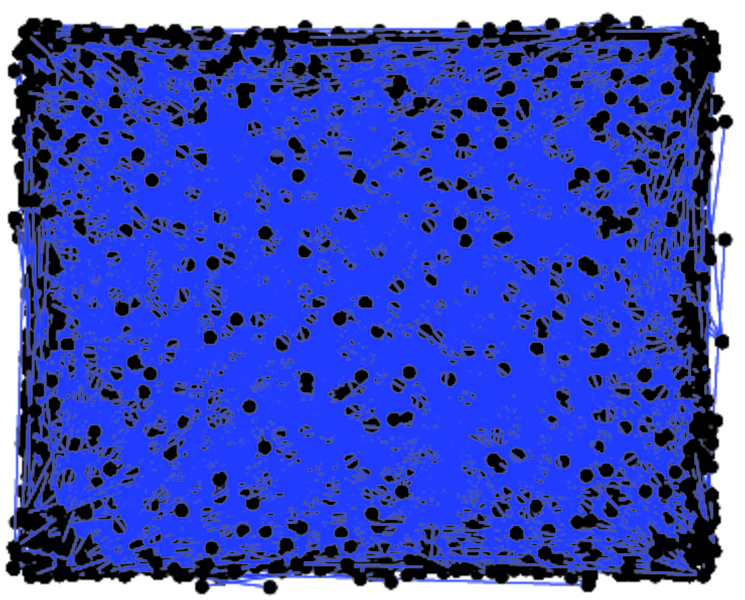
This is the directed road transportation network of the Chicago region (USA).
Nodes are transport nodes, and edges are directed connections.
Metadata
Statistics
| Size | n = | 12,982
|
| Volume | m = | 39,018
|
| Loop count | l = | 0
|
| Wedge count | s = | 53,155
|
| Claw count | z = | 435,211
|
| Cross count | x = | 558,250
|
| Triangle count | t = | 807
|
| Square count | q = | 3,027
|
| 4-Tour count | T4 = | 278,090
|
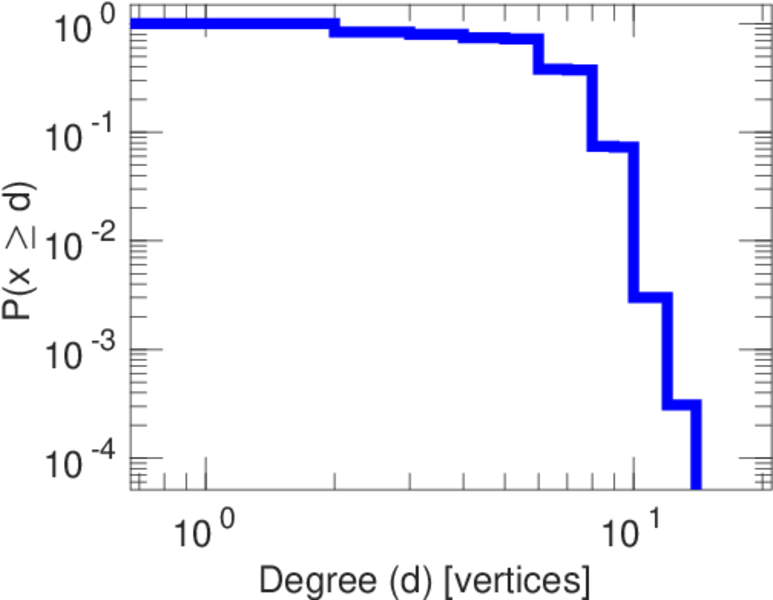
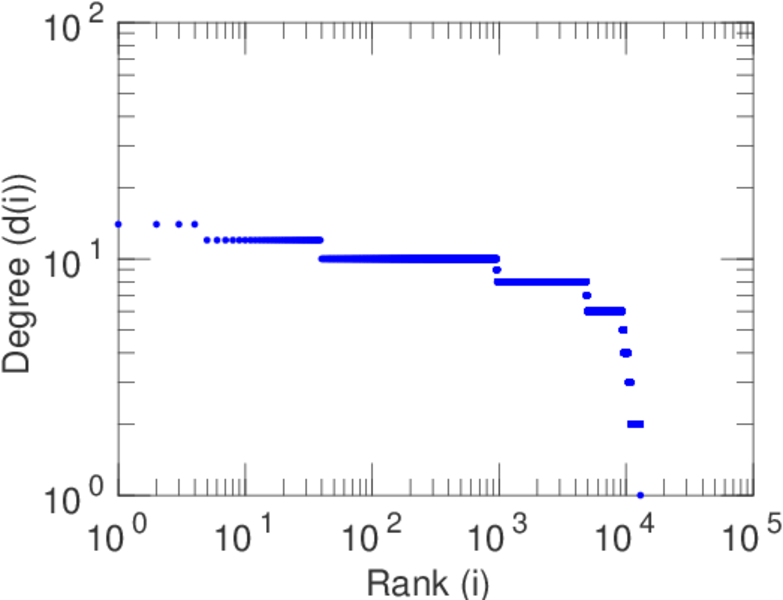
| Maximum degree | dmax = | 14
|
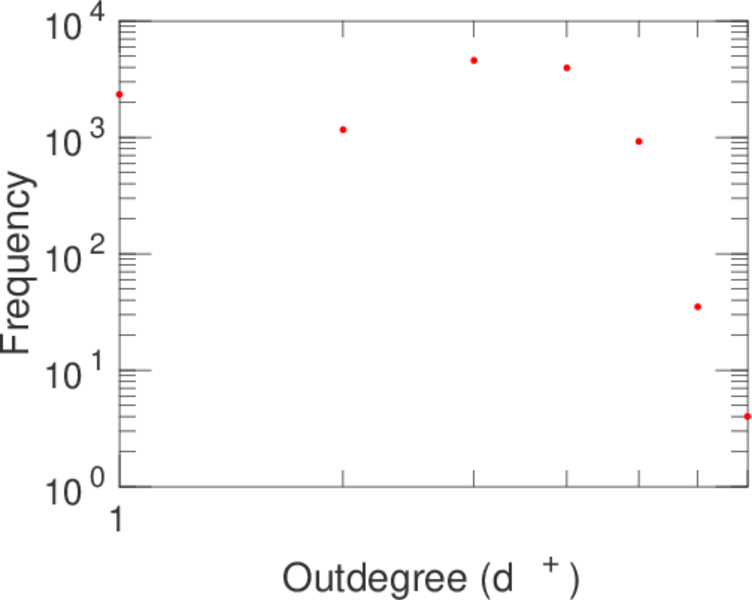
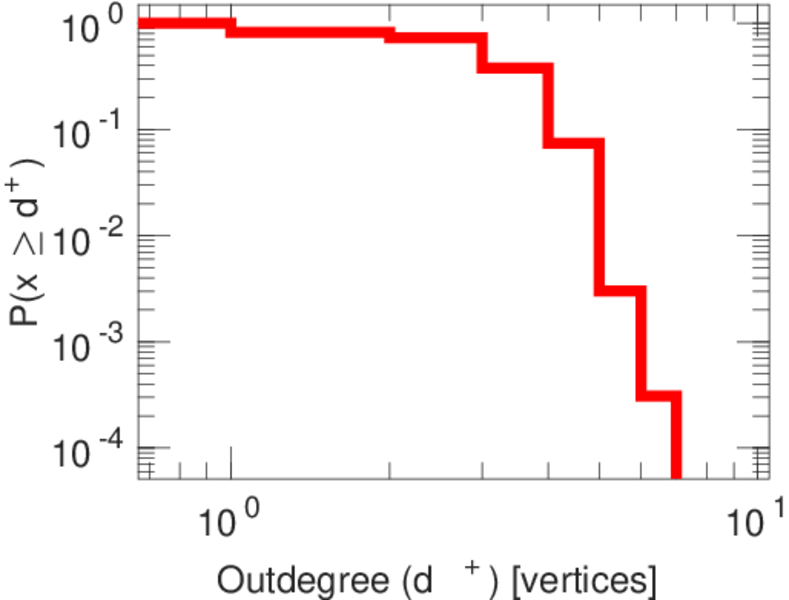
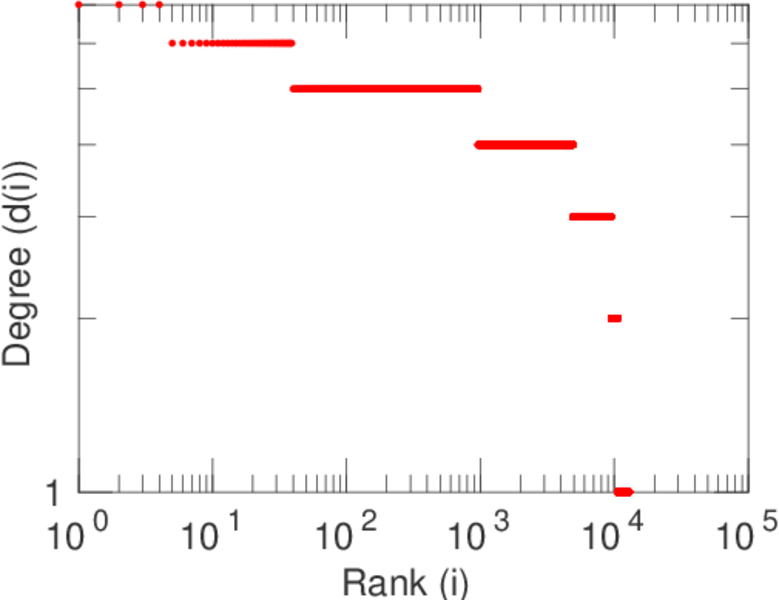
| Maximum outdegree | d+max = | 7
|
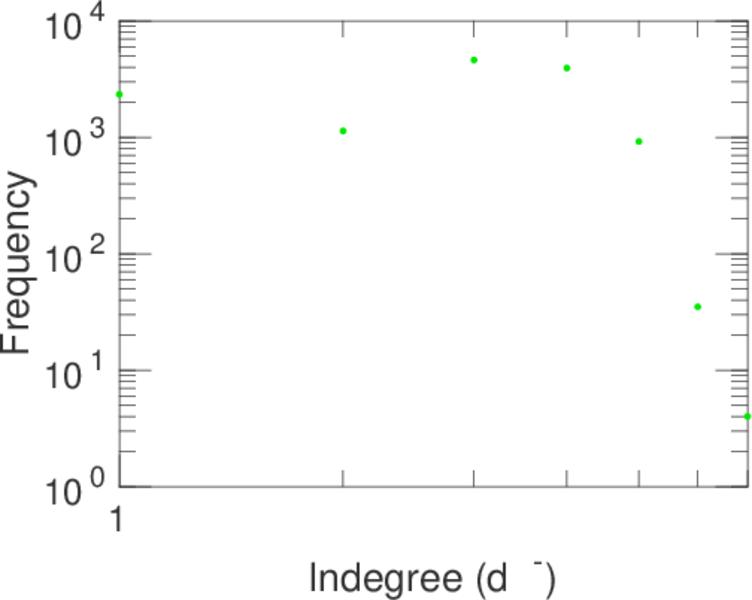
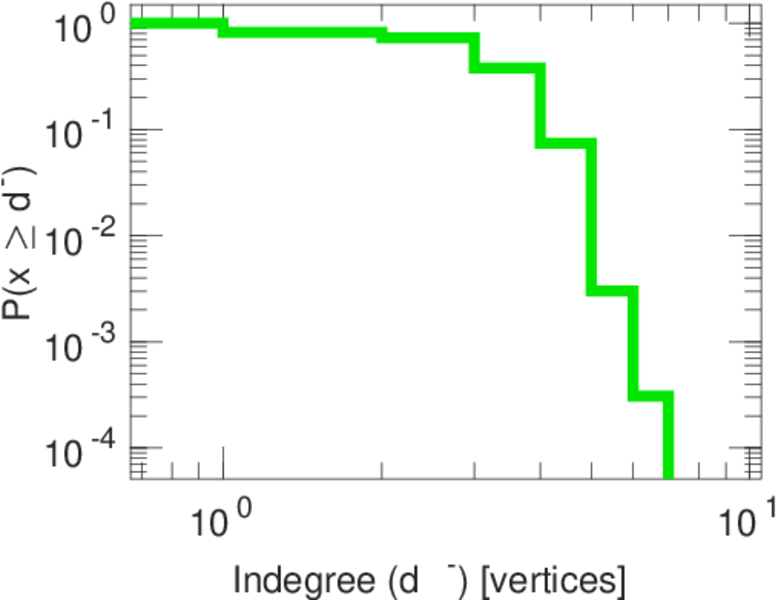
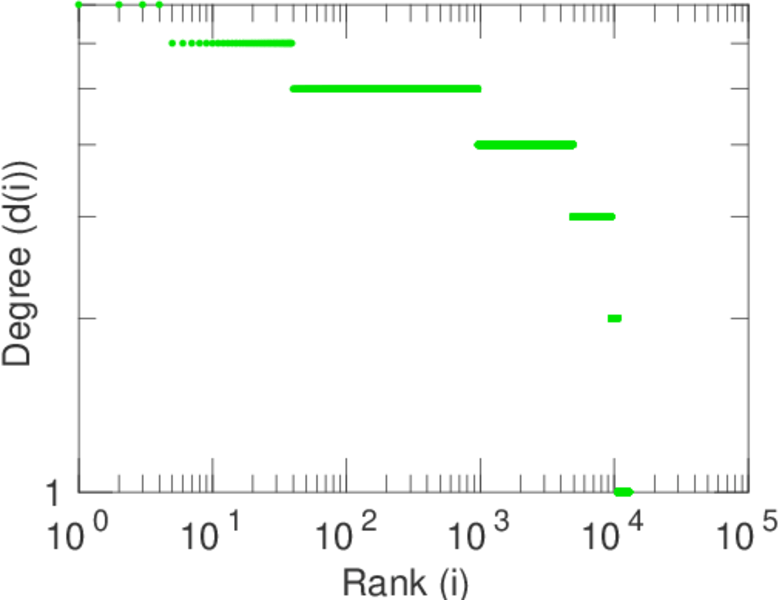
| Maximum indegree | d−max = | 7
|
| Average degree | d = | 6.011 09
|
| Fill | p = | 0.000 231 641
|
| Size of LCC | N = | 12,979
|
| Size of LSCC | Ns = | 12,978
|
| Relative size of LSCC | Nrs = | 0.999 692
|
| Diameter | δ = | 106
|
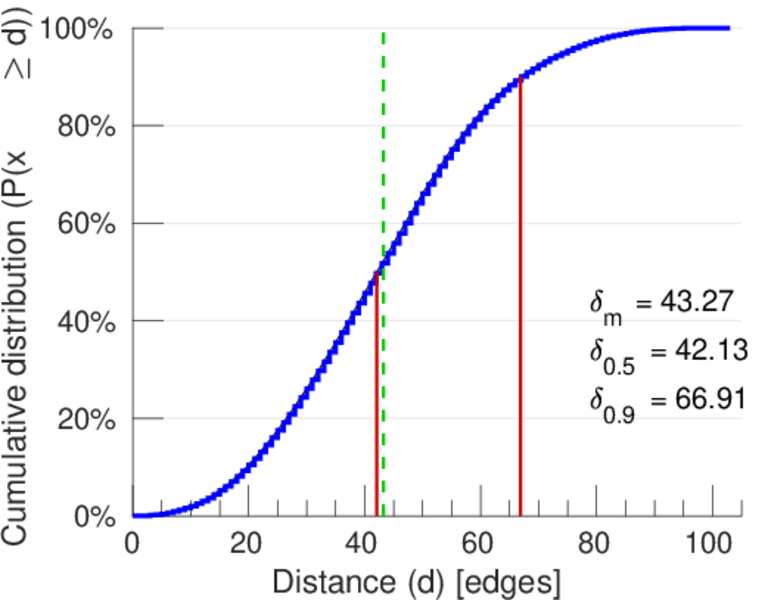
| 50-Percentile effective diameter | δ0.5 = | 42.128 0
|
| 90-Percentile effective diameter | δ0.9 = | 66.912 8
|
| Median distance | δM = | 43
|
| Mean distance | δm = | 43.265 7
|
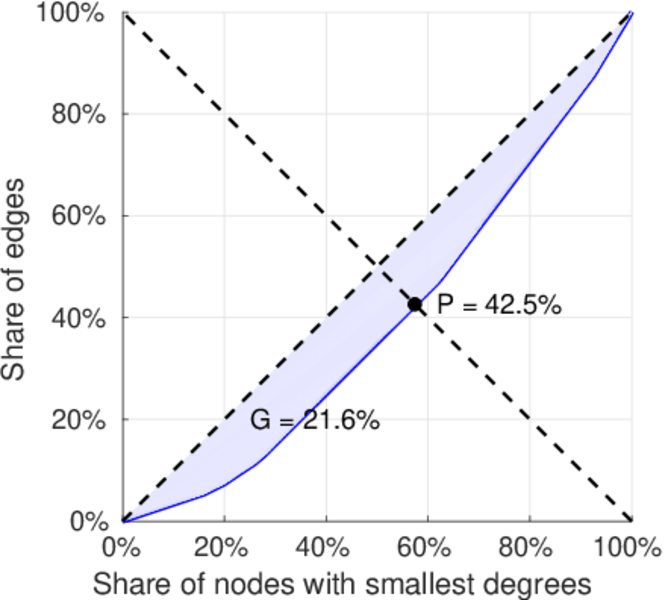
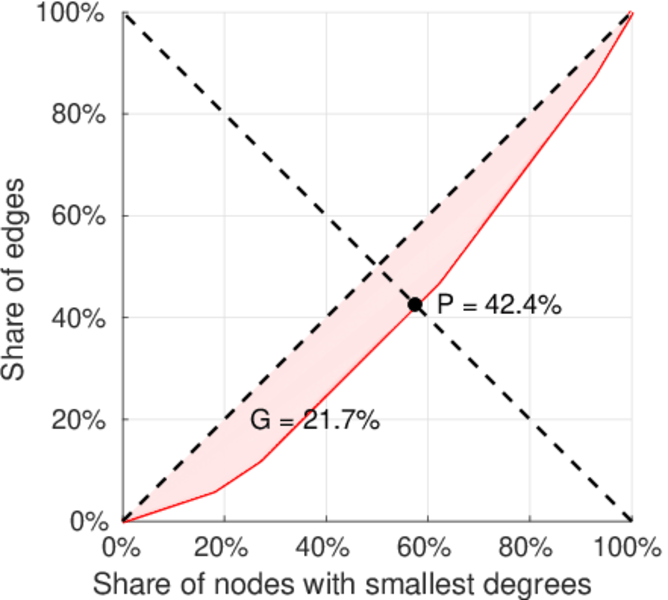
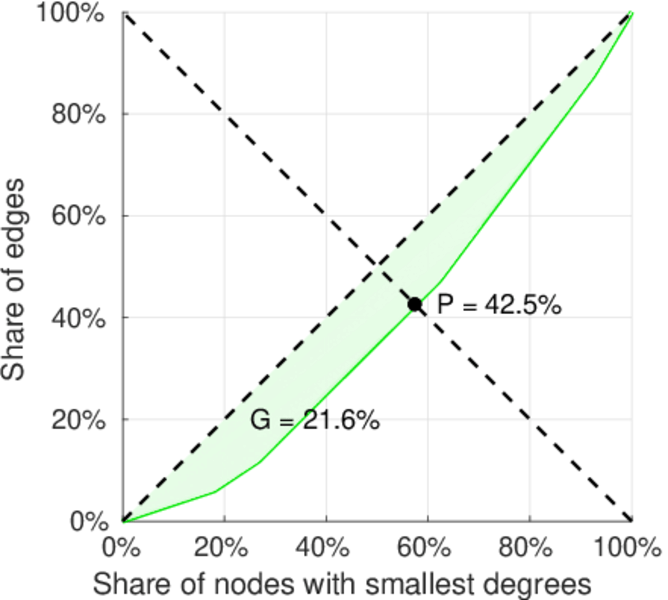
| Gini coefficient | G = | 0.216 238
|
| Balanced inequality ratio | P = | 0.424 573
|
| Outdegree balanced inequality ratio | P+ = | 0.424 266
|
| Indegree balanced inequality ratio | P− = | 0.424 727
|
| Relative edge distribution entropy | Her = | 0.990 770
|
| Power law exponent | γ = | 1.938 81
|
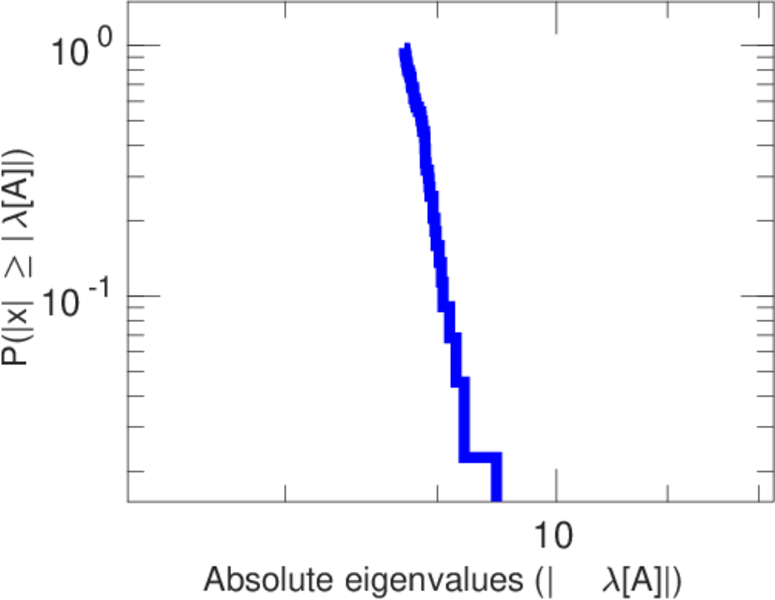
| Tail power law exponent | γt = | 8.581 00
|
| Tail power law exponent with p | γ3 = | 8.581 00
|
| p-value | p = | 0.000 00
|
| Outdegree tail power law exponent with p | γ3,o = | 8.541 00
|
| Outdegree p-value | po = | 0.000 00
|
| Indegree tail power law exponent with p | γ3,i = | 8.531 00
|
| Indegree p-value | pi = | 0.000 00
|
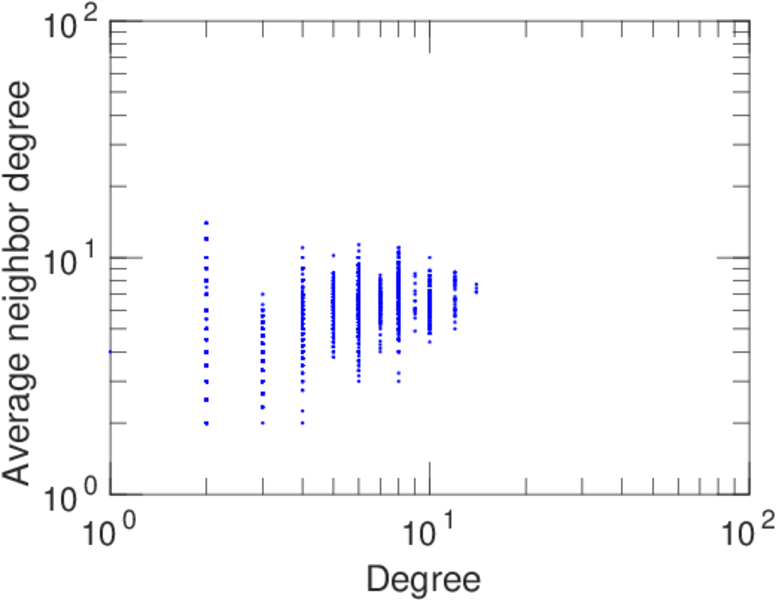
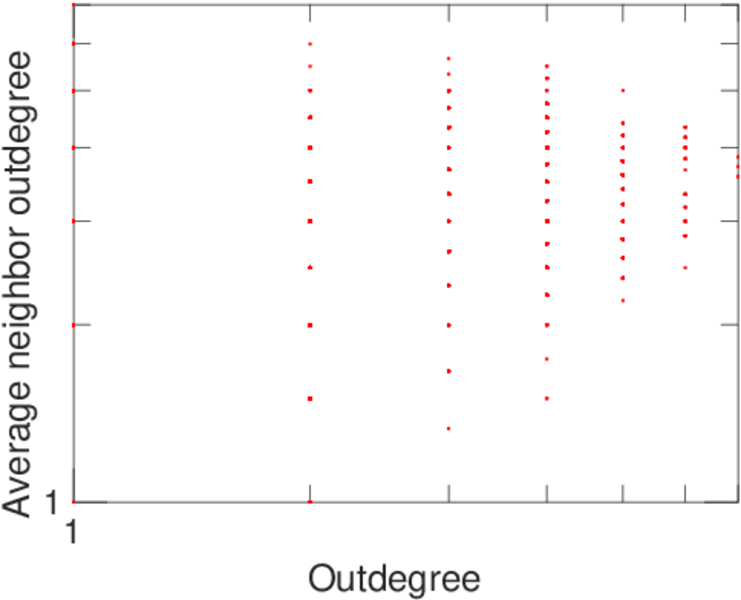
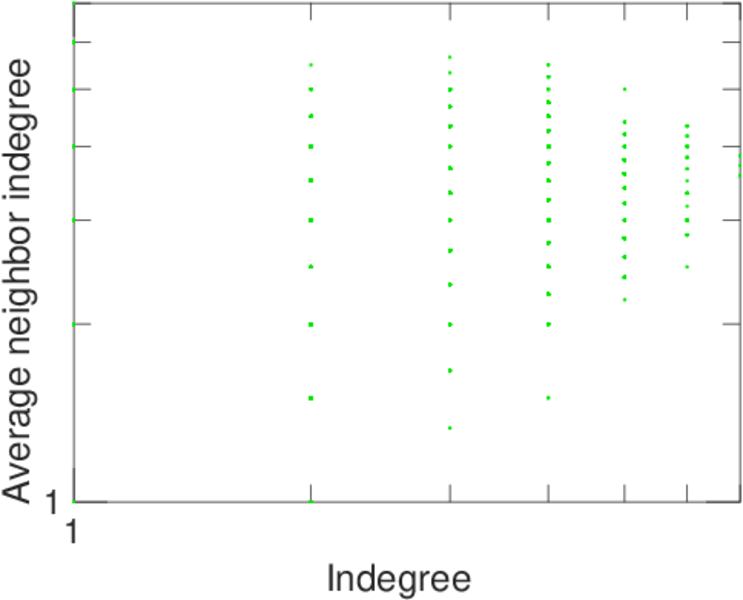
| Degree assortativity | ρ = | −0.119 111
|
| Degree assortativity p-value | pρ = | 3.316 99 × 10−130
|
| In/outdegree correlation | ρ± = | +0.960 178
|
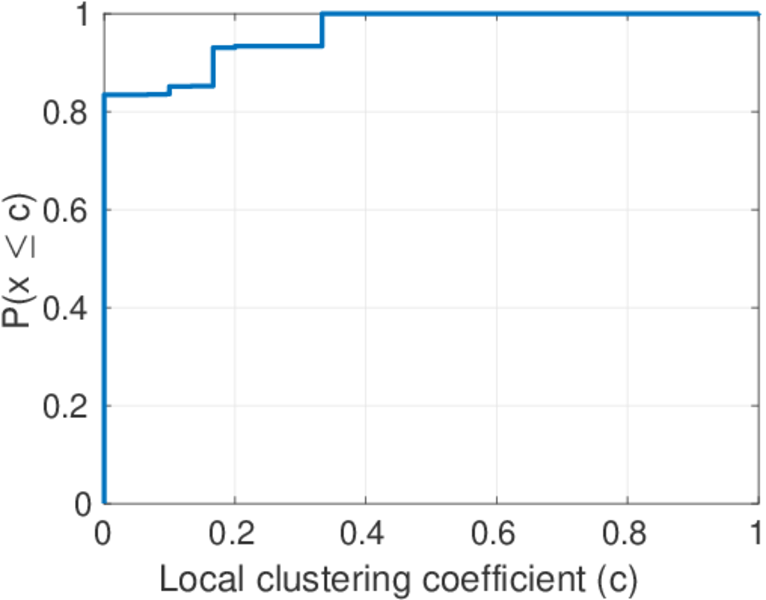
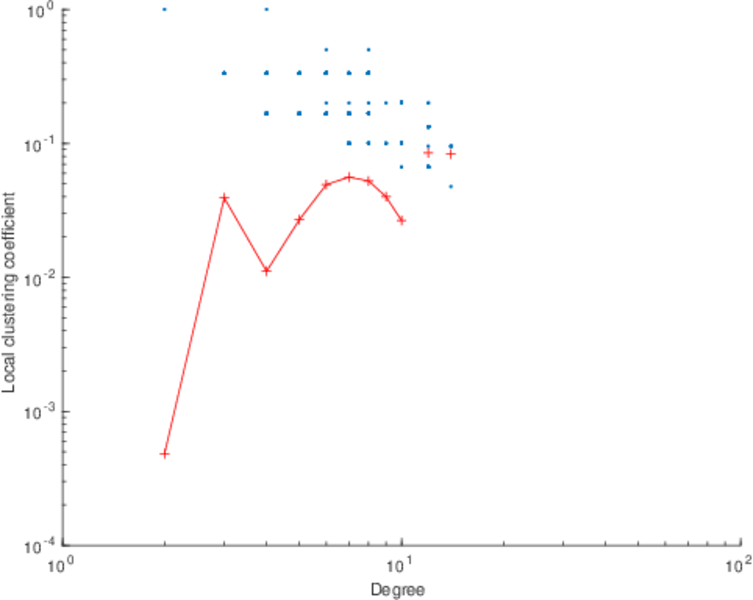
| Clustering coefficient | c = | 0.045 546 0
|
| Directed clustering coefficient | c± = | 0.045 312 4
|
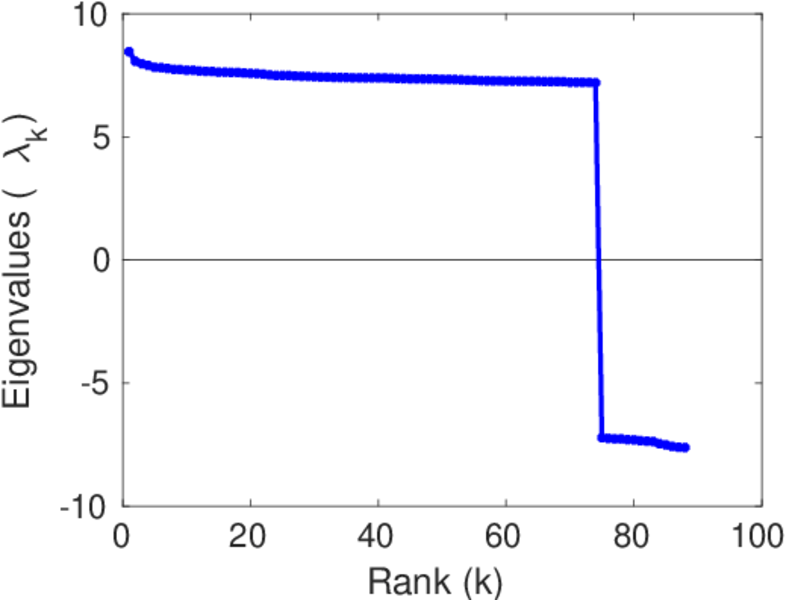
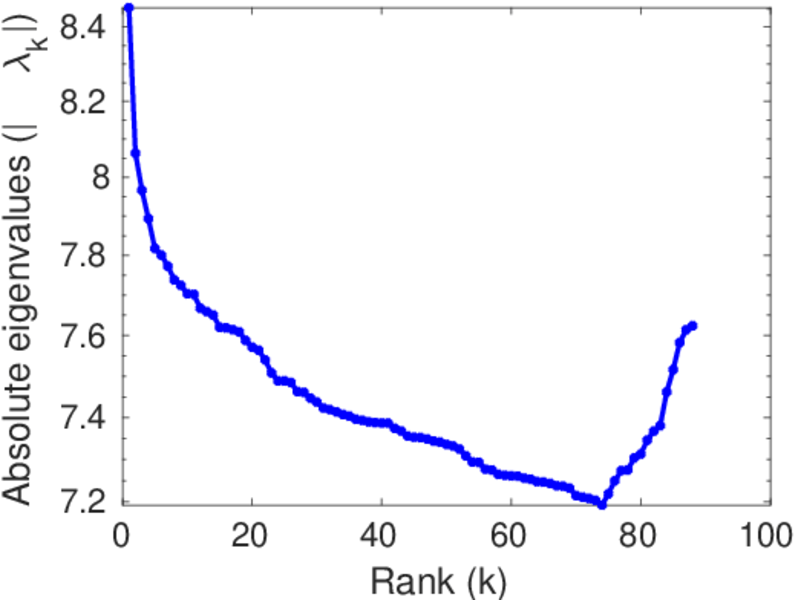
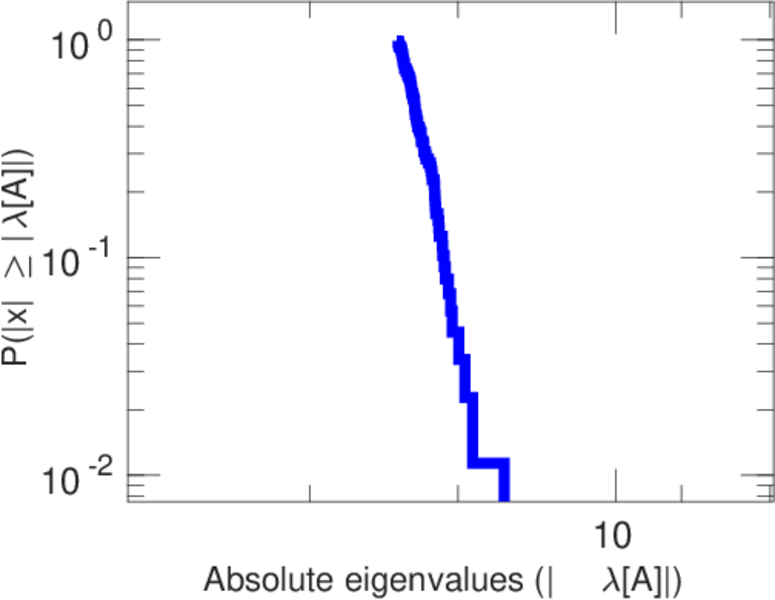
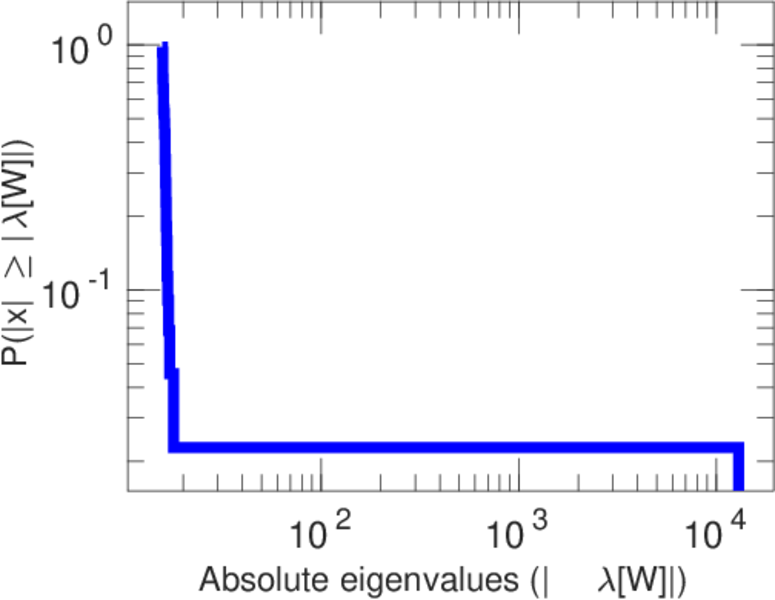
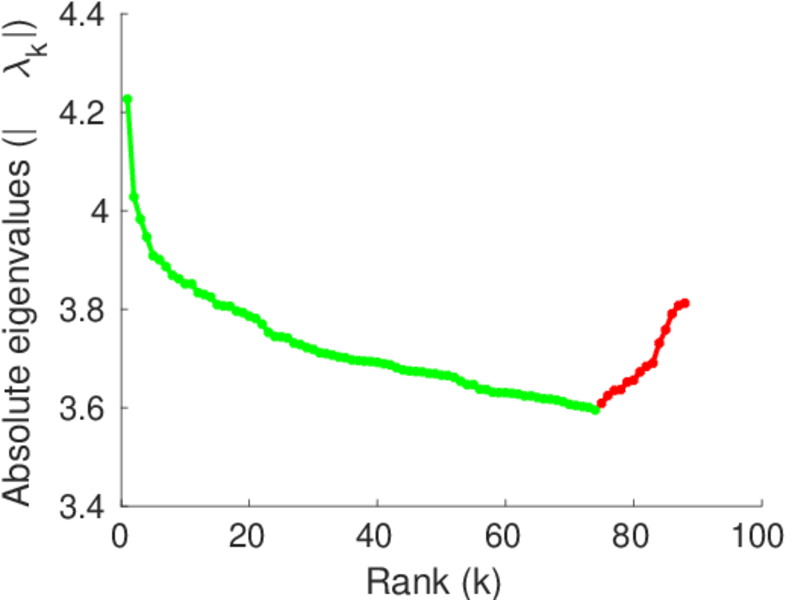
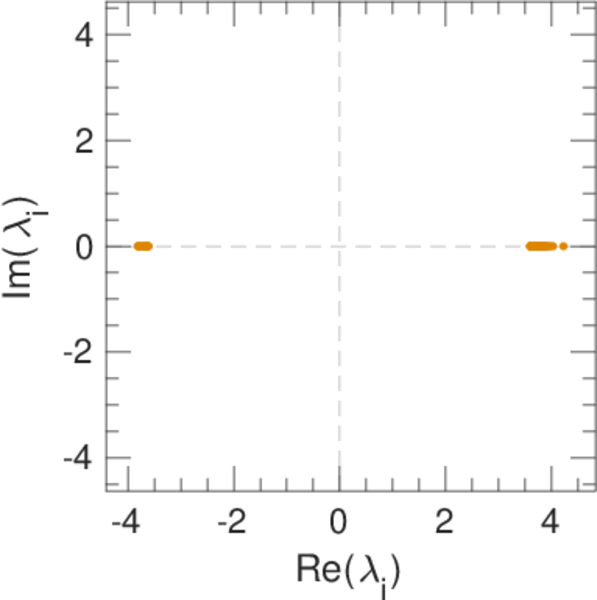
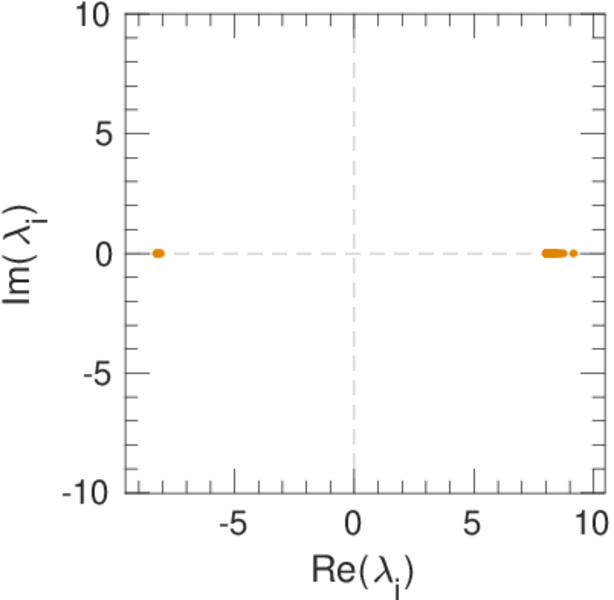
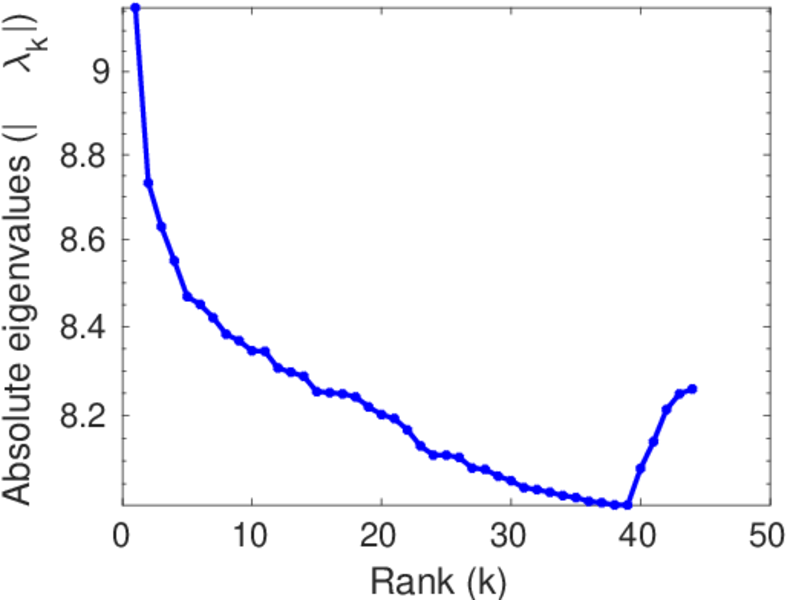
| Spectral norm | α = | 8.453 35
|
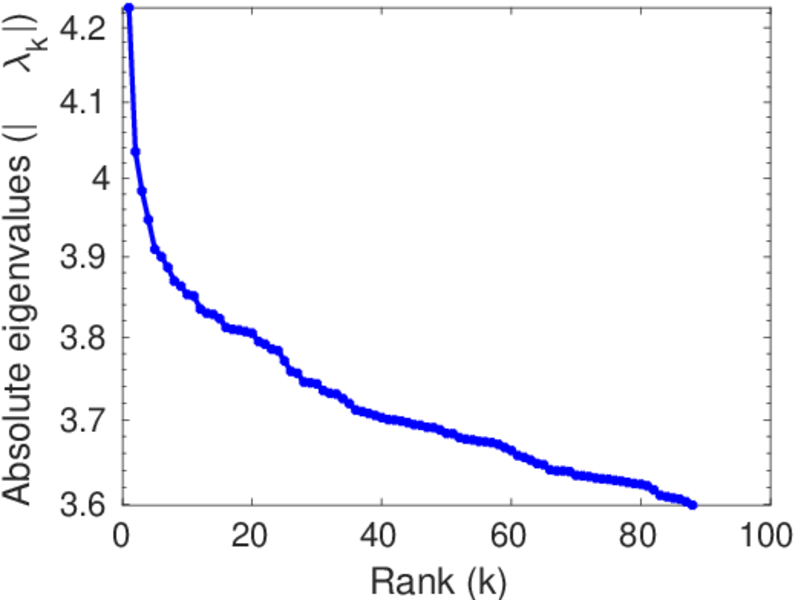
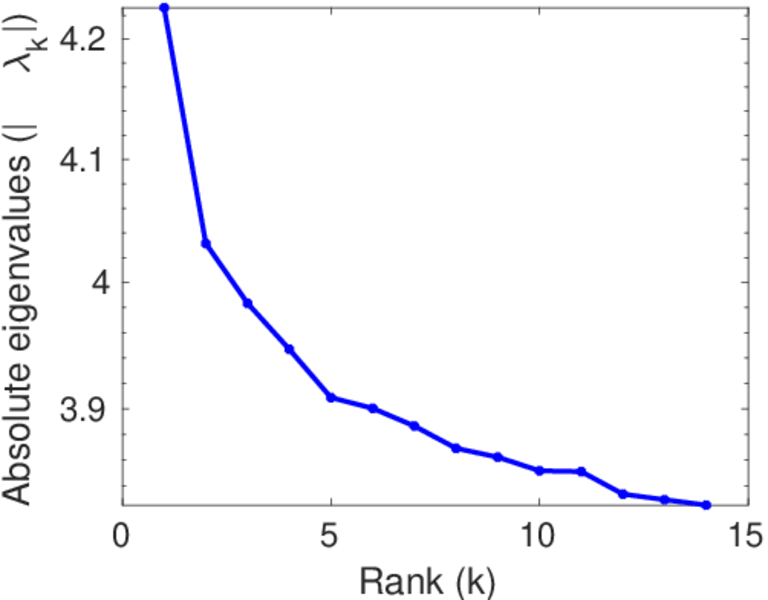
| Operator 2-norm | ν = | 4.227 22
|
| Cyclic eigenvalue | π = | 4.226 24
|
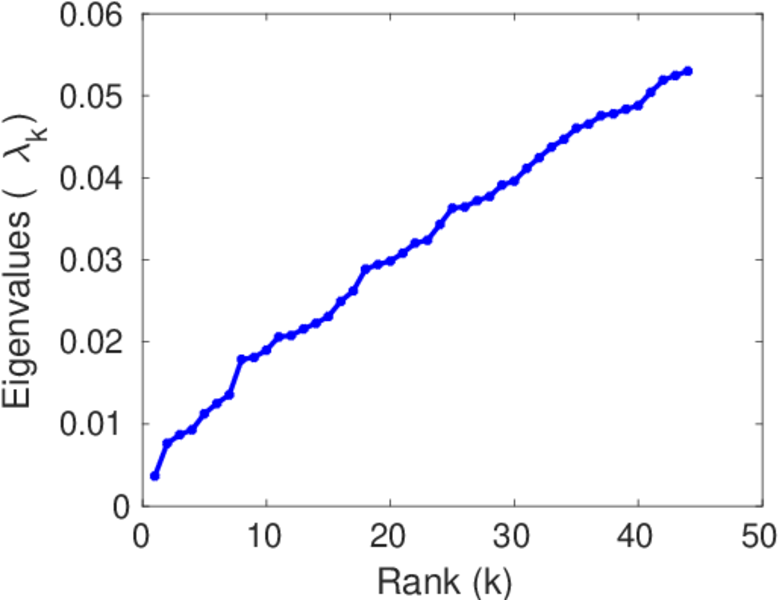
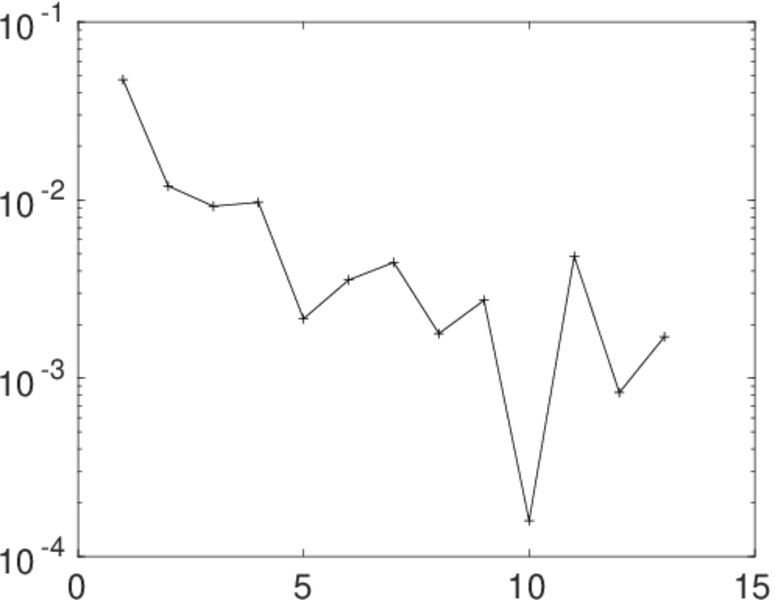
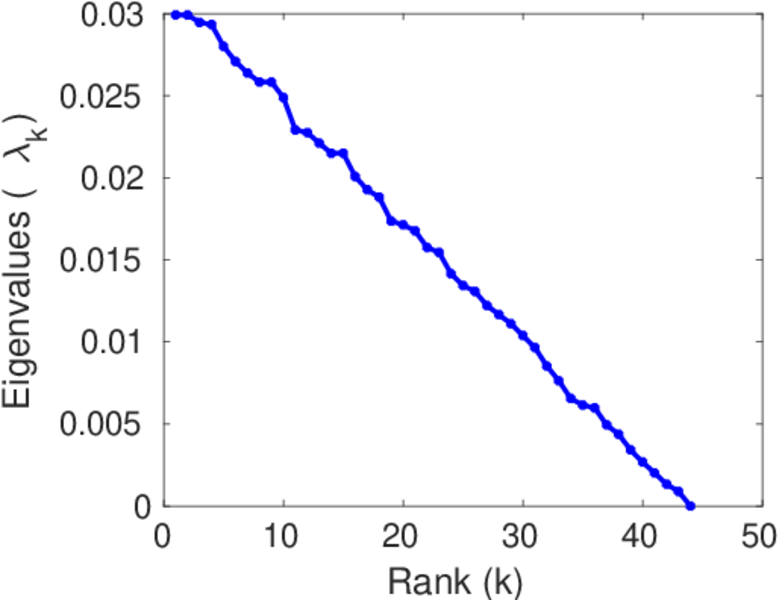
| Algebraic connectivity | a = | 0.000 795 844
|
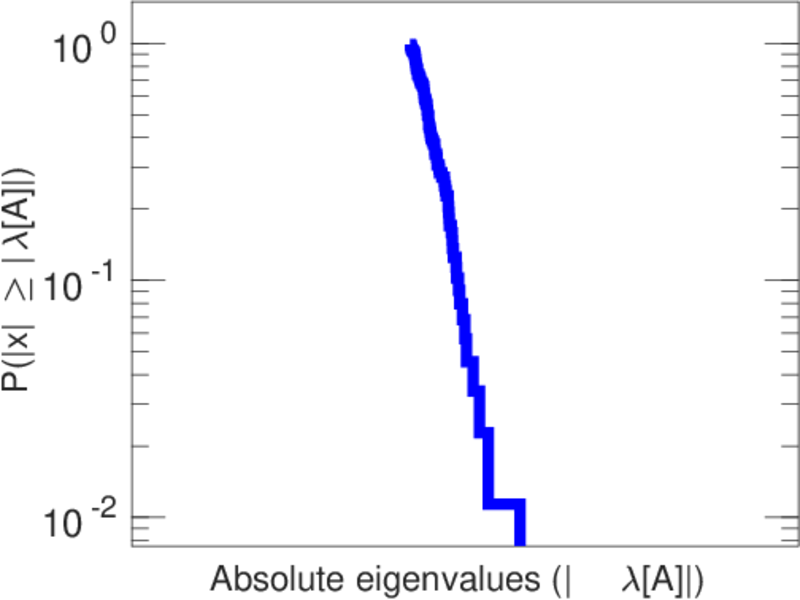
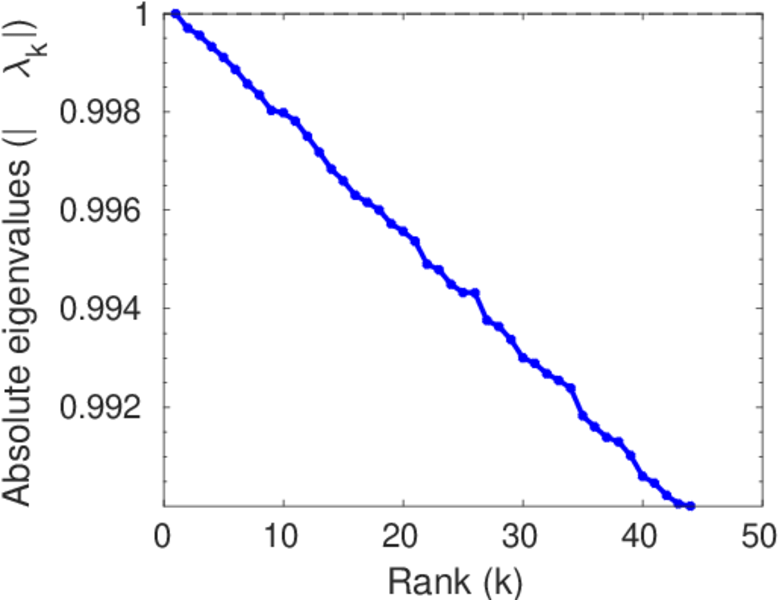
| Spectral separation | |λ1[A] / λ2[A]| = | 1.048 43
|
| Reciprocity | y = | 0.942 693
|
| Non-bipartivity | bA = | 0.098 109 0
|
| Normalized non-bipartivity | bN = | 0.022 914 0
|
| Algebraic non-bipartivity | χ = | 0.051 149 7
|
| Spectral bipartite frustration | bK = | 0.004 023 08
|
| Controllability | C = | 1,060
|
| Relative controllability | Cr = | 0.081 670 4
|
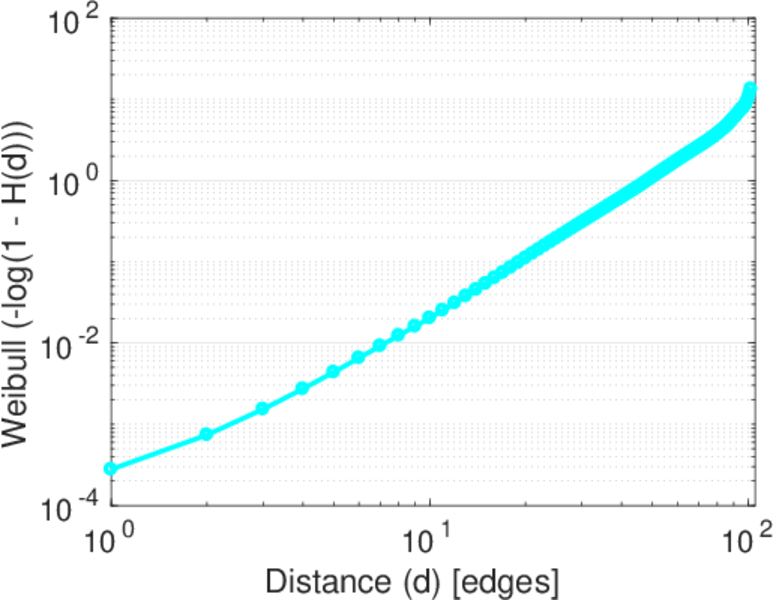
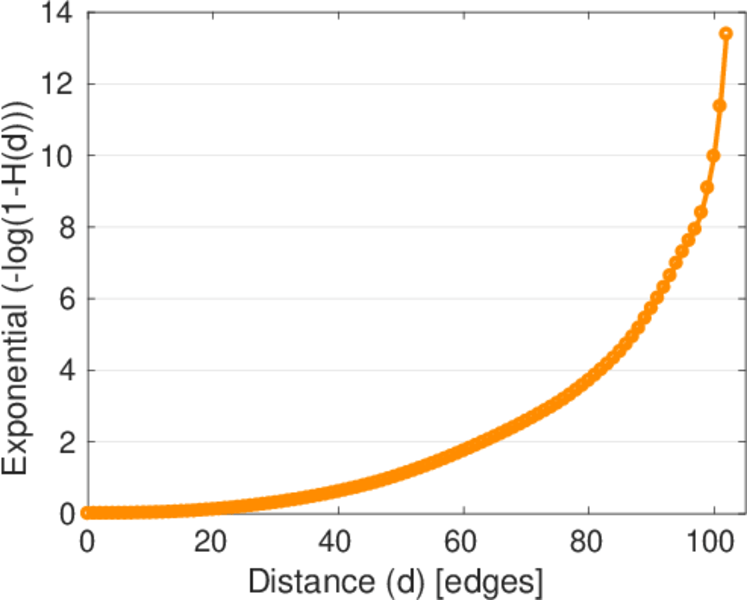
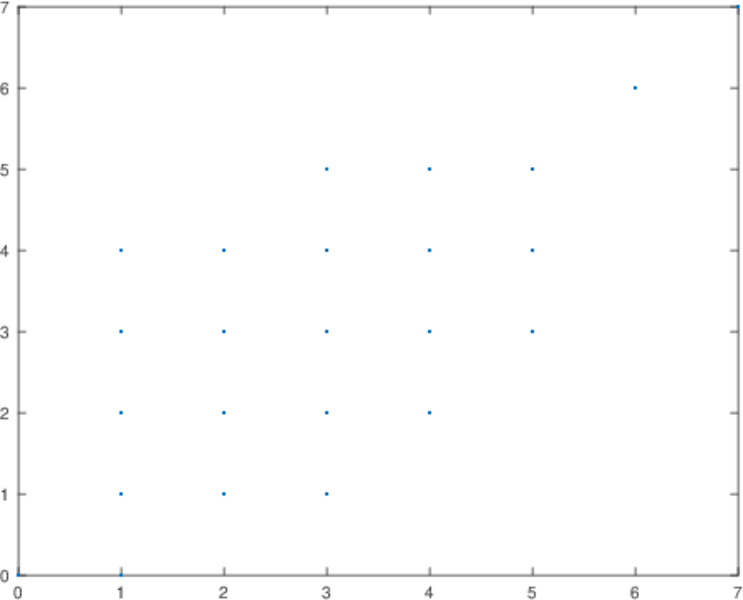
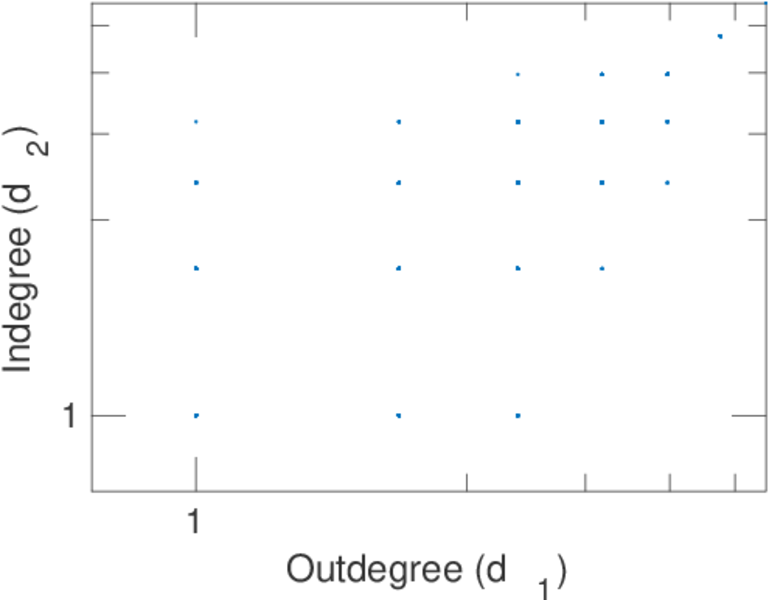
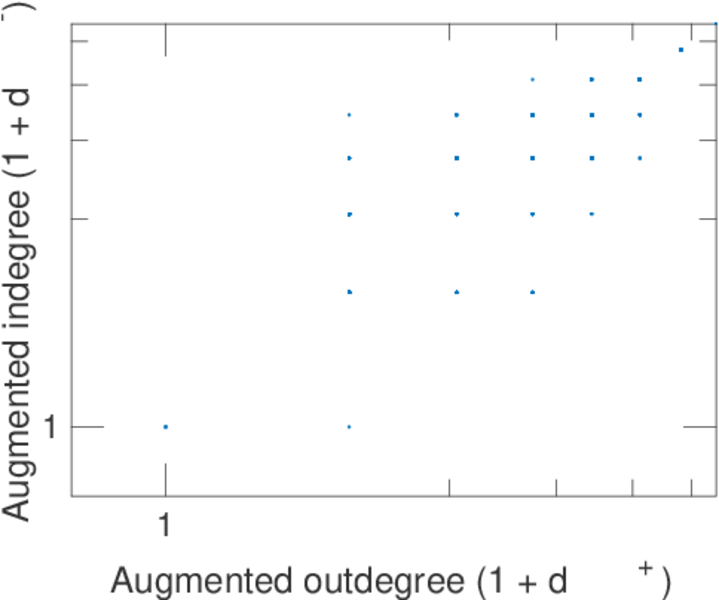
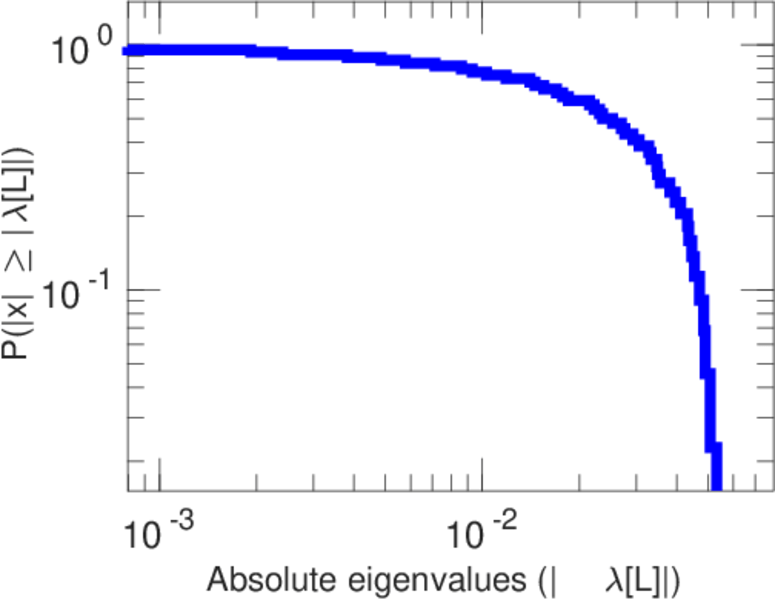
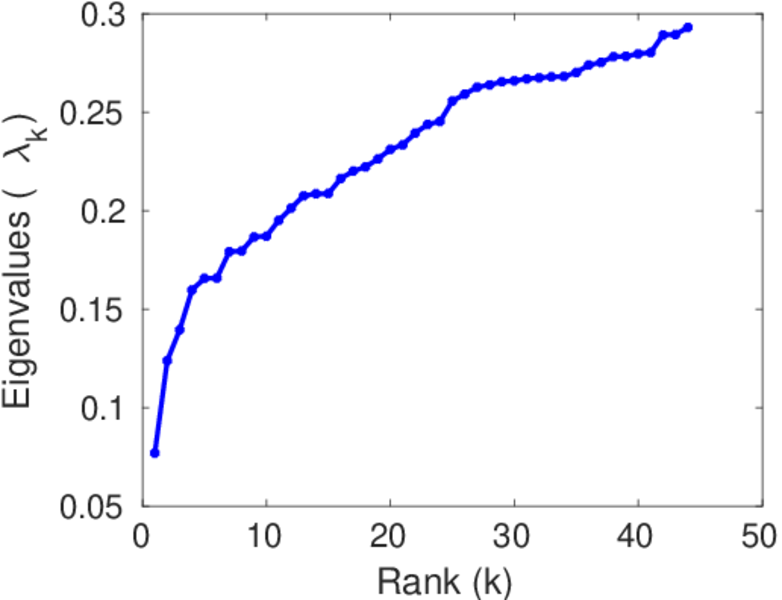
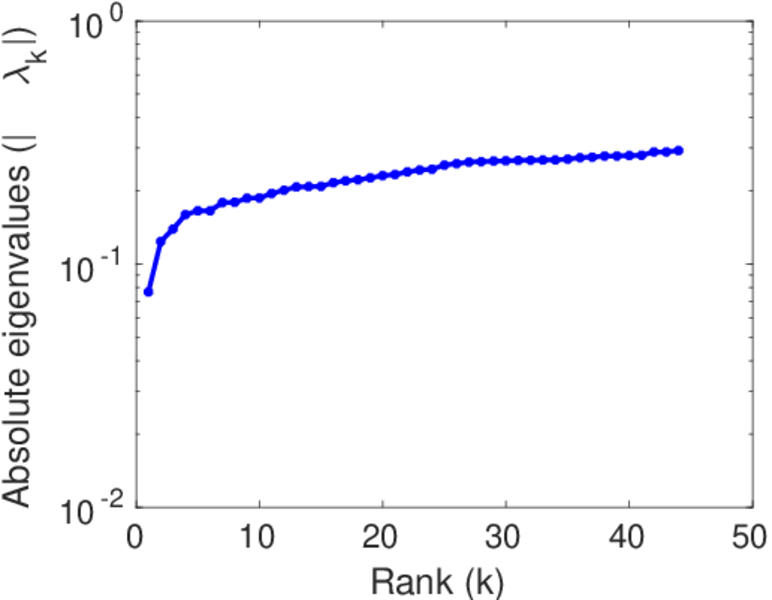
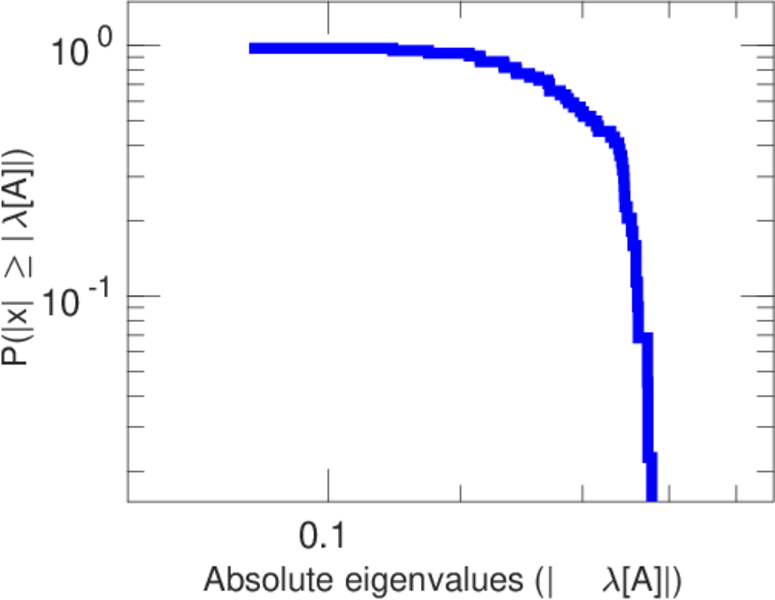
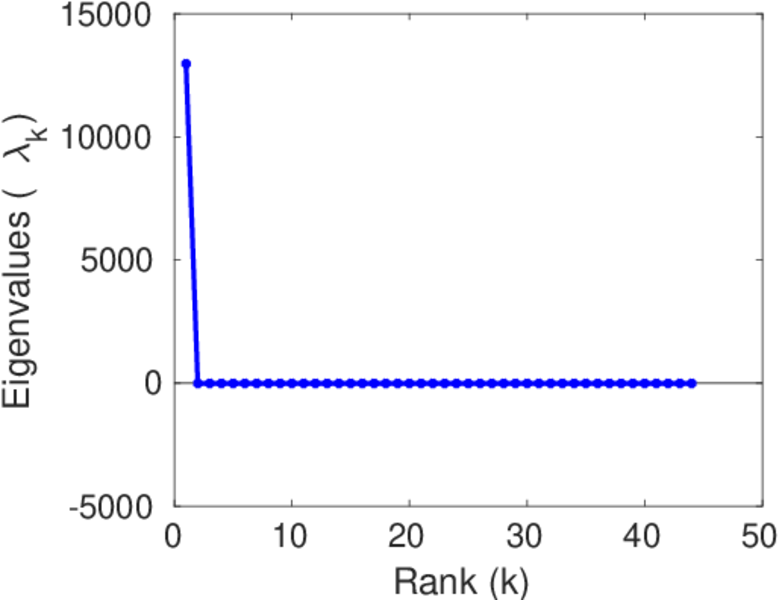
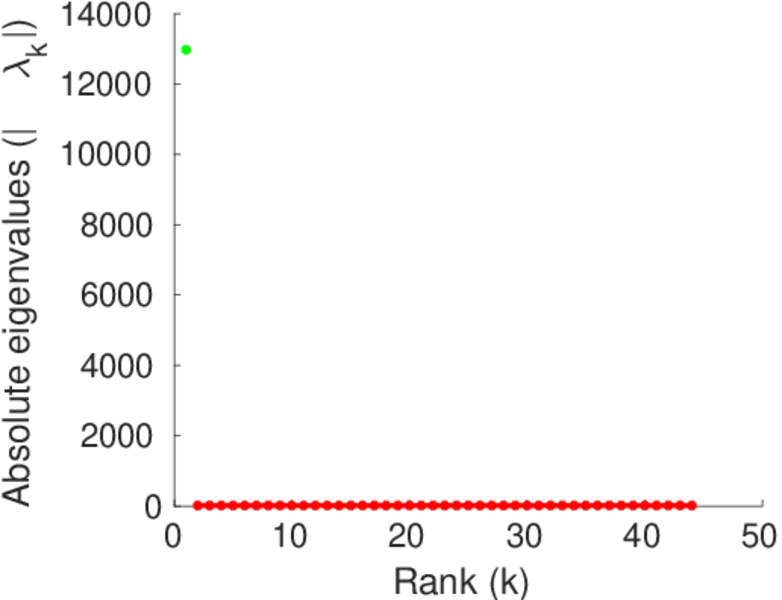
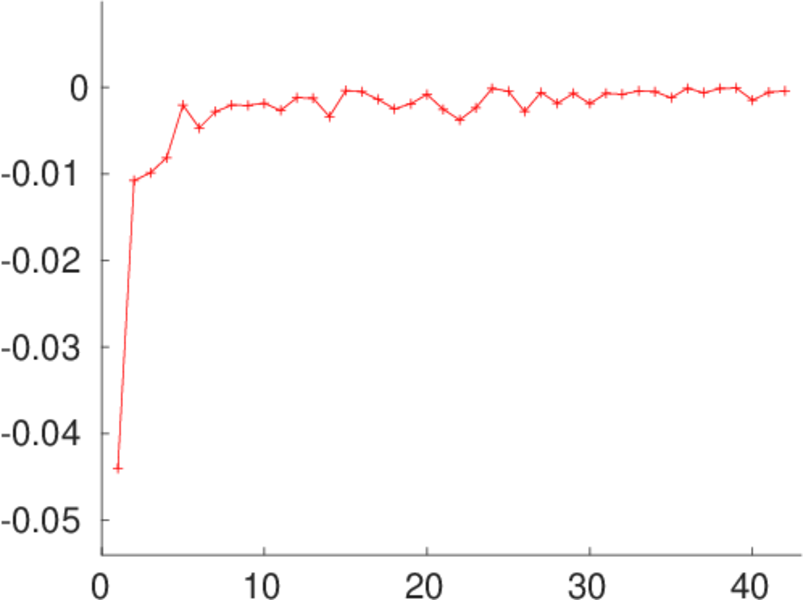
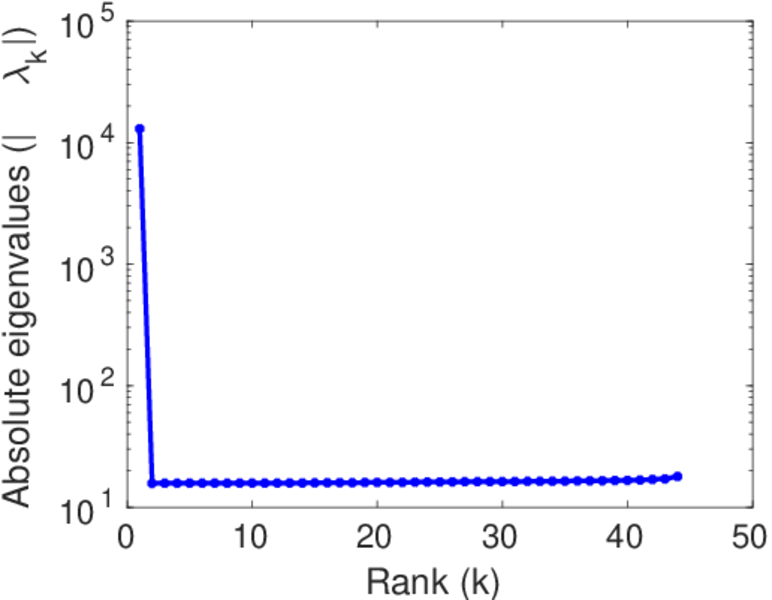
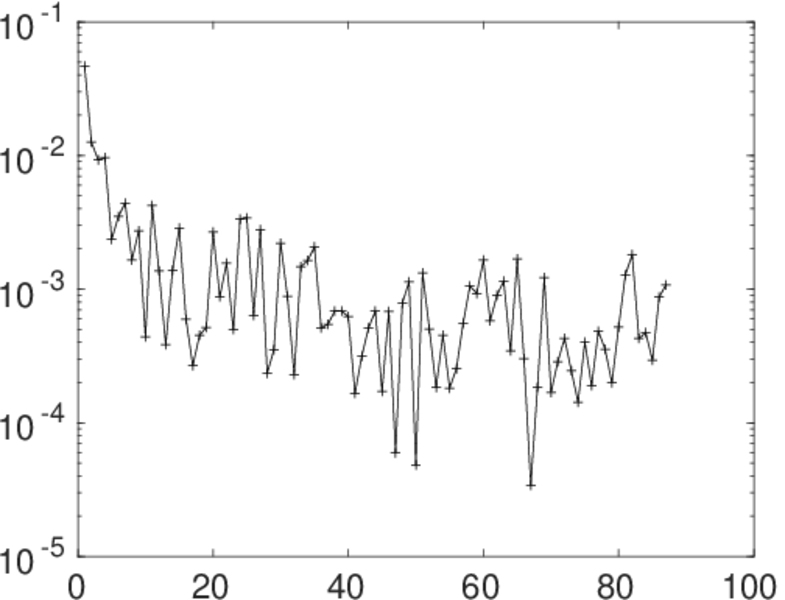
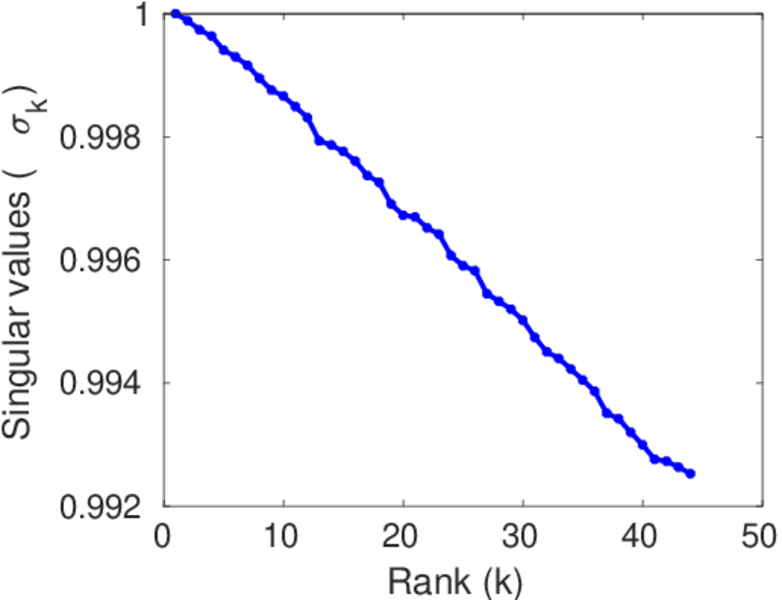
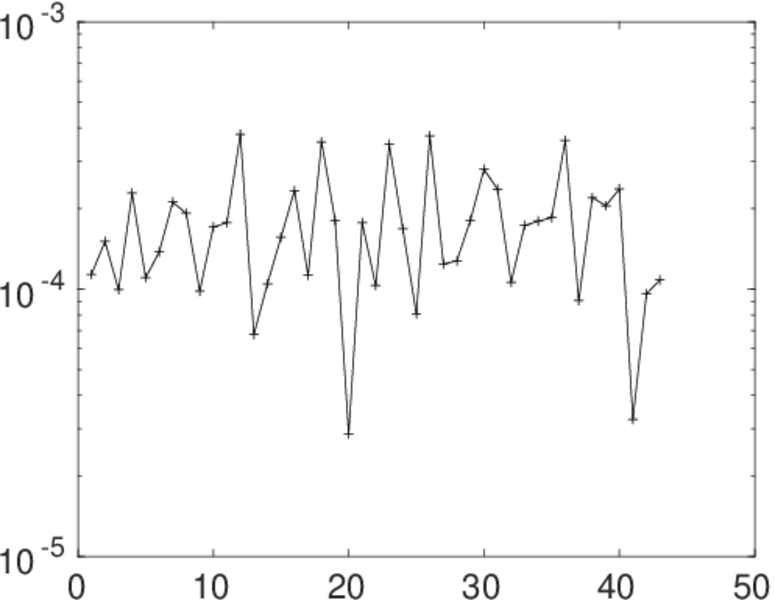
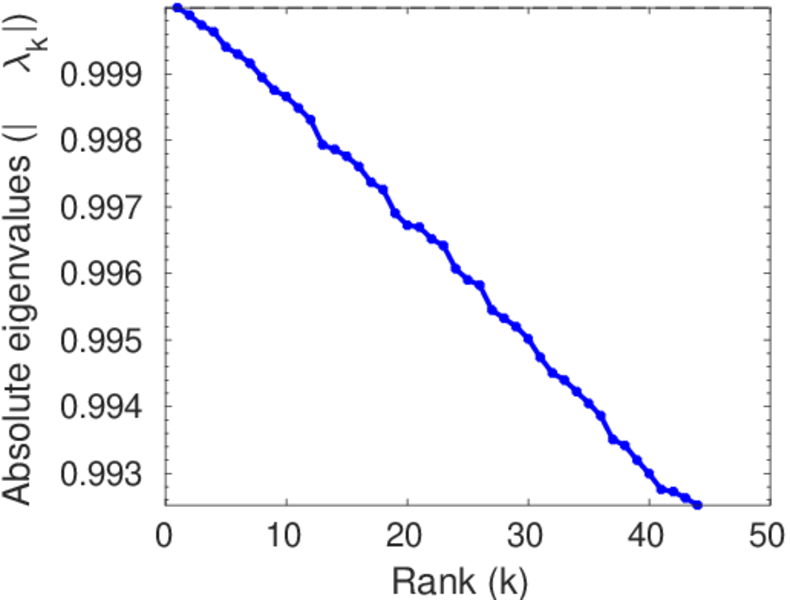
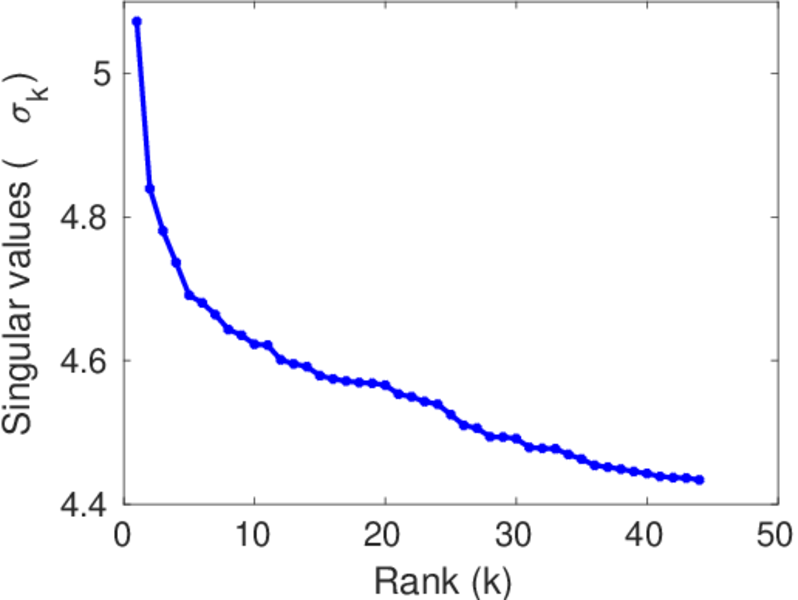
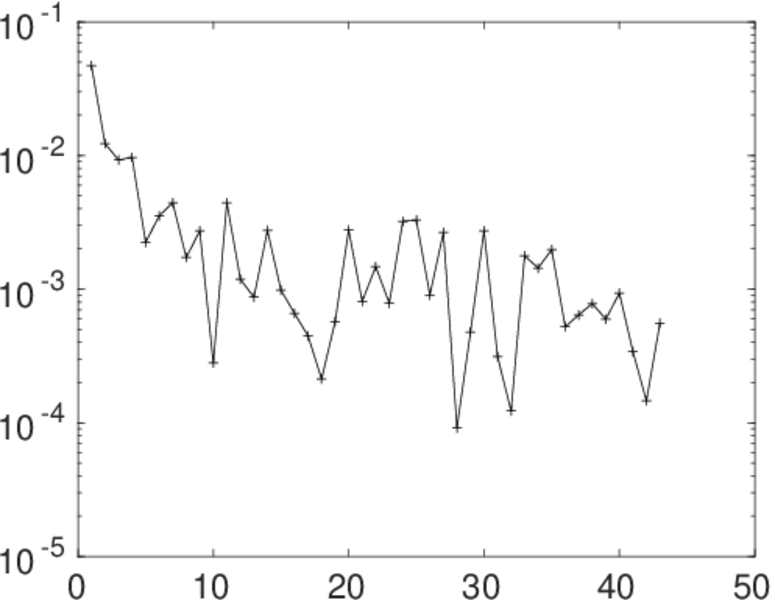
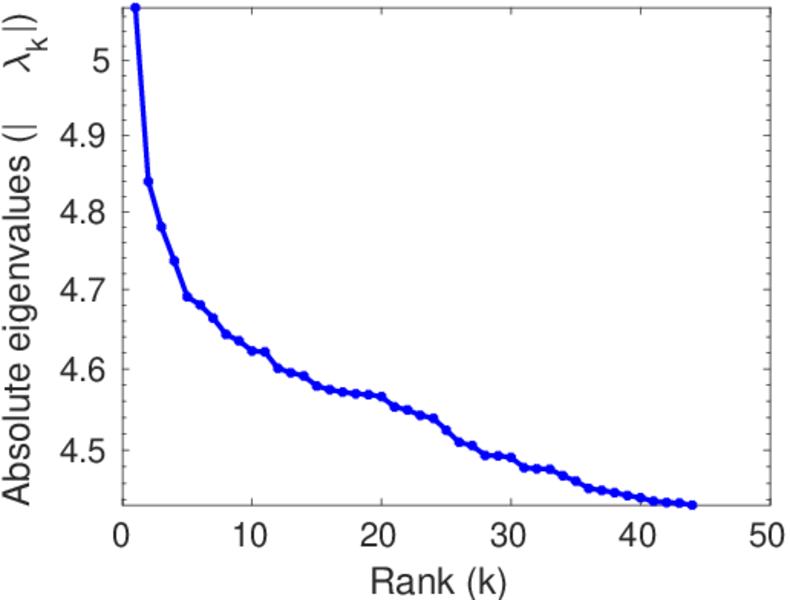
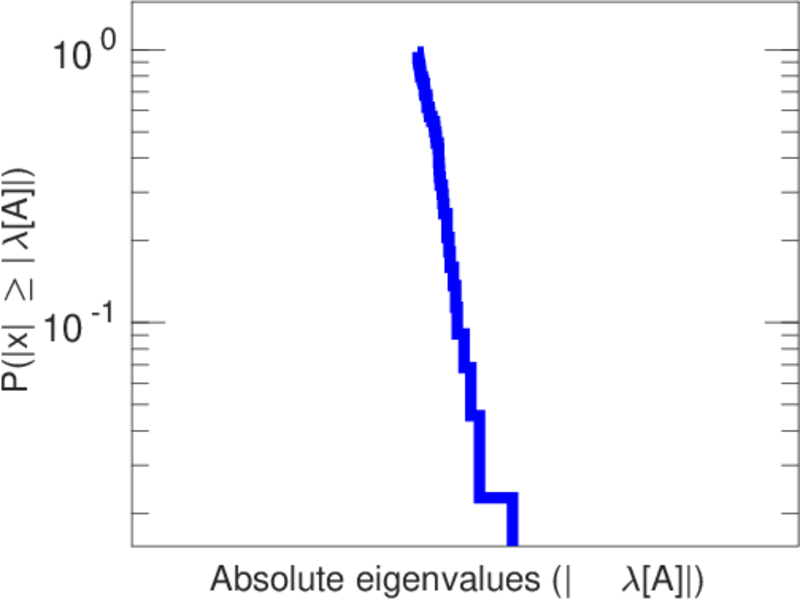
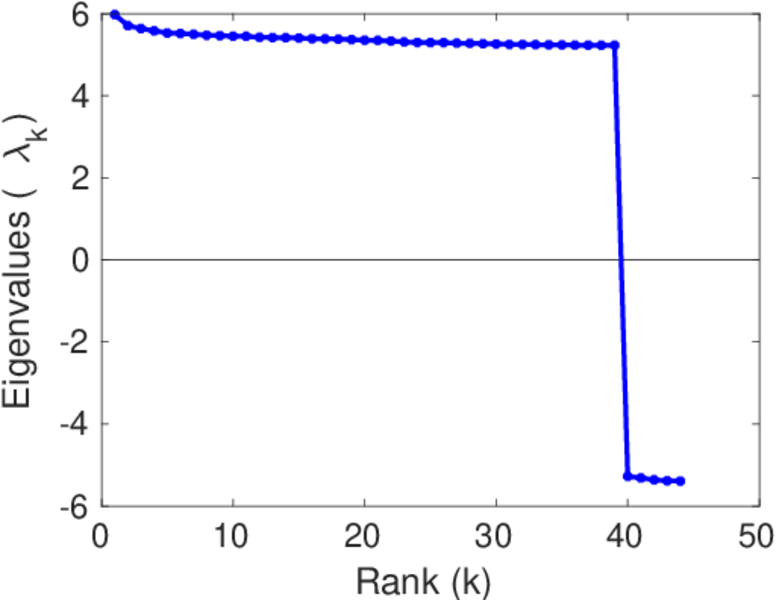
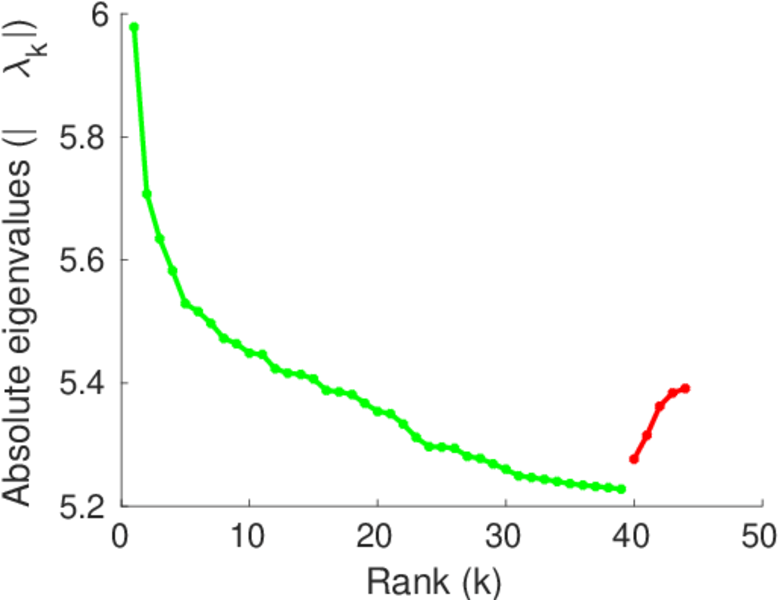
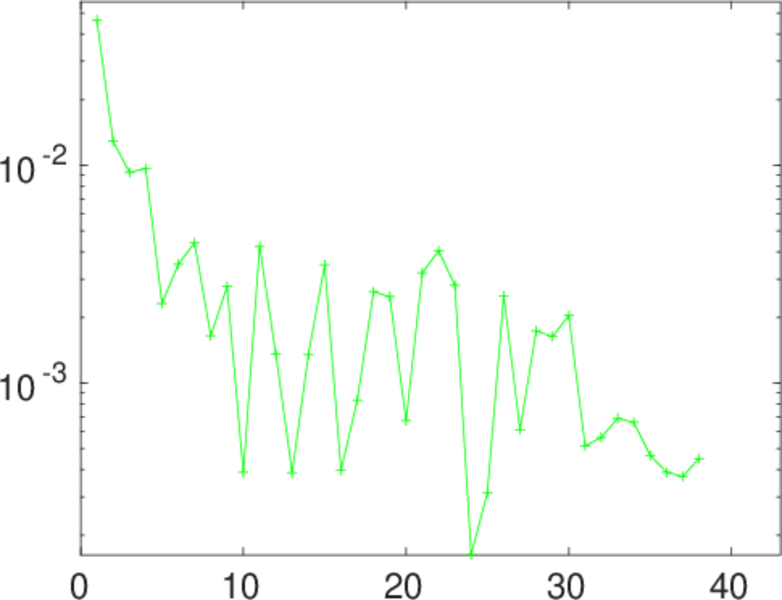
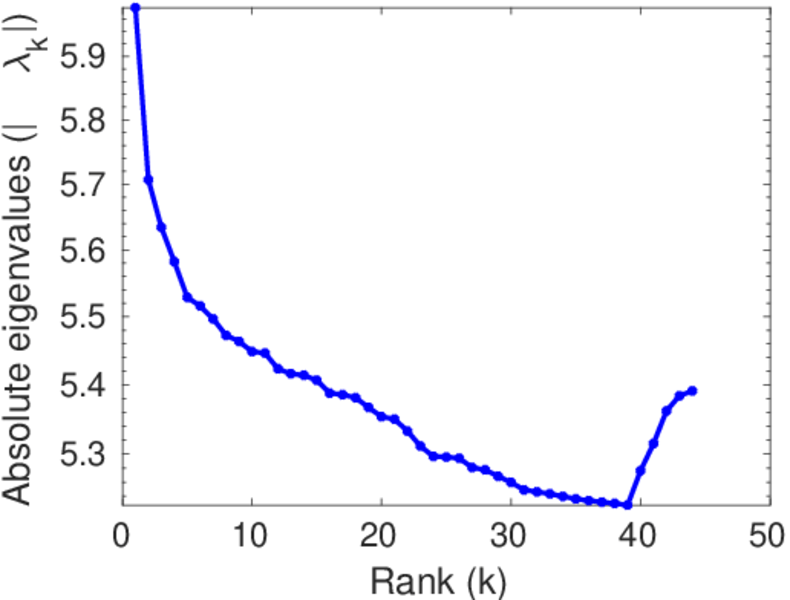
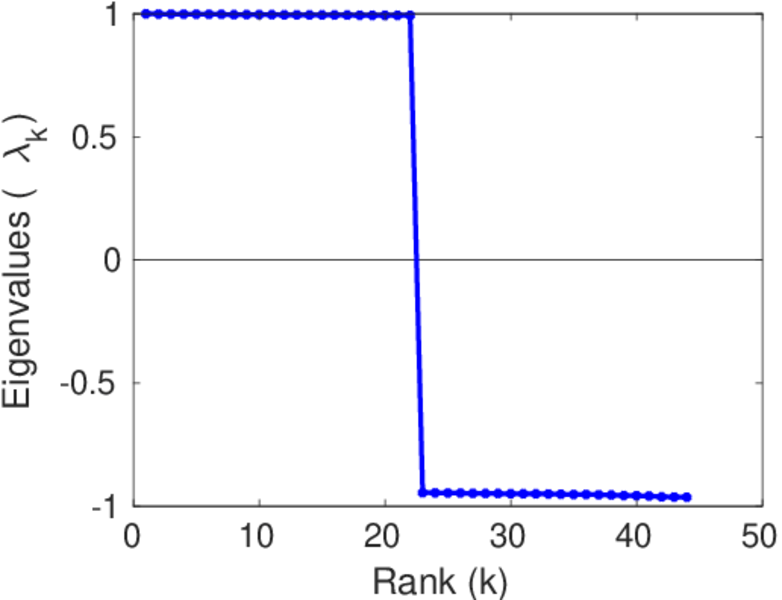
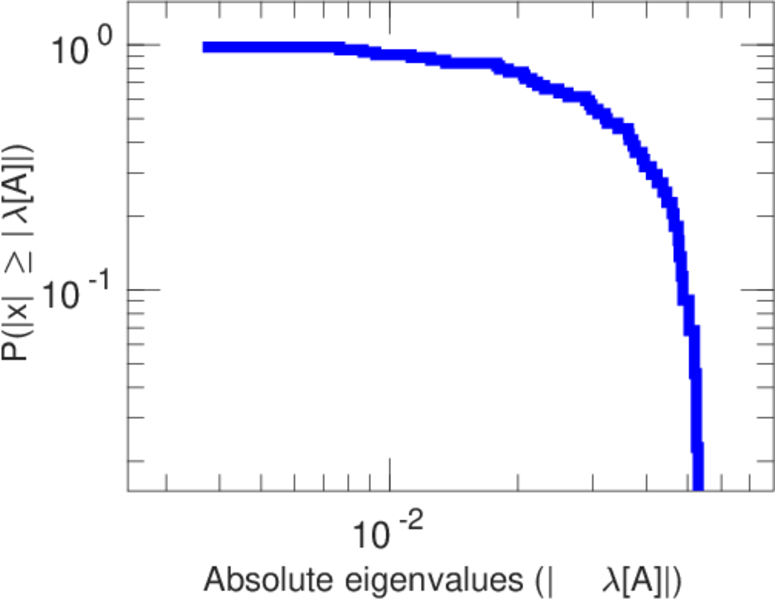
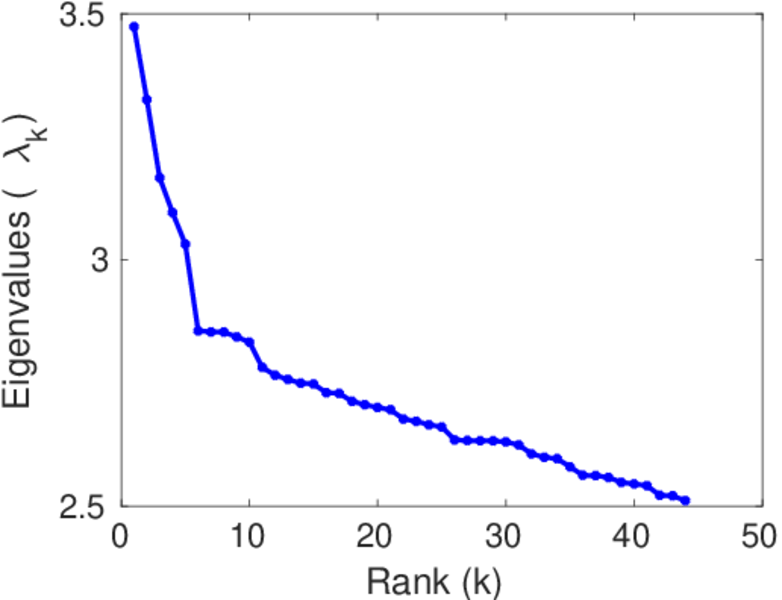
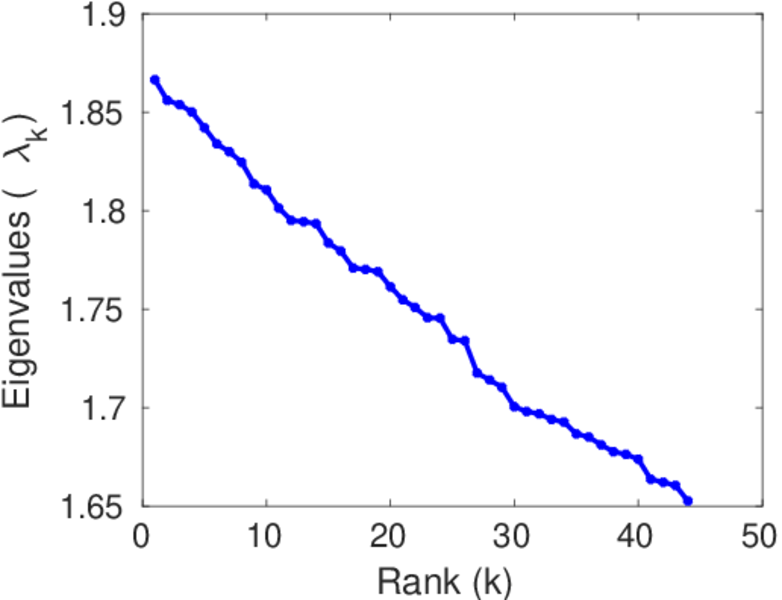
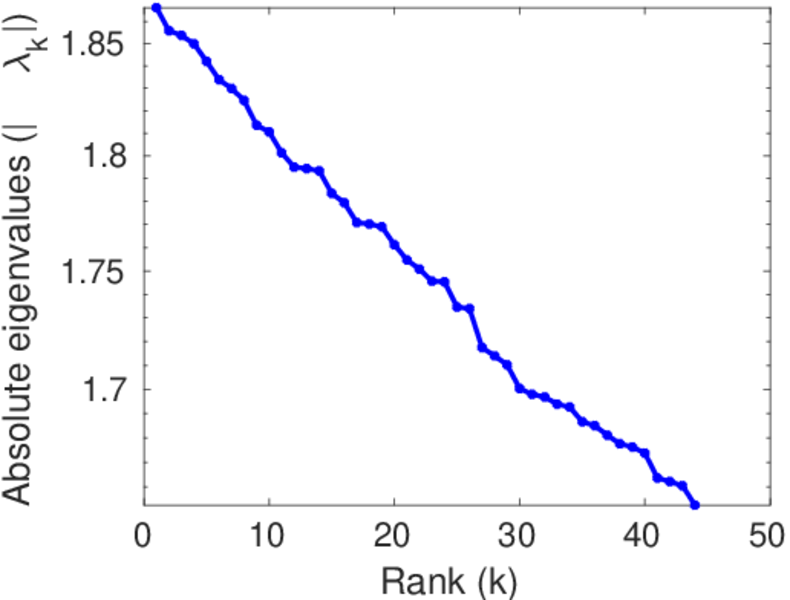
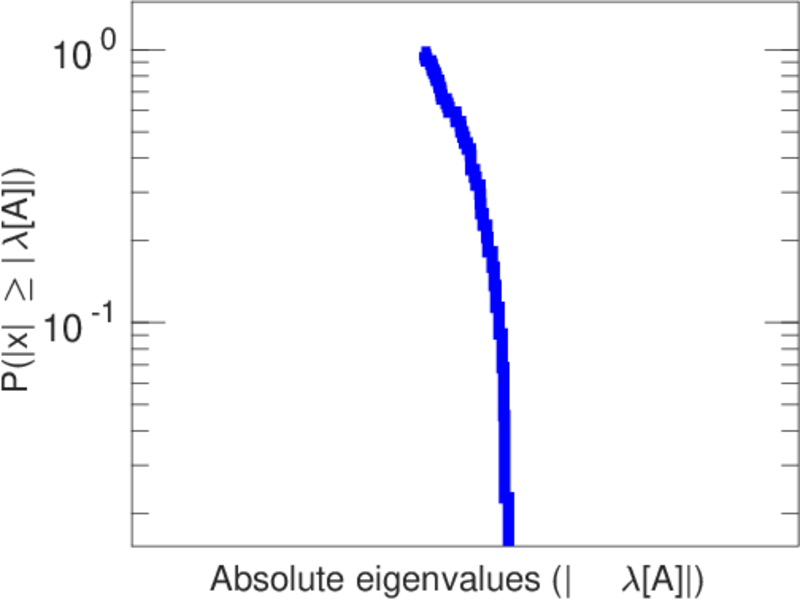
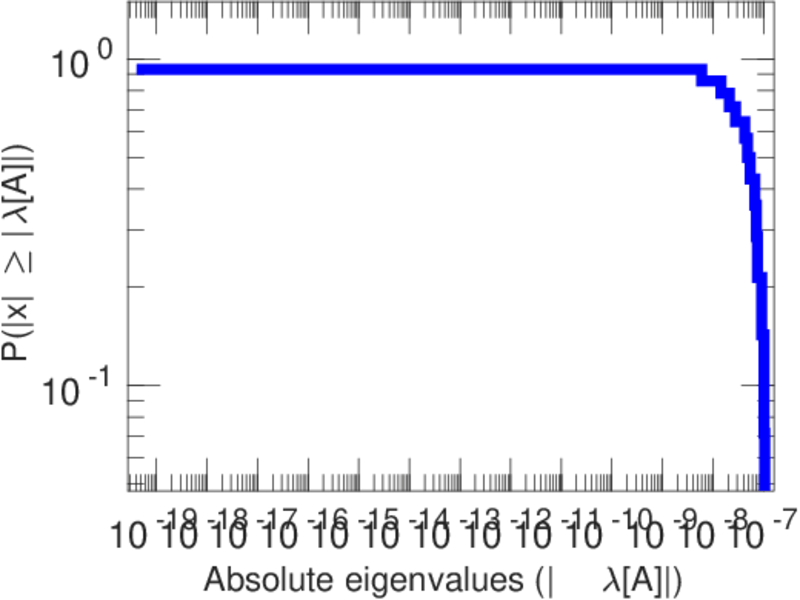
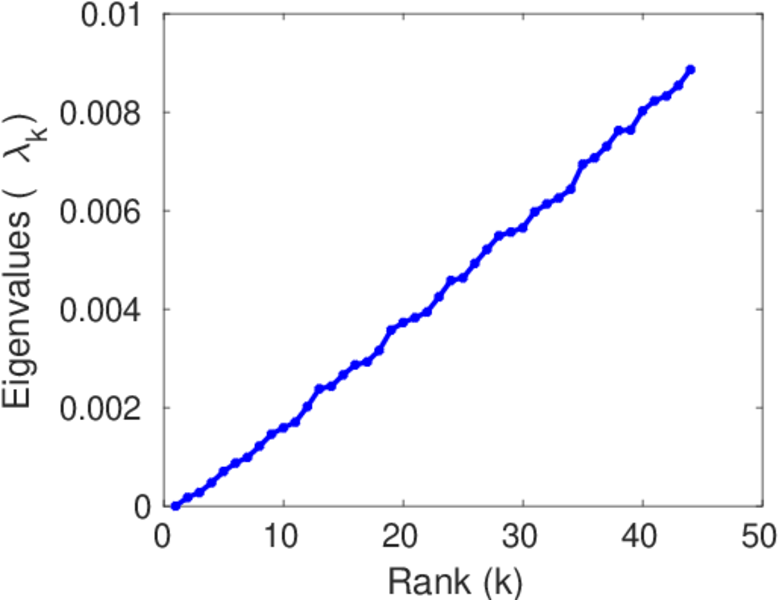
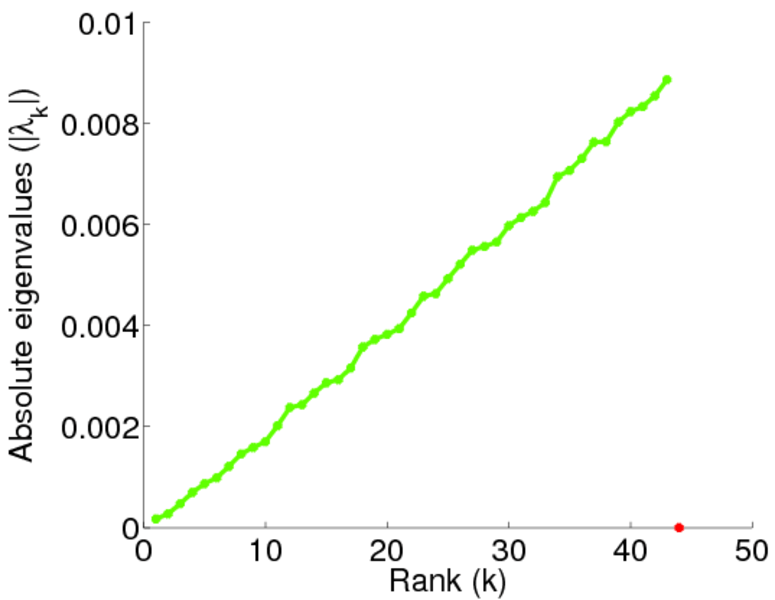
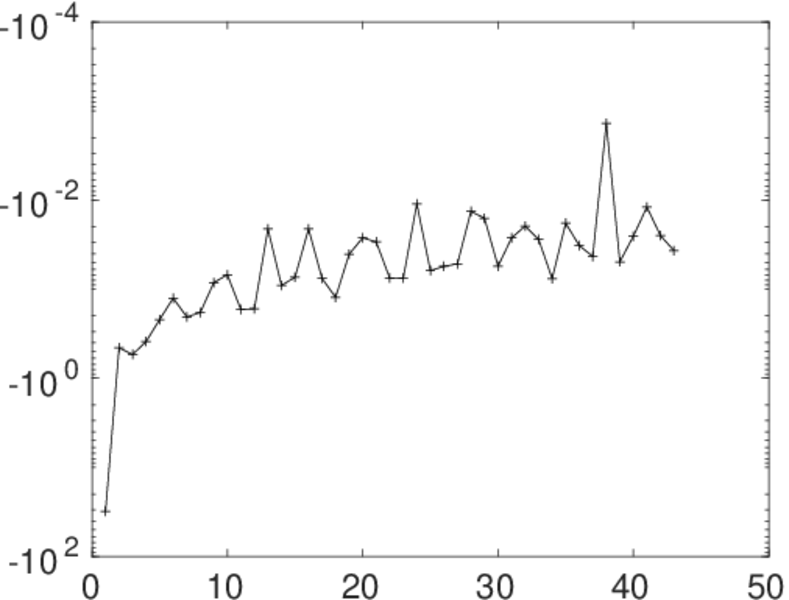
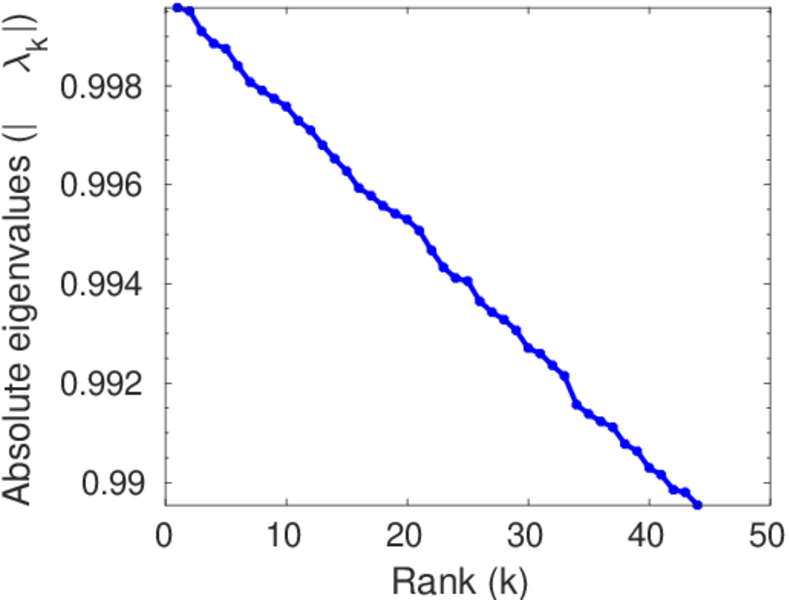
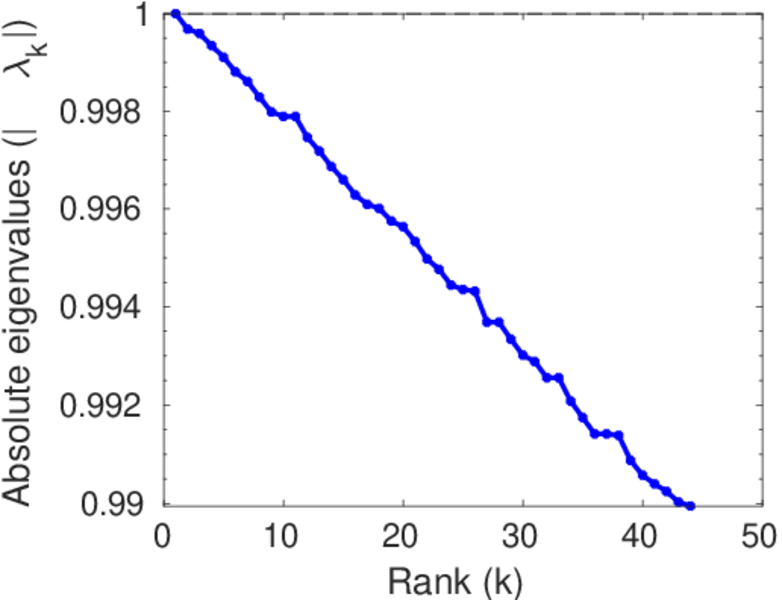
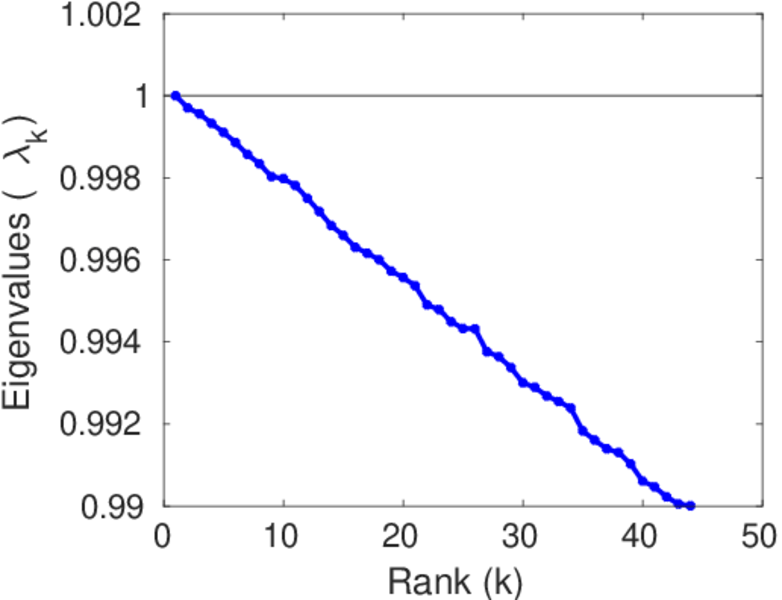
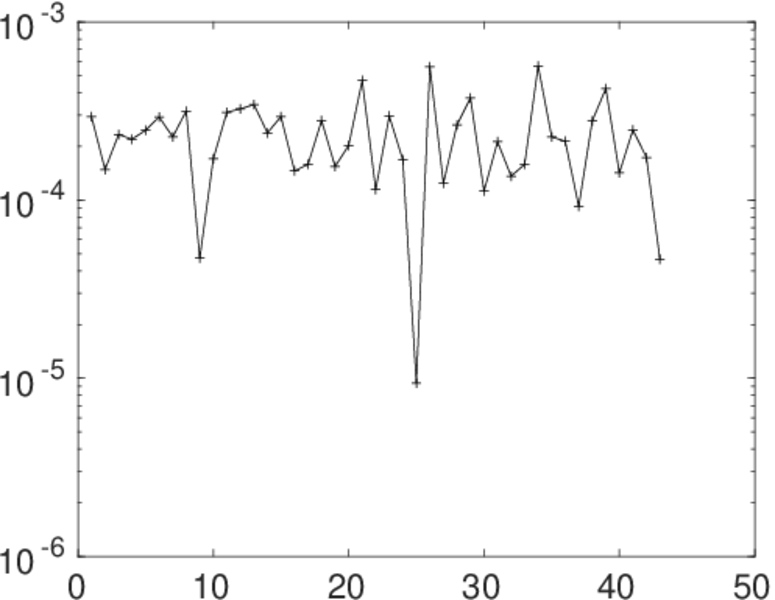
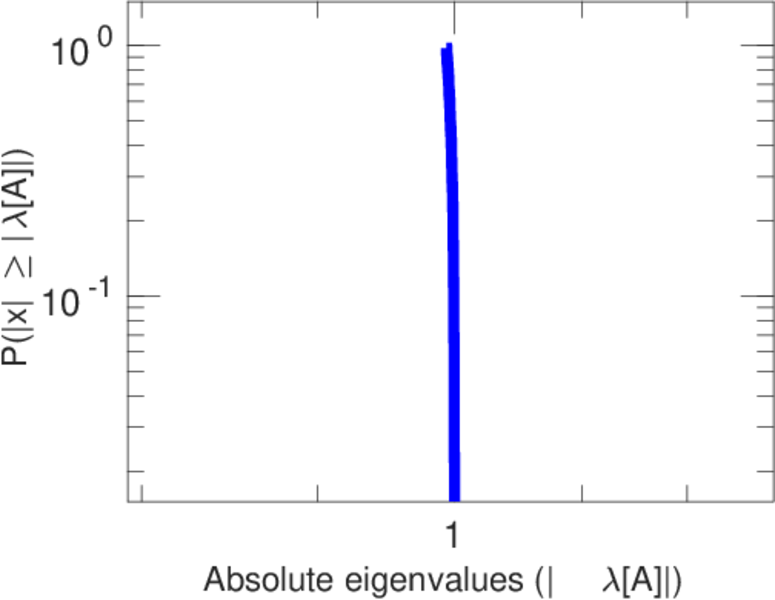
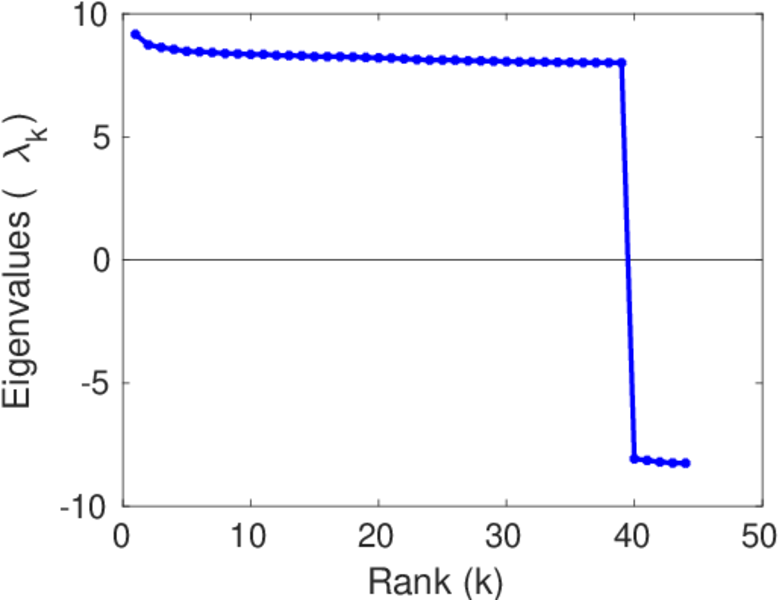
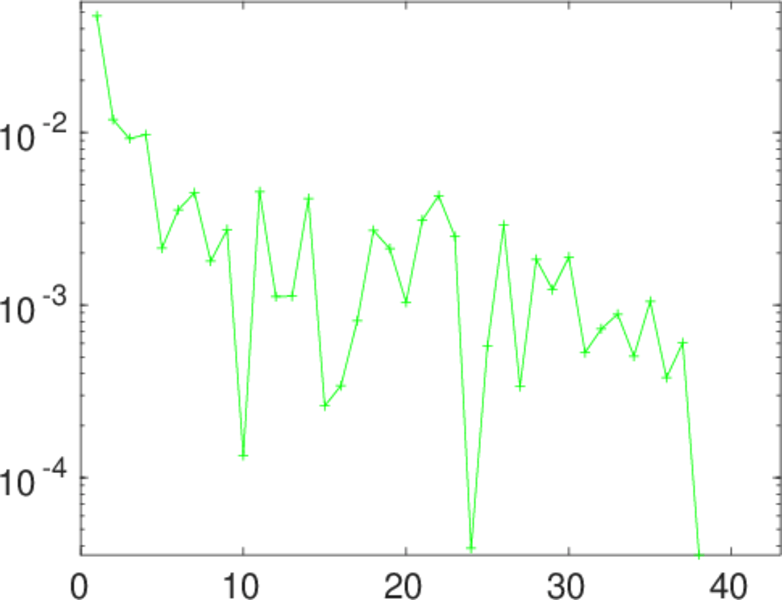
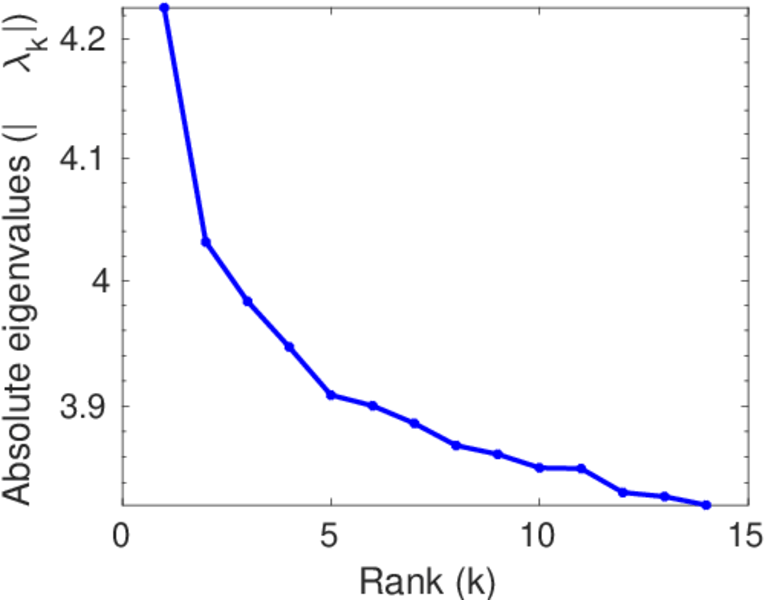
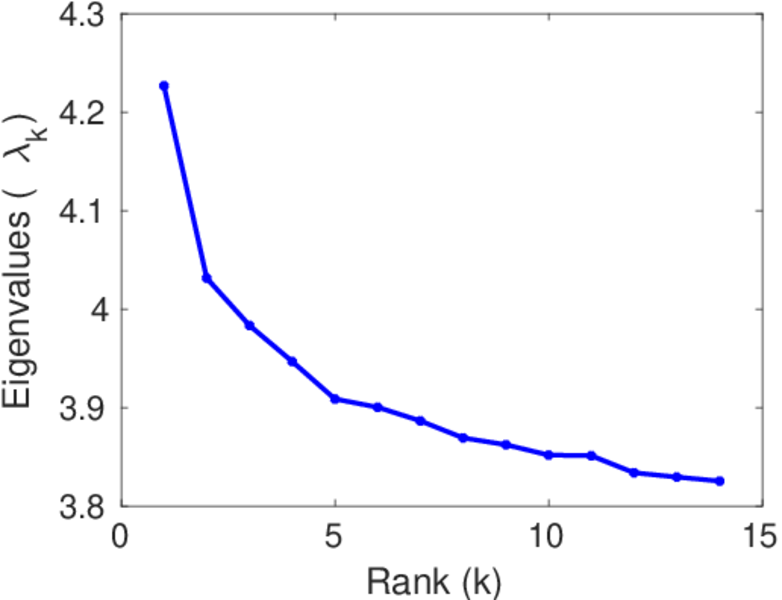
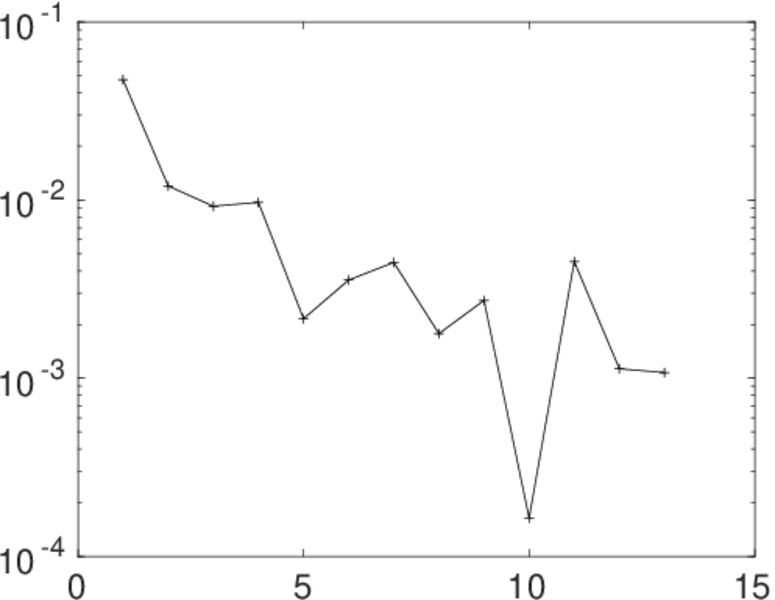
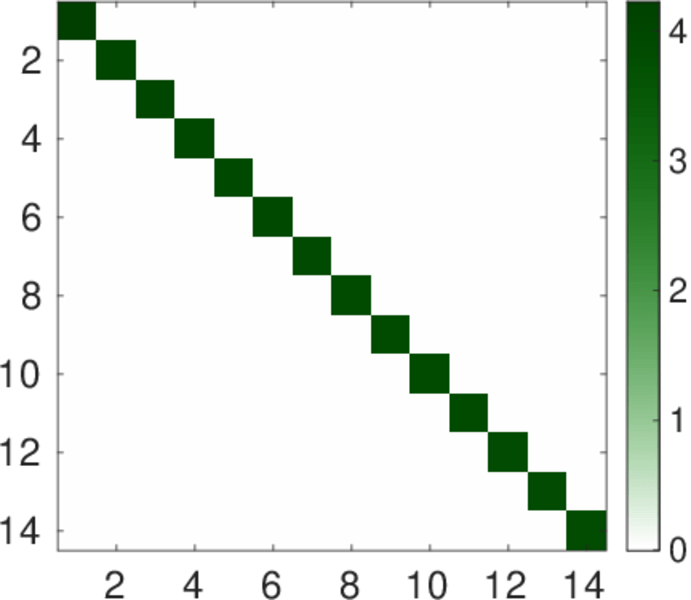
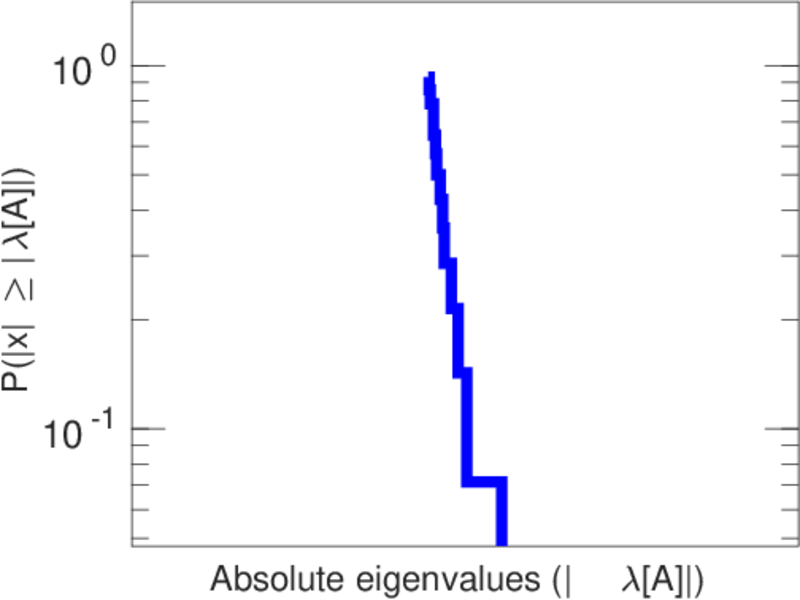
Plots


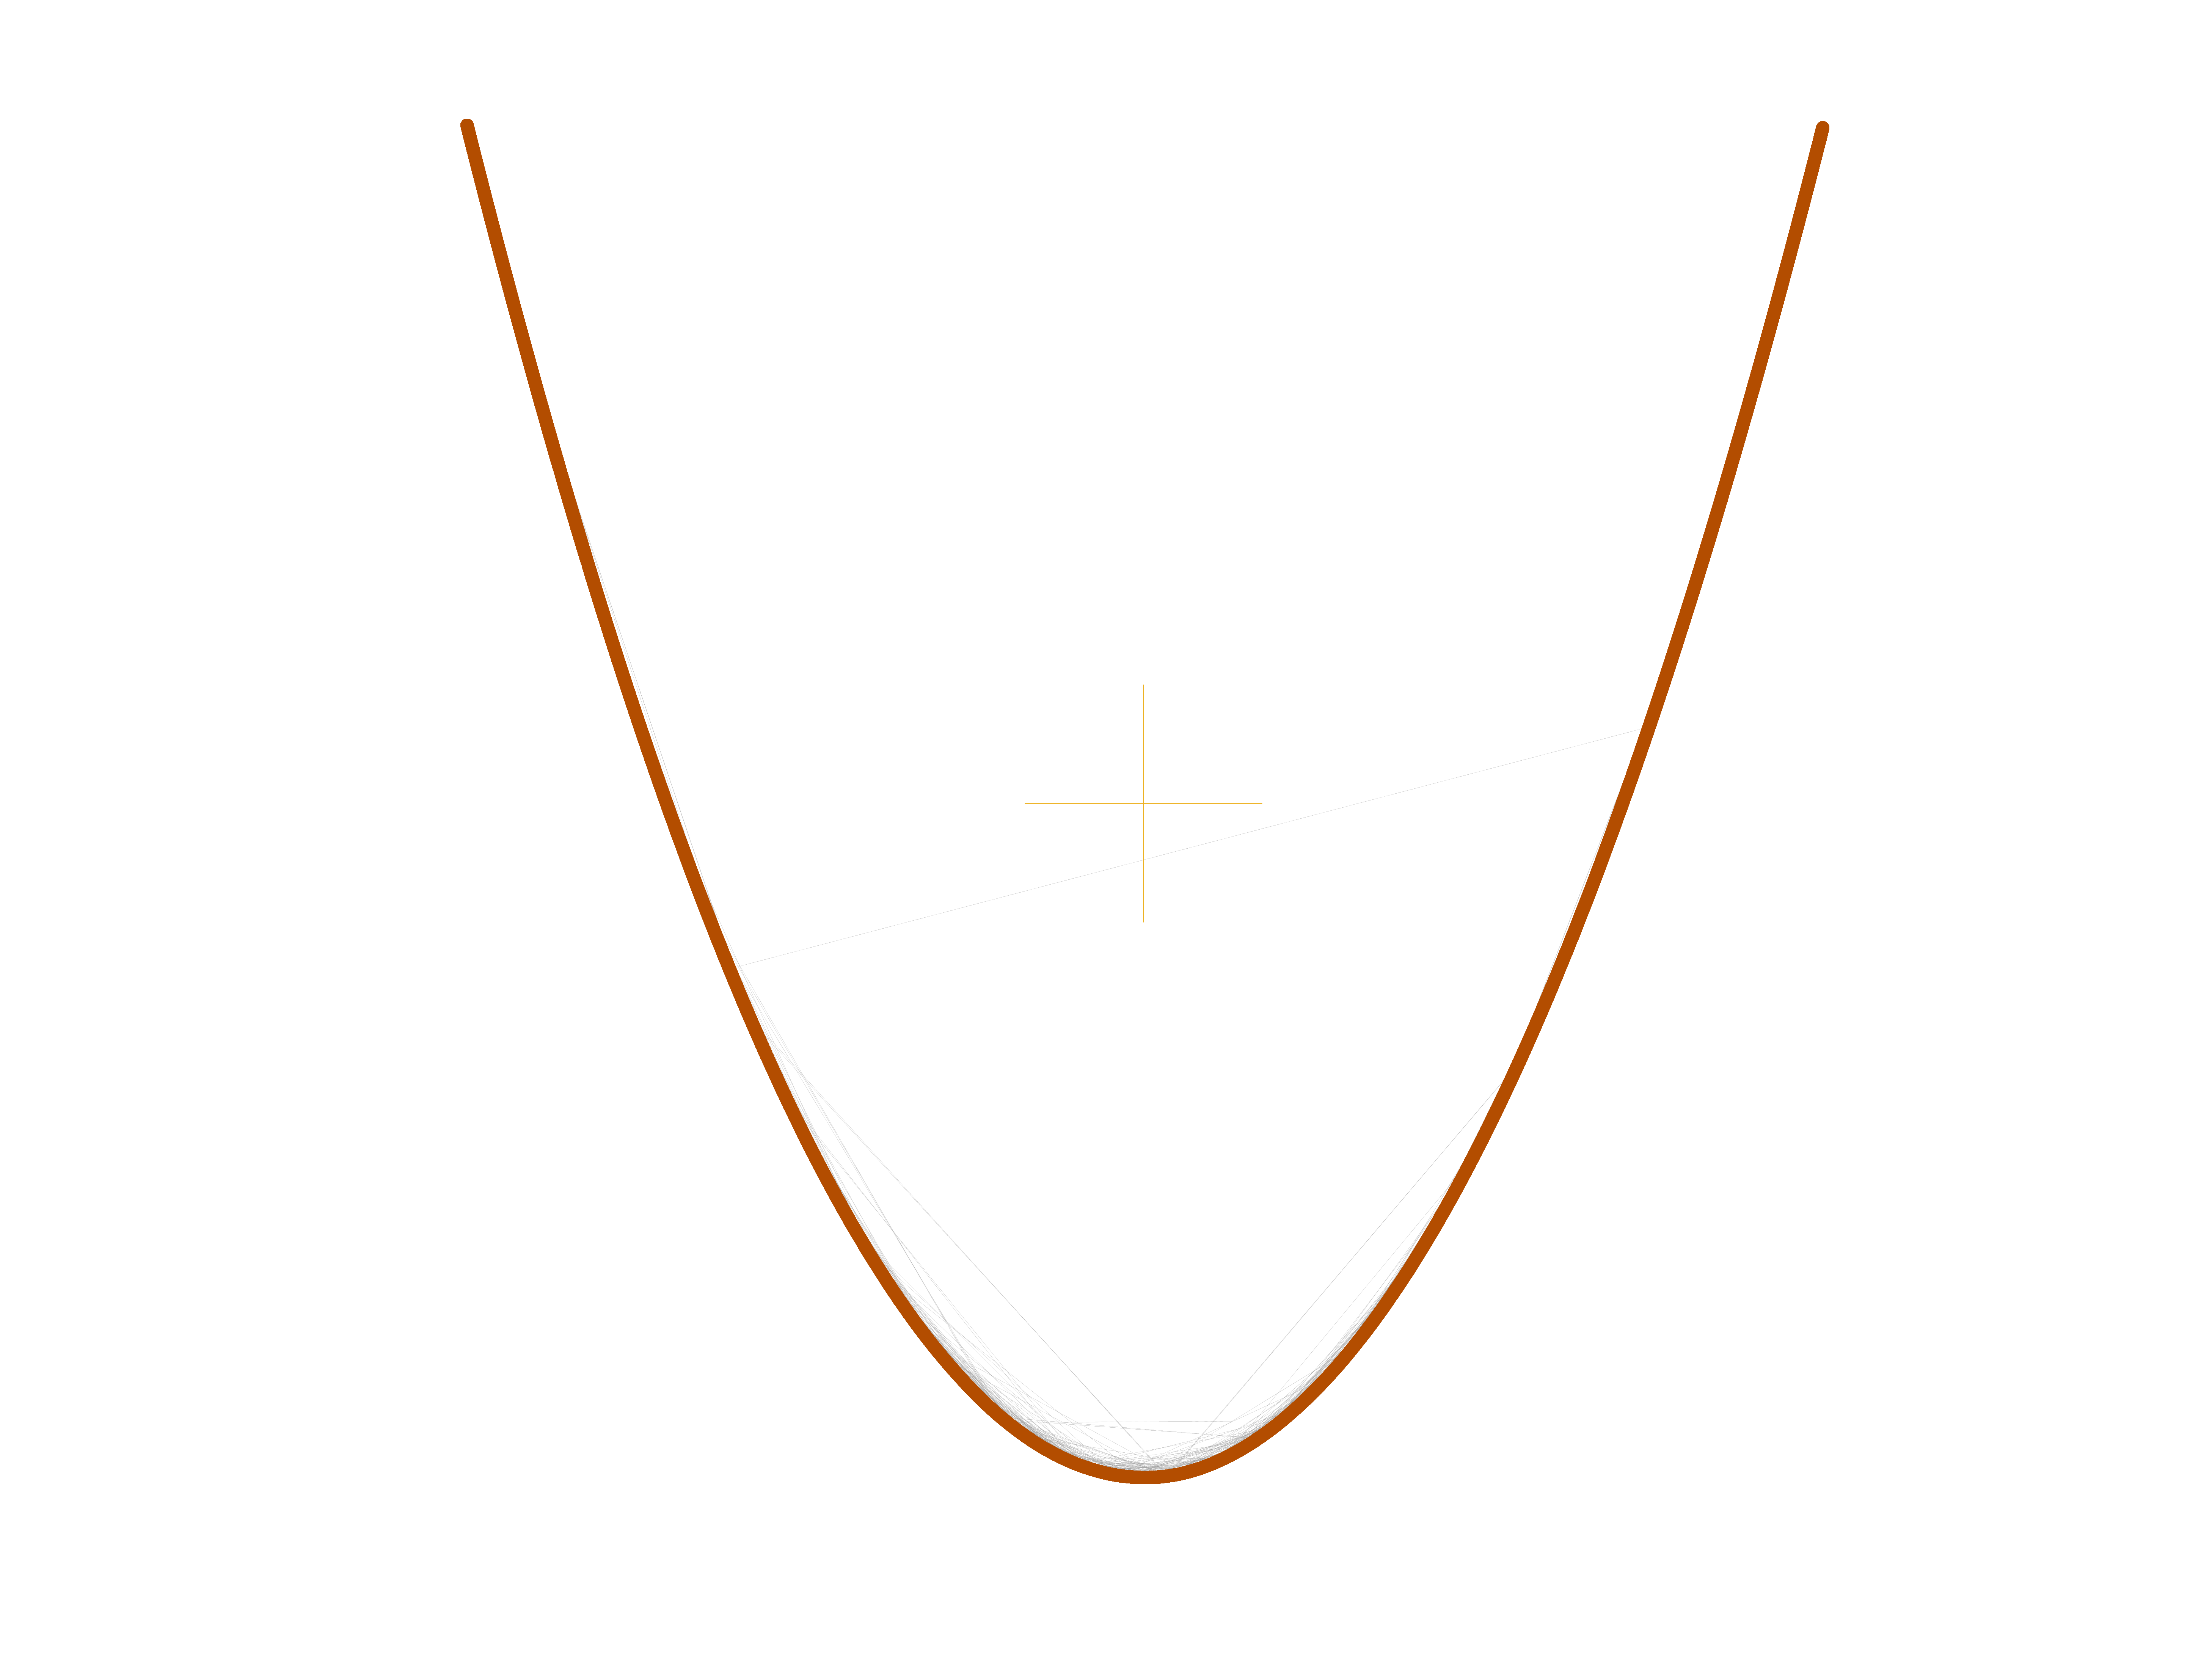
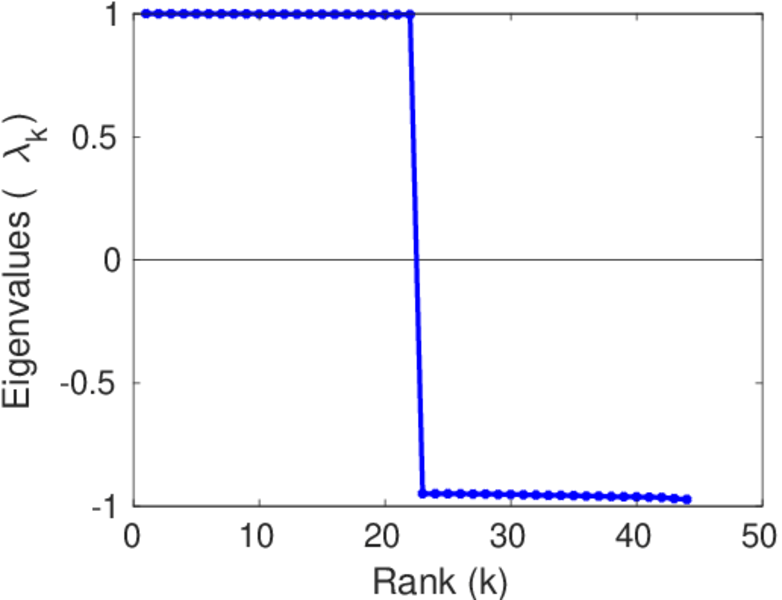
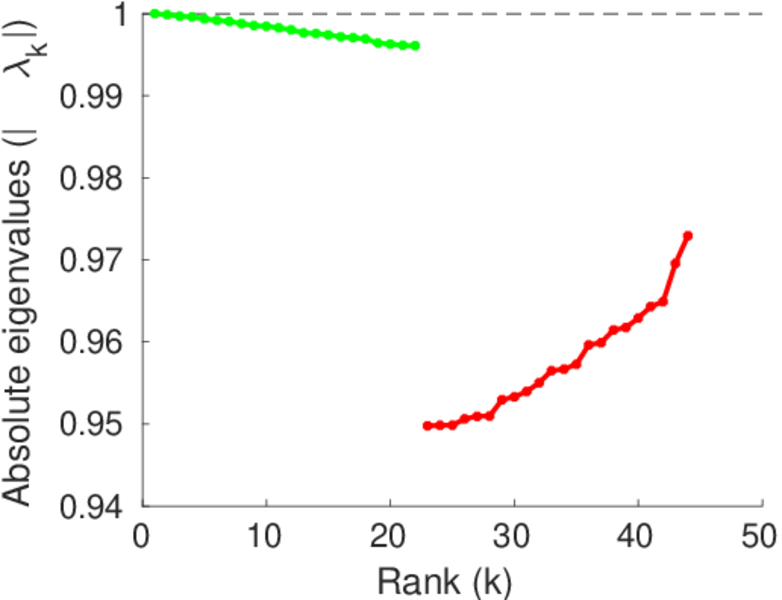
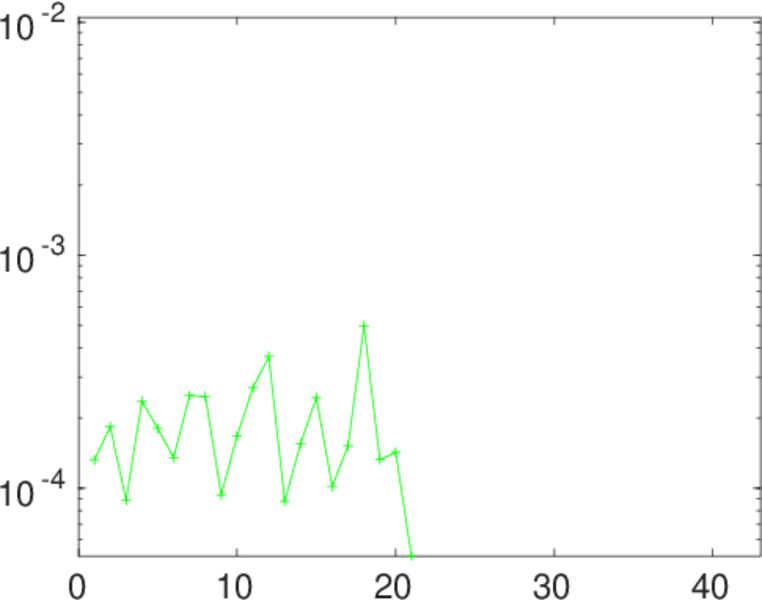
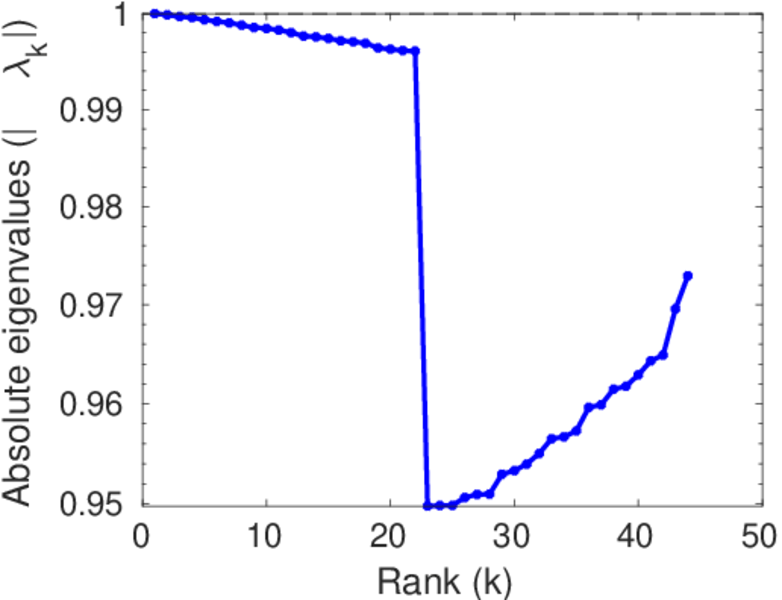
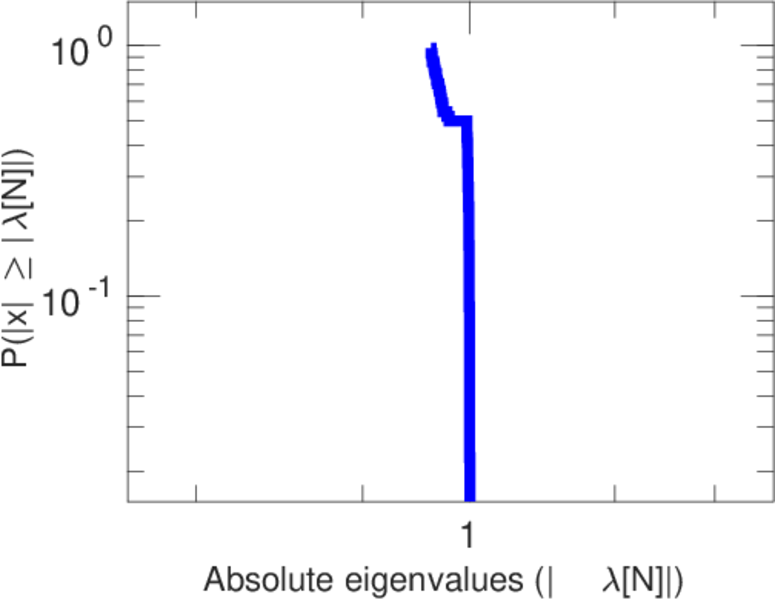
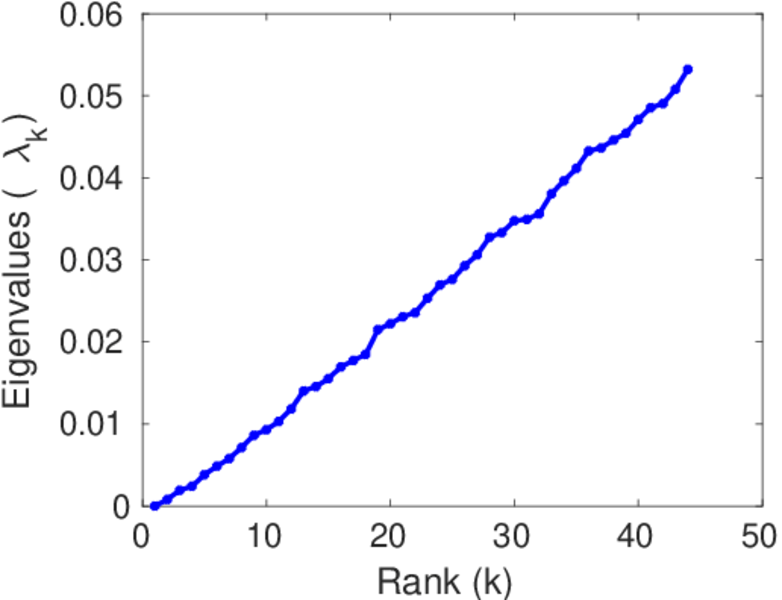
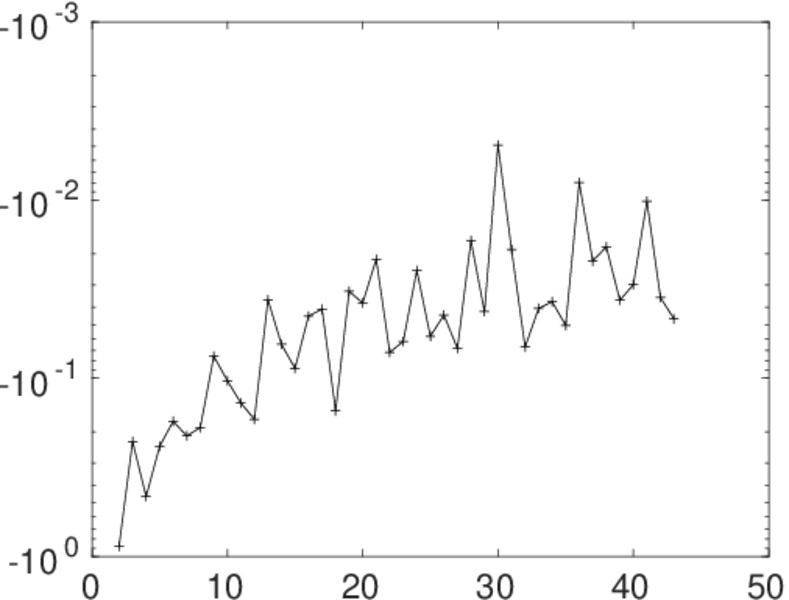
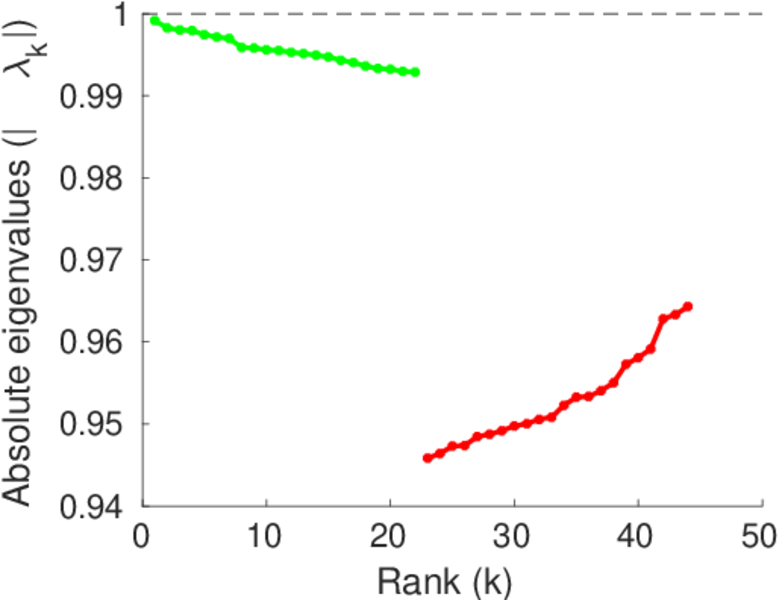
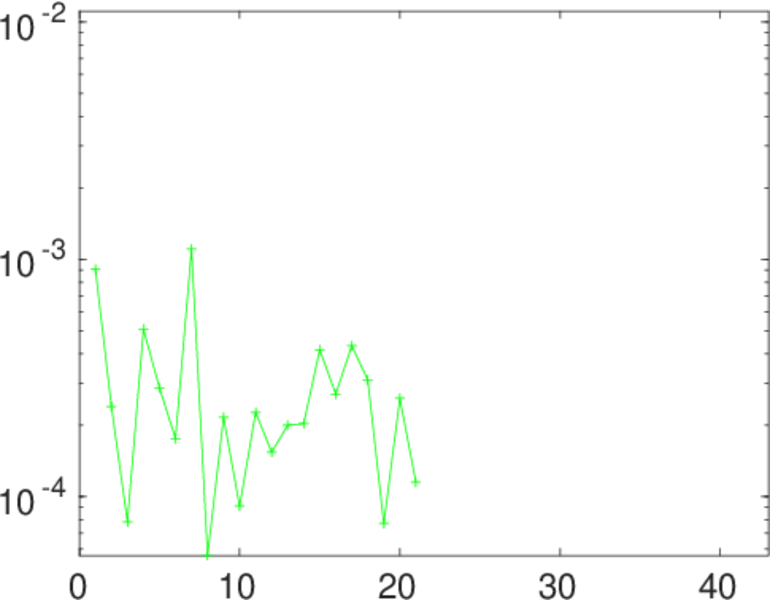
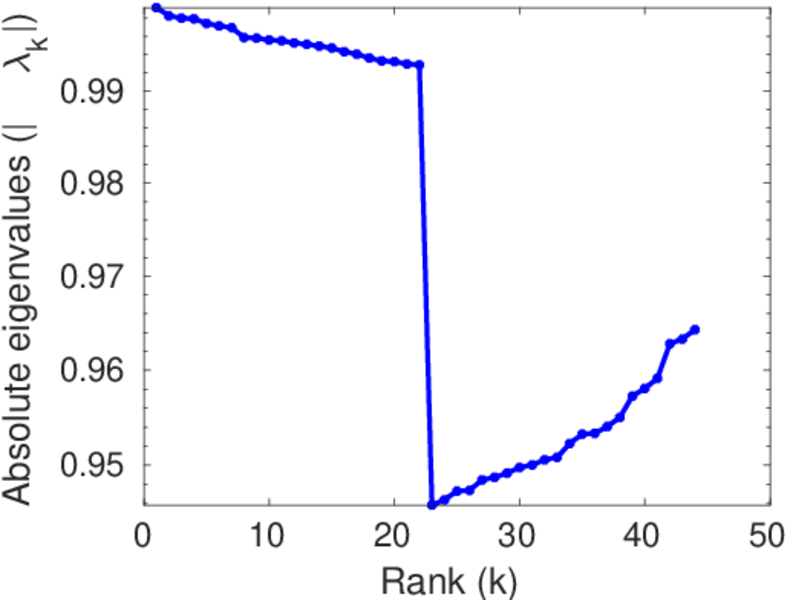
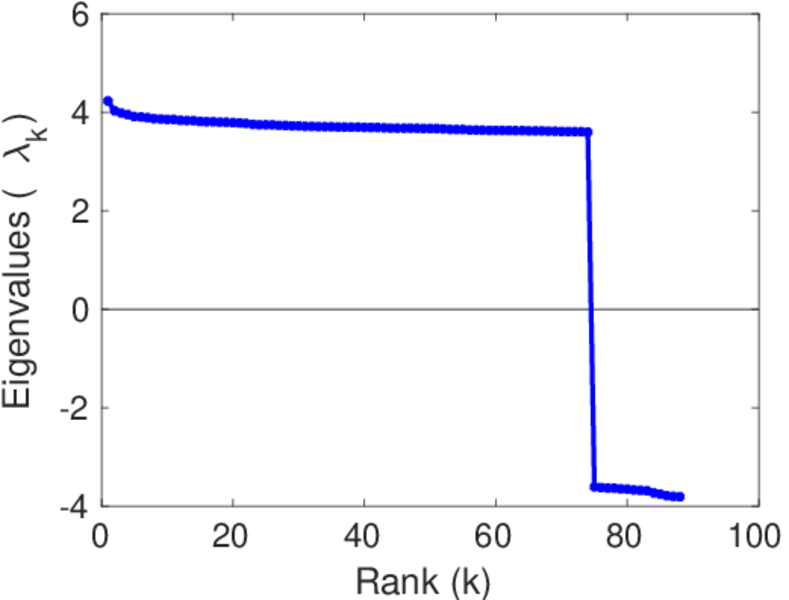
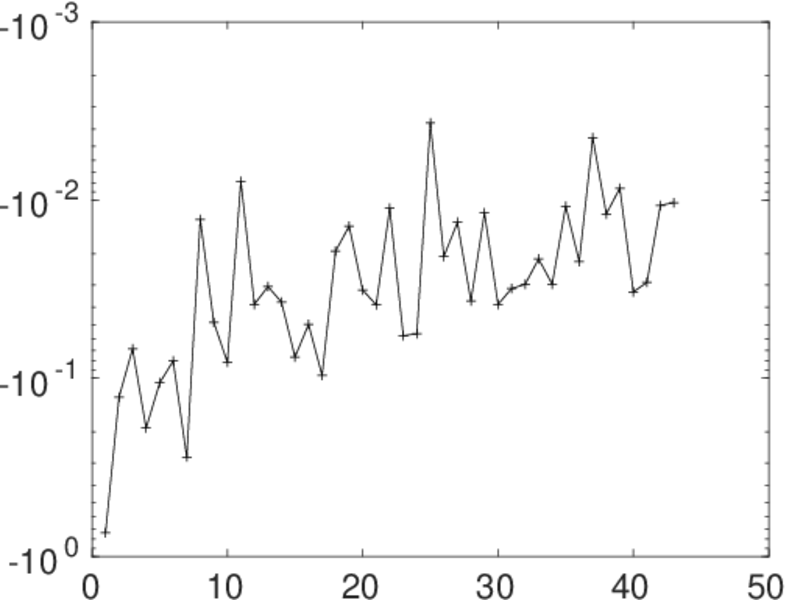
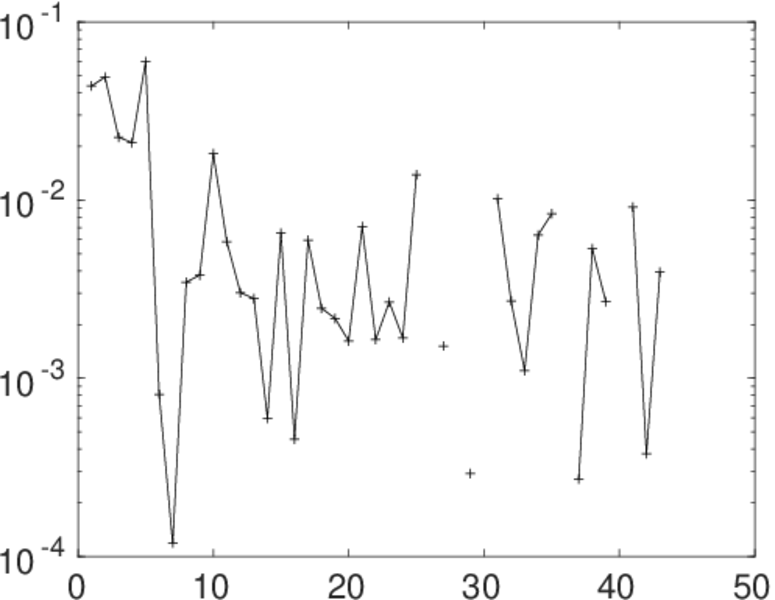
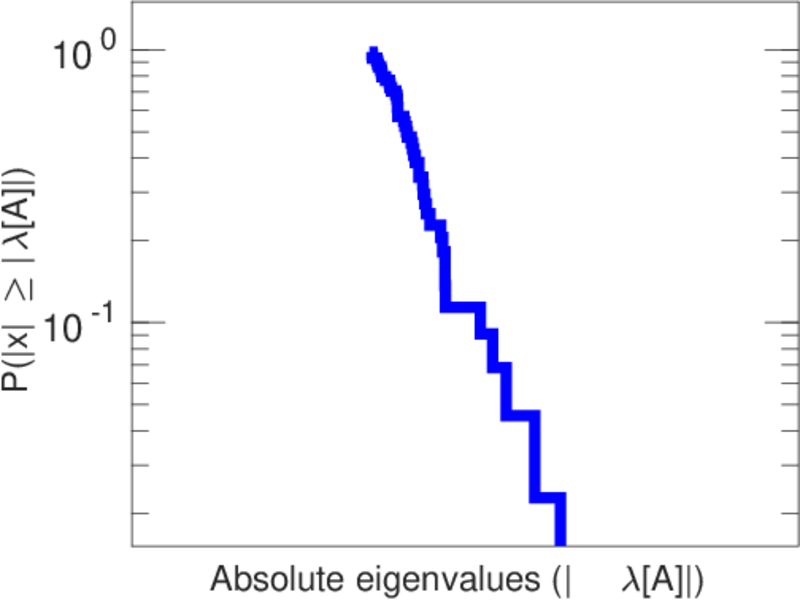
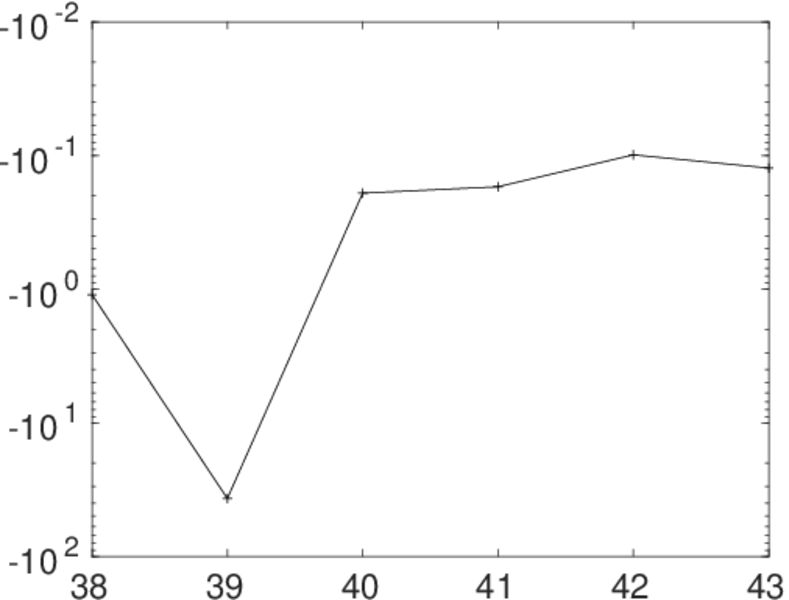
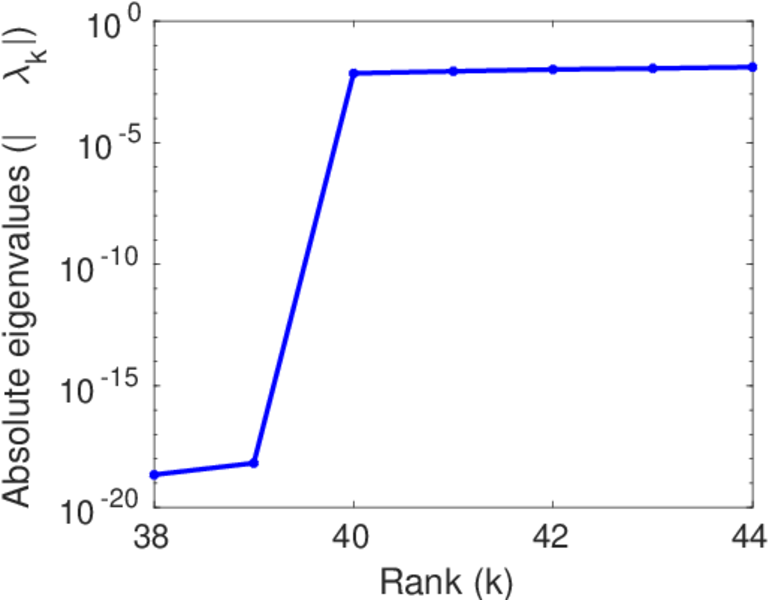
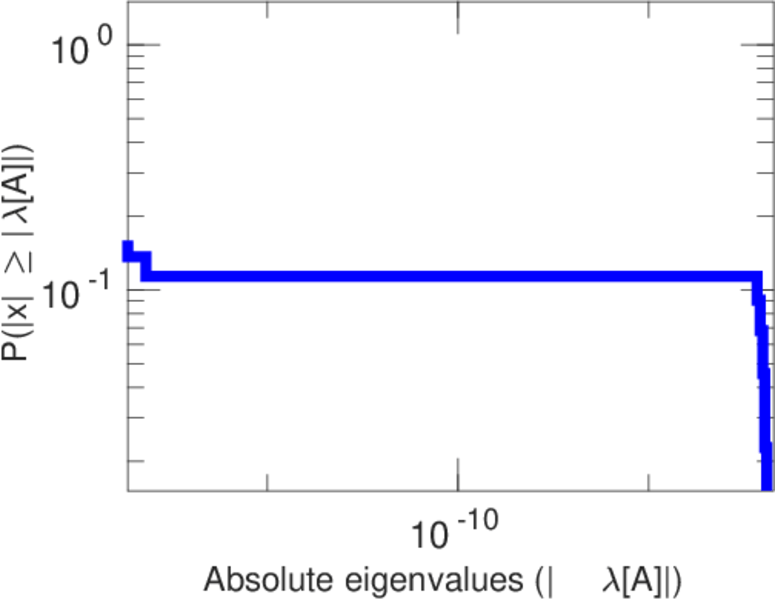
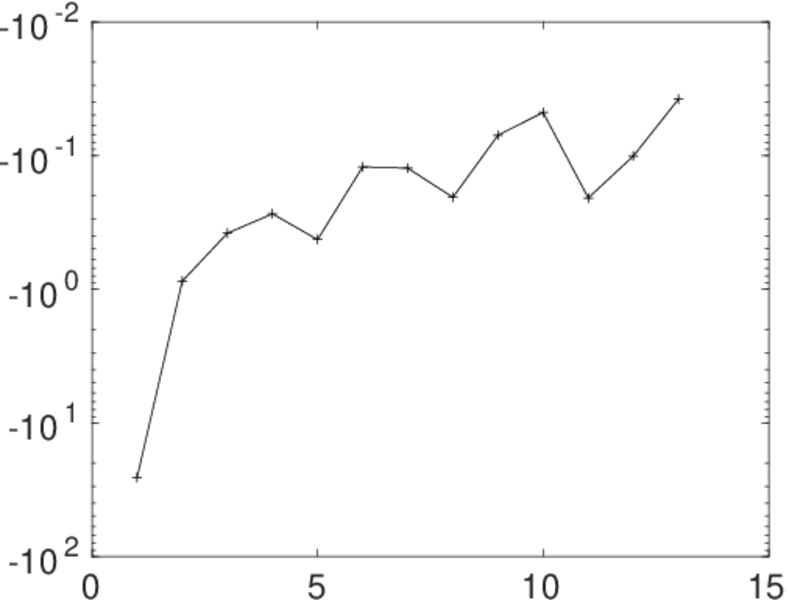
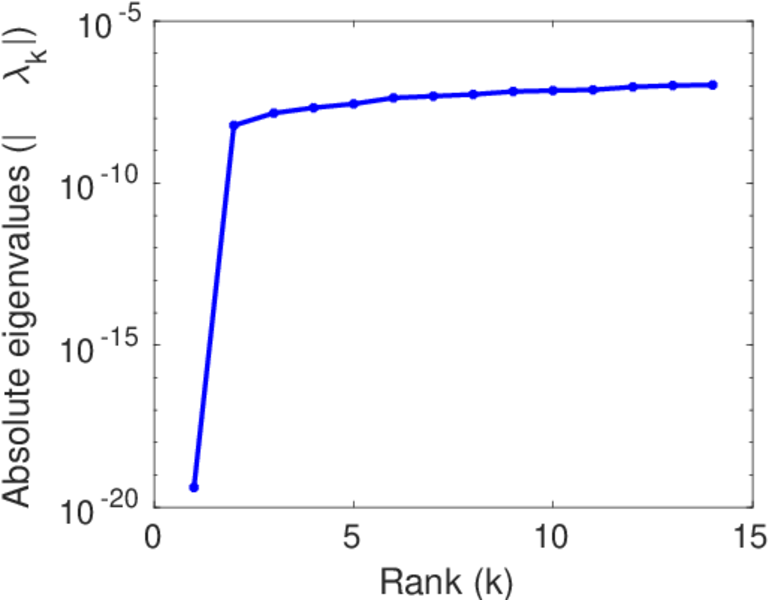
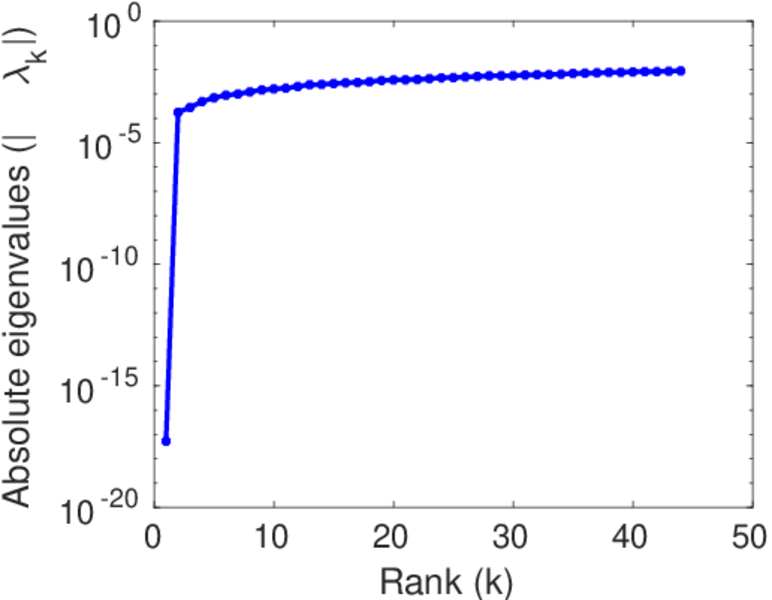
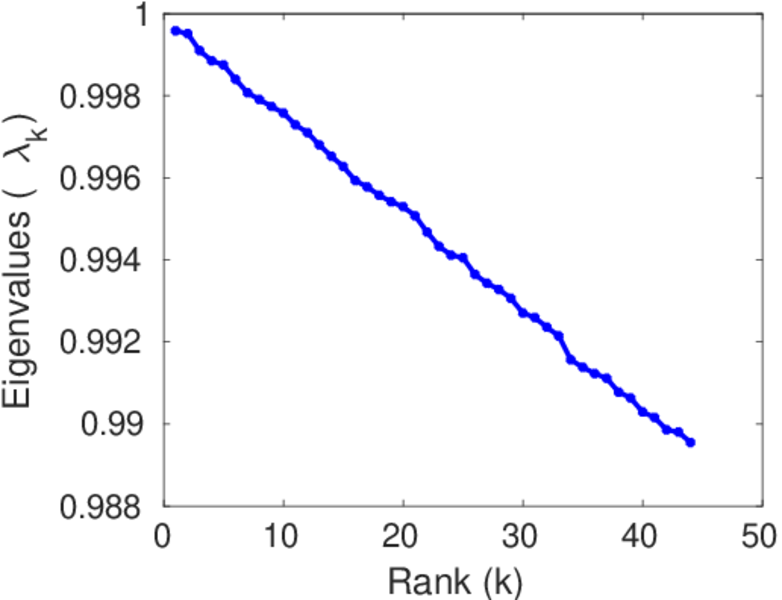
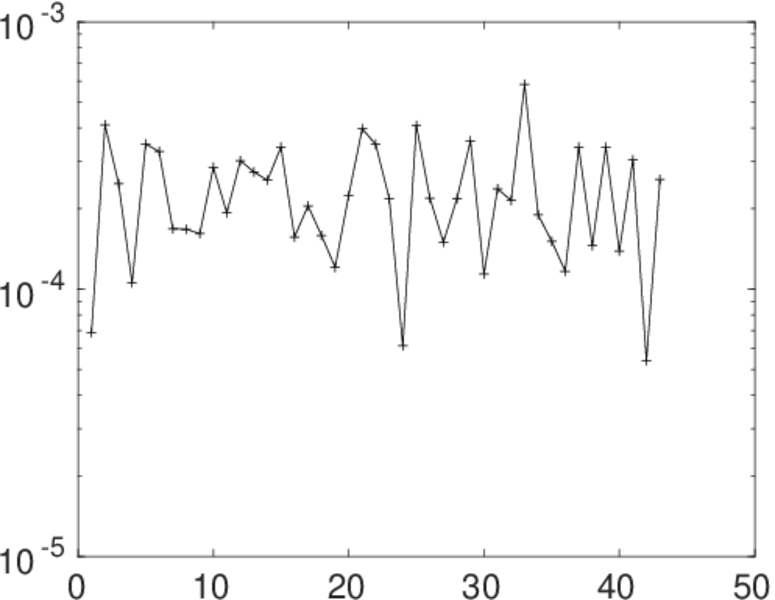
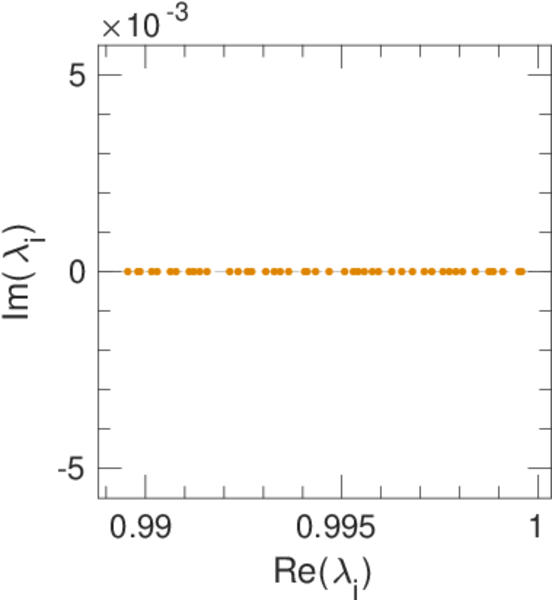
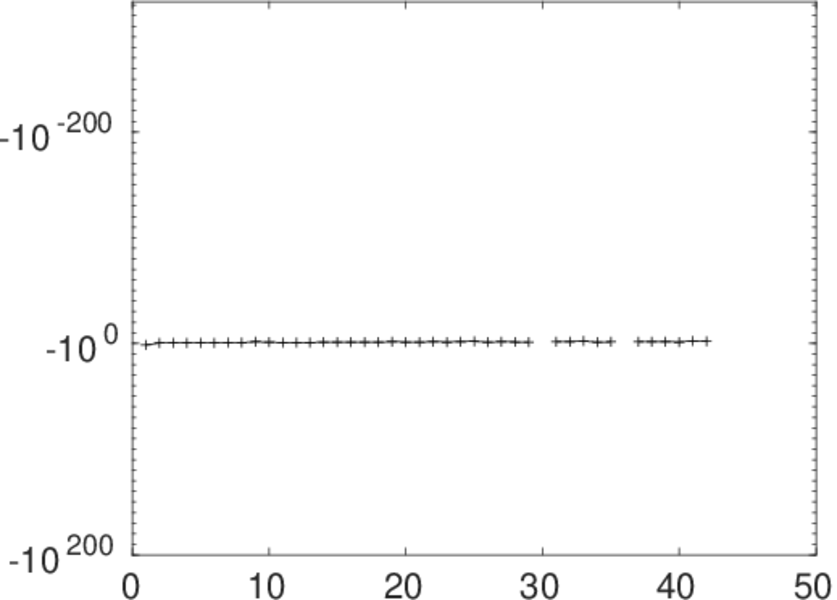
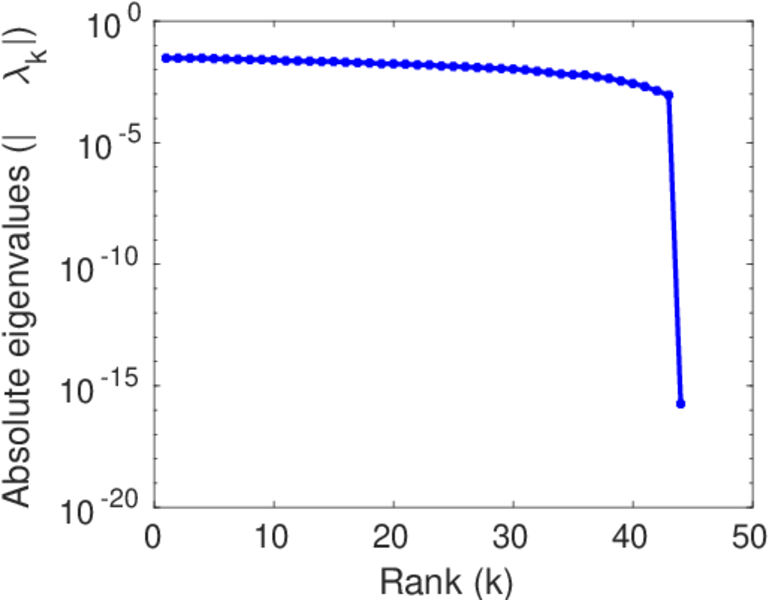
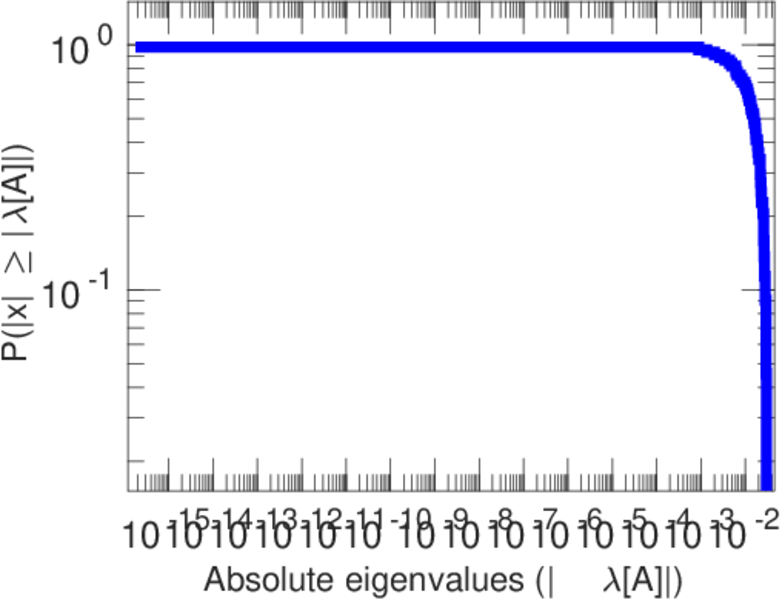
Matrix decompositions plots


Downloads
References
|
[1]
|
Jérôme Kunegis.
KONECT – The Koblenz Network Collection.
In Proc. Int. Conf. on World Wide Web Companion, pages
1343–1350, 2013.
[ http ]
|
|
[2]
|
R. W. Eash, K. S. Chon, Y. J. Lee, and D. E. Boyce.
Equilibrium traffic assignment on an aggregated highway network for
sketch planning.
Transp. Res. Record, 994:30–37, 1983.
|
|
[3]
|
D. E. Boyce, K. S. Chon, M. E. Ferris, Y. J. Lee, K-T. Lin, and R. W. Eash.
Implementation and evaluation of combined models of urban travel and
location on a sketch planning network.
Chicago Area Transp. Study, pages xii + 169, 1985.
|
 KONECT ‣ Networks ‣
Buy Me a Coffee
KONECT ‣ Networks ‣
Buy Me a Coffee