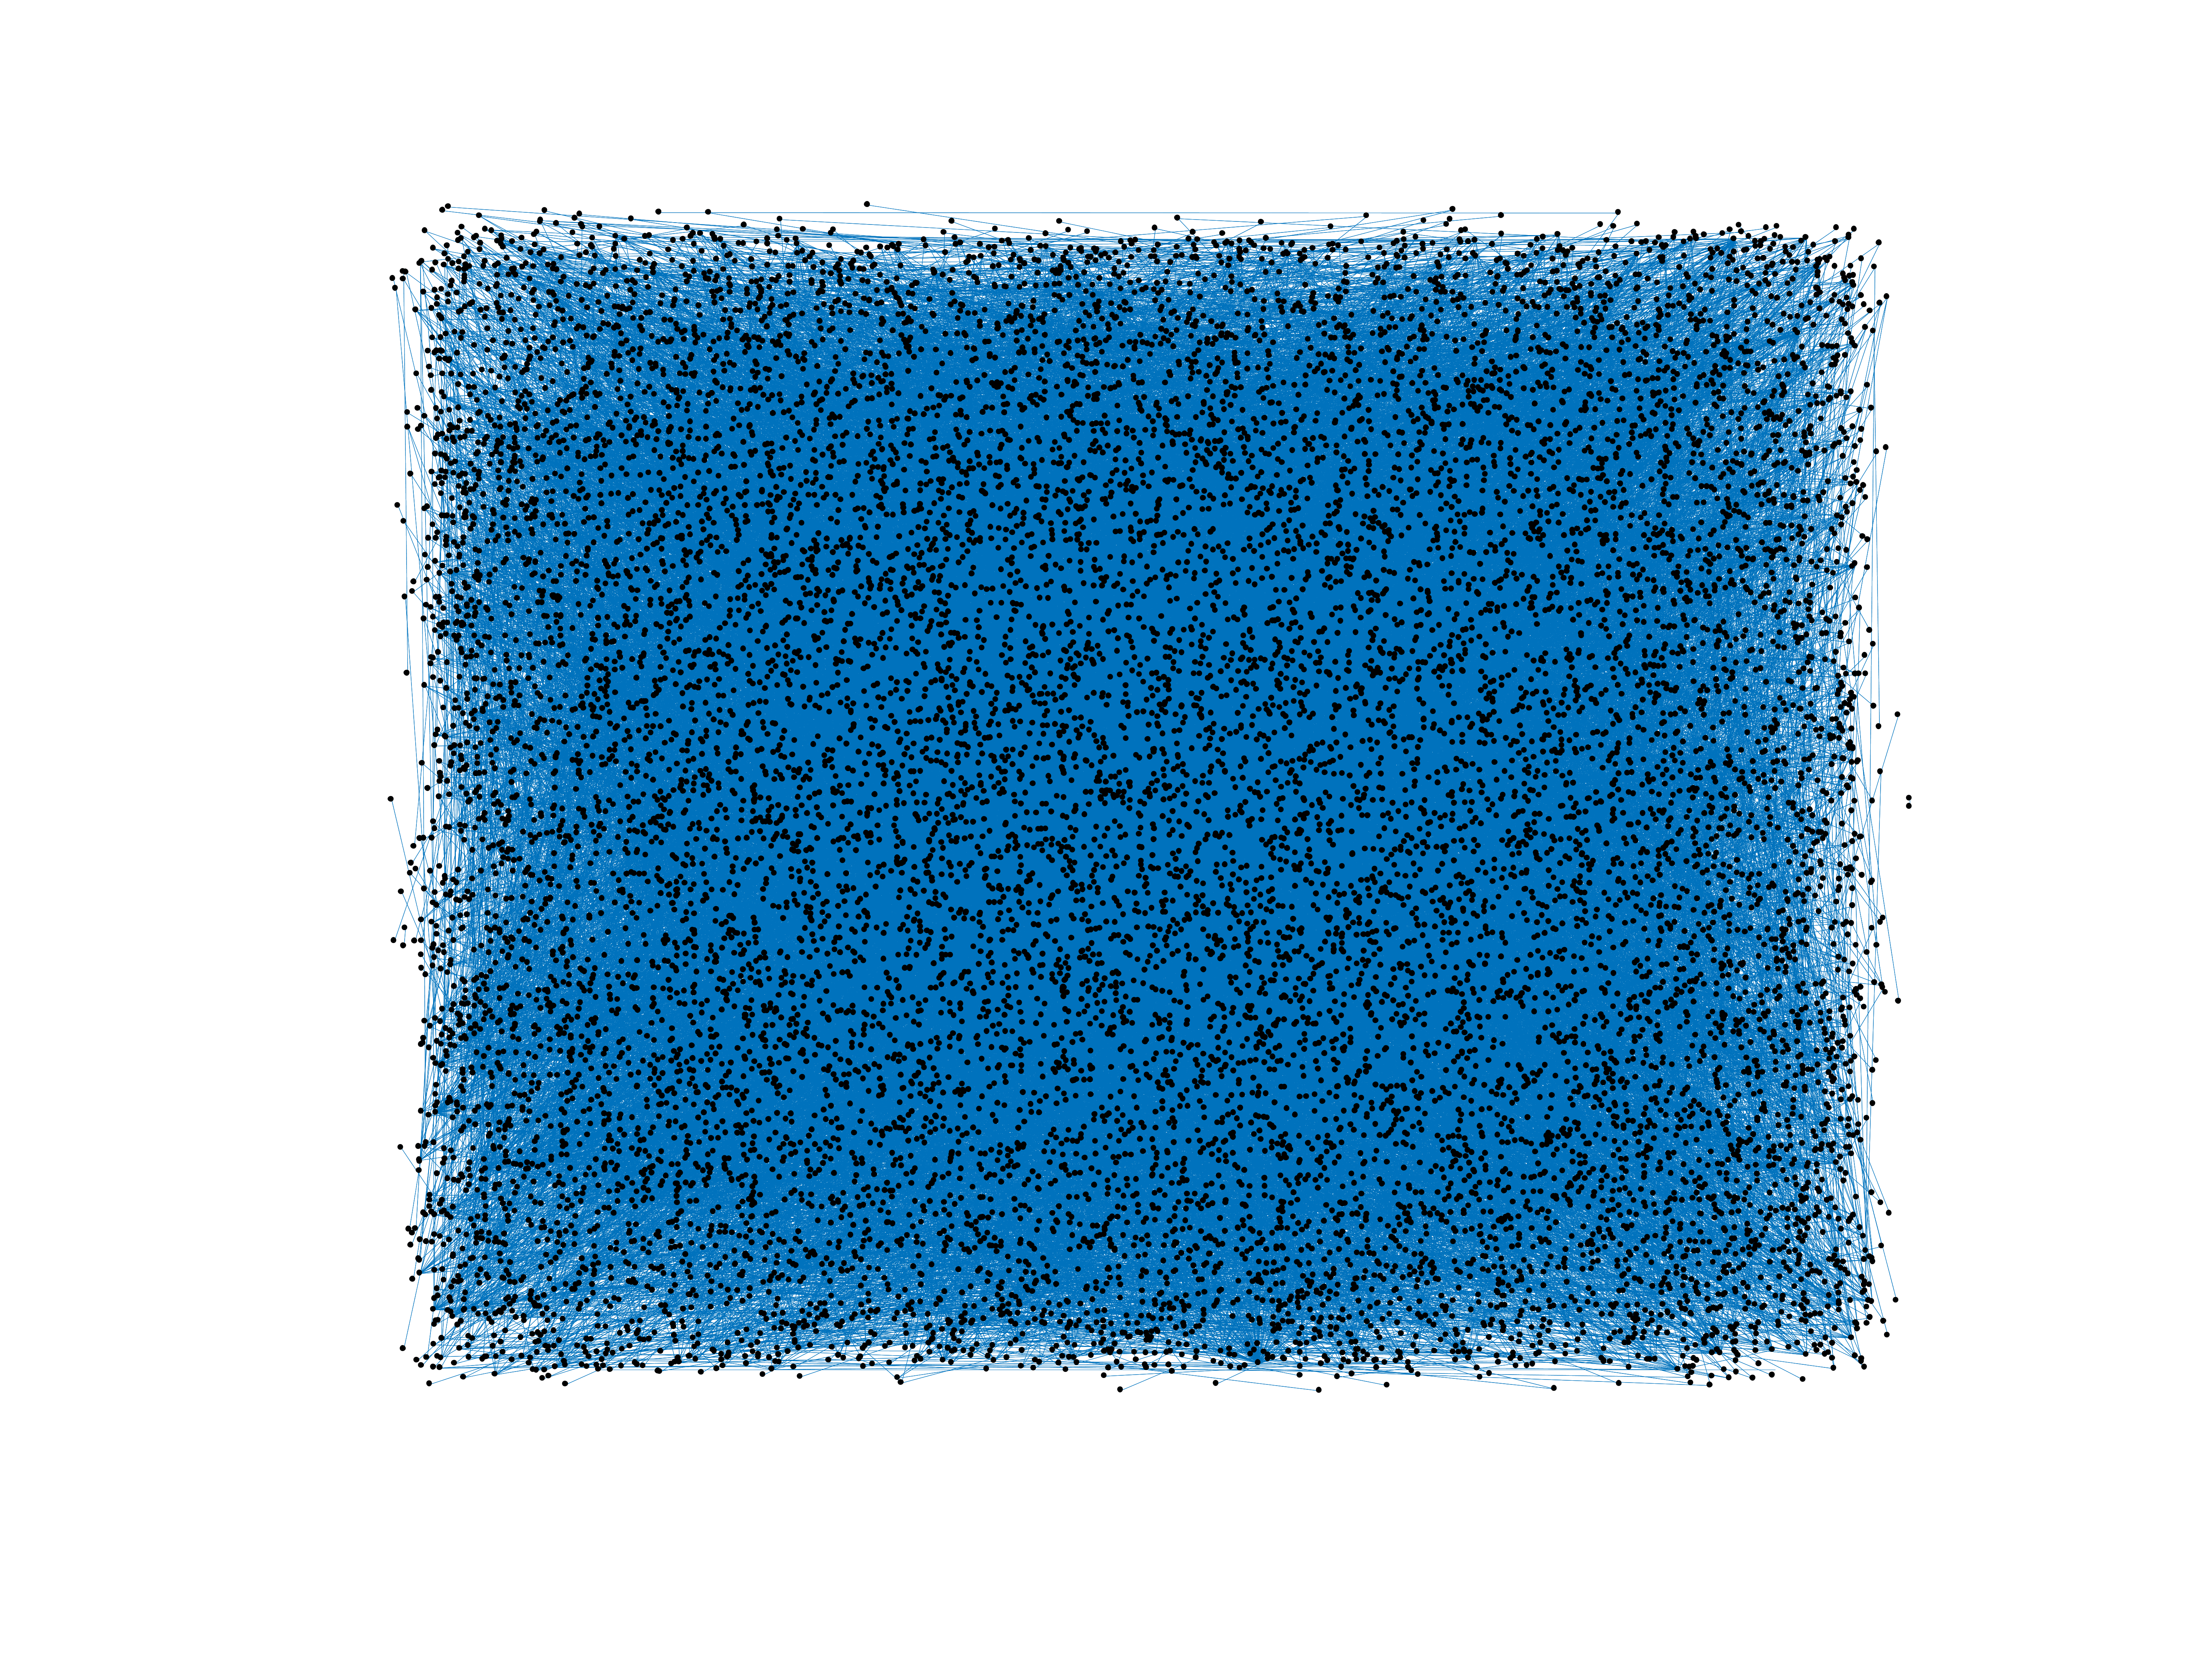
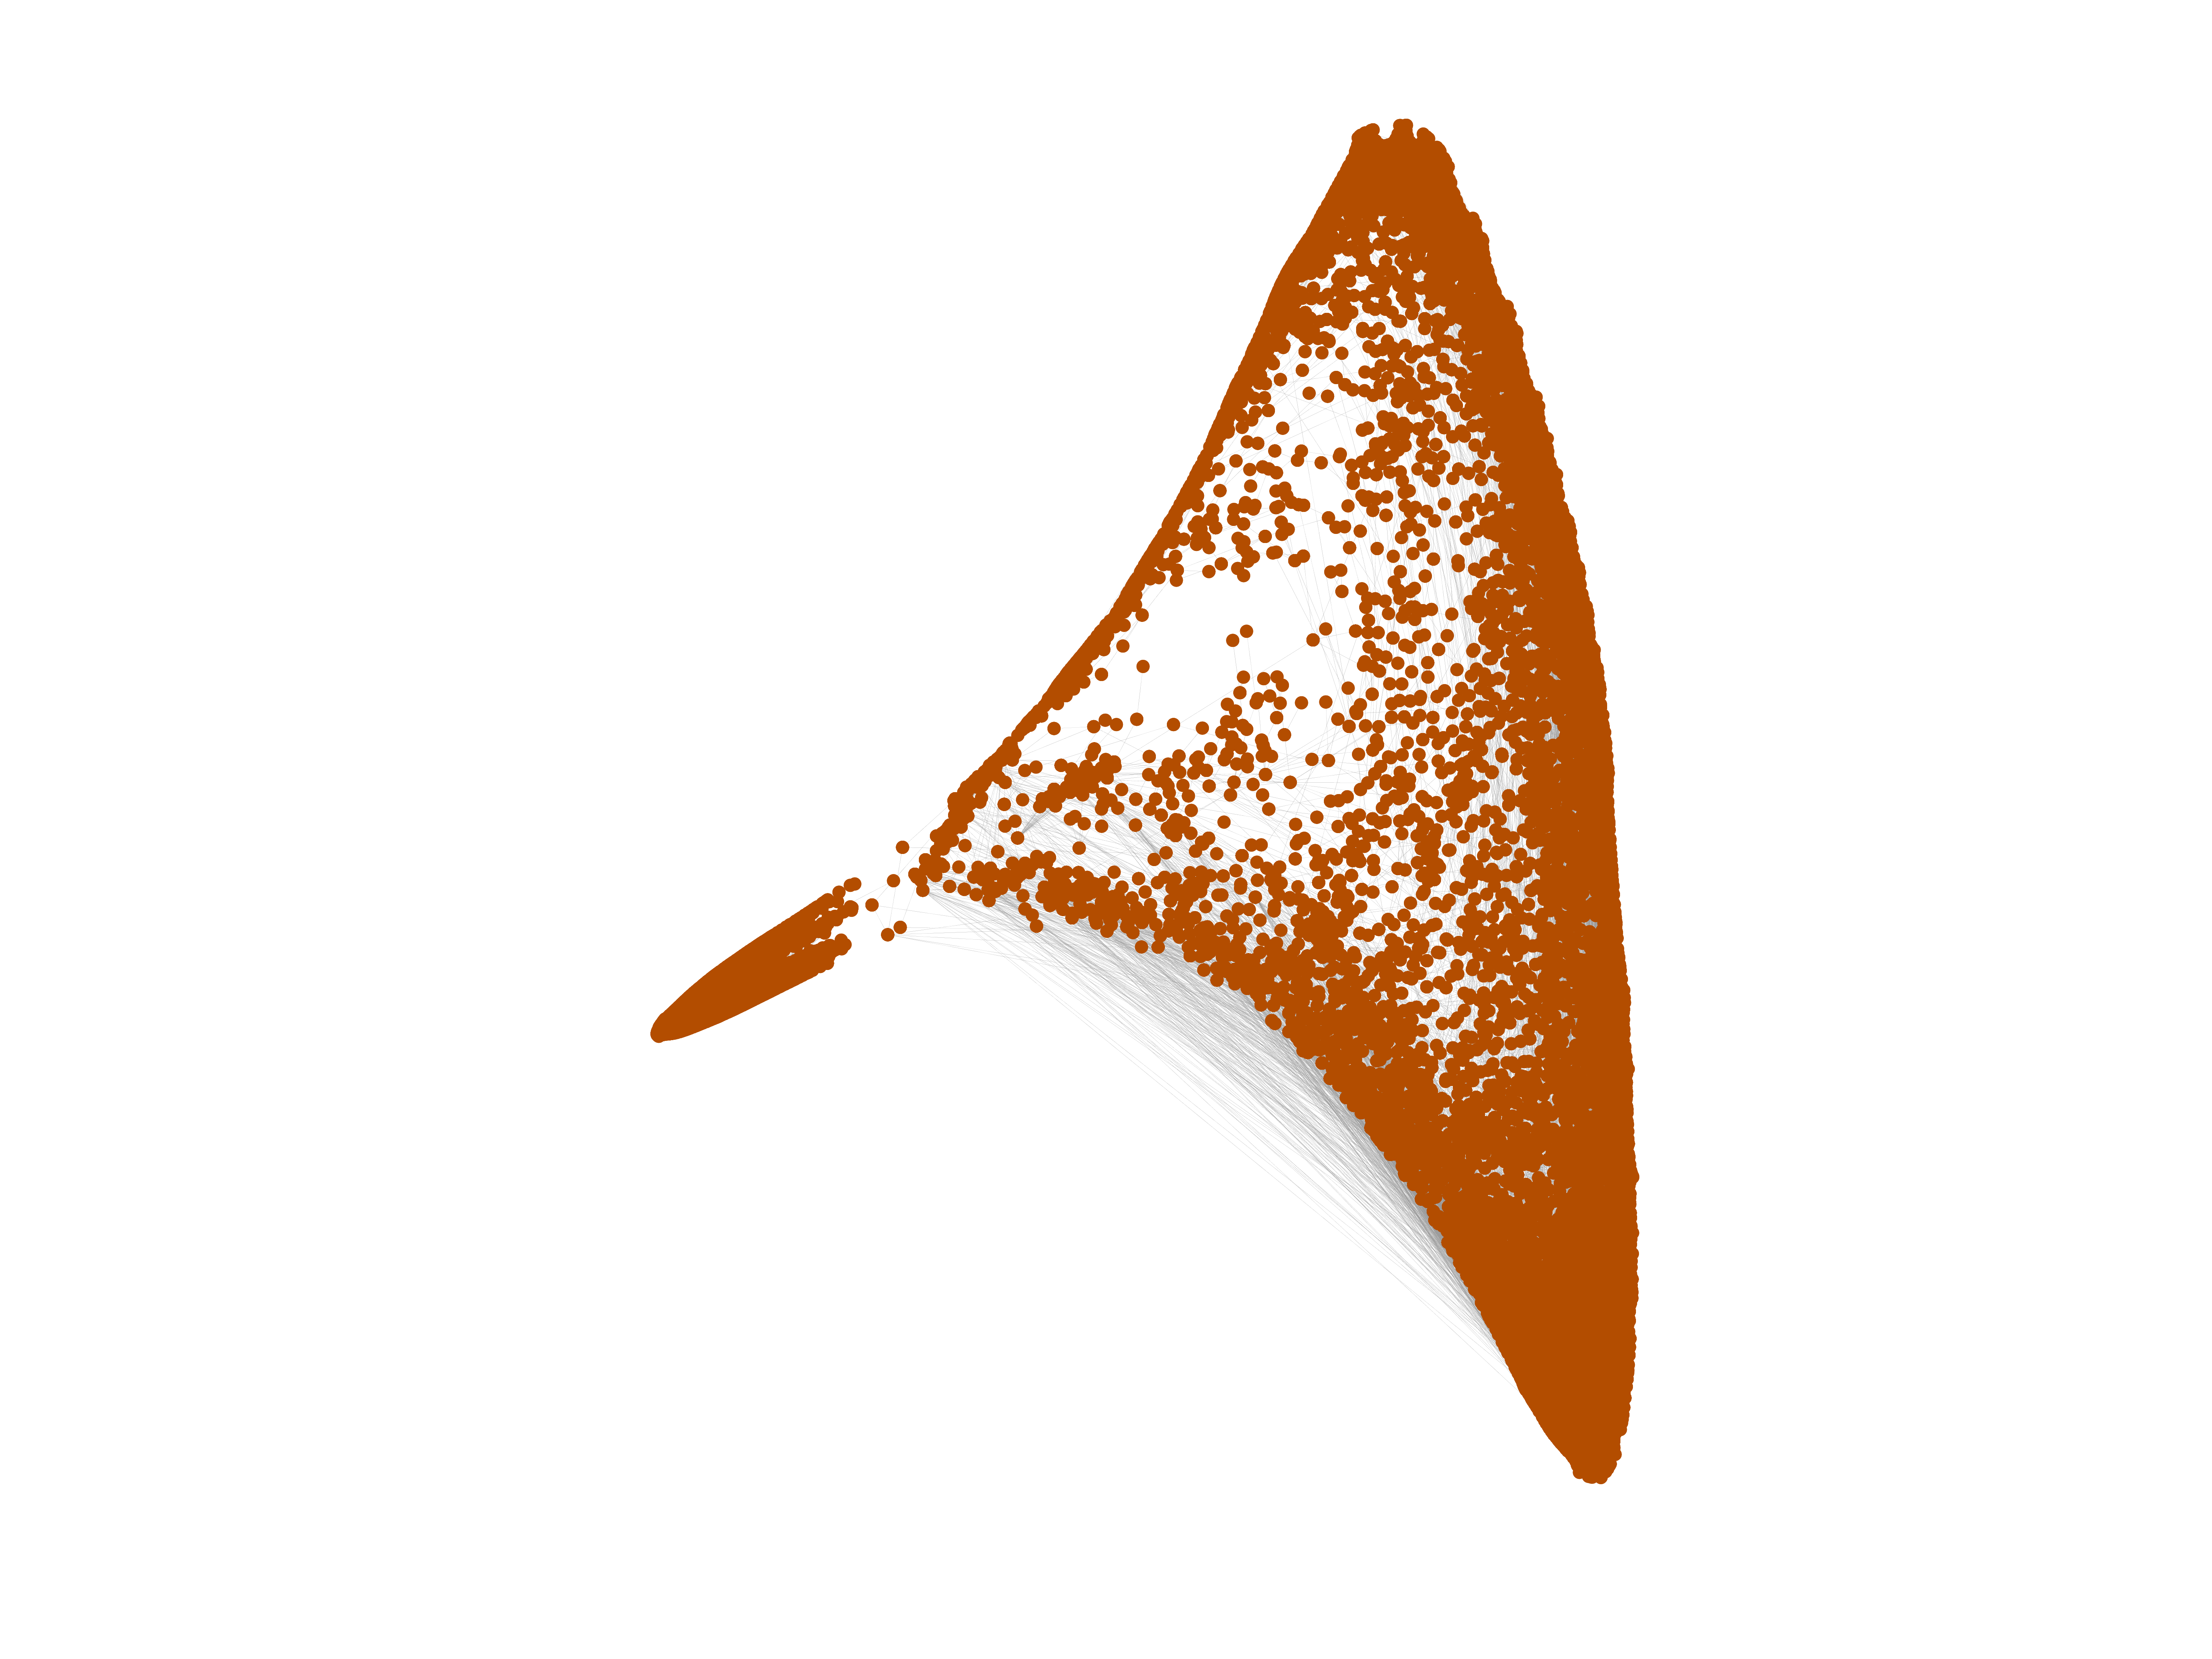
Sister cities
This is an undirected network of cities of the world connected by "sister city"
or "twin city" relationships, as extracted from WikiData.
Metadata
Statistics
| Size | n = | 14,274
|
| Volume | m = | 20,573
|
| Loop count | l = | 0
|
| Wedge count | s = | 170,445
|
| Claw count | z = | 1,448,380
|
| Cross count | x = | 16,106,419
|
| Triangle count | t = | 6,327
|
| Square count | q = | 84,861
|
| 4-Tour count | T4 = | 1,401,814
|
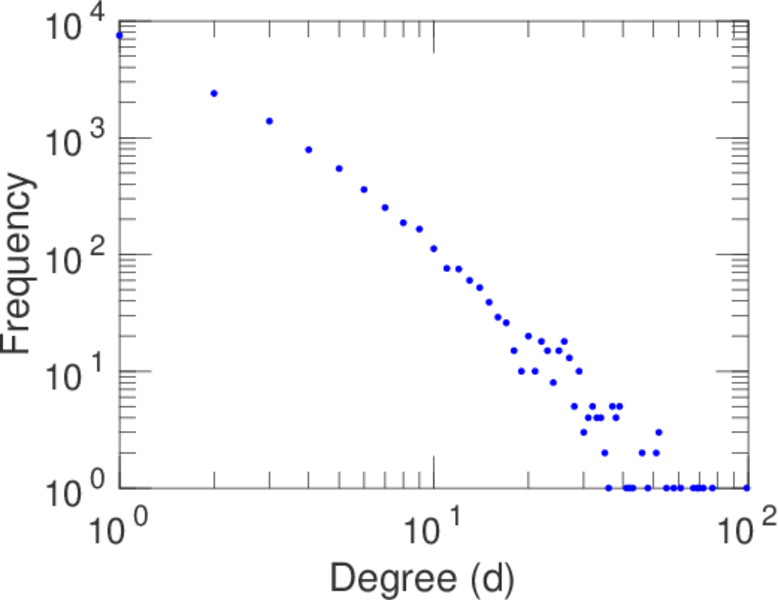
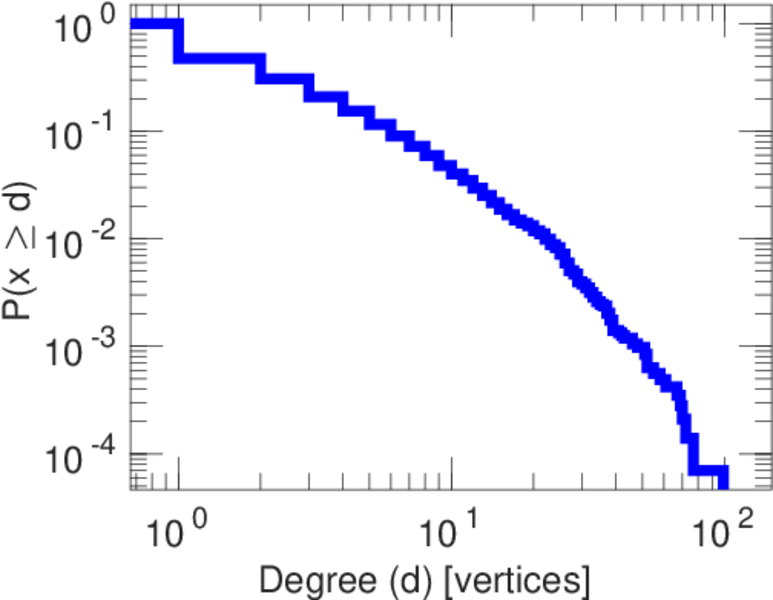
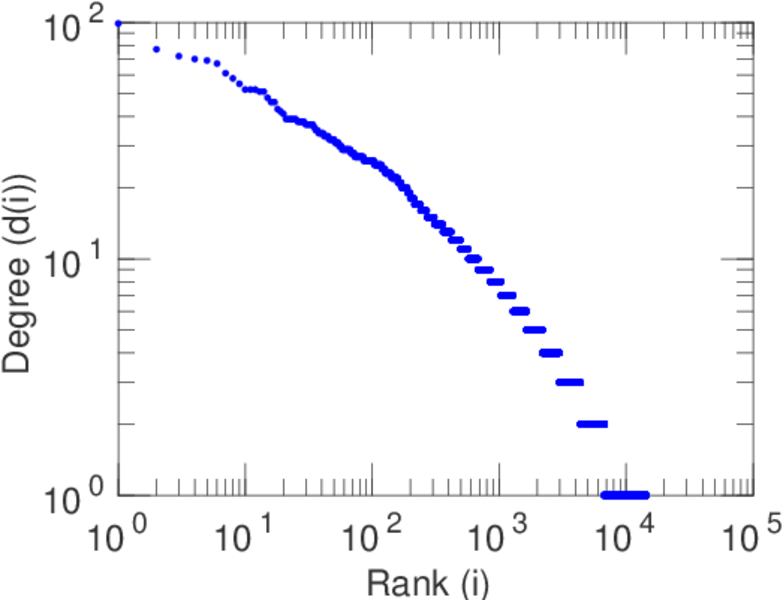
| Maximum degree | dmax = | 99
|
| Average degree | d = | 2.882 58
|
| Fill | p = | 0.000 201 961
|
| Size of LCC | N = | 10,320
|
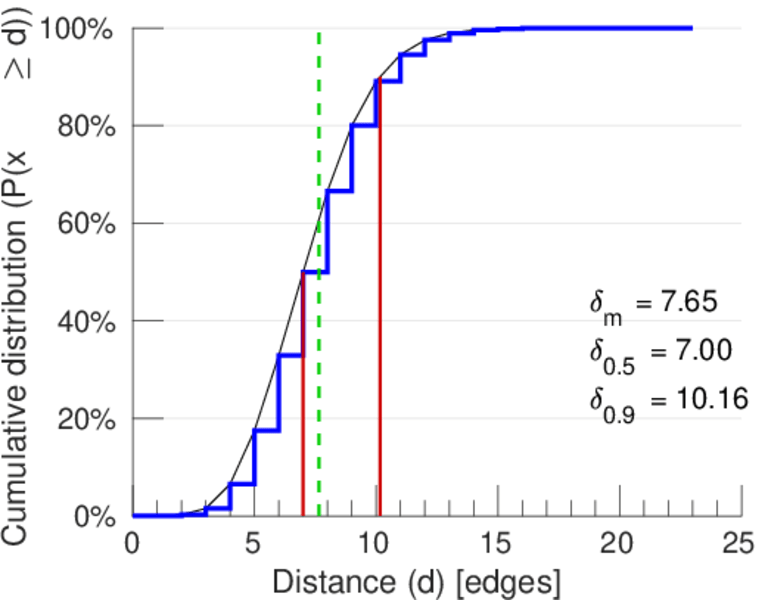
| Diameter | δ = | 25
|
| 50-Percentile effective diameter | δ0.5 = | 7.004 01
|
| 90-Percentile effective diameter | δ0.9 = | 10.164 7
|
| Median distance | δM = | 8
|
| Mean distance | δm = | 7.653 92
|
| Gini coefficient | G = | 0.506 040
|
| Balanced inequality ratio | P = | 0.299 738
|
| Relative edge distribution entropy | Her = | 0.943 421
|
| Power law exponent | γ = | 2.601 21
|
| Tail power law exponent | γt = | 2.991 00
|
| Tail power law exponent with p | γ3 = | 2.991 00
|
| p-value | p = | 0.002 000 00
|
| Degree assortativity | ρ = | +0.386 786
|
| Degree assortativity p-value | pρ = | 0.000 00
|
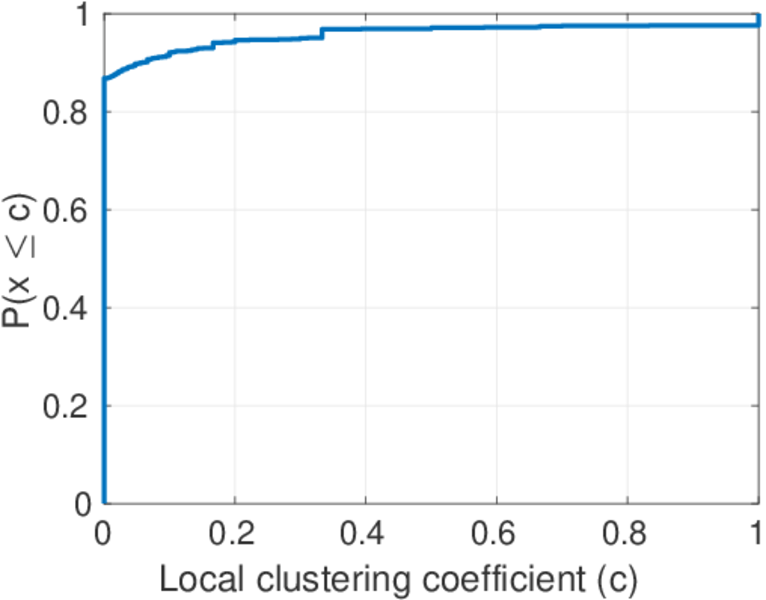
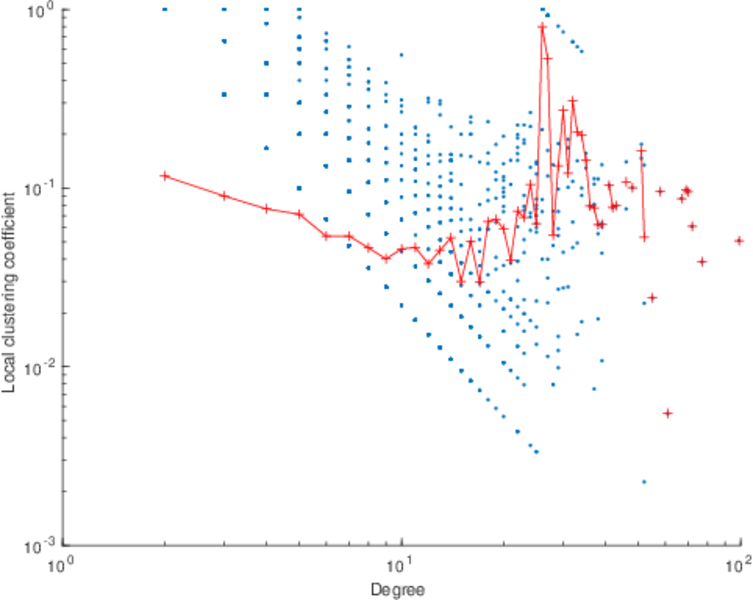
| Clustering coefficient | c = | 0.111 361
|
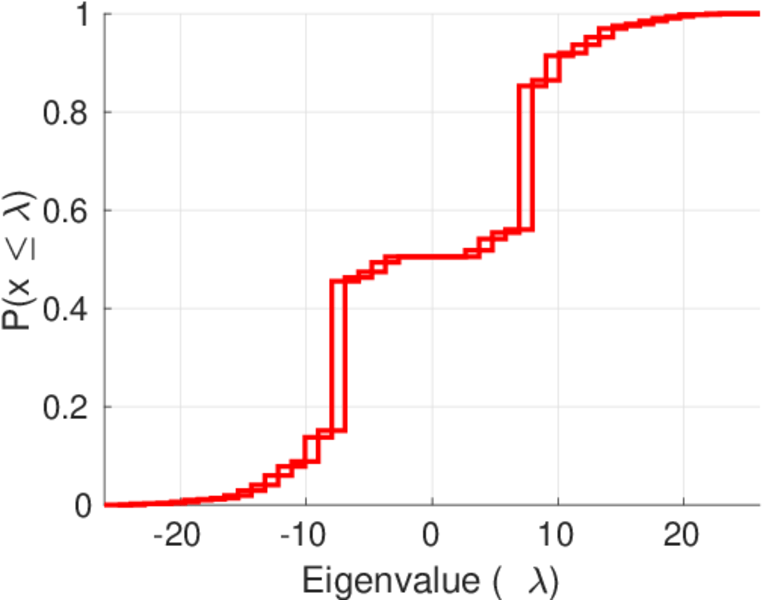
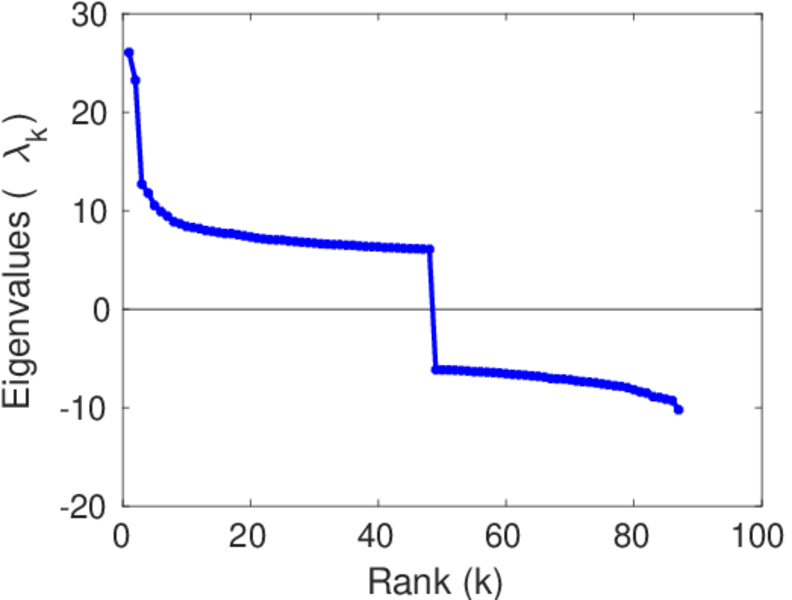
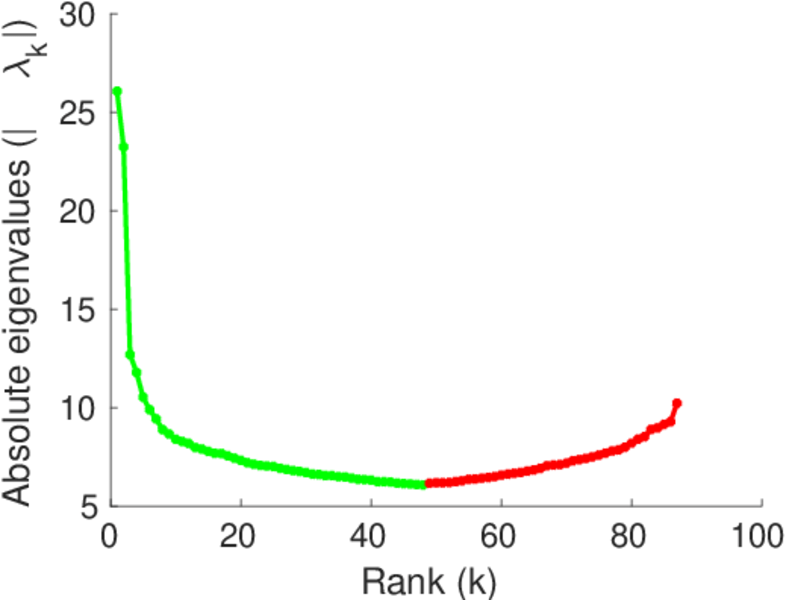
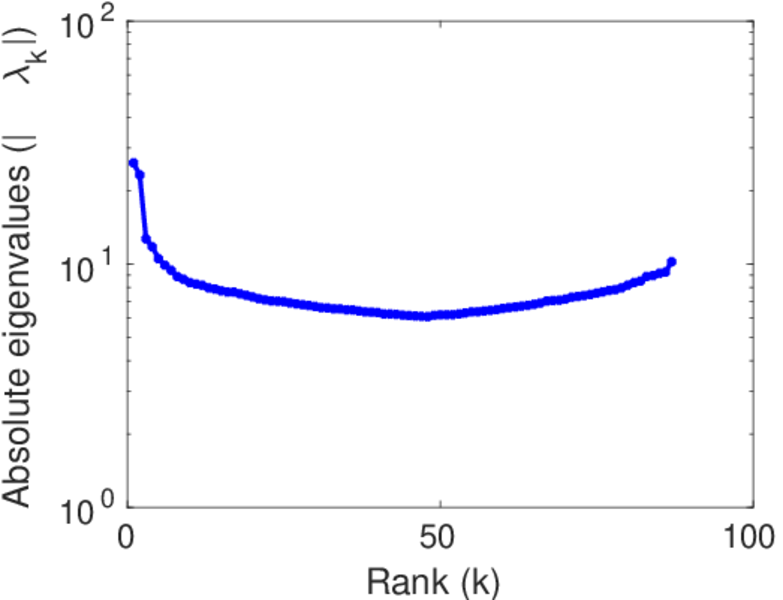
| Spectral norm | α = | 26.059 7
|
| Algebraic connectivity | a = | 0.008 981 29
|
| Spectral separation | |λ1[A] / λ2[A]| = | 1.121 46
|
| Non-bipartivity | bA = | 0.607 783
|
| Normalized non-bipartivity | bN = | 0.006 720 90
|
| Algebraic non-bipartivity | χ = | 0.012 754 3
|
| Spectral bipartite frustration | bK = | 0.000 914 670
|
| Controllability | C = | 3,379
|
| Relative controllability | Cr = | 0.236 724
|
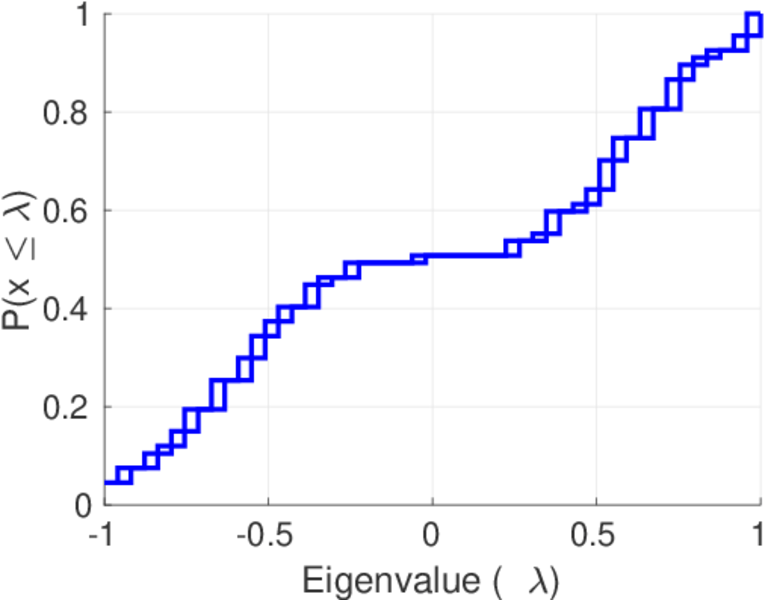
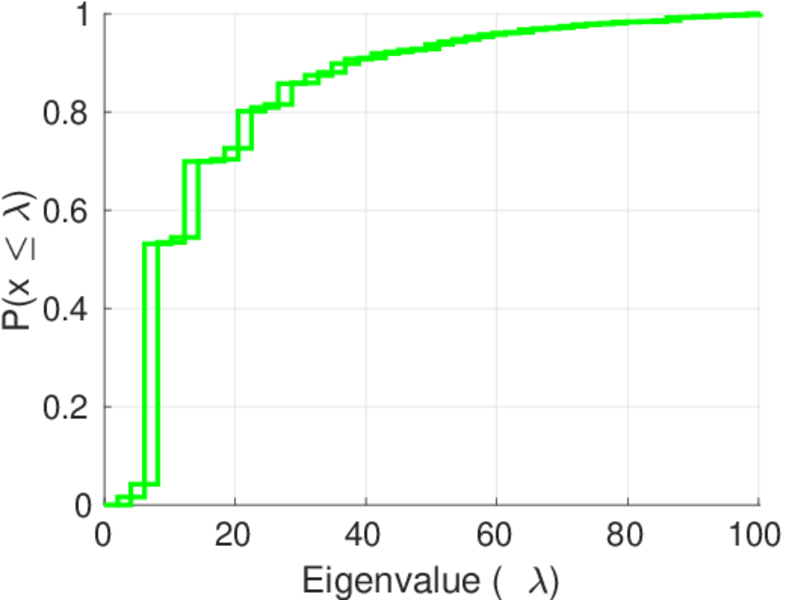
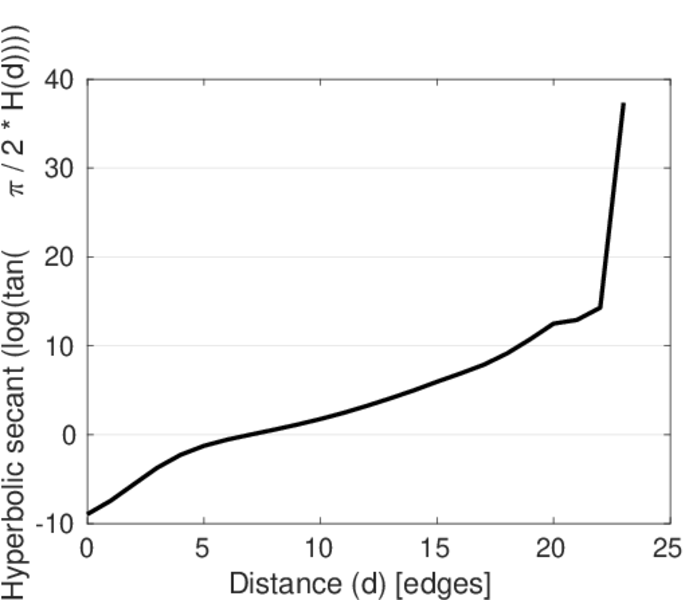
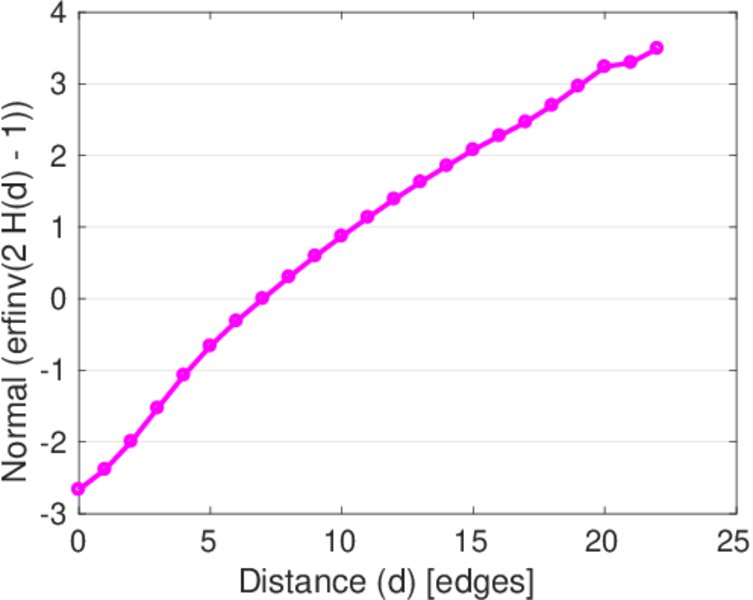
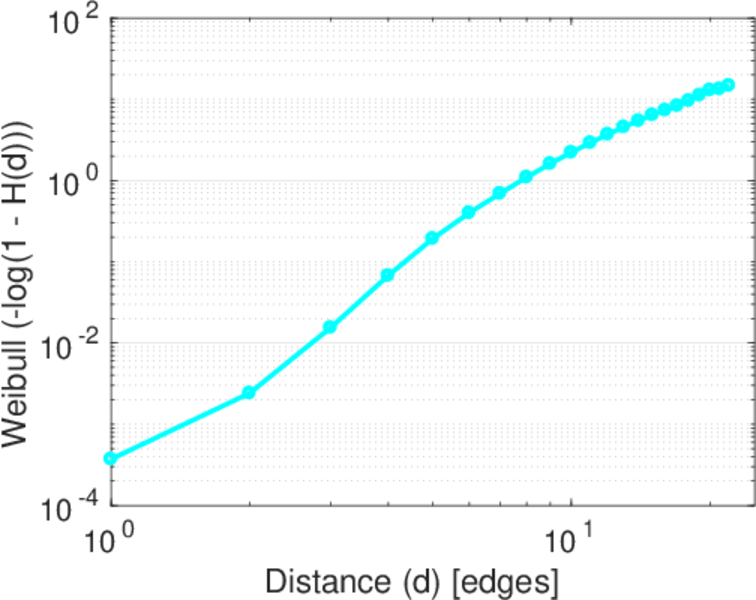
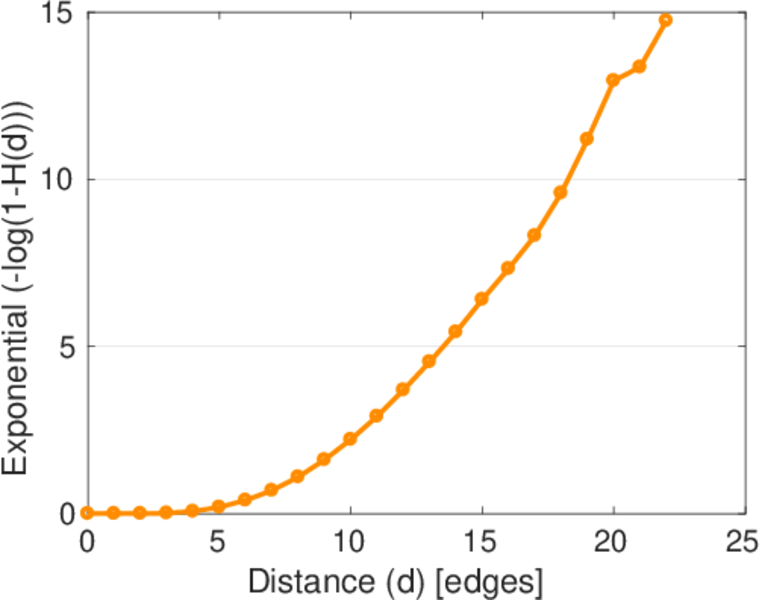
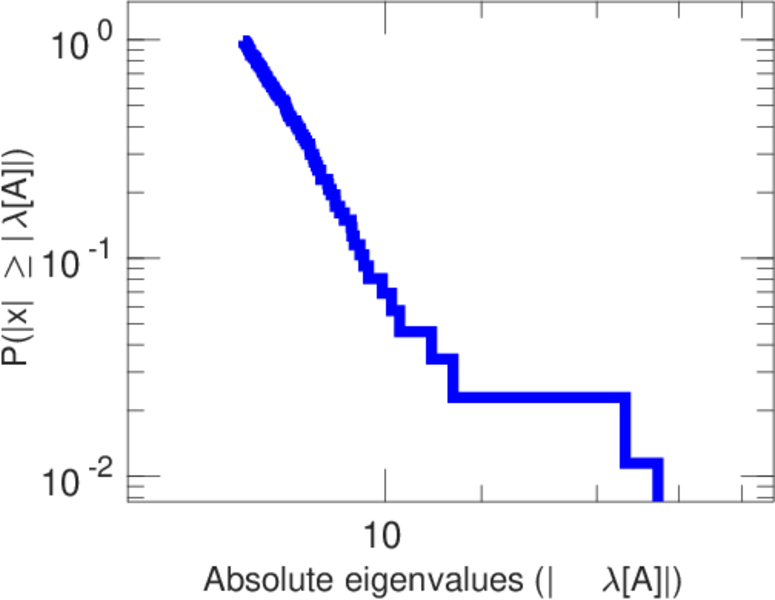
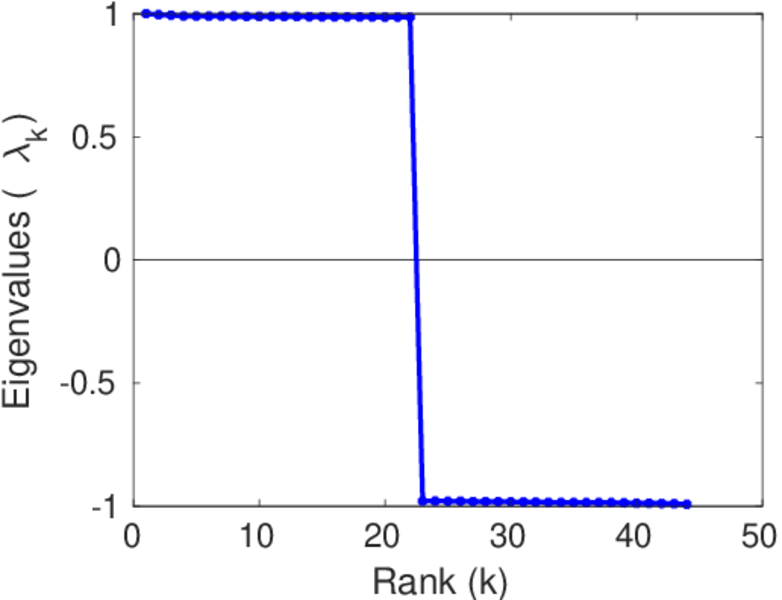
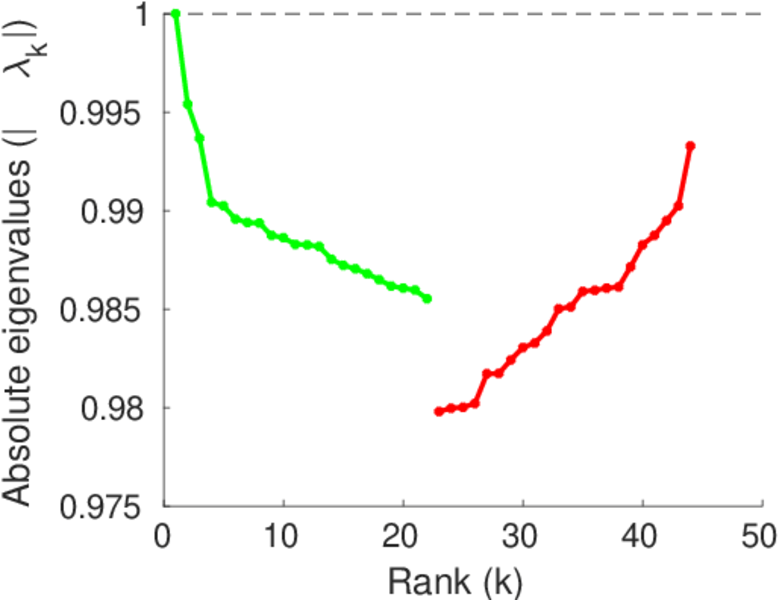
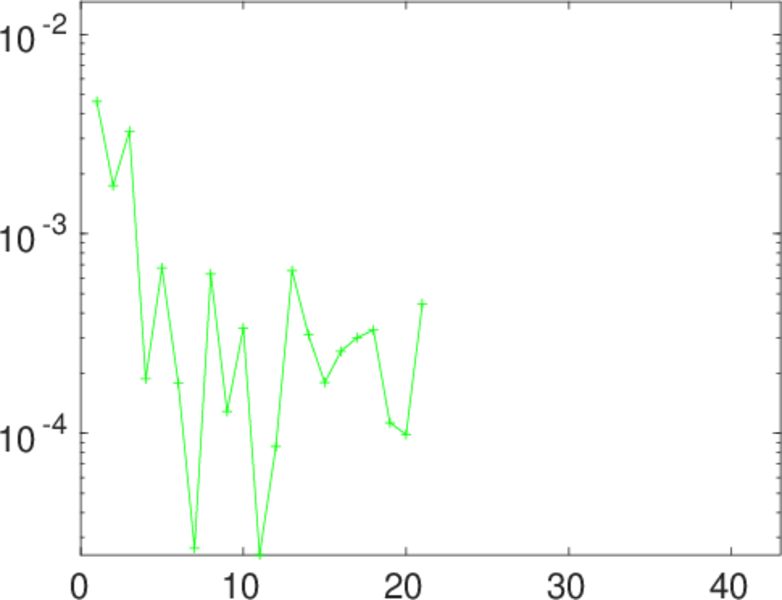
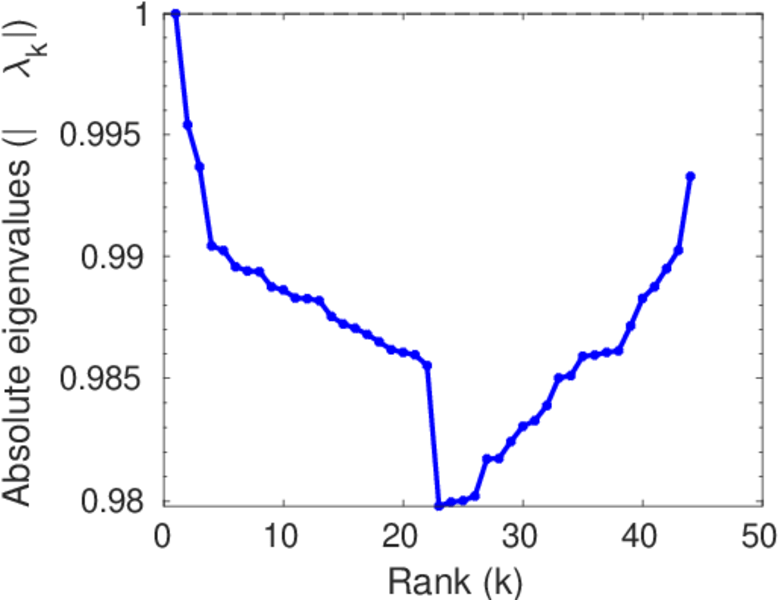
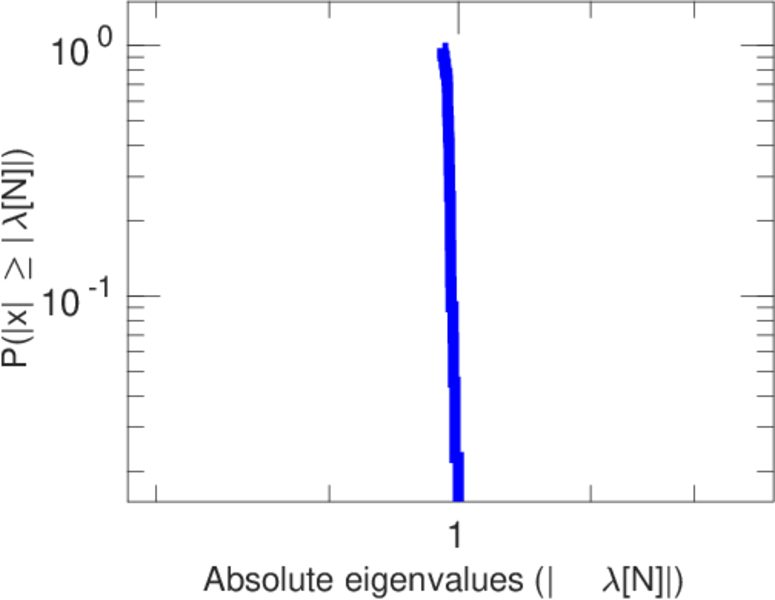
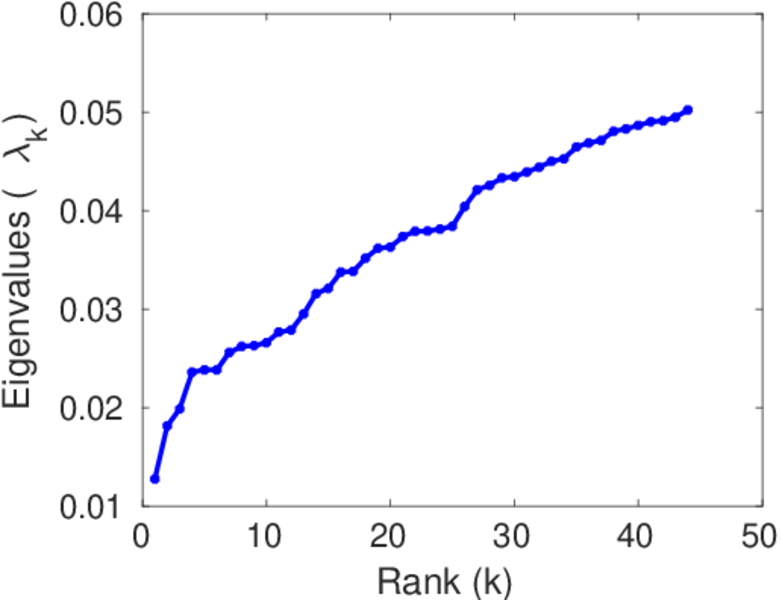
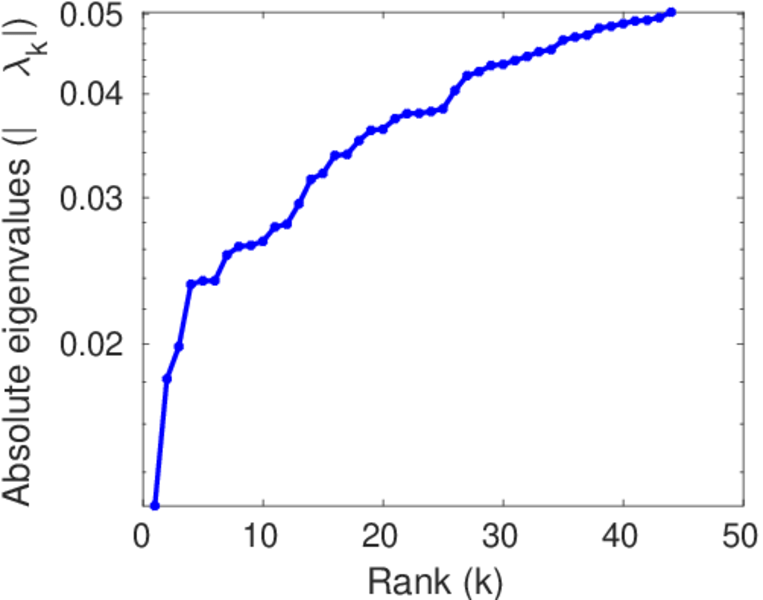
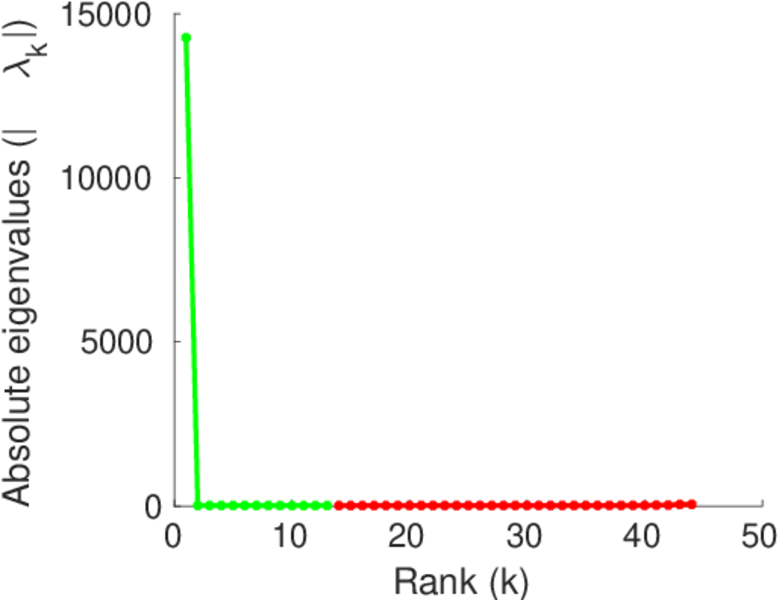
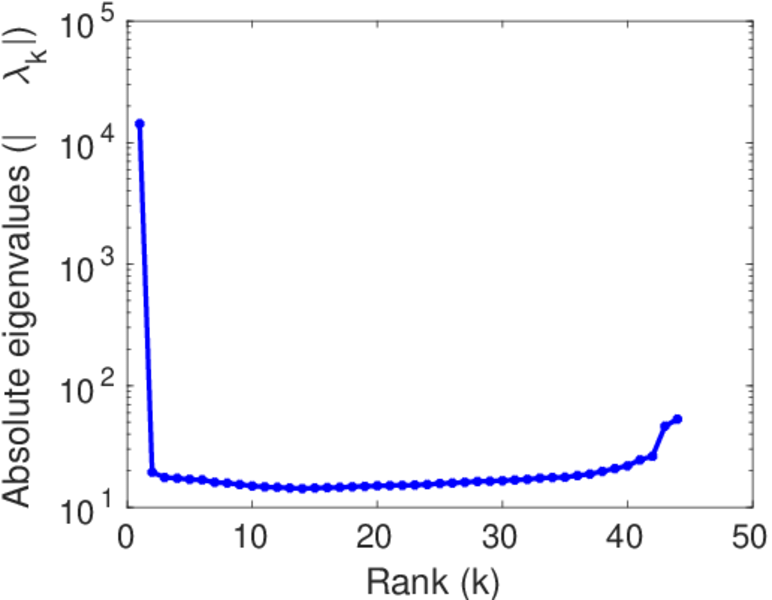
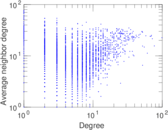
Plots


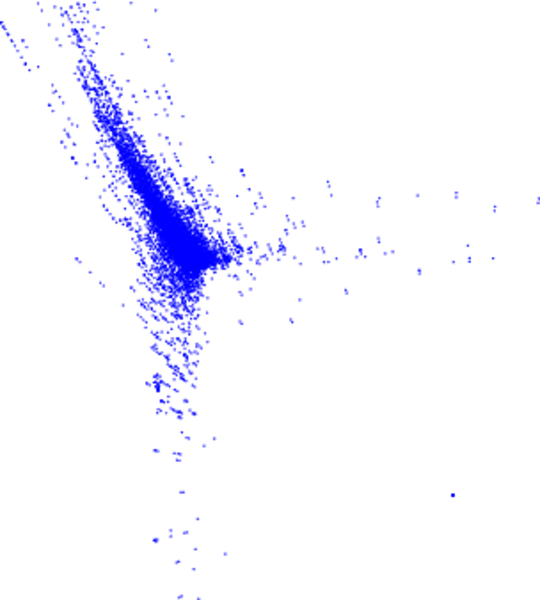
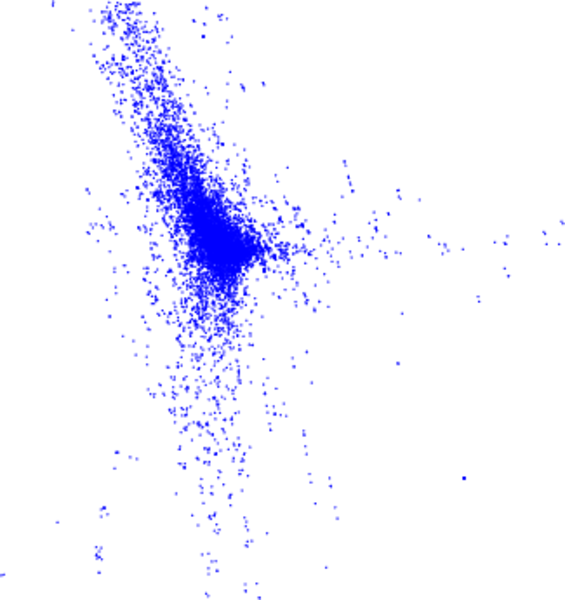
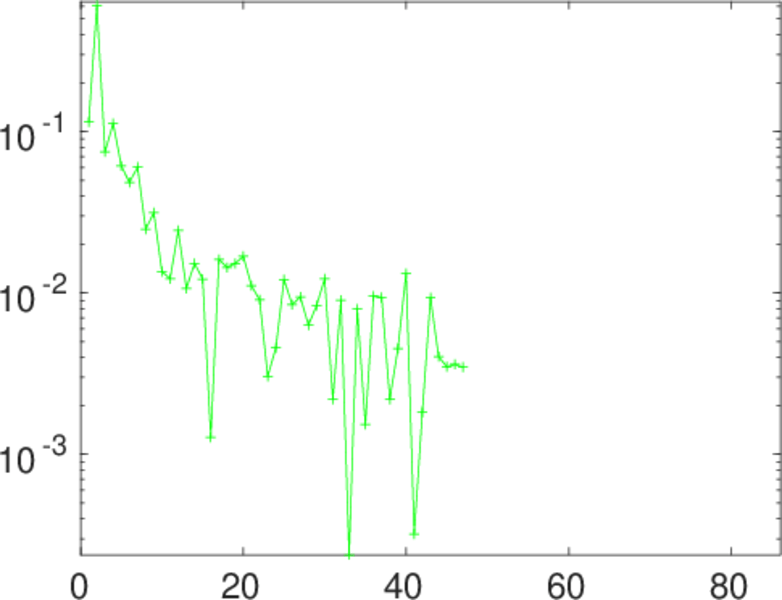
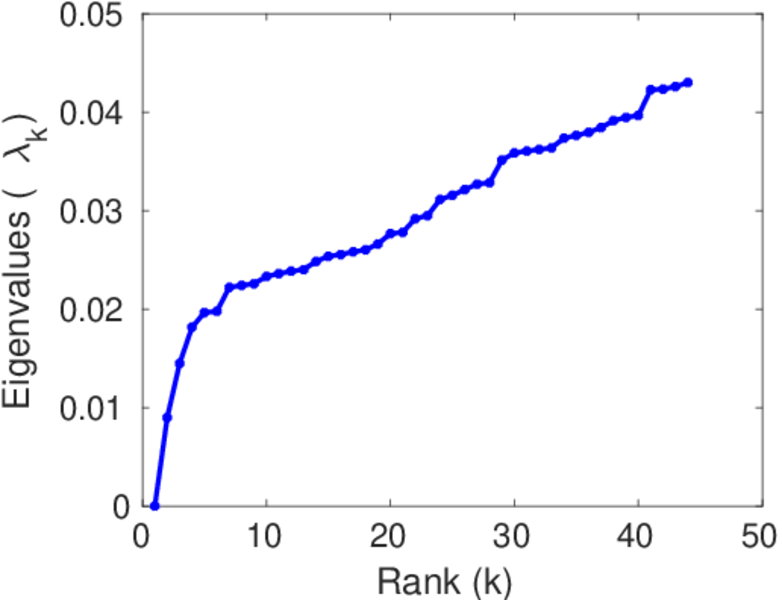
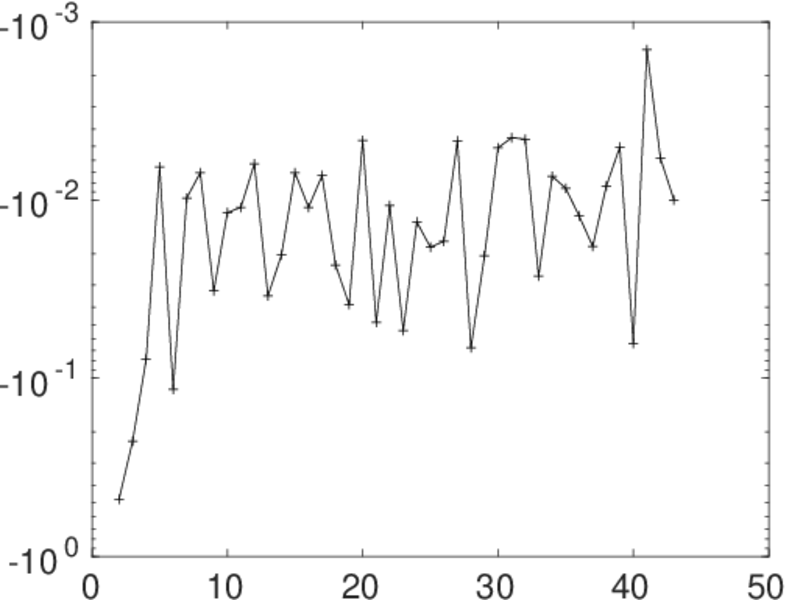
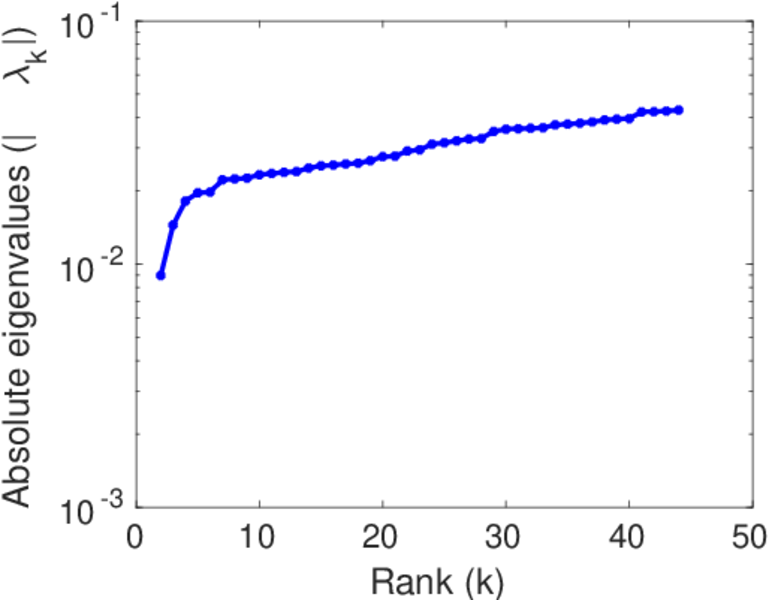
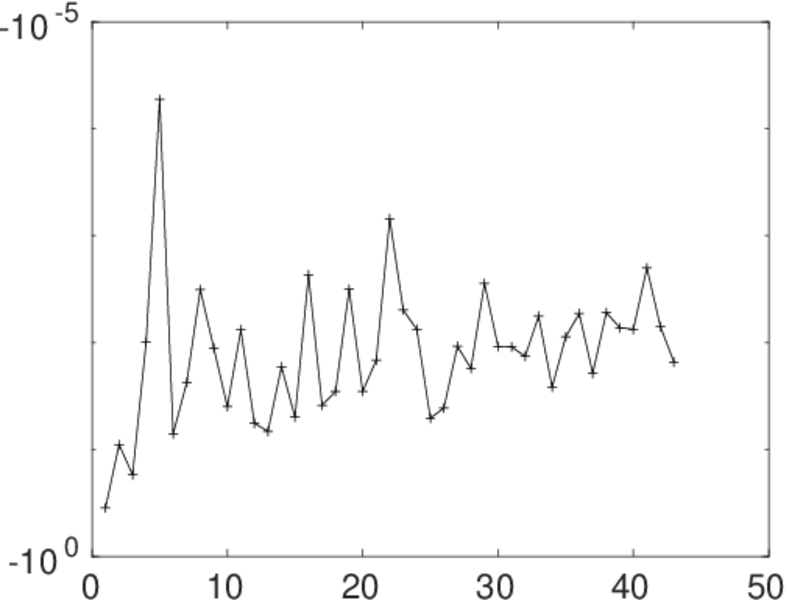
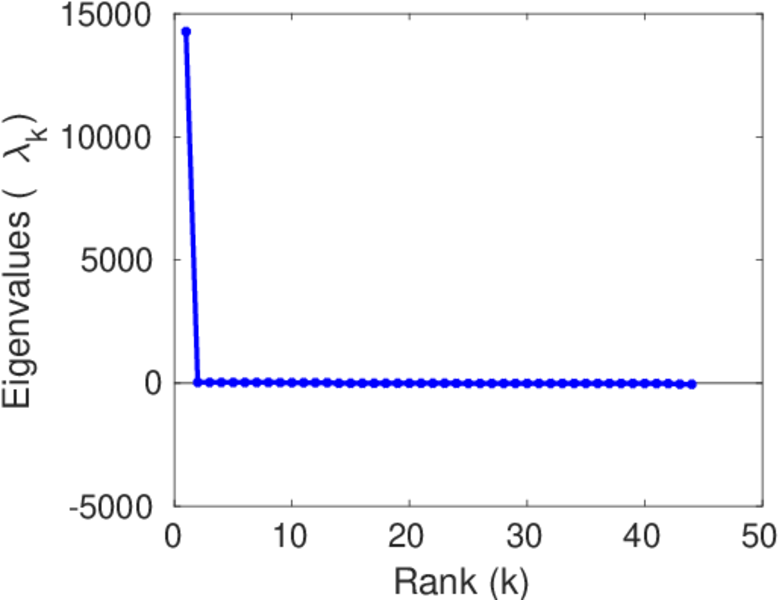
Matrix decompositions plots


Downloads
References
|
[1]
|
Jérôme Kunegis.
KONECT – The Koblenz Network Collection.
In Proc. Int. Conf. on World Wide Web Companion, pages
1343–1350, 2013.
[ http ]
|
 KONECT ‣ Networks ‣
Buy Me a Coffee
KONECT ‣ Networks ‣
Buy Me a Coffee