Zachary karate club

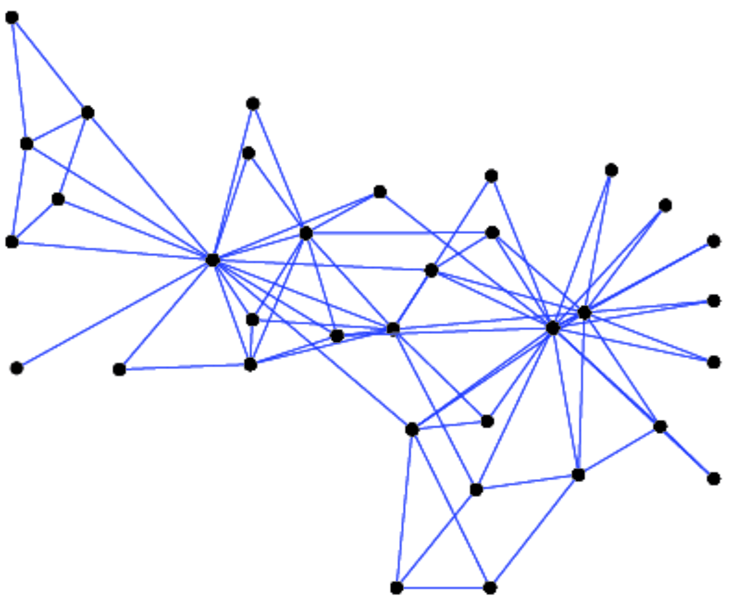
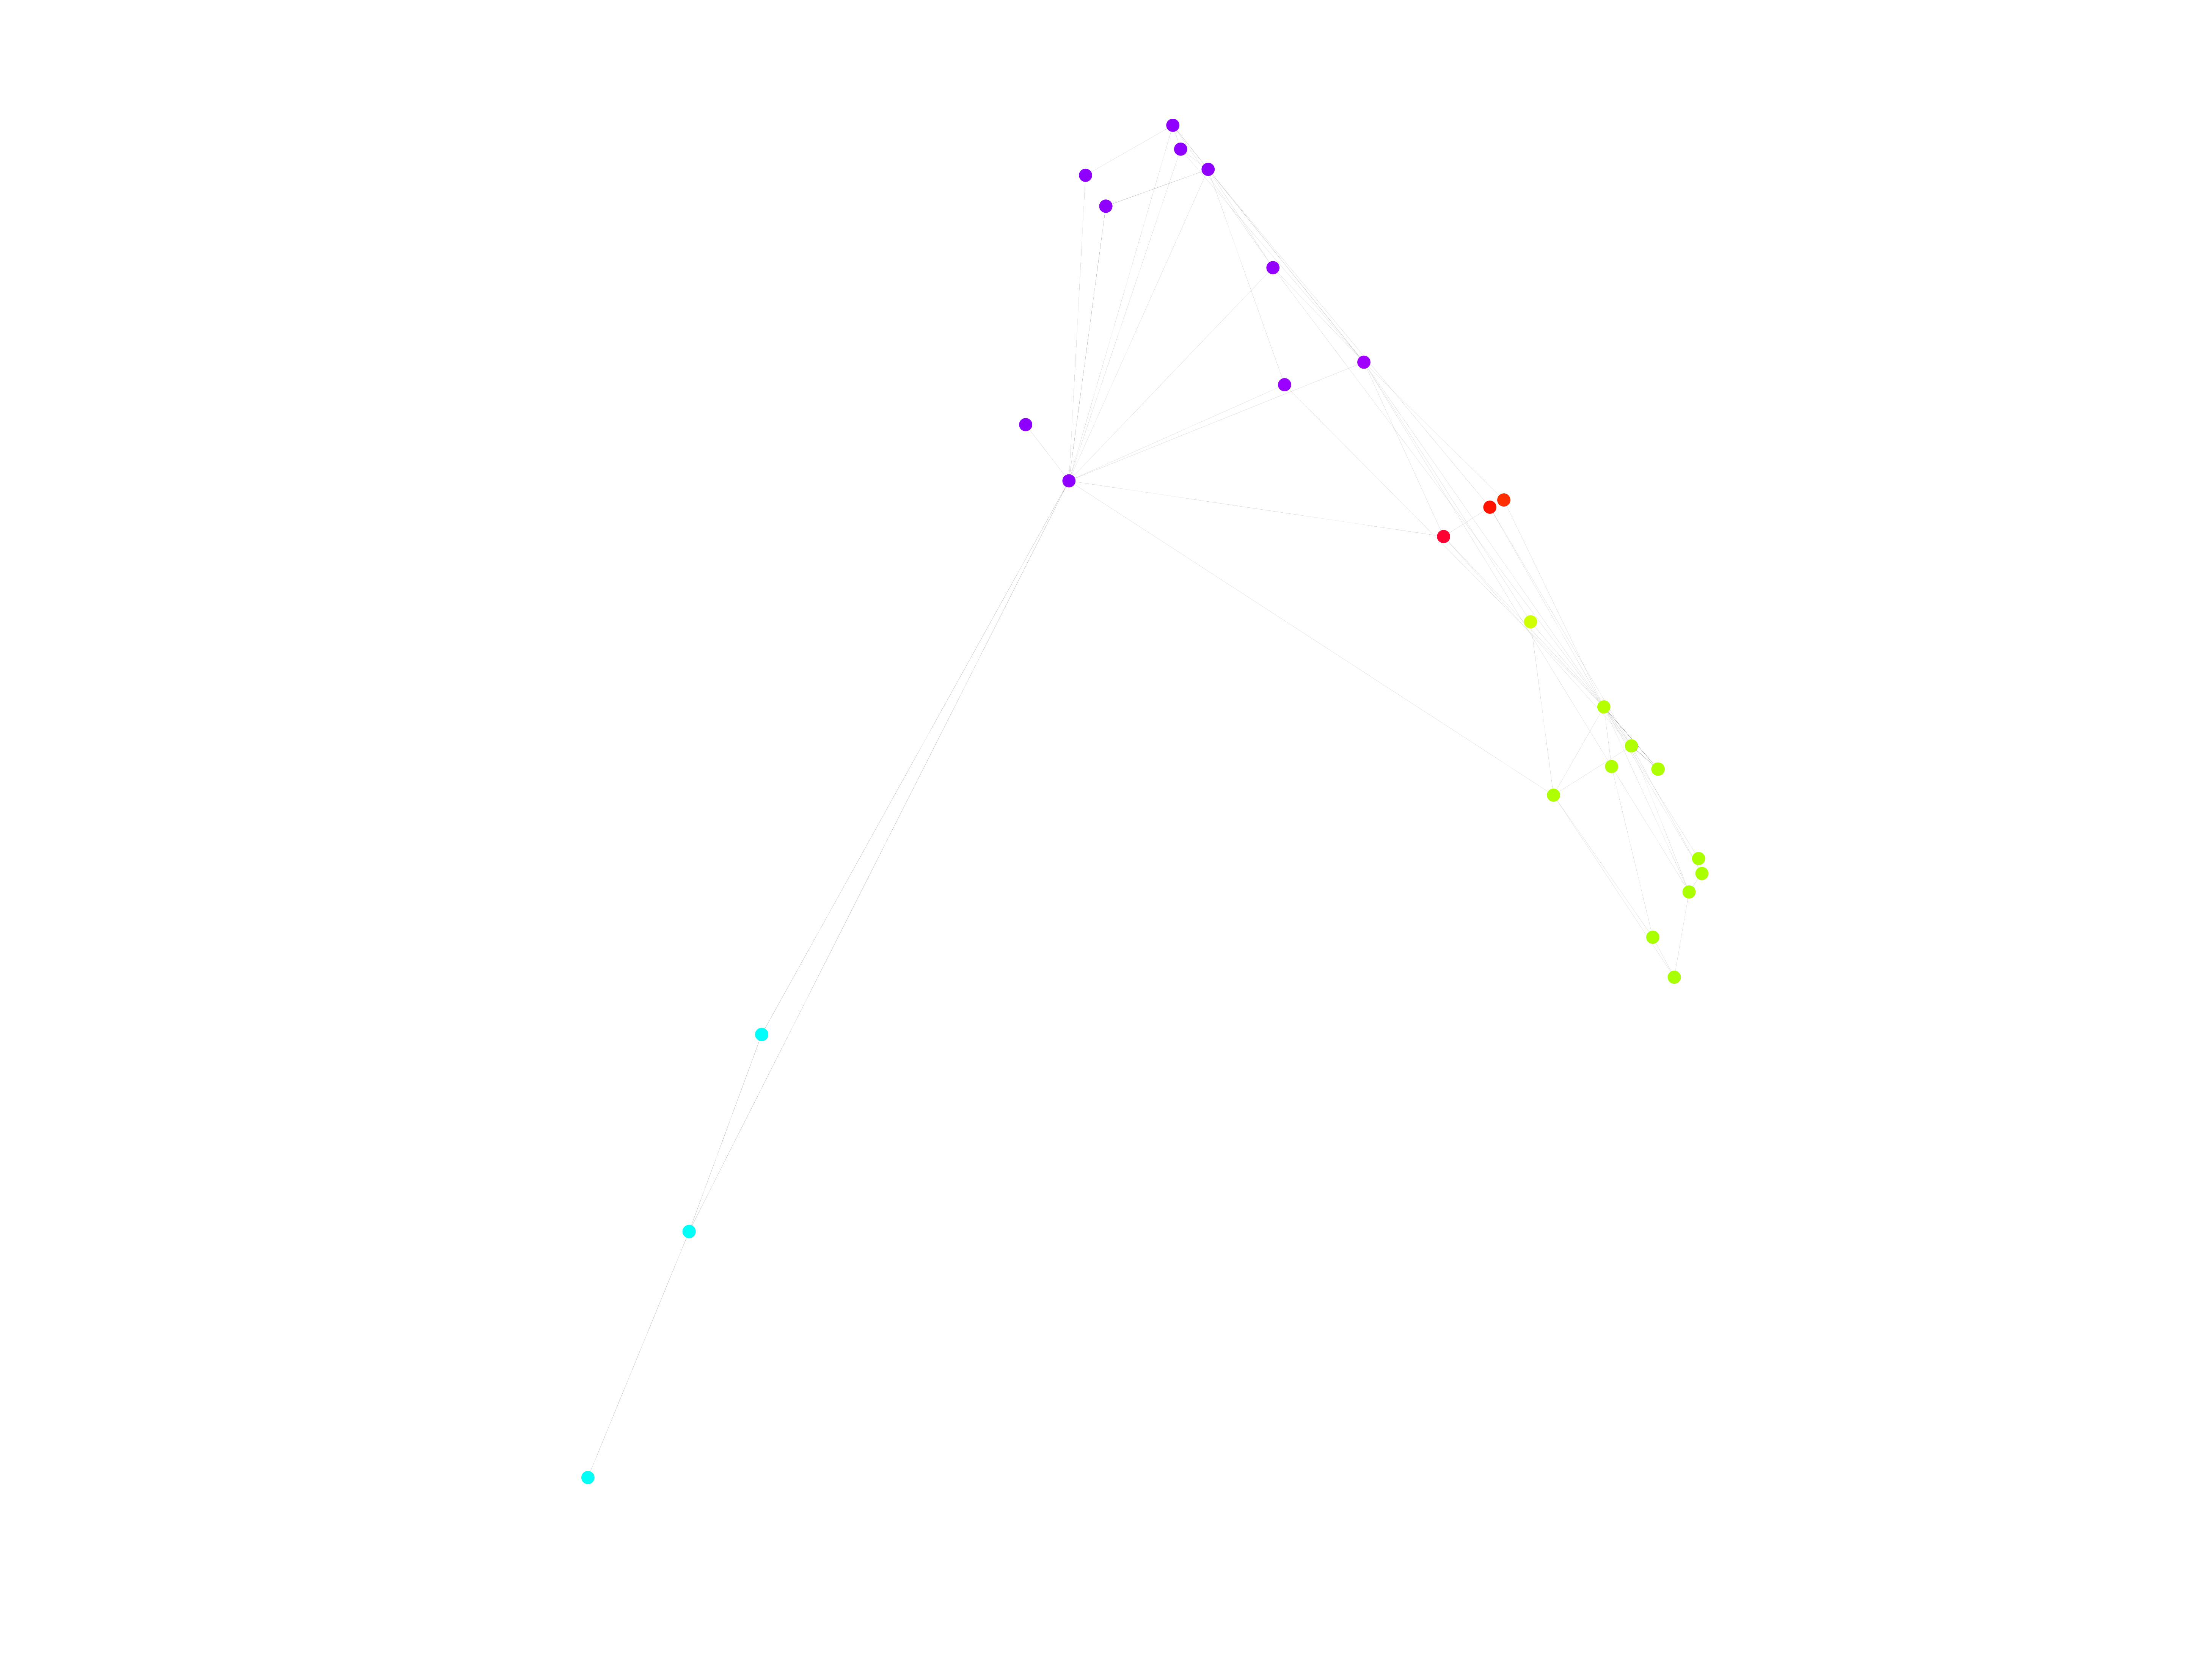
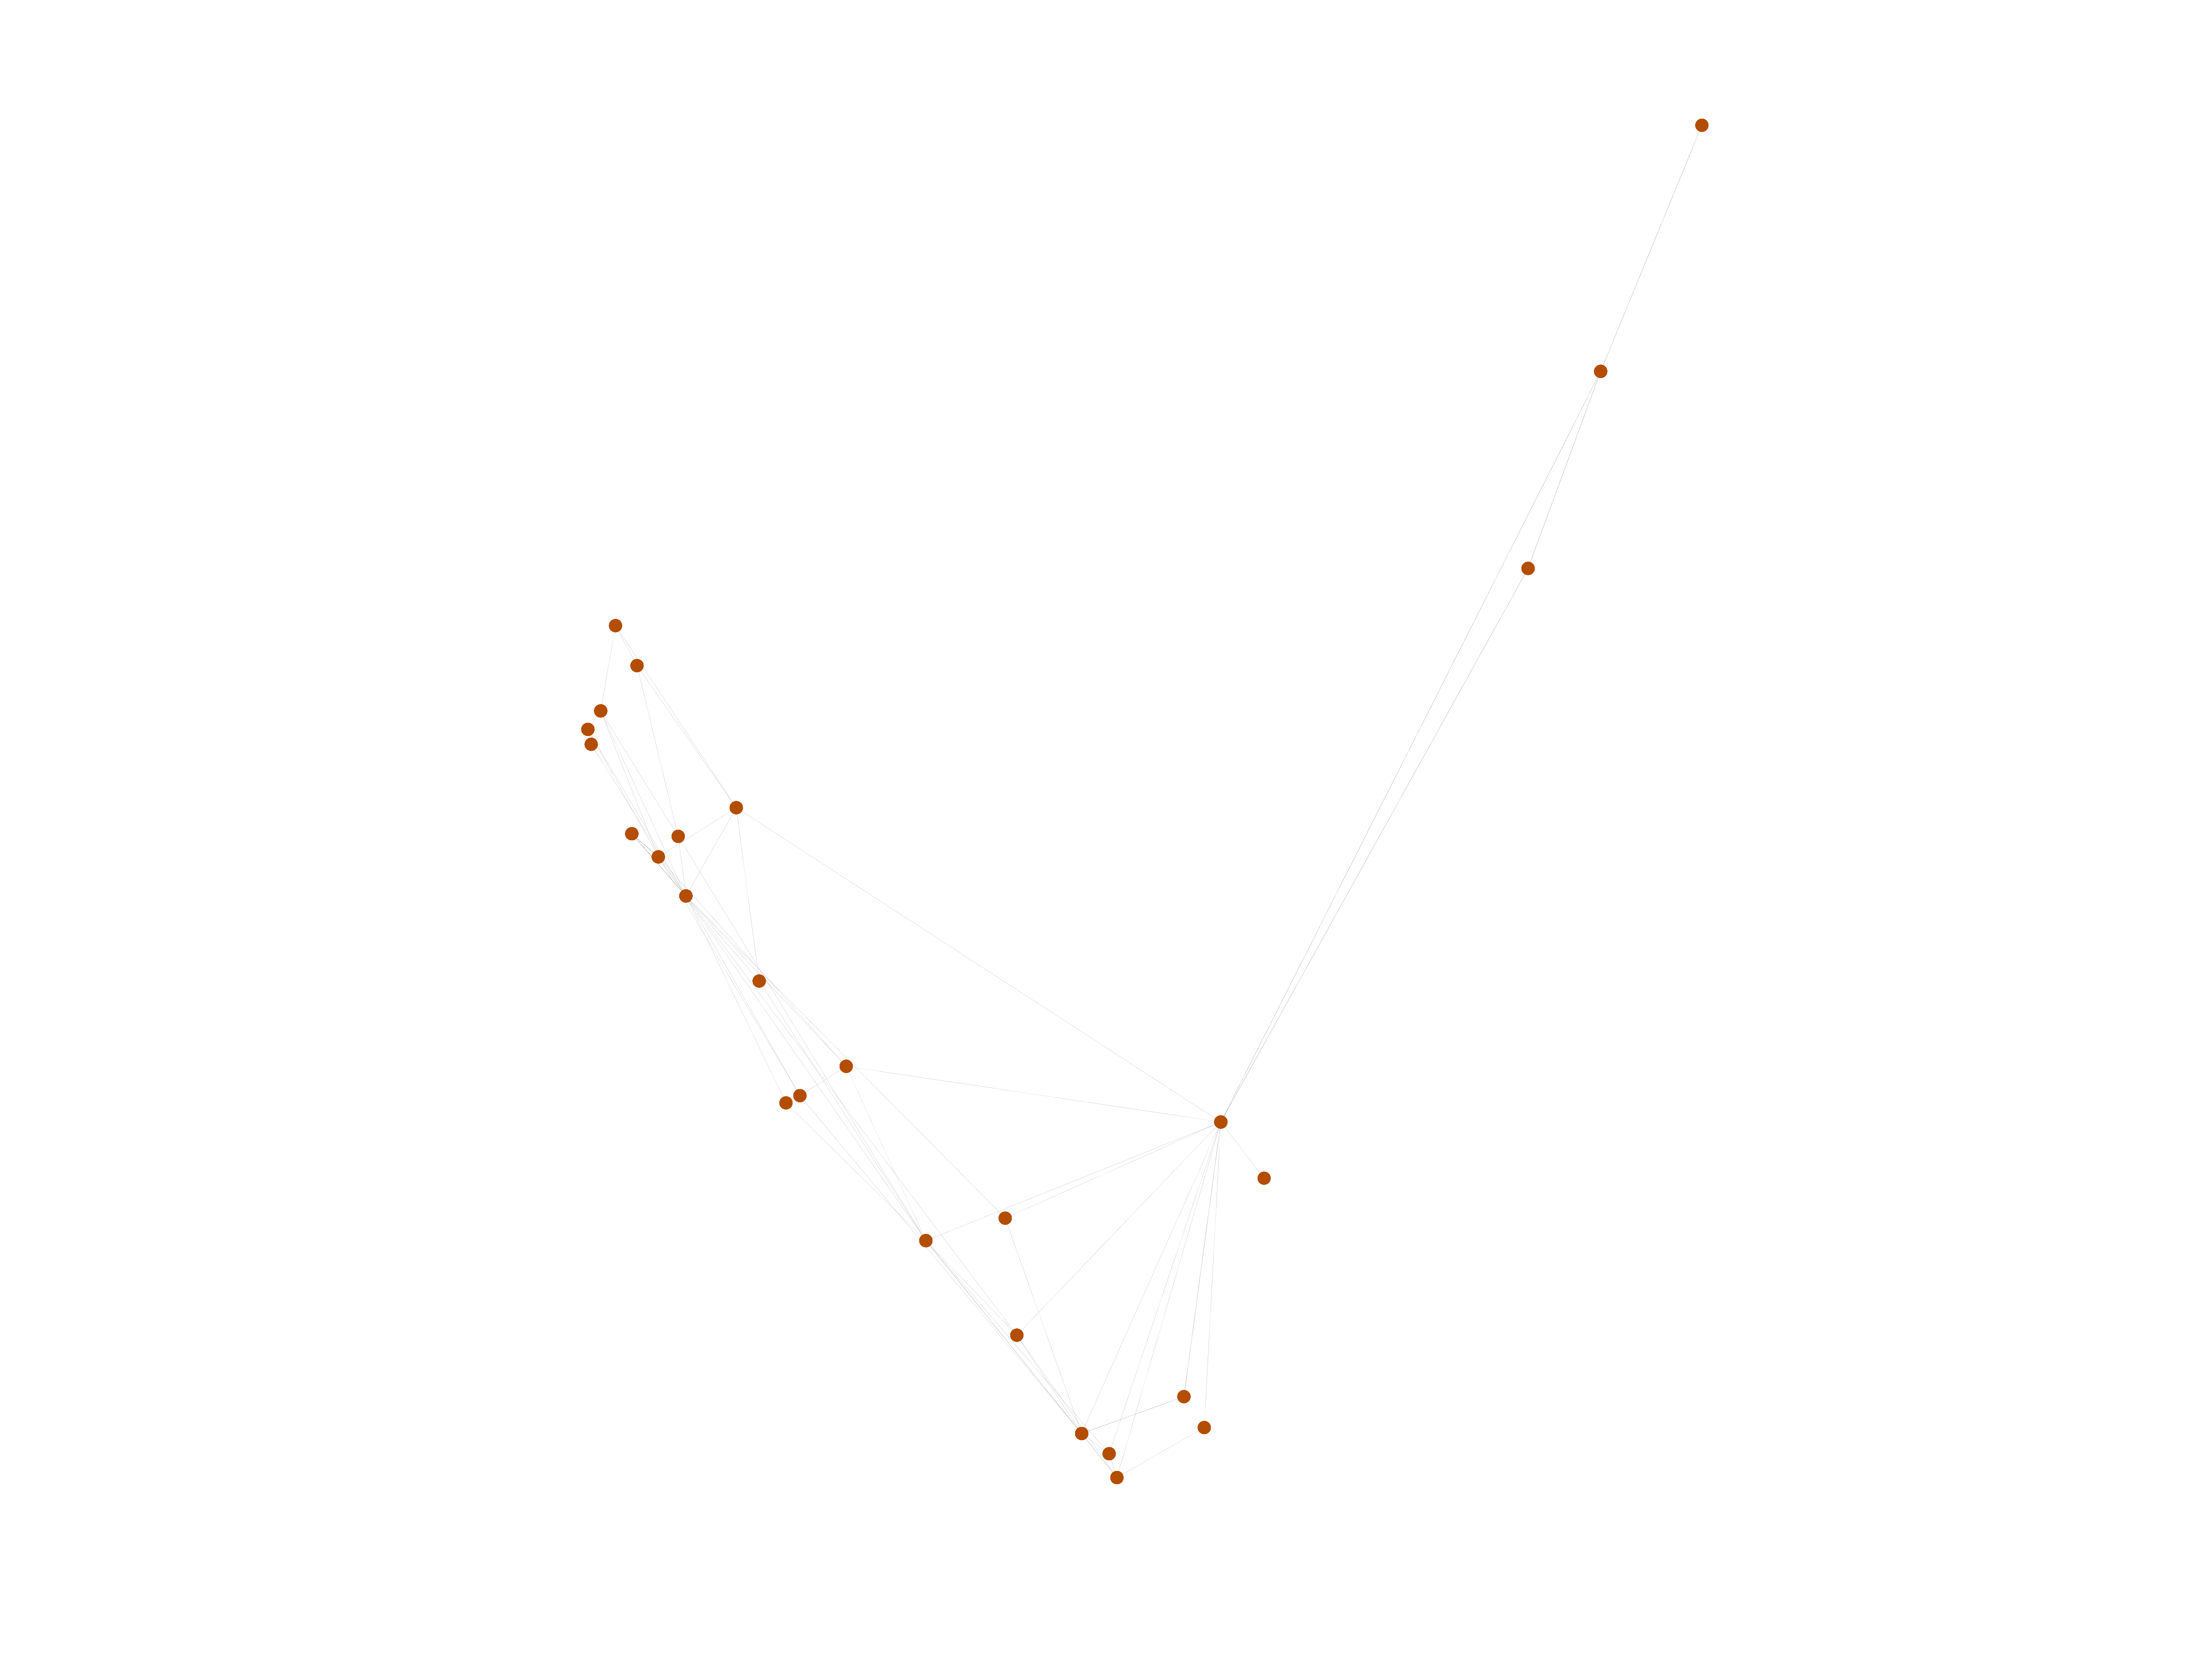
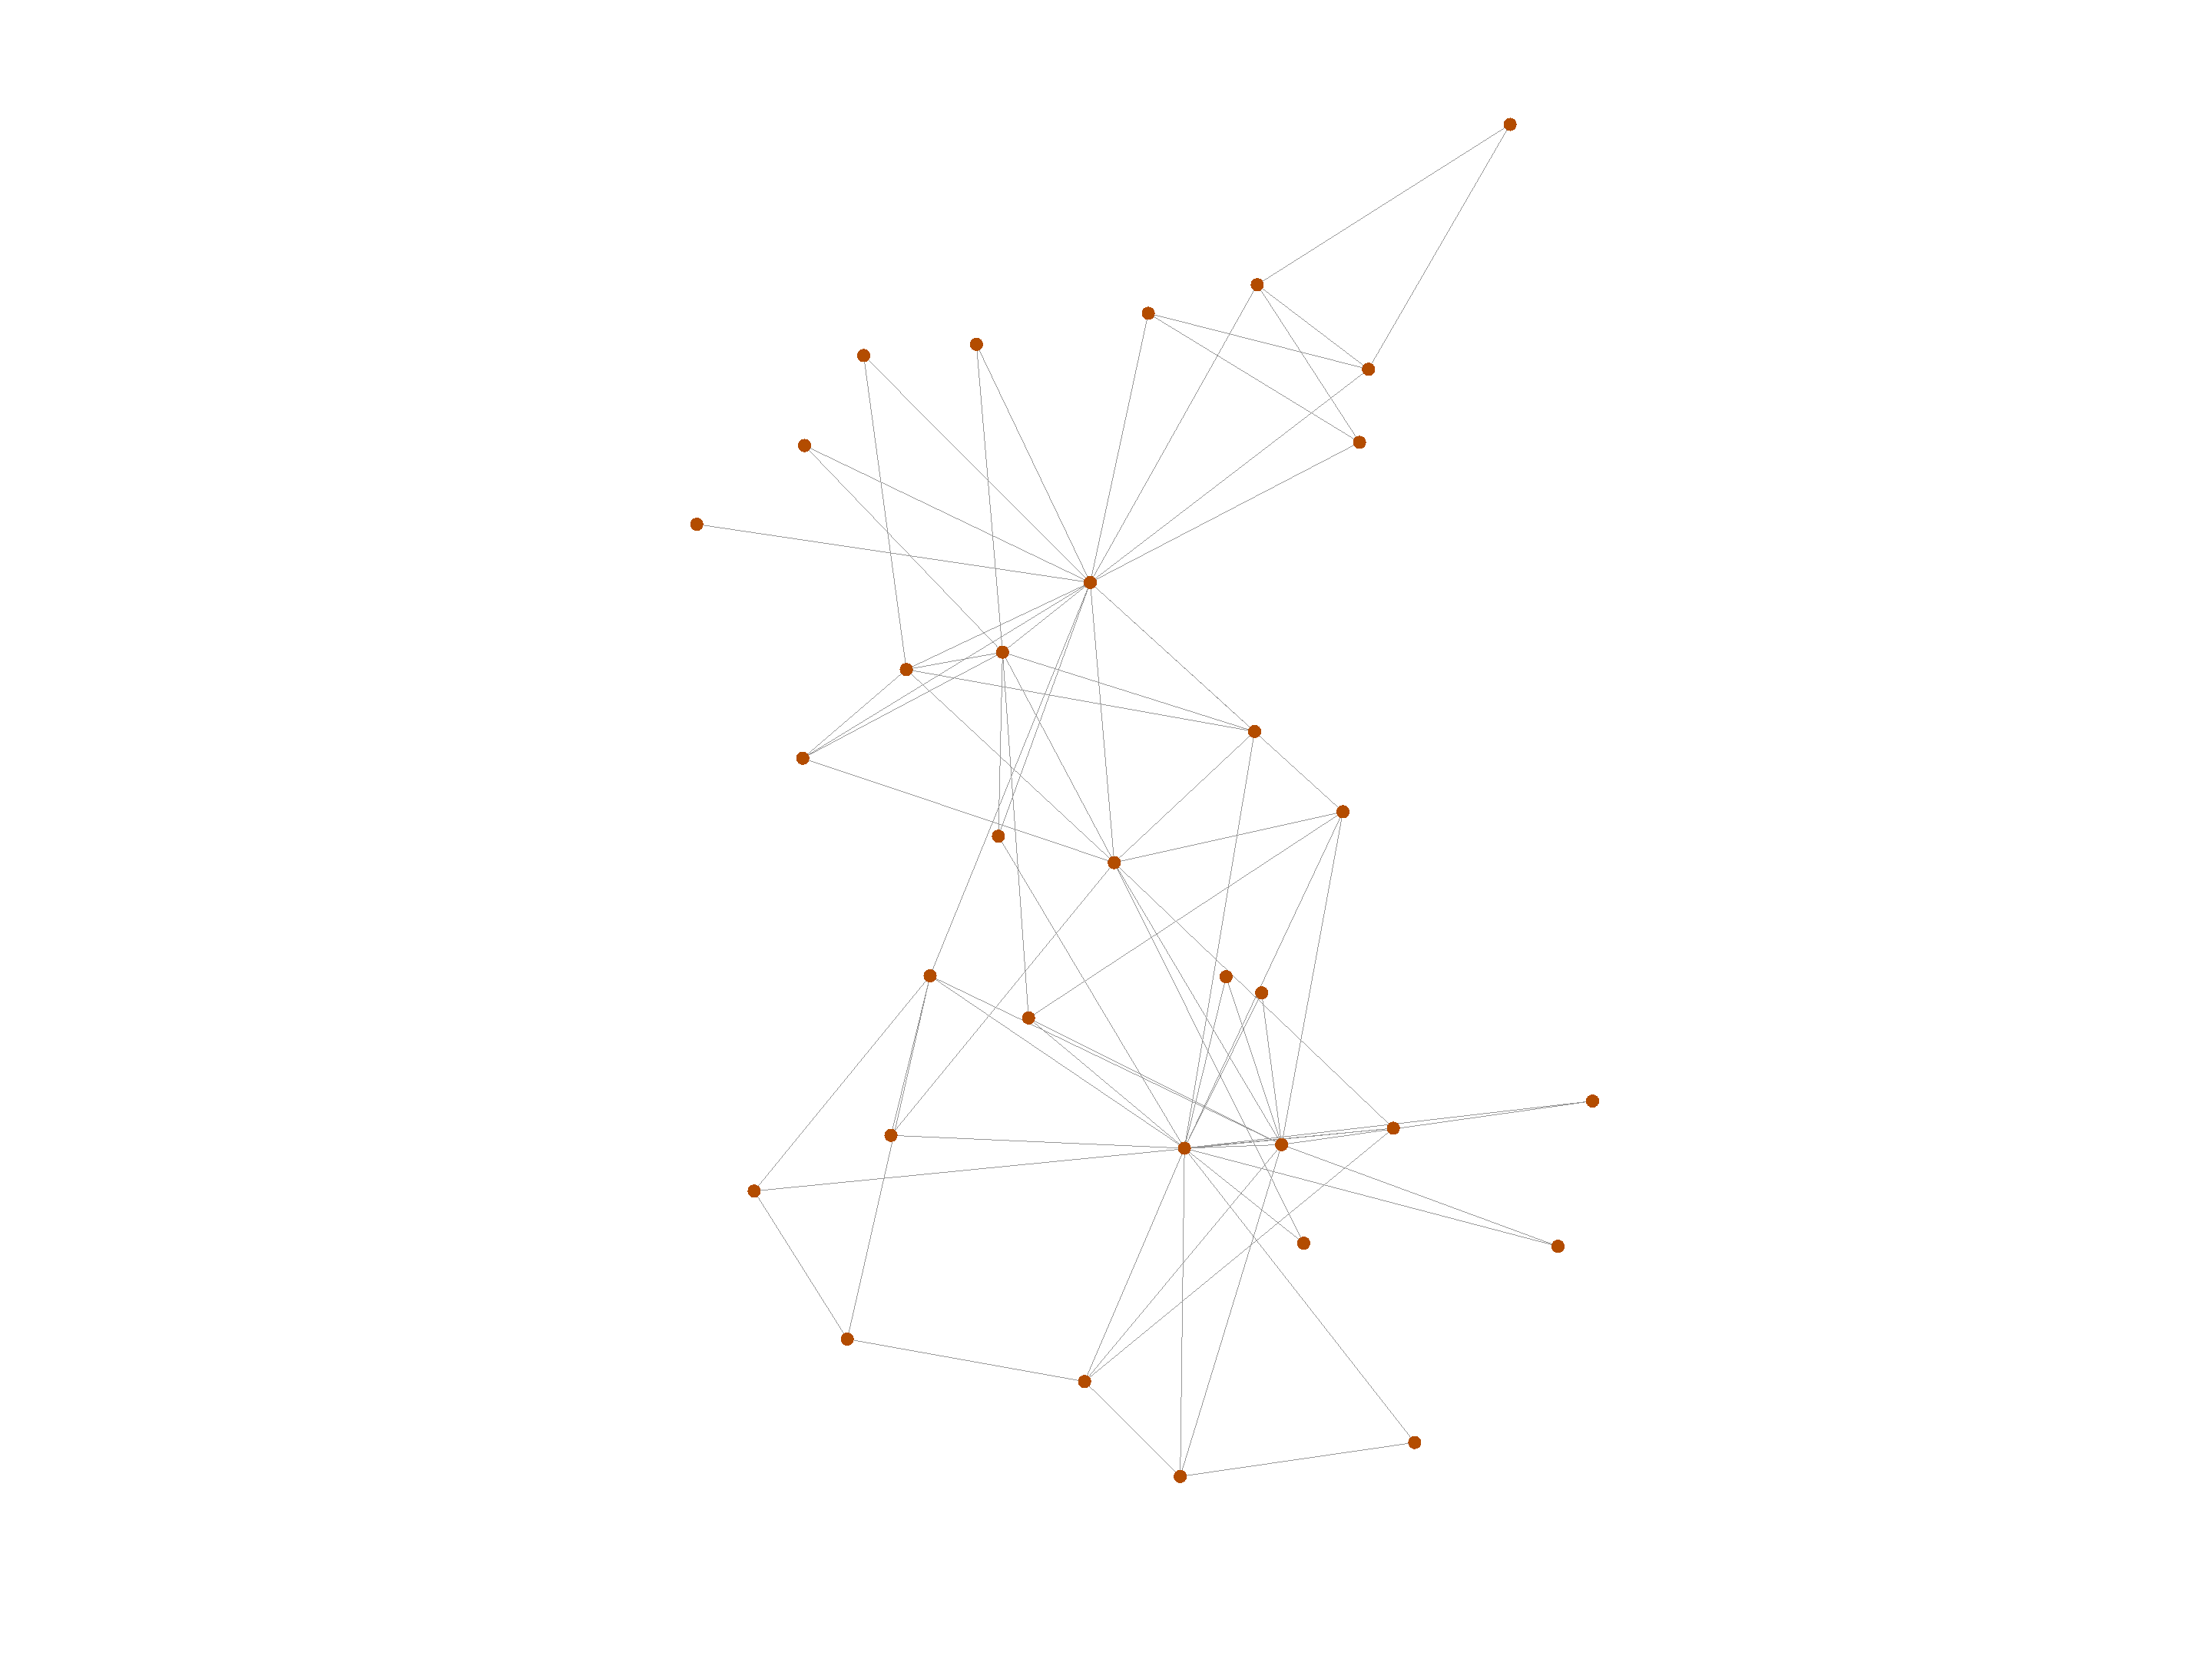
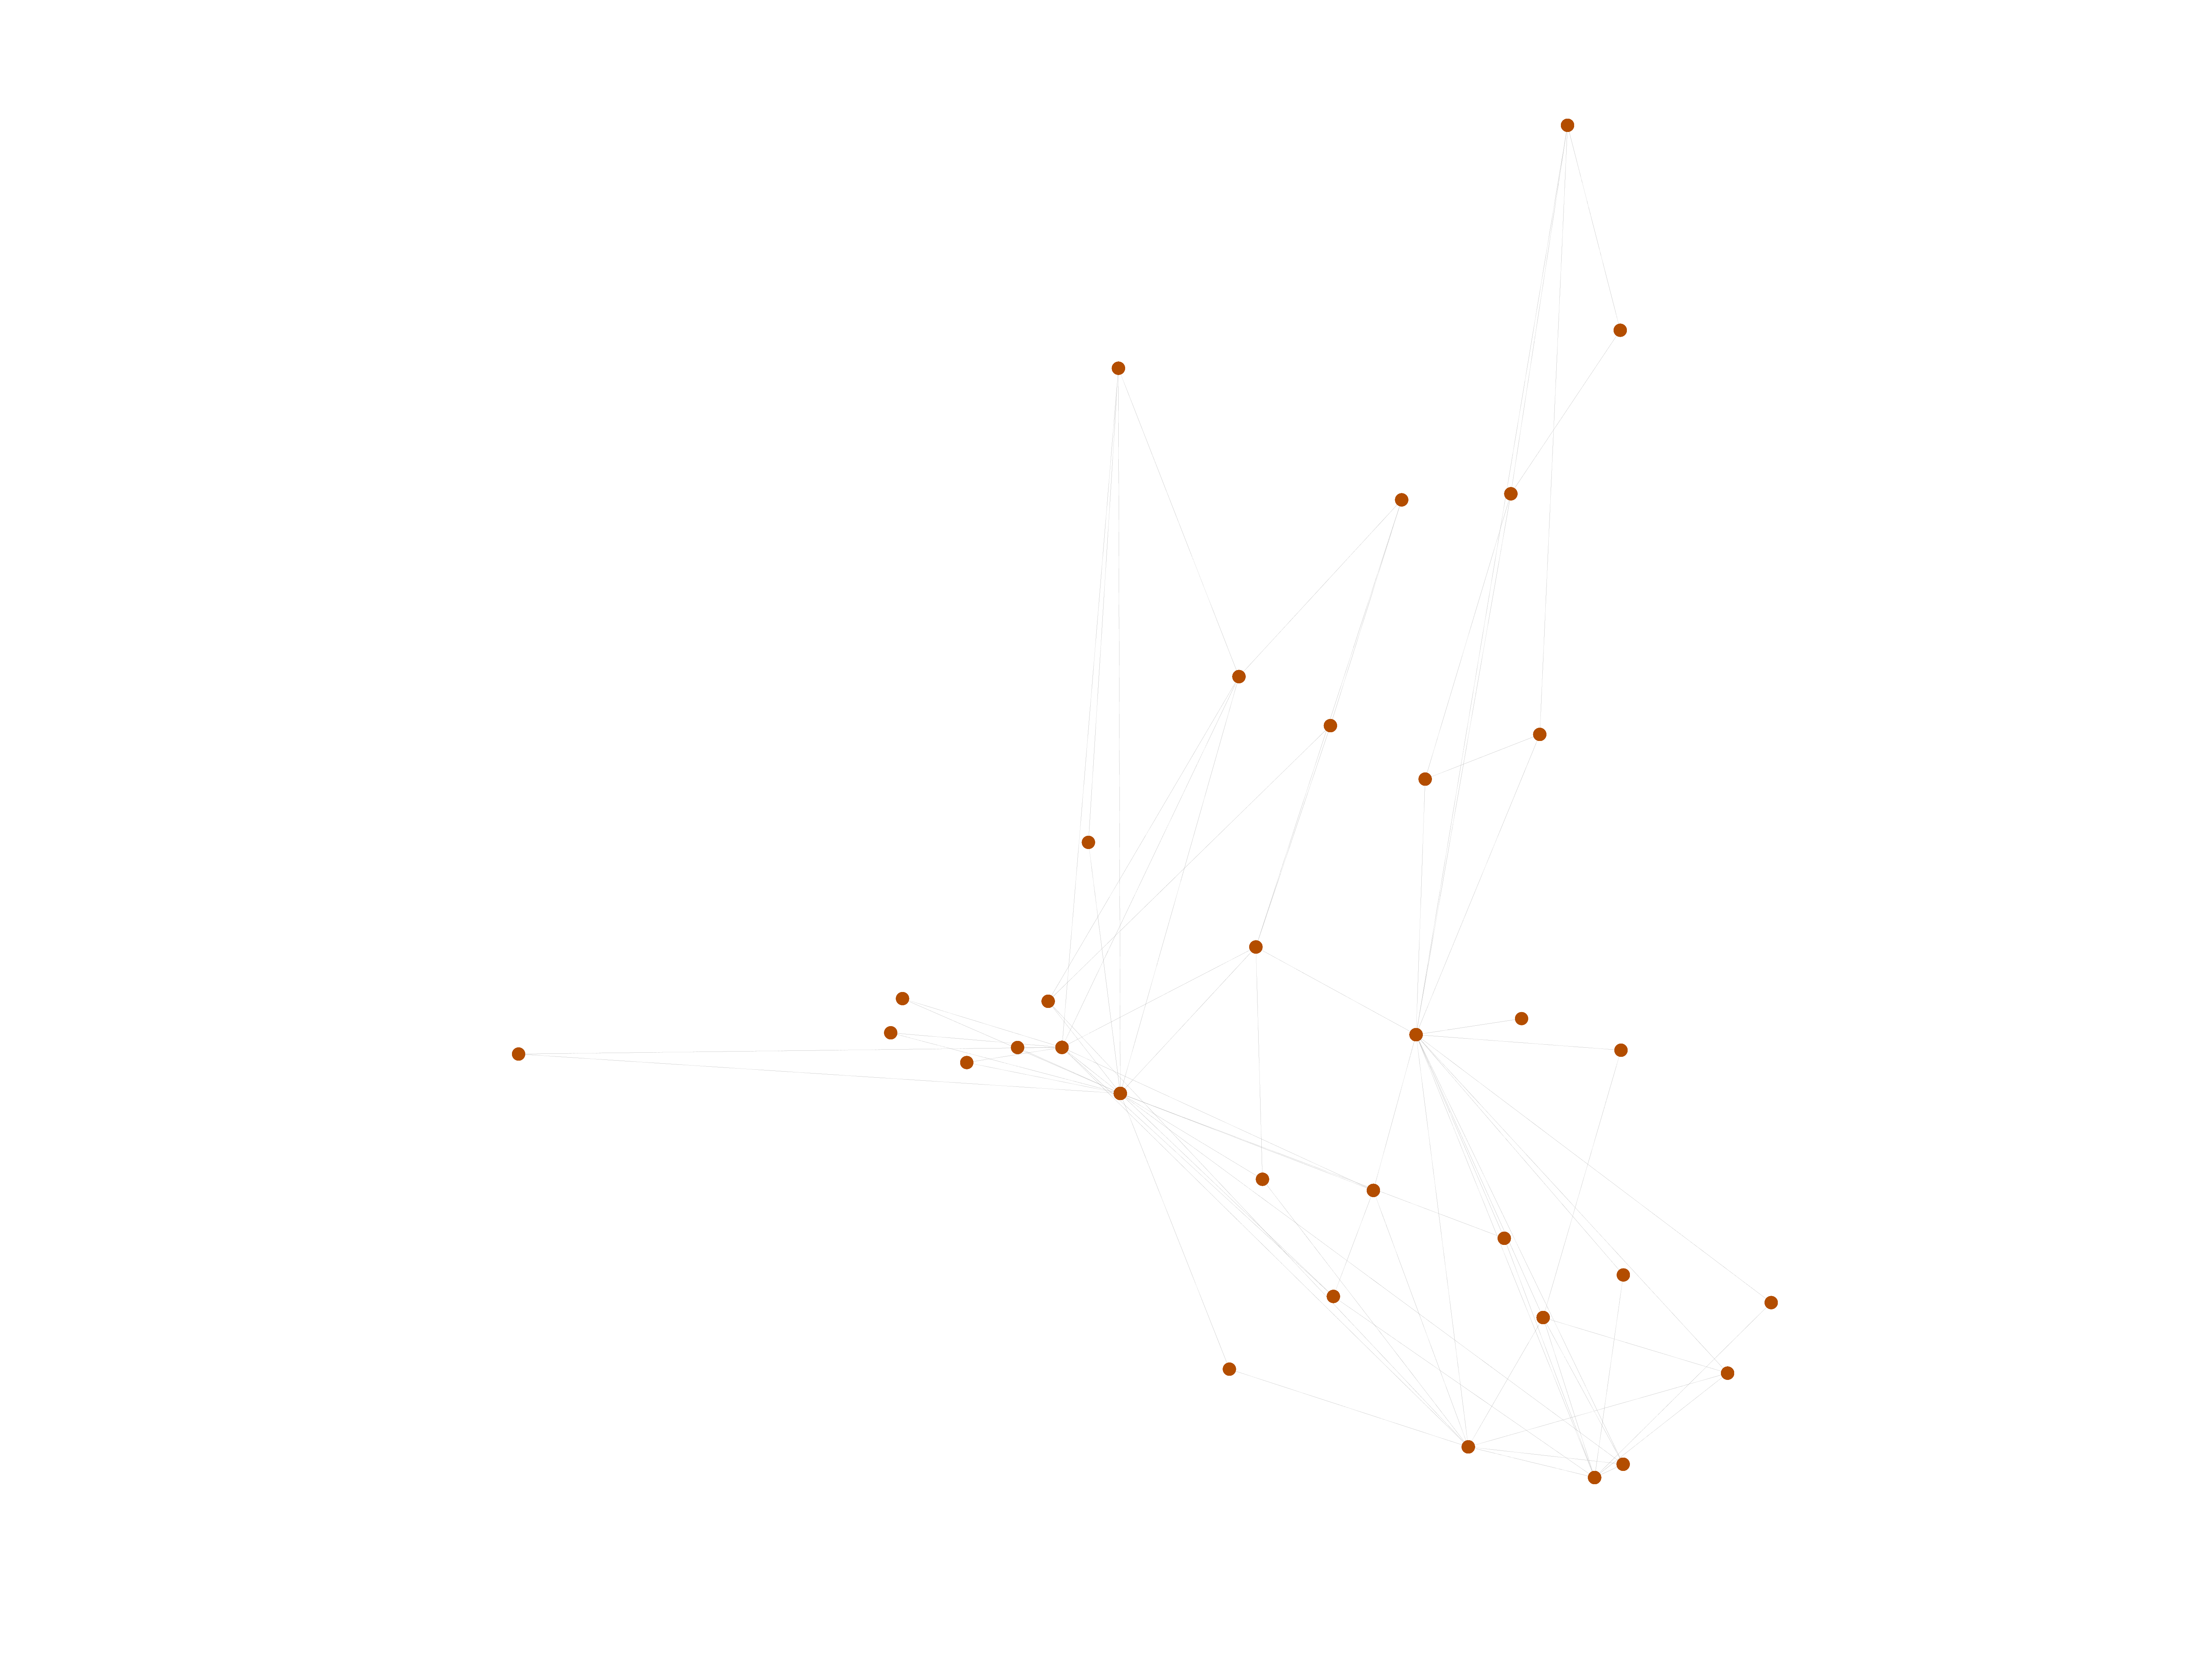
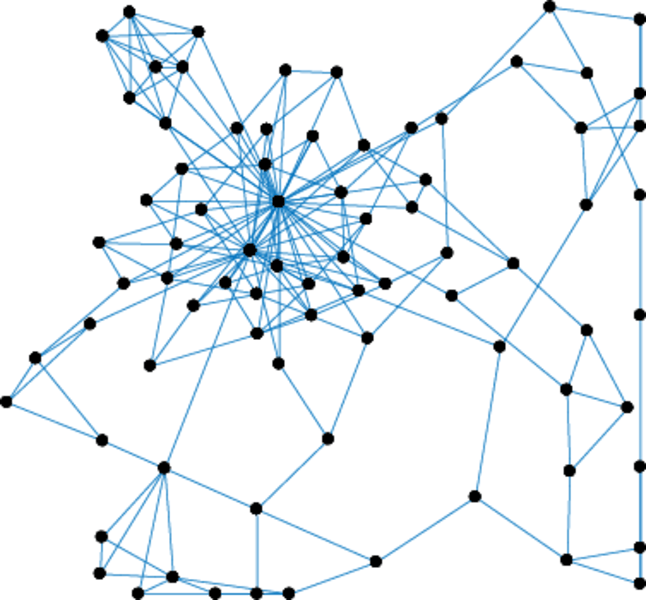
This is the well-known and much-used Zachary karate club network. The data was collected from the members of a university karate club by Wayne Zachary in 1977. Each node represents a member of the club, and each edge represents a tie between two members of the club. The network is undirected. An often discussed problem using this dataset is to find the two groups of people into which the karate club split after an argument between two teachers.

Metadata

CodeZA
Internal nameucidata-zachary
NameZachary karate club
Data sourcehttp://vlado.fmf.uni-lj.si/pub/networks/data/ucinet/ucidata.htm#zachary
AvailabilityDataset is available for download
Consistency checkDataset passed all tests
Category
Human social network
Dataset timestamp 1977
Node meaningMember
Edge meaningTie
Network formatUnipartite, undirected
Edge typeUnweighted, no multiple edges
LoopsDoes not contain loops

Statistics

Size n =34
Volume m =78
Loop count l =0
Wedge count s =528
Claw count z =1,764
Cross count x =5,082
Triangle count t =45
Square count q =154
4-Tour count T4 =3,500
Maximum degree dmax =17
Average degree d =4.588 24
Fill p =0.139 037
Size of LCC N =34
Diameter δ =5
50-Percentile effective diameter δ0.5 =1.840 54
90-Percentile effective diameter δ0.9 =3.441 98
Median distance δM =2
Mean distance δm =2.443 26
Gini coefficient G =0.385 370
Balanced inequality ratio P =0.339 744
Relative edge distribution entropy Her =0.924 709
Power law exponent γ =1.780 96
Tail power law exponent γt =2.161 00
Tail power law exponent with p γ3 =2.161 00
p-value p =0.151 000
Degree assortativity ρ =−0.475 613
Degree assortativity p-value pρ =3.509 45 × 10−10
Clustering coefficient c =0.255 682
Spectral norm α =6.725 70
Algebraic connectivity a =0.468 525
Spectral separation 1[A] / λ2[A]| =1.351 34
Non-bipartivity bA =0.332 823
Normalized non-bipartivity bN =0.285 389
Algebraic non-bipartivity χ =0.878 988
Spectral bipartite frustration bK =0.047 893 6
Controllability C =8
Relative controllability Cr =0.235 294

Plots

Fruchterman–Reingold graph drawing

Degree distribution

Cumulative degree distribution

Lorenz curve

Spectral distribution of the adjacency matrix

Spectral distribution of the normalized adjacency matrix

Spectral distribution of the Laplacian

Spectral graph drawing based on the adjacency matrix

Spectral graph drawing based on the Laplacian

Spectral graph drawing based on the normalized adjacency matrix

Degree assortativity

Zipf plot

Hop distribution

Double Laplacian graph drawing

Delaunay graph drawing

Clustering coefficient distribution

Average neighbor degree distribution

SynGraphy

Matrix decompositions plots

Downloads

References

[1] Jérôme Kunegis. KONECT – The Koblenz Network Collection. In Proc. Int. Conf. on World Wide Web Companion, pages 1343–1350, 2013. [ http ]
[2] Wayne Zachary. An information flow model for conflict and fission in small groups. J. of Anthropol. Res., 33:452–473, 1977.