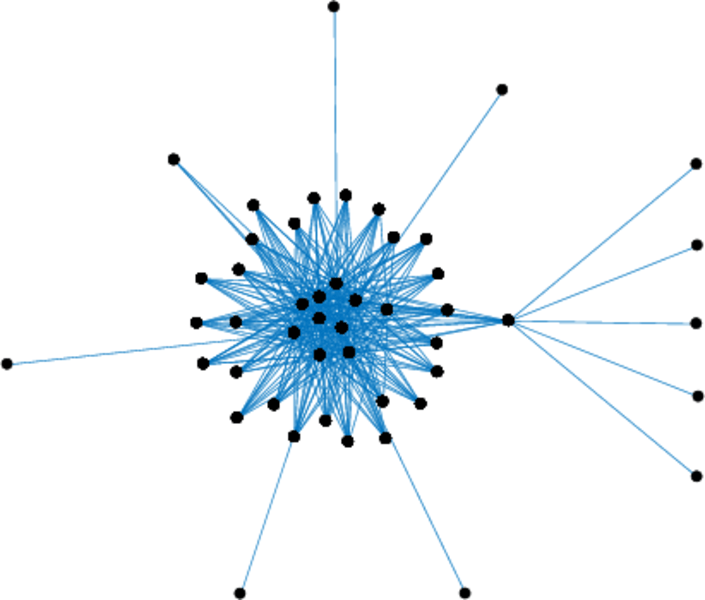
Stanford
This is the directed network of hyperlinks between the web pages from the
website of the Stanford University.
Metadata
Statistics
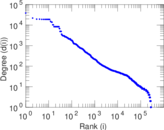
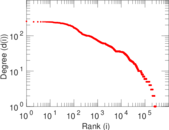
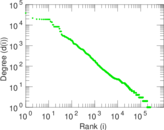
| Size | n = | 281,903
|
| Volume | m = | 2,312,497
|
| Wedge count | s = | 3,944,069,093
|
| Claw count | z = | 25,253,733,860,230
|
| Triangle count | t = | 11,329,473
|
| Square count | q = | 13,316,840,570
|
| 4-Tour count | T4 = | 122,314,986,204
|
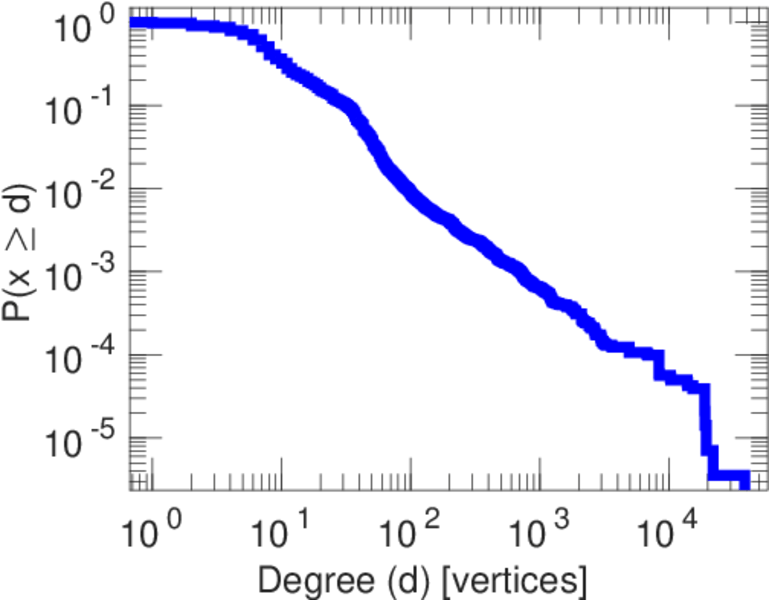
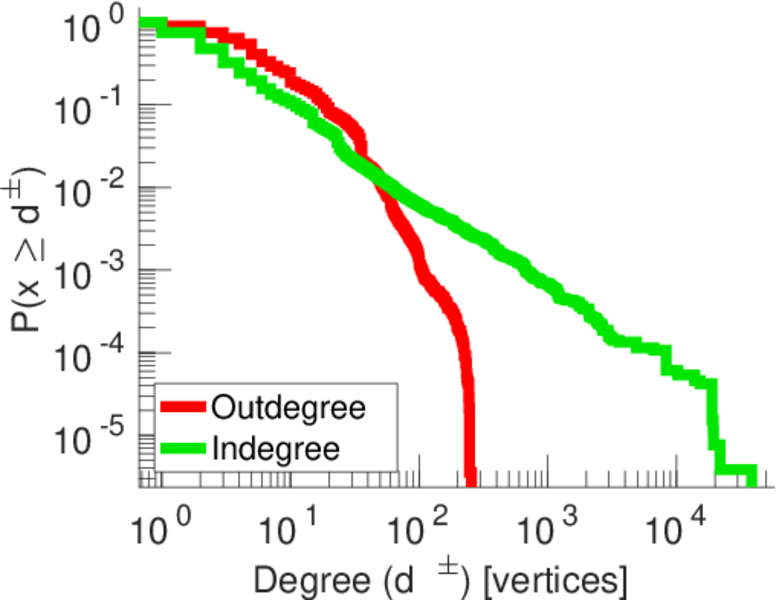
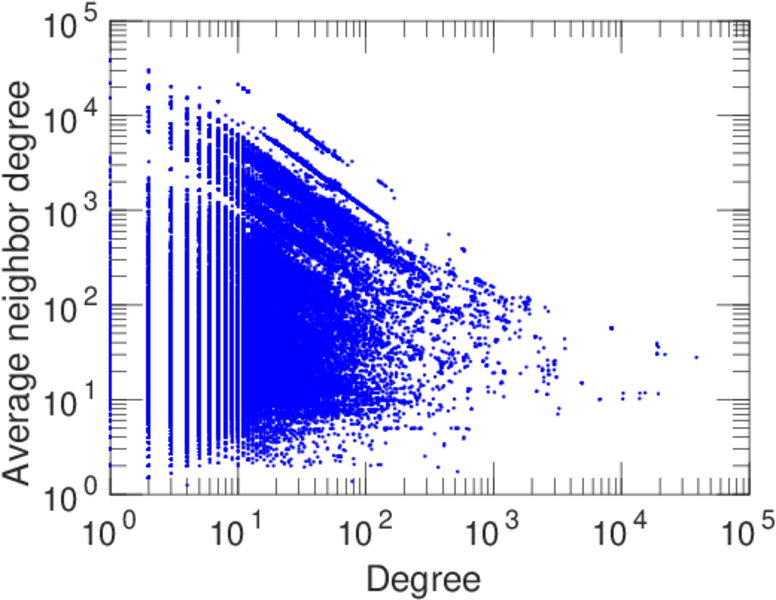
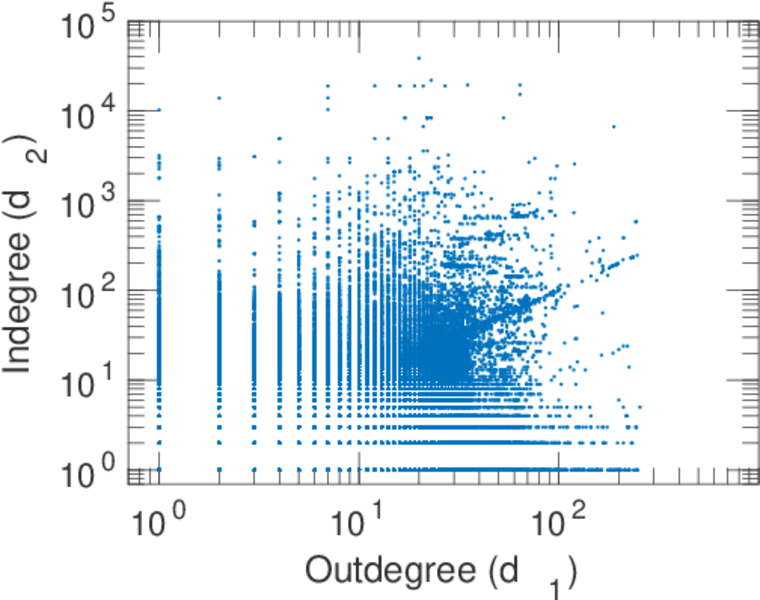
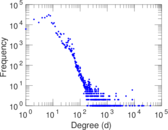
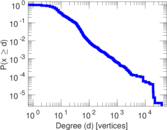
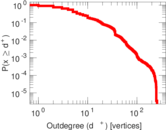
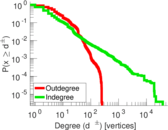
| Maximum degree | dmax = | 38,626
|
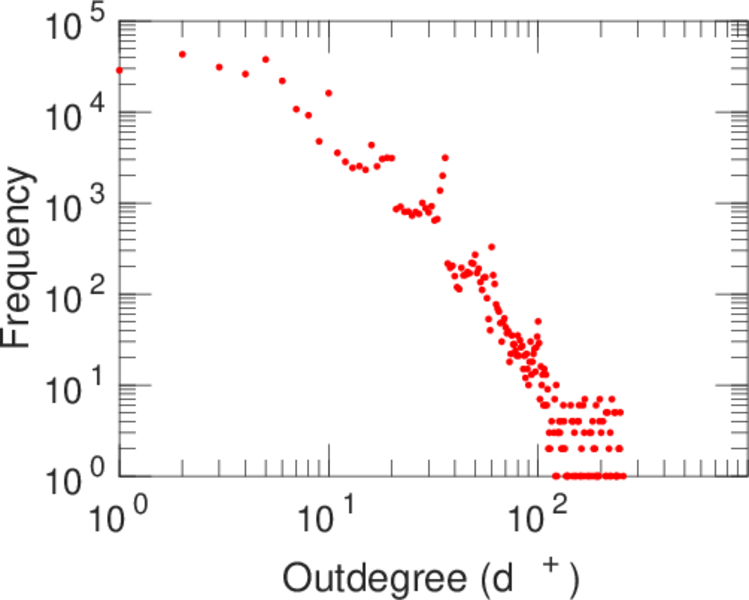
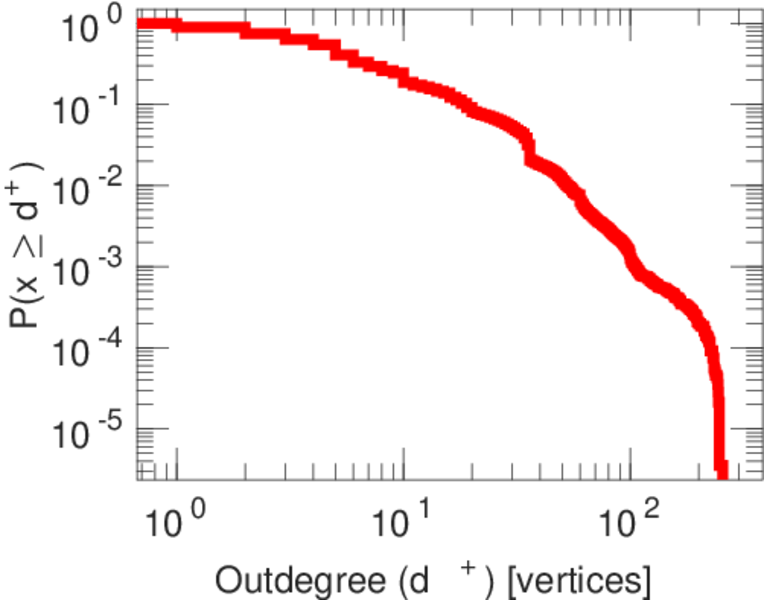
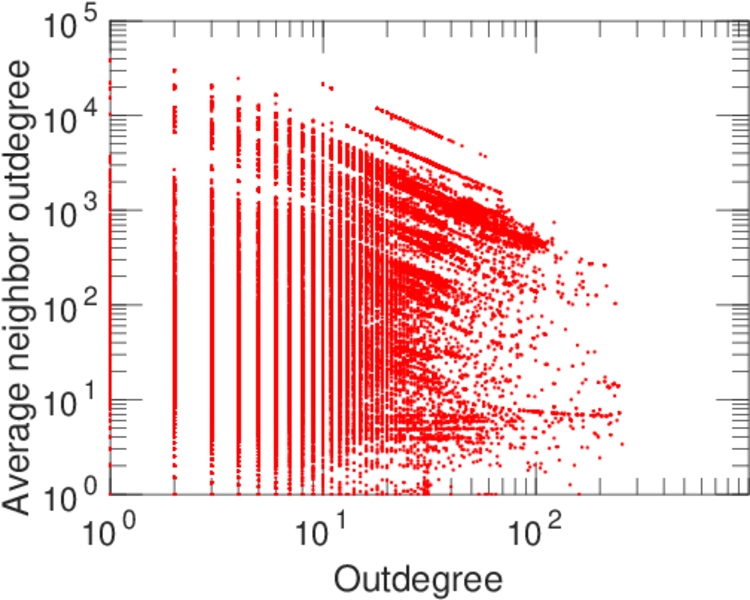
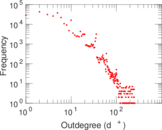
| Maximum outdegree | d+max = | 255
|
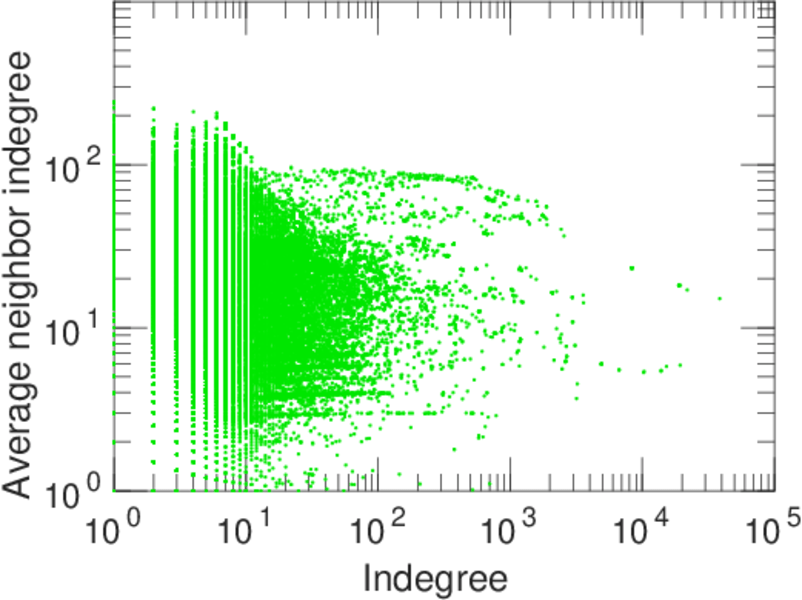
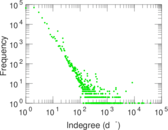
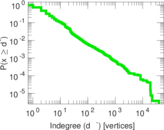
| Maximum indegree | d−max = | 38,606
|
| Average degree | d = | 16.406 3
|
| Fill | p = | 2.909 94 × 10−5
|
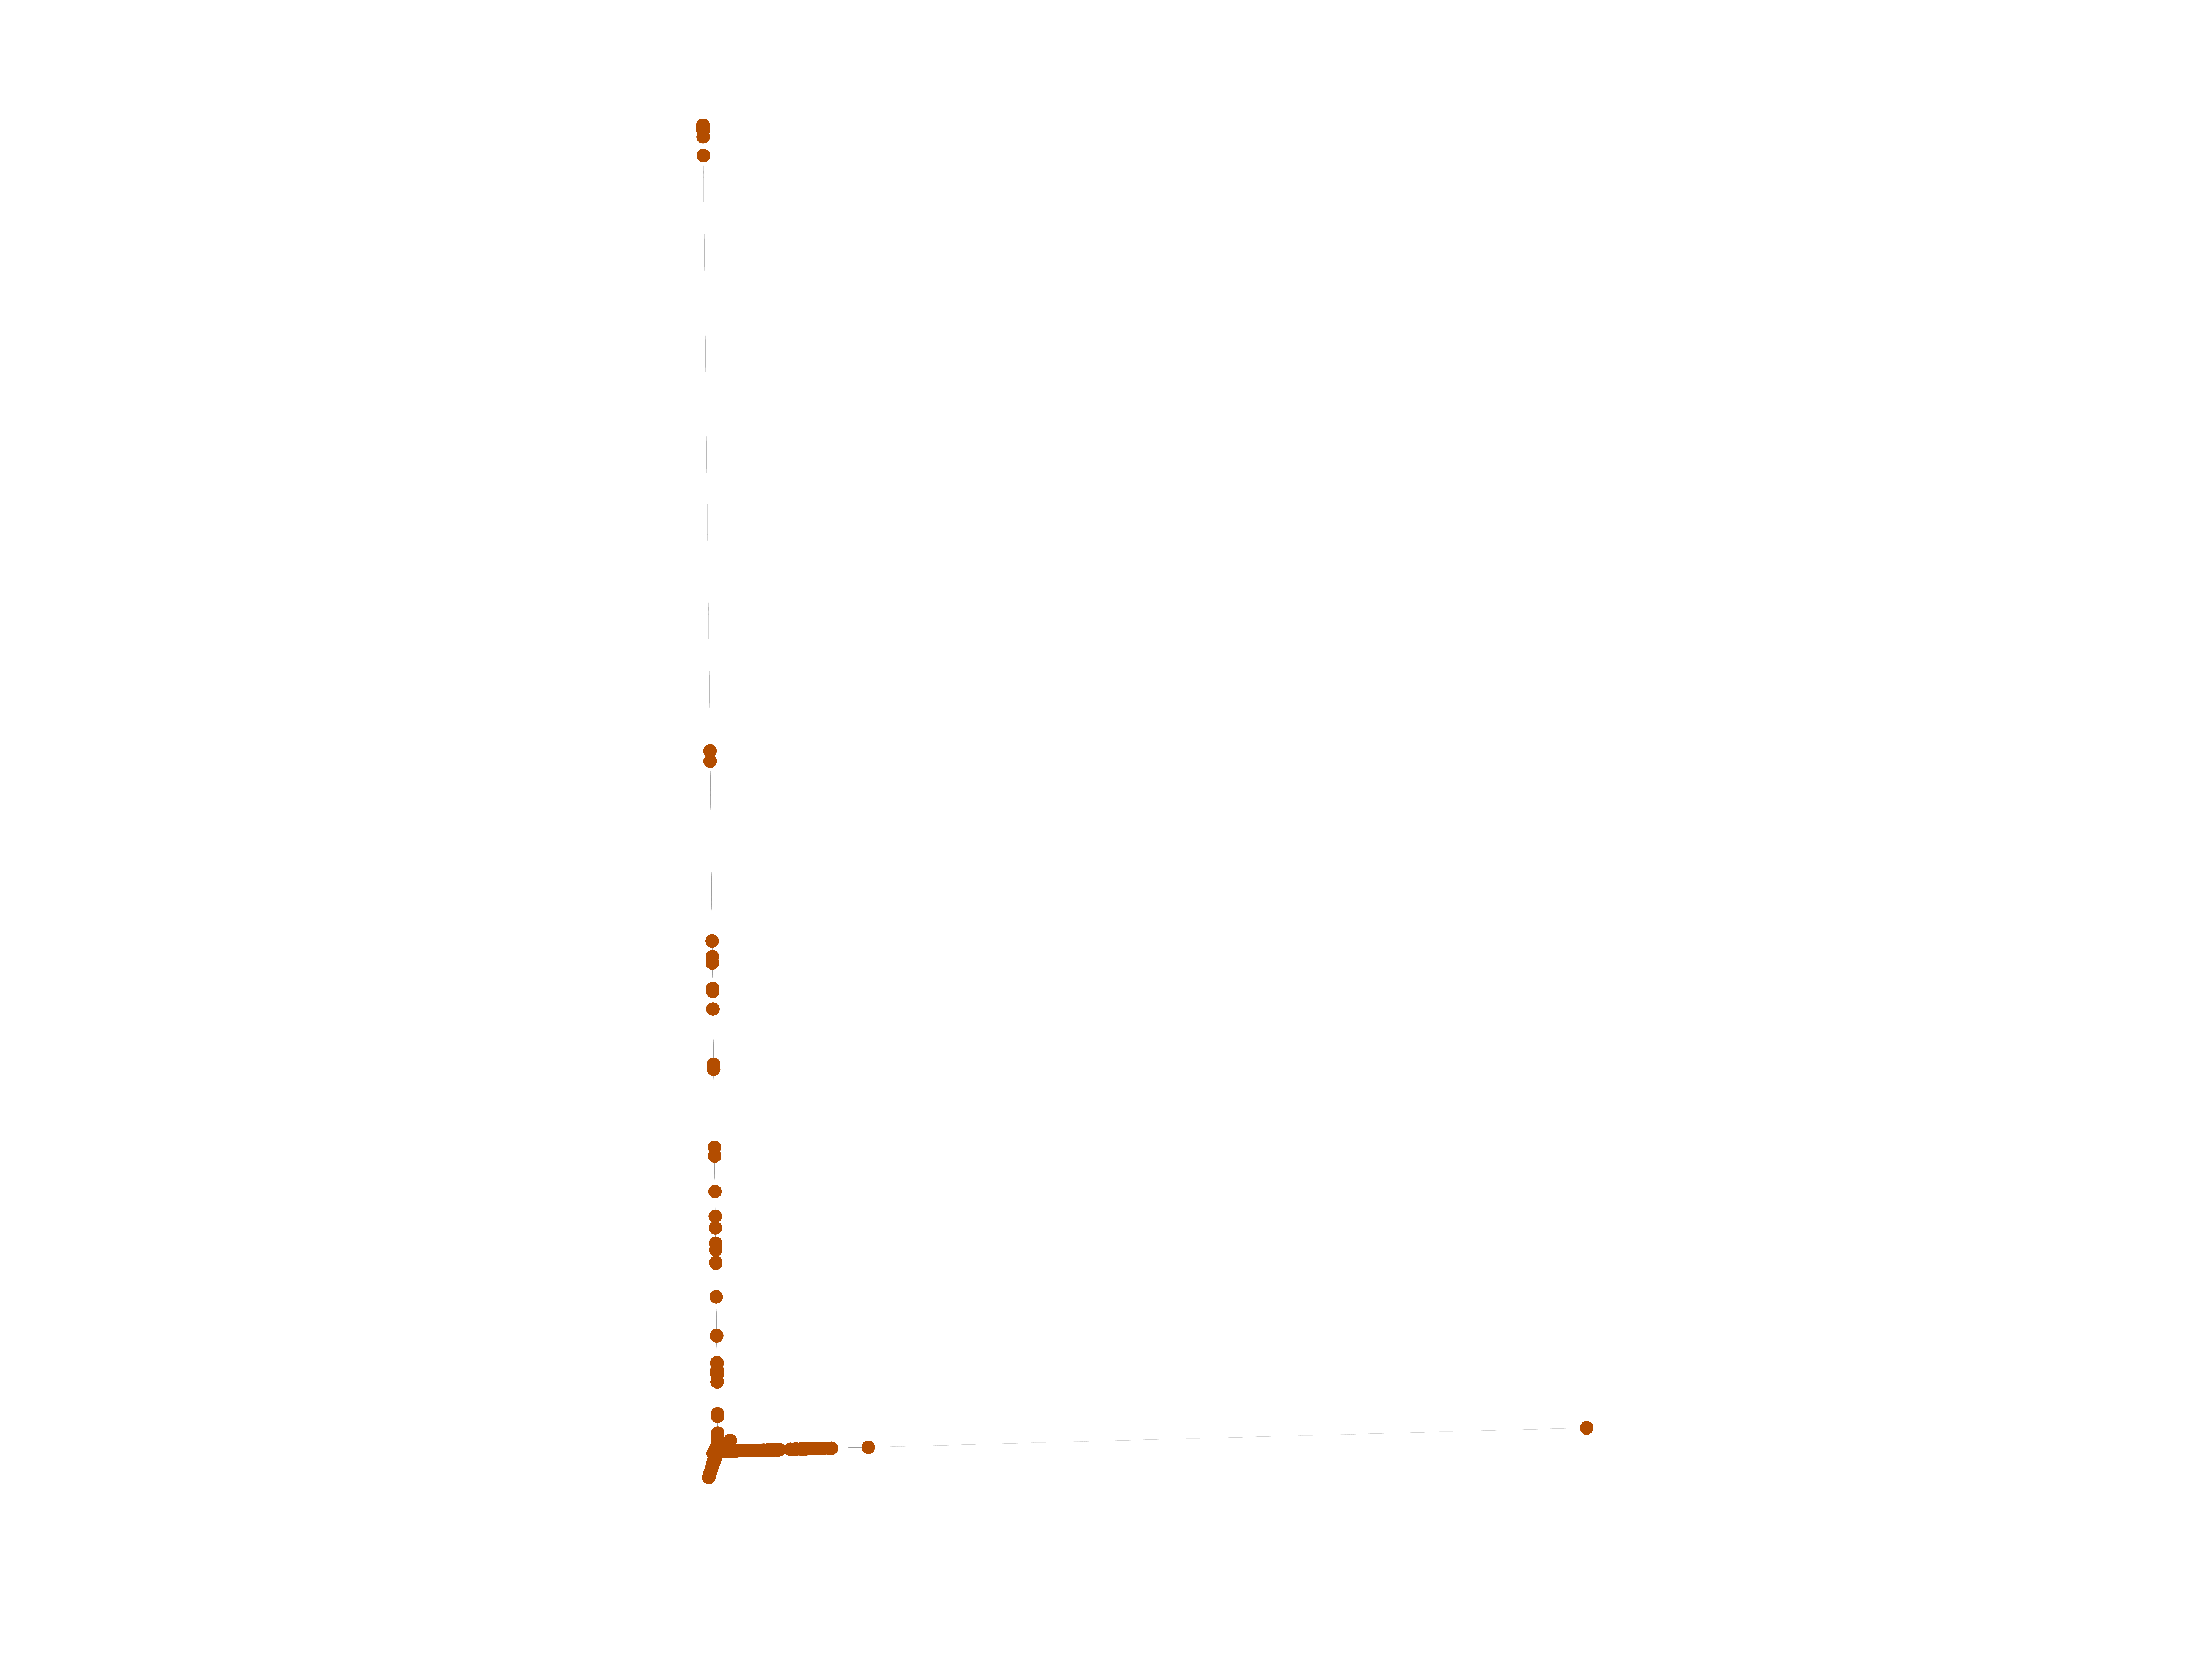
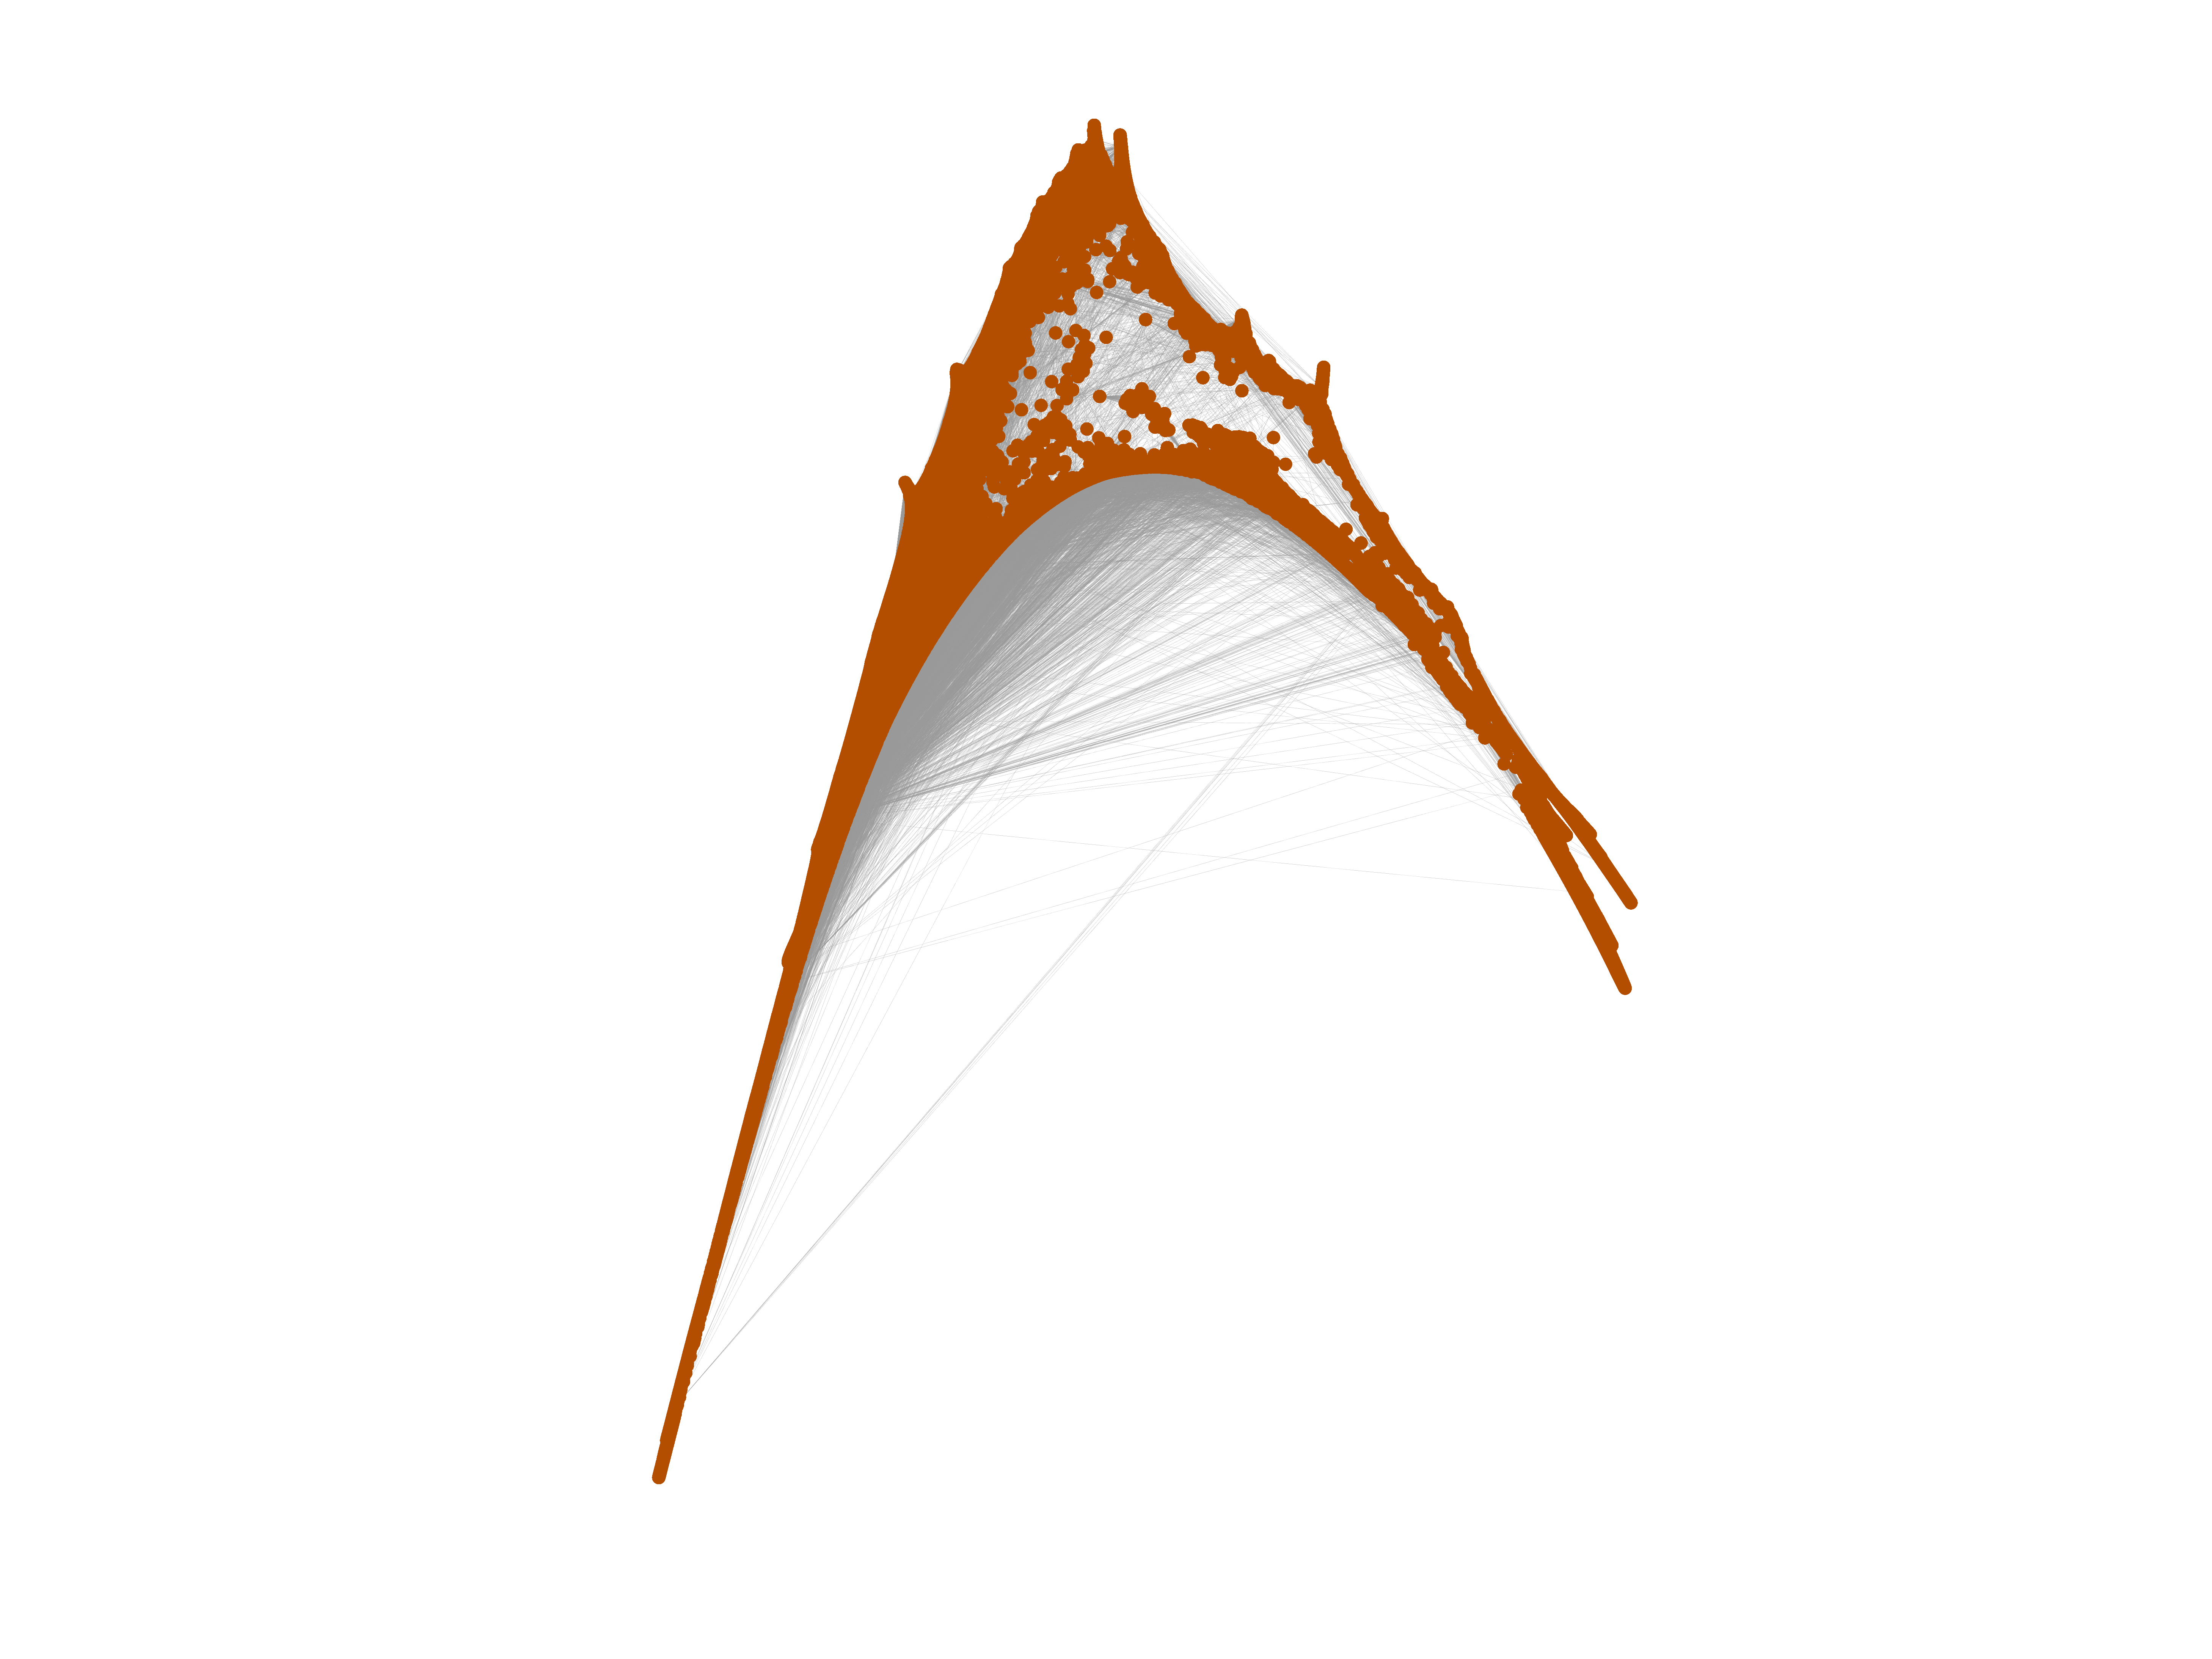
| Size of LCC | N = | 255,265
|
| Size of LSCC | Ns = | 150,532
|
| Relative size of LSCC | Nrs = | 0.533 985
|
| Diameter | δ = | 164
|
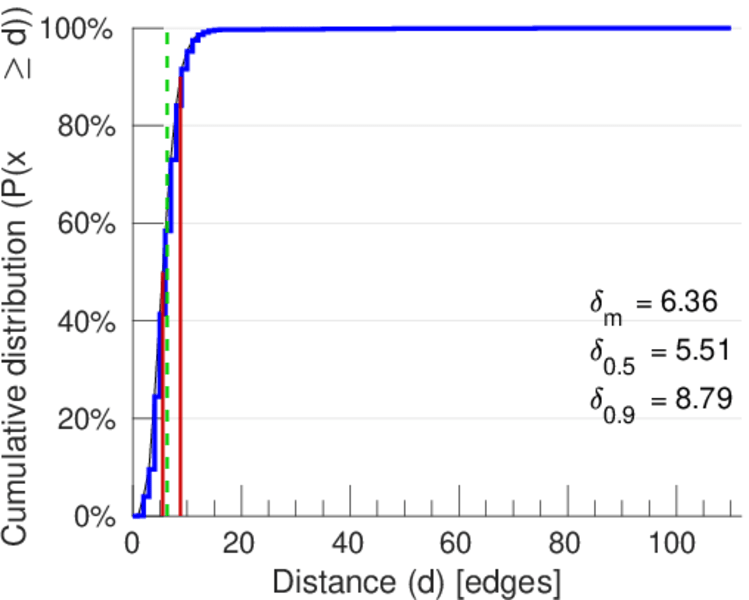
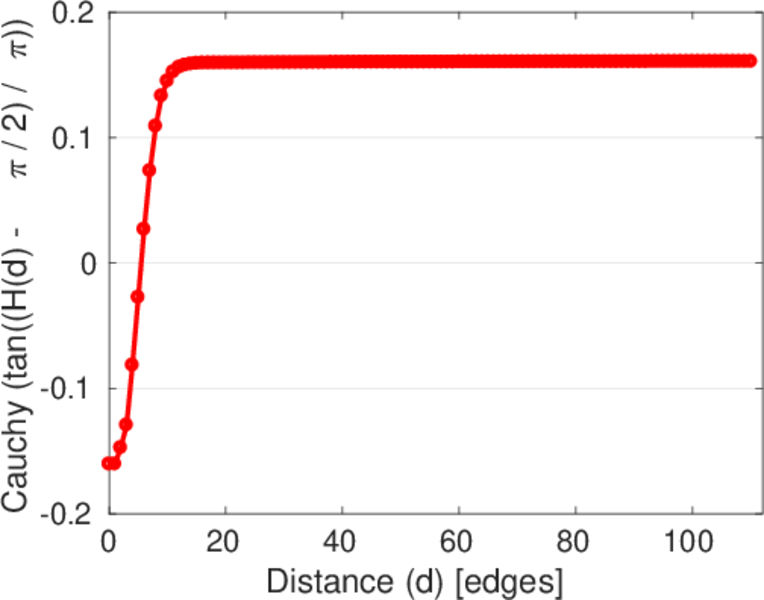
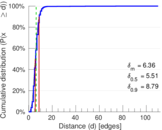
| 50-Percentile effective diameter | δ0.5 = | 5.507 63
|
| 90-Percentile effective diameter | δ0.9 = | 8.788 03
|
| Median distance | δM = | 6
|
| Mean distance | δm = | 6.362 93
|
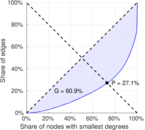
| Gini coefficient | G = | 0.609 279
|
| Balanced inequality ratio | P = | 0.270 840
|
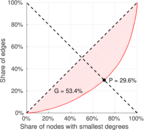
| Outdegree balanced inequality ratio | P+ = | 0.296 020
|
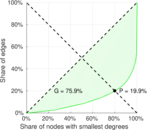
| Indegree balanced inequality ratio | P− = | 0.199 346
|
| Relative edge distribution entropy | Her = | 0.894 113
|
| Power law exponent | γ = | 1.537 77
|
| Degree assortativity | ρ = | −0.112 445
|
| Degree assortativity p-value | pρ = | 0.000 00
|
| In/outdegree correlation | ρ± = | +0.329 225
|
| Clustering coefficient | c = | 0.008 617 60
|
| Directed clustering coefficient | c± = | 0.430 381
|
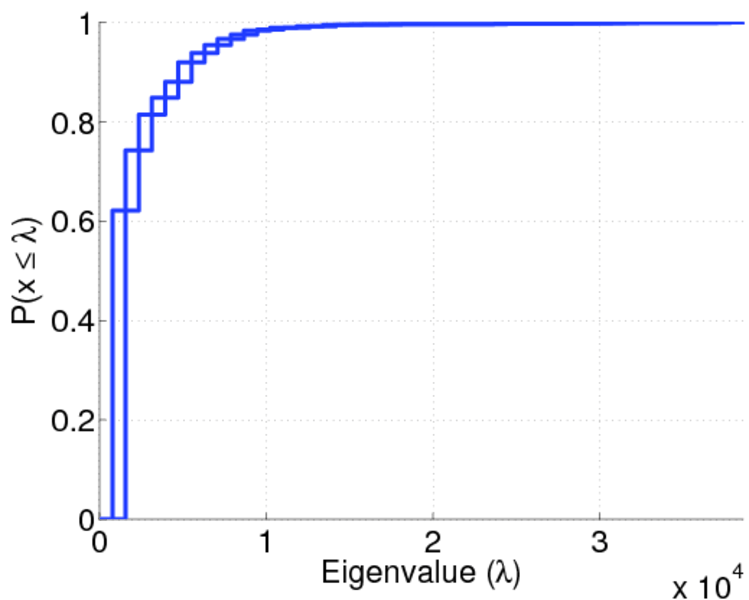
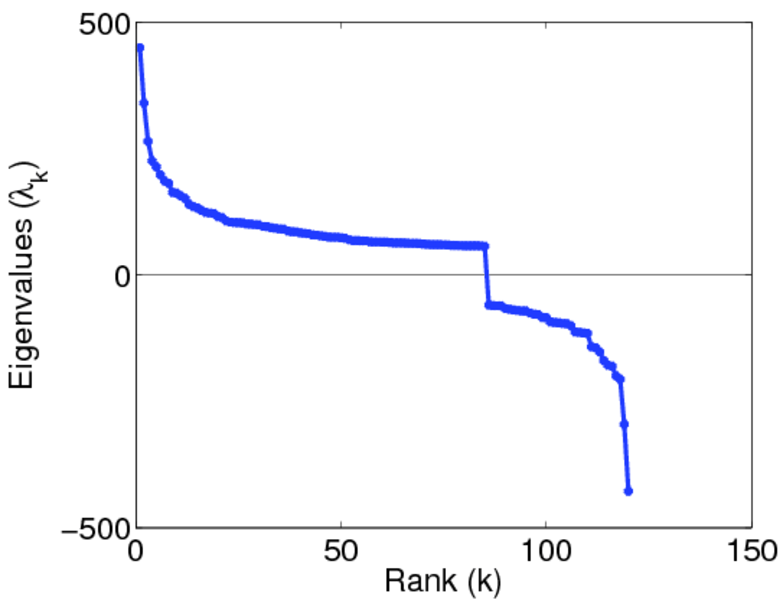
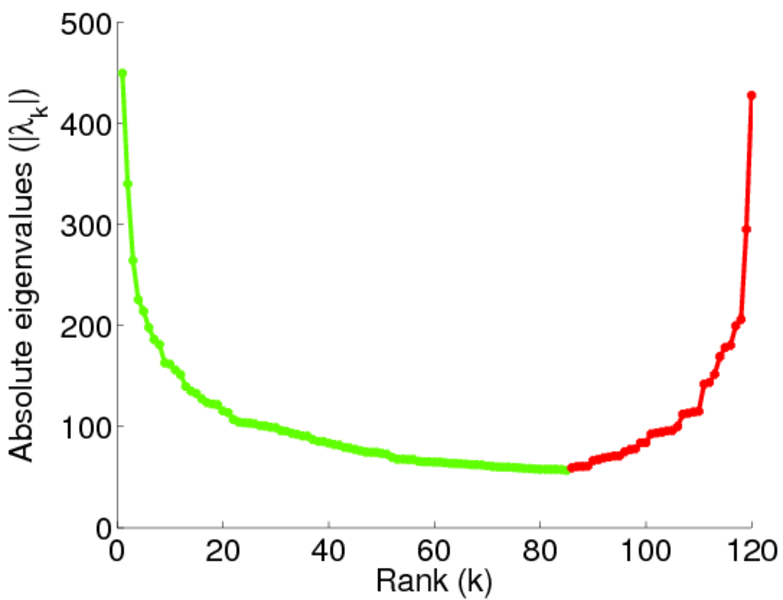
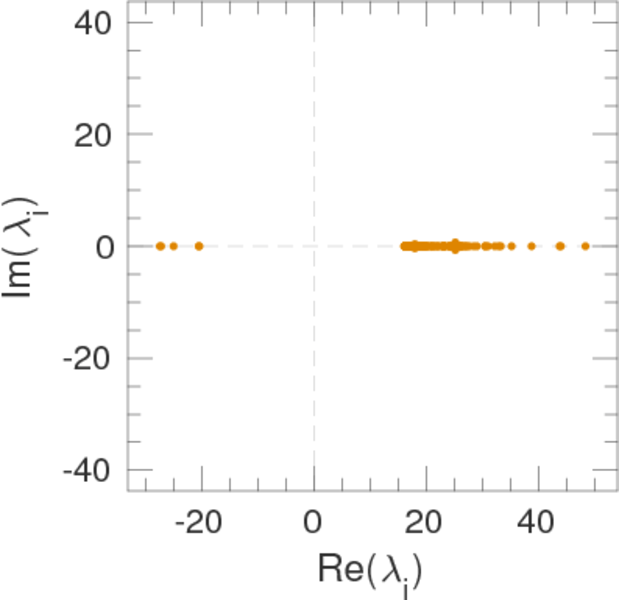
| Spectral norm | α = | 449.572
|
| Operator 2-norm | ν = | 438.345
|
| Algebraic connectivity | a = | 0.000 171 694
|
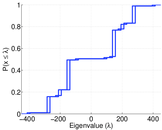
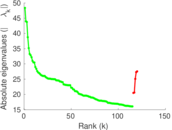
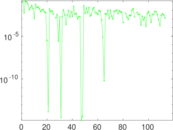
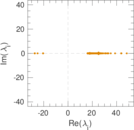
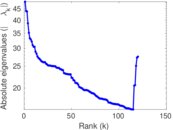
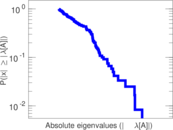
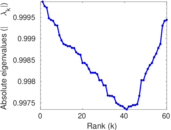
| Spectral separation | |λ1[A] / λ2[A]| = | 1.051 30
|
| Reciprocity | y = | 0.276 637
|
| Non-bipartivity | bA = | 0.048 796 6
|
| Normalized non-bipartivity | bN = | 0.000 583 688
|
| Spectral bipartite frustration | bK = | 2.329 34 × 10−5
|
| Controllability | C = | 97,500
|
| Relative controllability | Cr = | 0.345 864
|
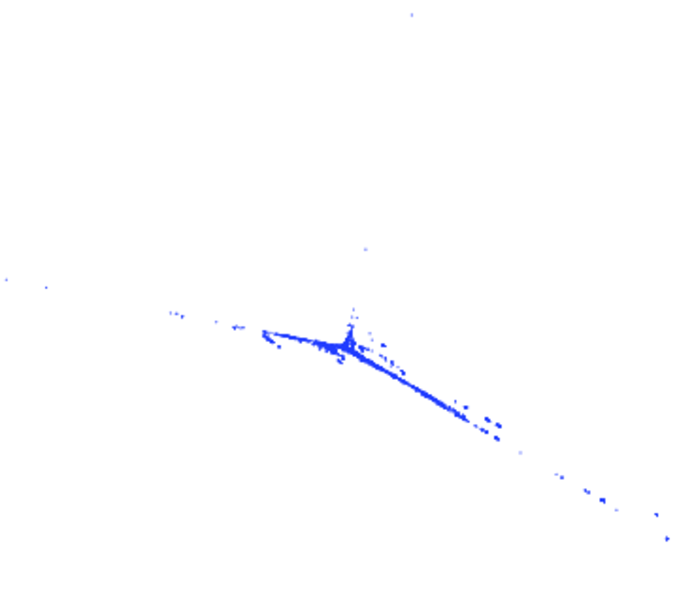
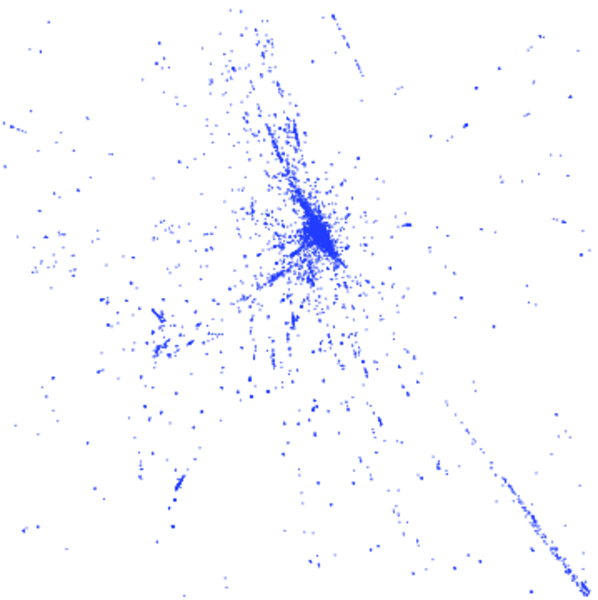
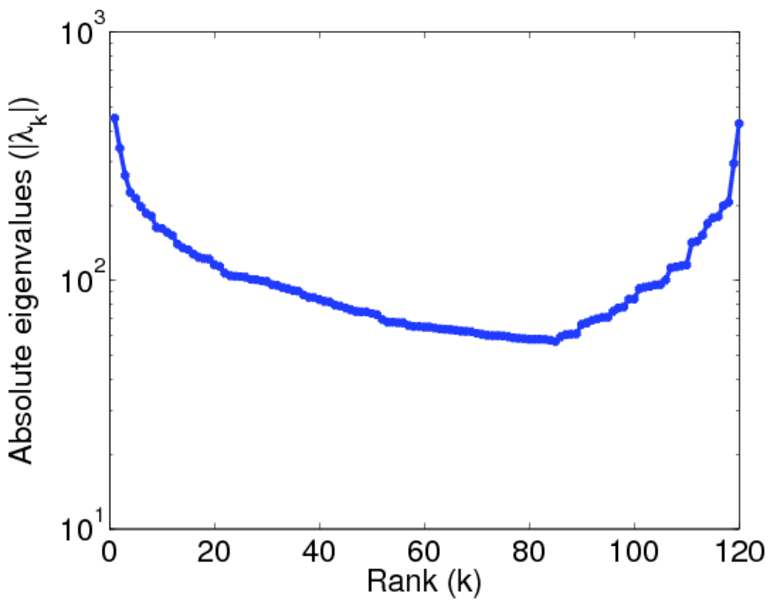
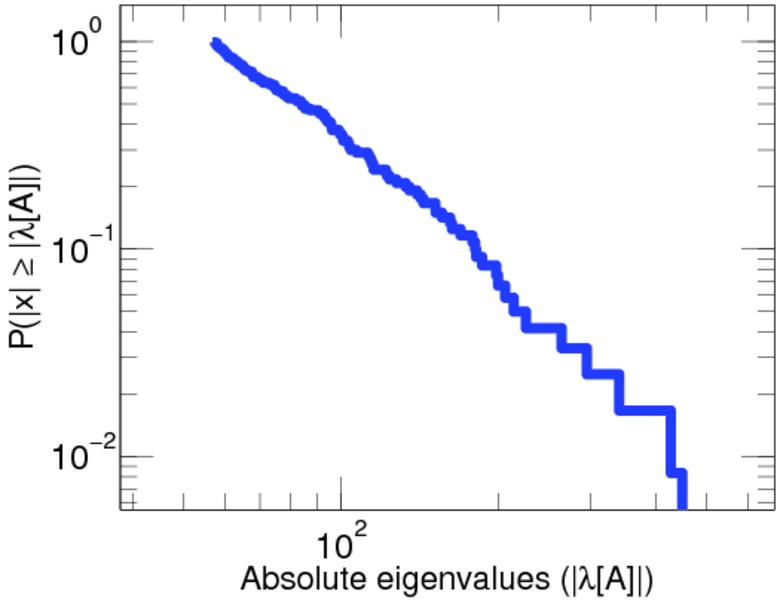
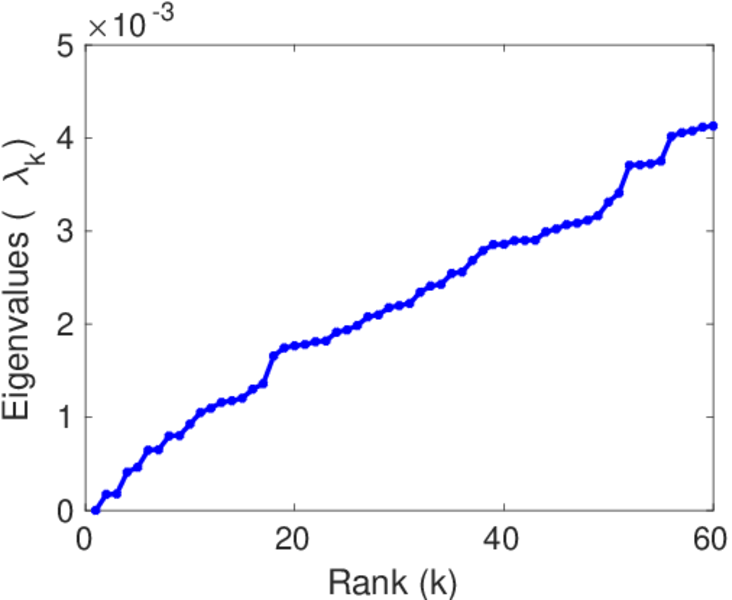
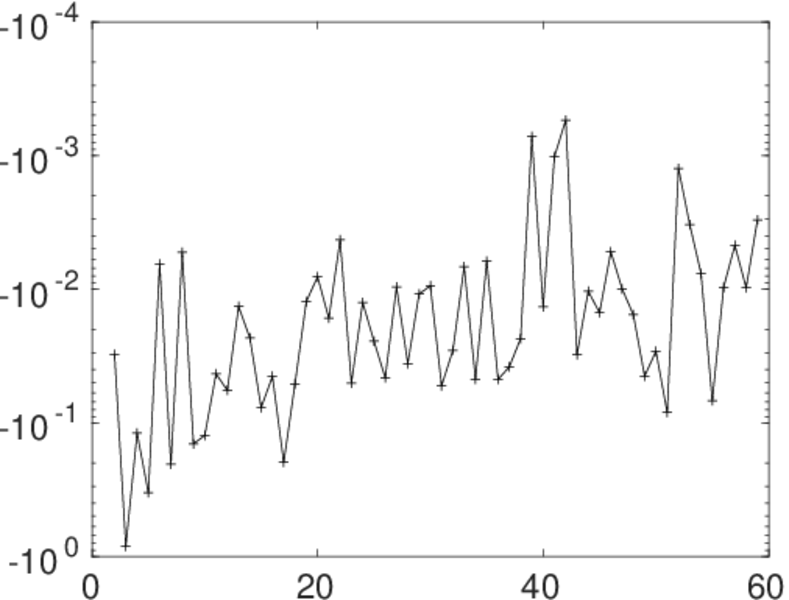
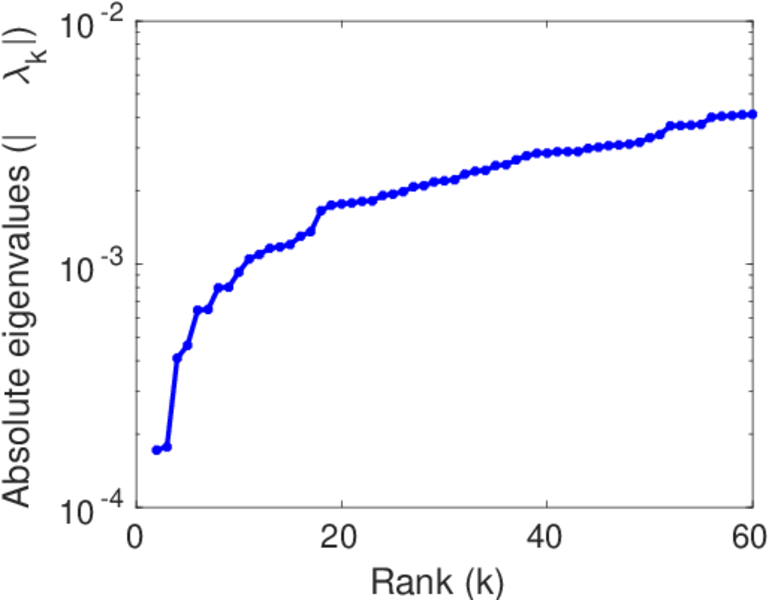
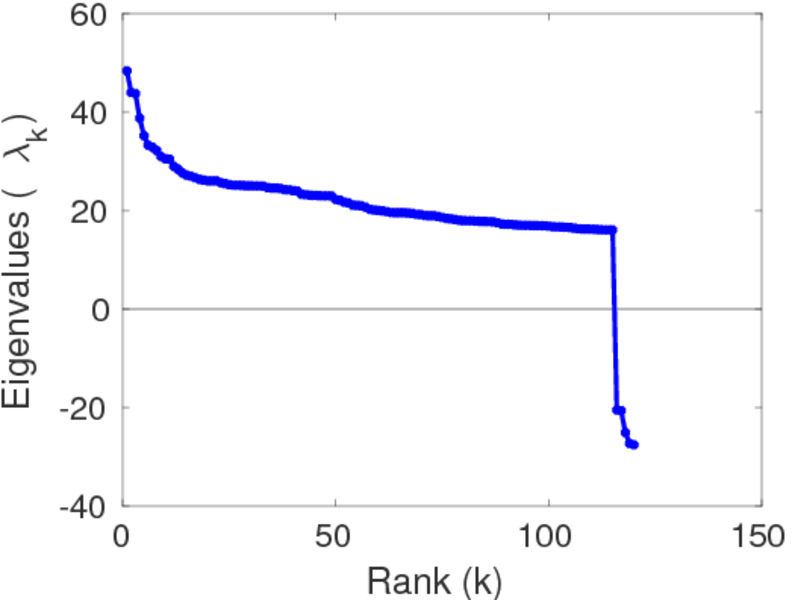
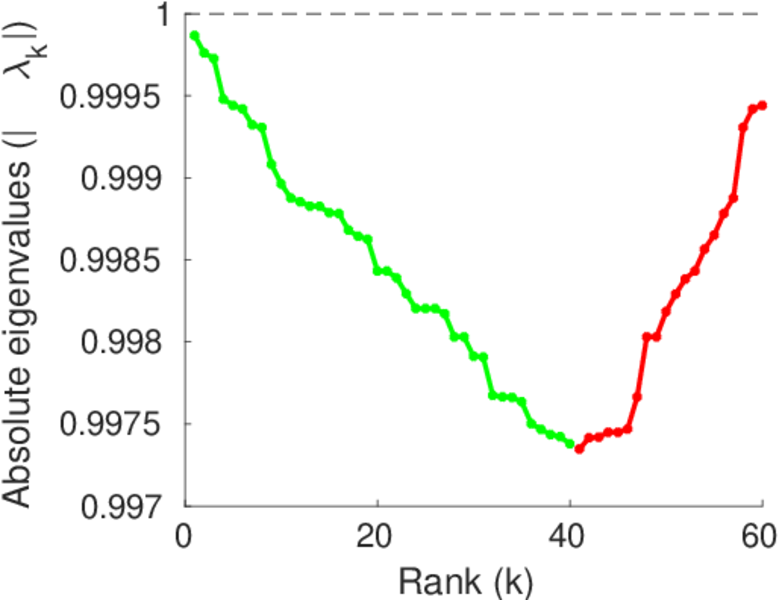
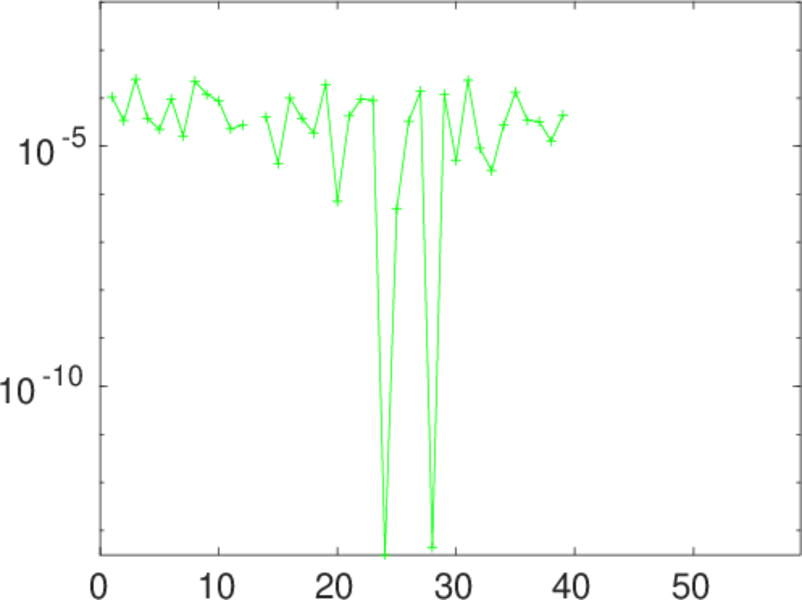
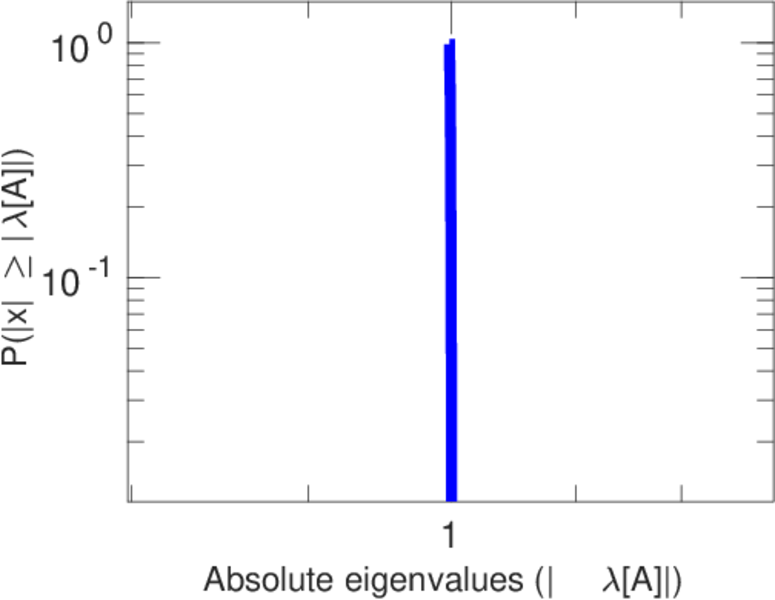
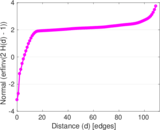
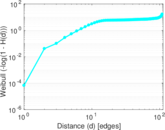
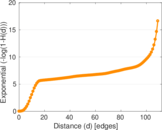
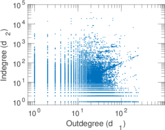
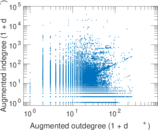
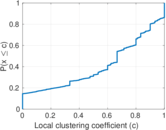
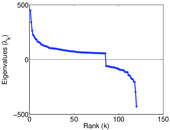
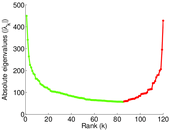
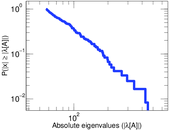
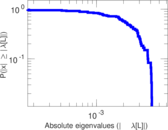
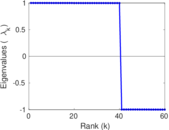
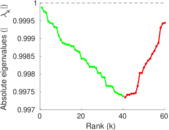
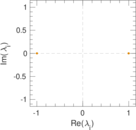
Plots


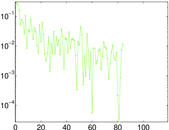
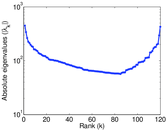
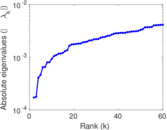
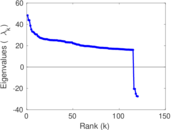
Matrix decompositions plots


Downloads
References
|
[1]
|
Jérôme Kunegis.
KONECT – The Koblenz Network Collection.
In Proc. Int. Conf. on World Wide Web Companion, pages
1343–1350, 2013.
[ http ]
|
|
[2]
|
Jure Leskovec, Kevin Lang, Anirban Dasgupta, and Michael W. Mahoney.
Community structure in large networks: Natural cluster sizes and the
absence of large well-defined clusters.
Internet Math., 6(1):29–123, 2009.
|
 KONECT ‣ Networks ‣
Buy Me a Coffee
KONECT ‣ Networks ‣
Buy Me a Coffee