Wikipedia links (ast)
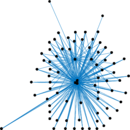
This network consists of the wikilinks of the Wikipedia in the Asturian
language (ast). Nodes are Wikipedia articles, and directed edges are
wikilinks, i.e., hyperlinks within one wiki. In the wiki source, these are
indicated with [[double brackets]]. Only pages in the article namespace are
included.
Metadata
Statistics
| Size | n = | 83,330
|
| Volume | m = | 2,095,962
|
| Loop count | l = | 143
|
| Wedge count | s = | 2,490,562,848
|
| Claw count | z = | 8,506,918,072,145
|
| Cross count | x = | 32,402,473,981,888,548
|
| Triangle count | t = | 7,652,250
|
| Square count | q = | 10,267,416,149
|
| 4-Tour count | T4 = | 74,692,486,368
|
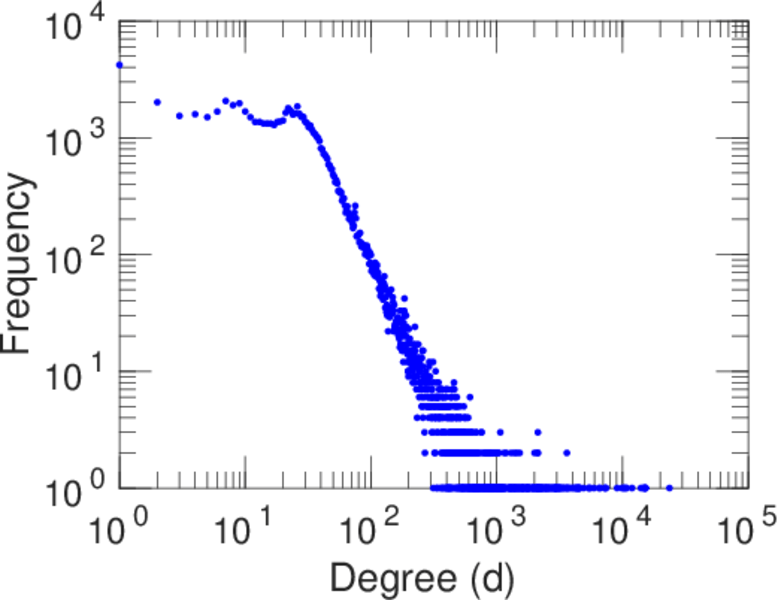
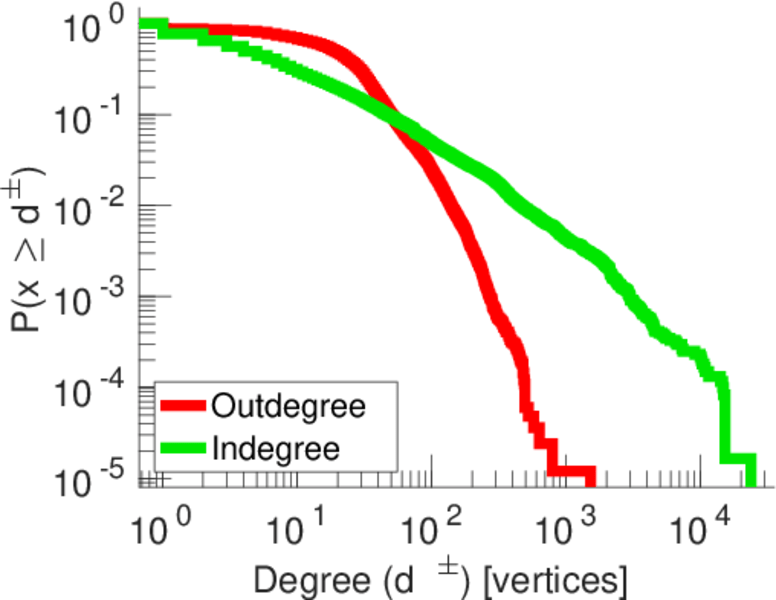
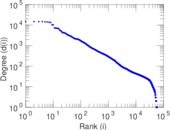
| Maximum degree | dmax = | 23,691
|
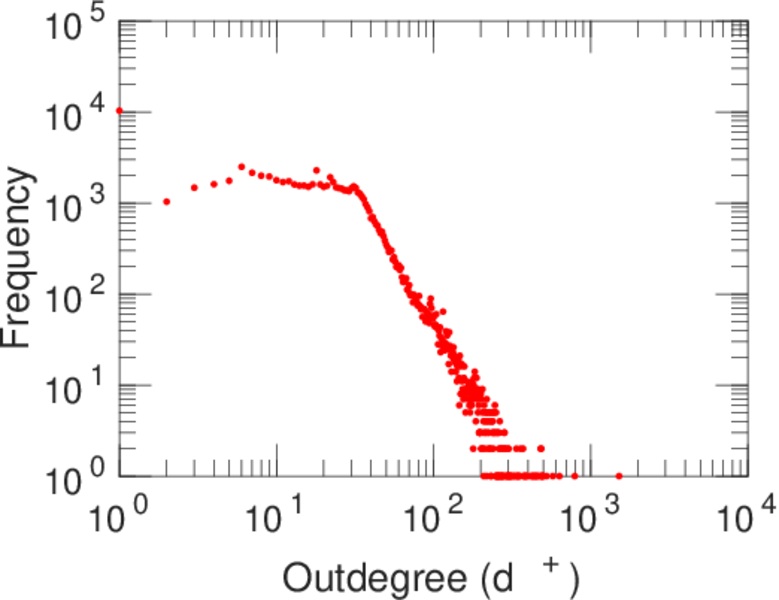
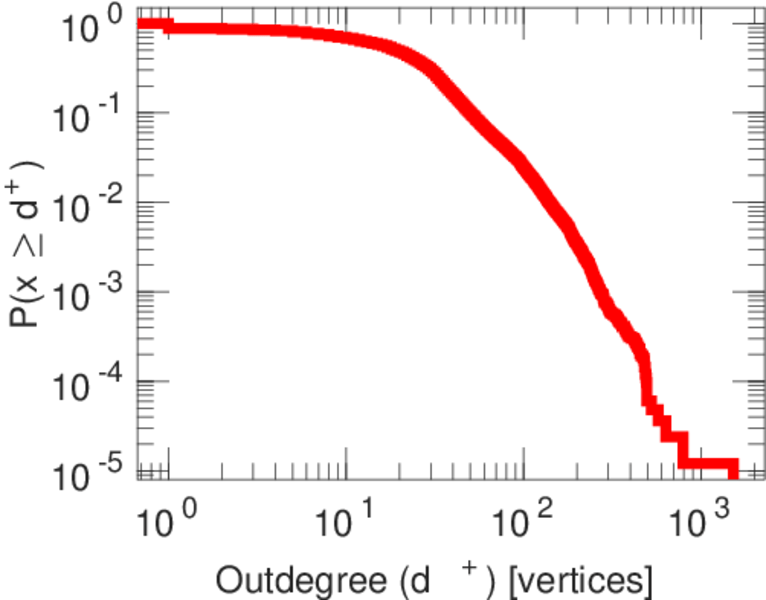
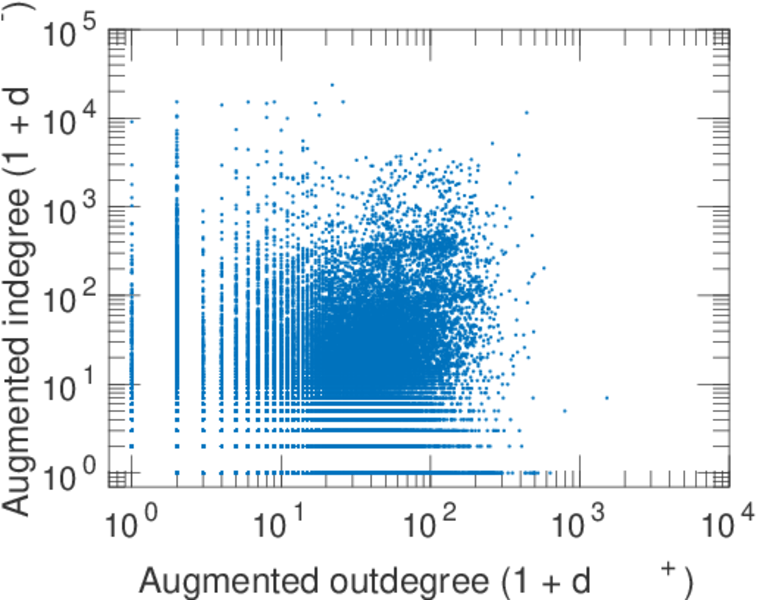
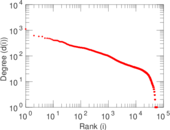
| Maximum outdegree | d+max = | 1,519
|
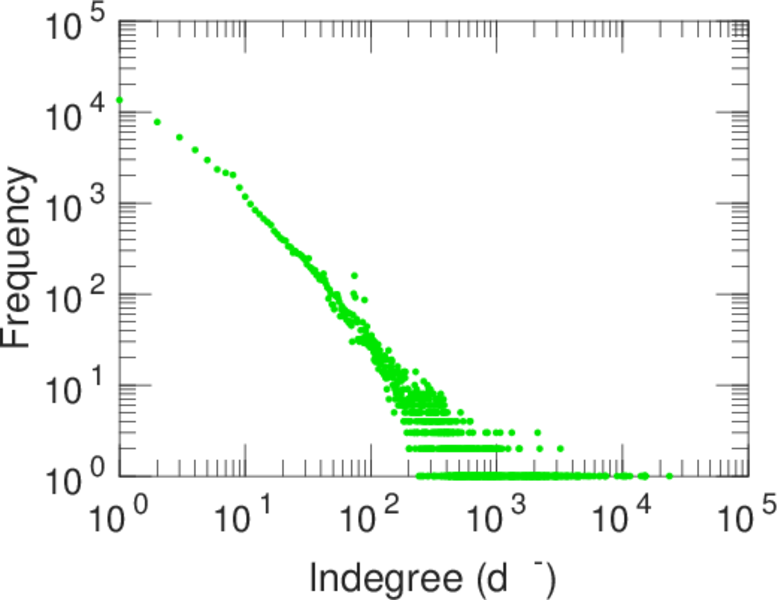
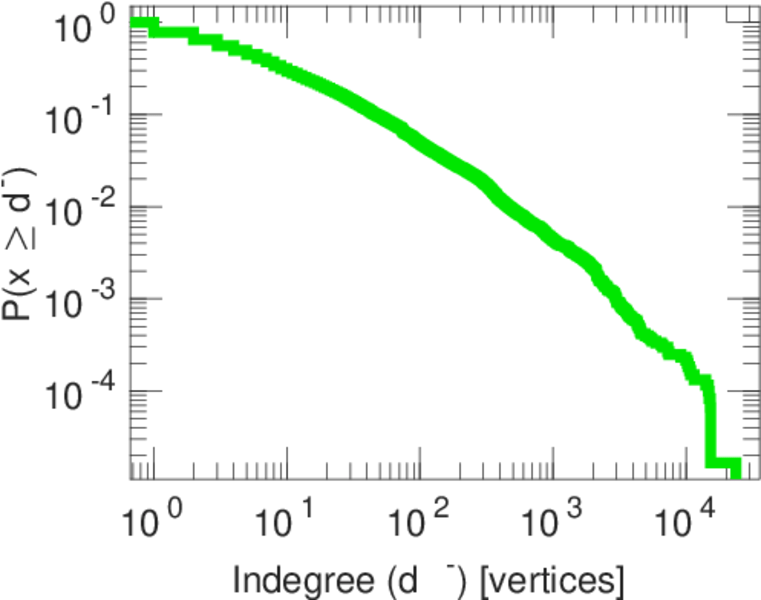
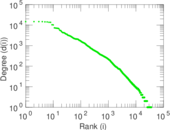
| Maximum indegree | d−max = | 23,670
|
| Average degree | d = | 50.305 1
|
| Fill | p = | 0.000 301 843
|
| Size of LCC | N = | 83,302
|
| Size of LSCC | Ns = | 54,088
|
| Relative size of LSCC | Nrs = | 0.649 082
|
| Diameter | δ = | 9
|
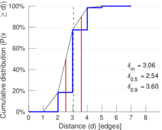
| 50-Percentile effective diameter | δ0.5 = | 2.536 01
|
| 90-Percentile effective diameter | δ0.9 = | 3.598 46
|
| Median distance | δM = | 3
|
| Mean distance | δm = | 3.058 28
|
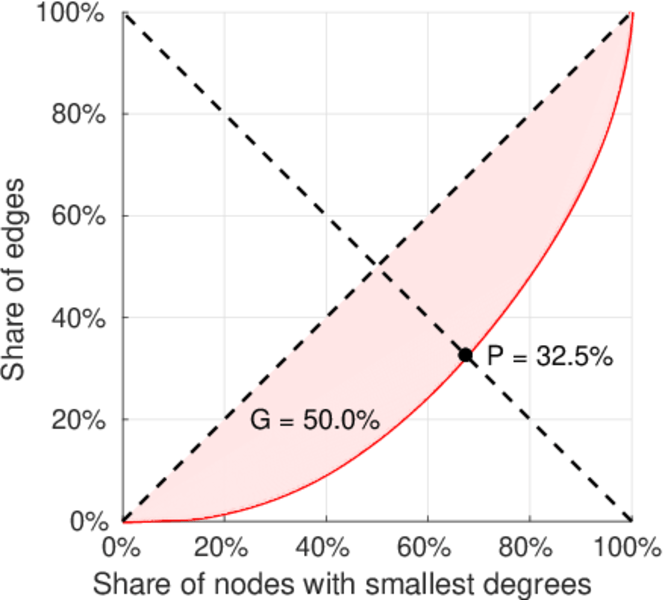
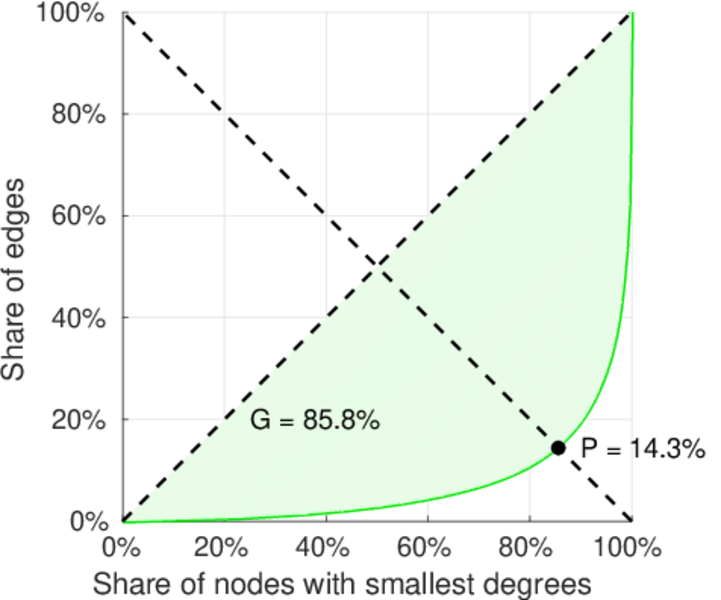
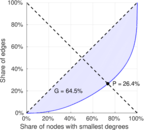
| Gini coefficient | G = | 0.644 756
|
| Balanced inequality ratio | P = | 0.263 770
|
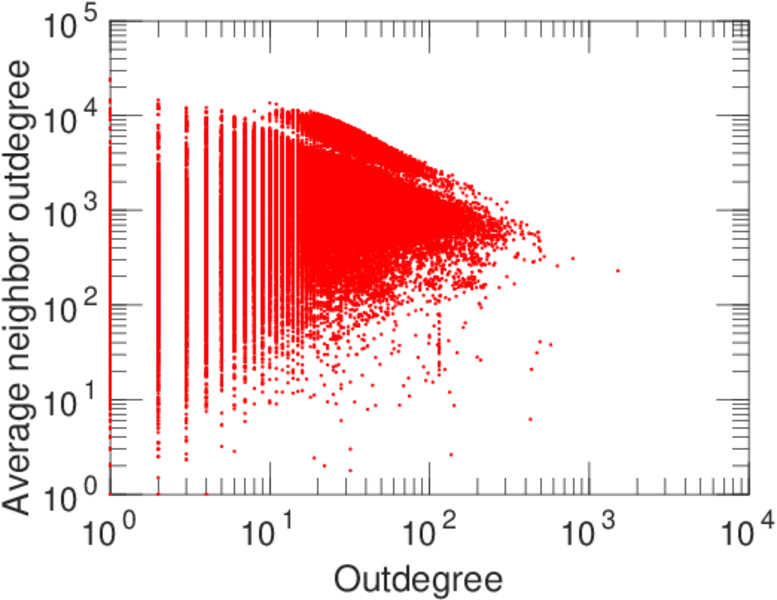
| Outdegree balanced inequality ratio | P+ = | 0.324 976
|
| Indegree balanced inequality ratio | P− = | 0.142 531
|
| Power law exponent | γ = | 1.333 93
|
| Tail power law exponent | γt = | 2.381 00
|
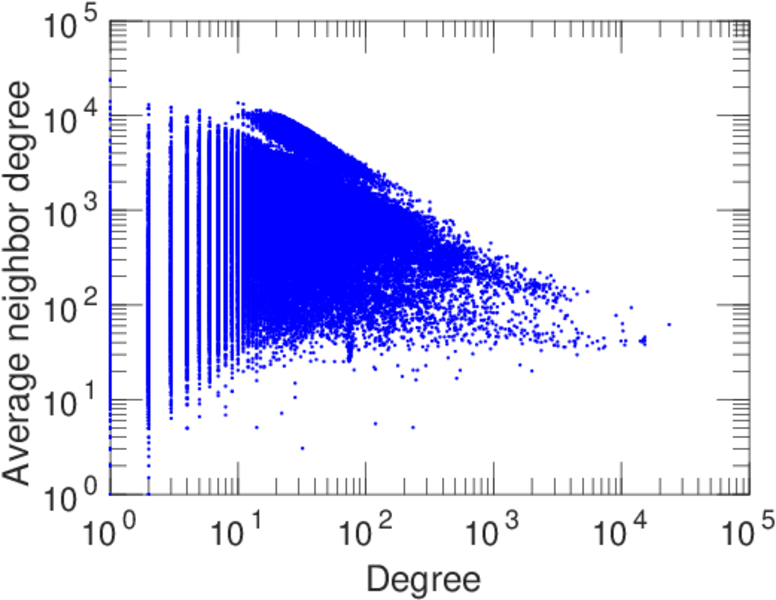
| Degree assortativity | ρ = | −0.128 772
|
| Degree assortativity p-value | pρ = | 0.000 00
|
| In/outdegree correlation | ρ± = | +0.191 502
|
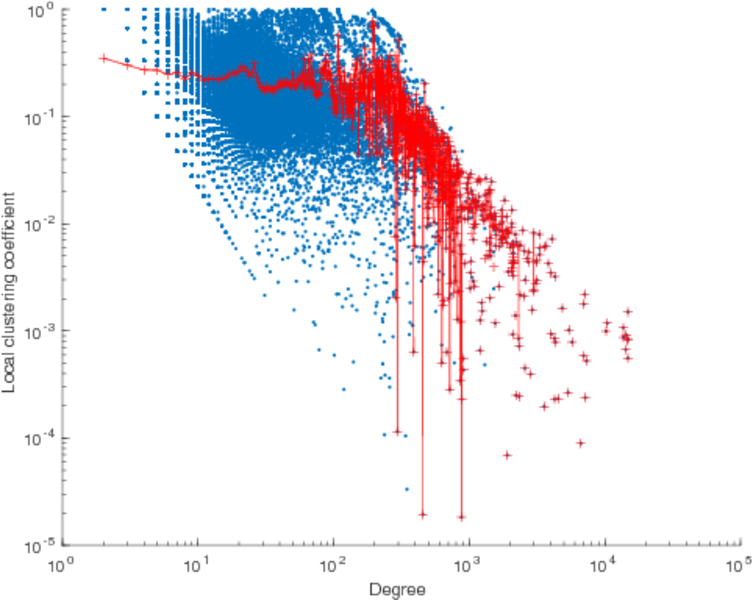
| Clustering coefficient | c = | 0.009 217 49
|
| Directed clustering coefficient | c± = | 0.131 965
|
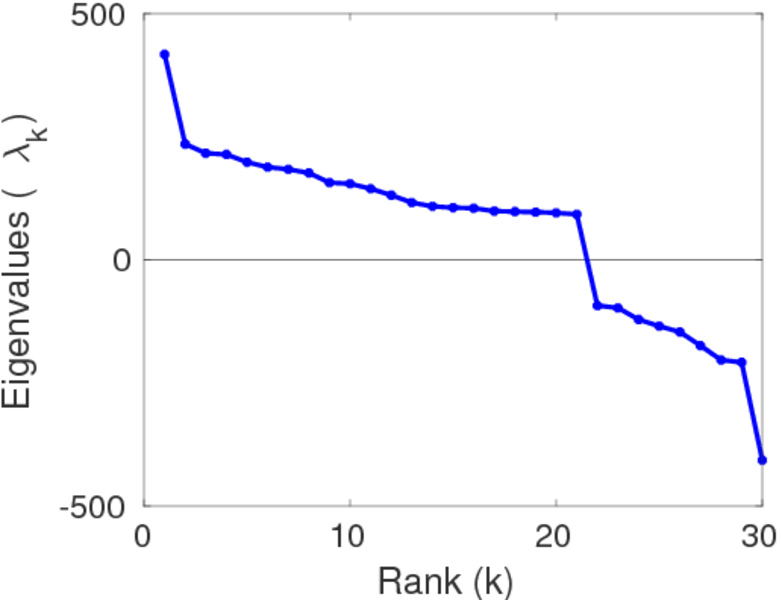
| Spectral norm | α = | 428.721
|
| Operator 2-norm | ν = | 421.602
|
| Algebraic connectivity | a = | 0.194 621
|
| Reciprocity | y = | 0.108 526
|
| Non-bipartivity | bA = | 0.025 191 3
|
| Normalized non-bipartivity | bN = | 0.123 448
|
| Spectral bipartite frustration | bK = | 0.001 021 23
|
| Controllability | C = | 32,055
|
| Relative controllability | Cr = | 0.384 675
|
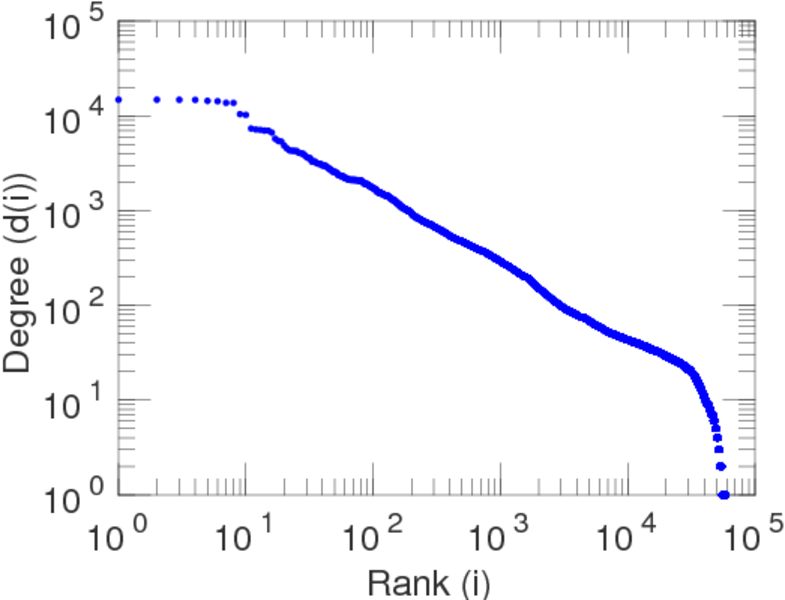
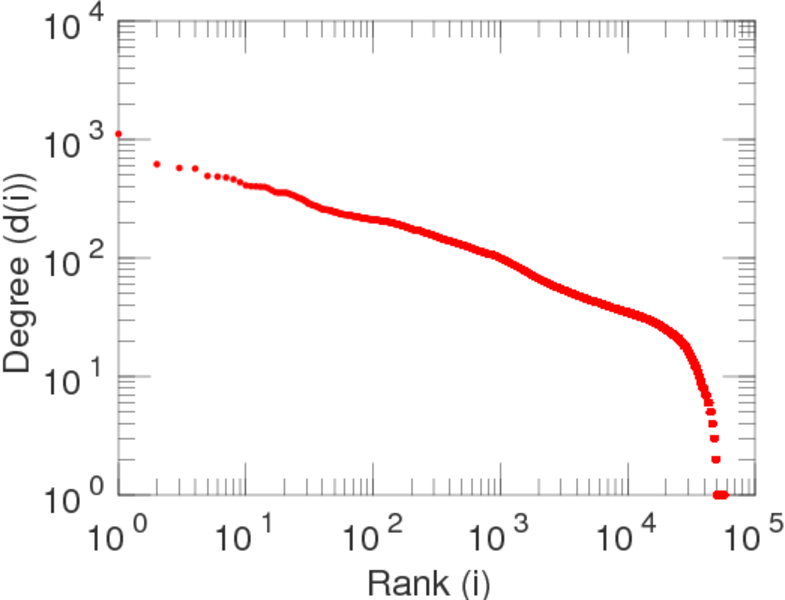
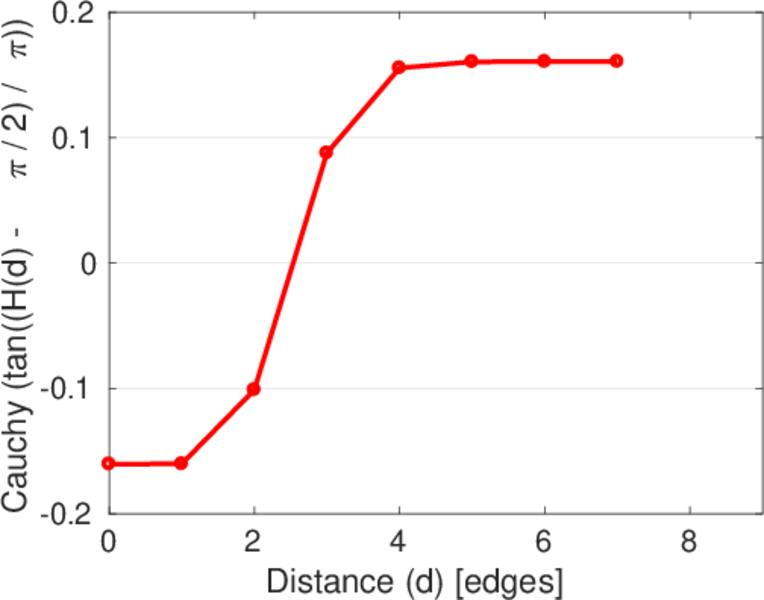
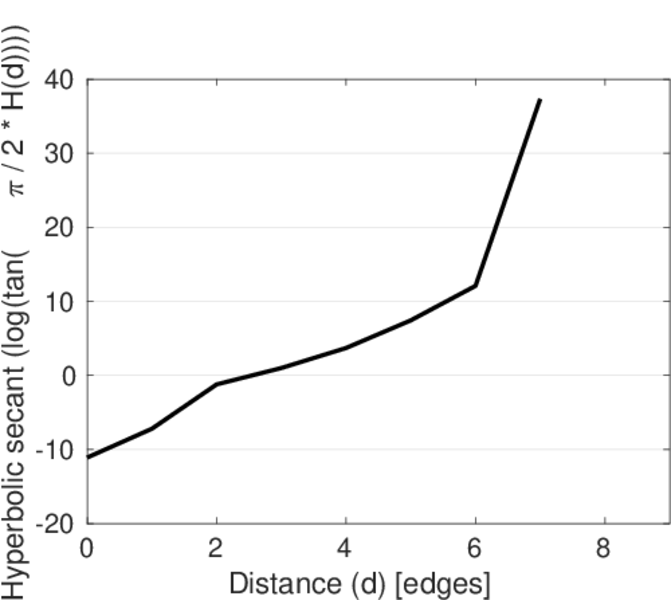
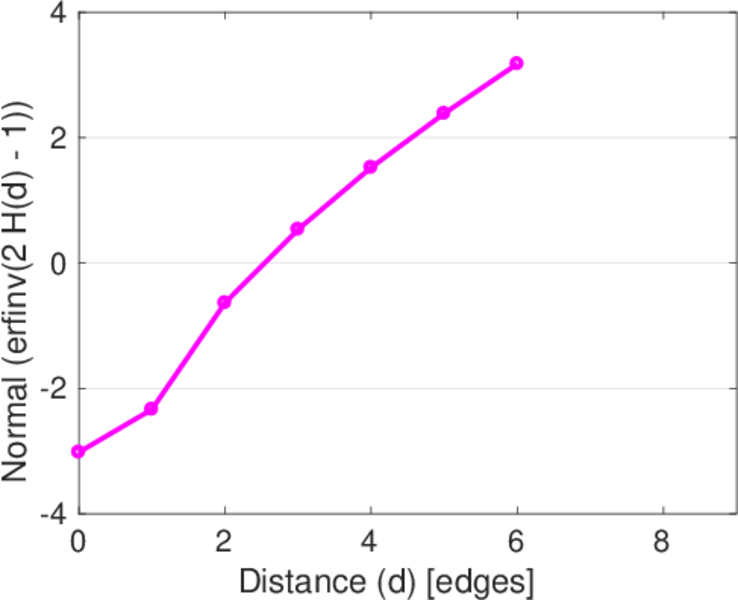
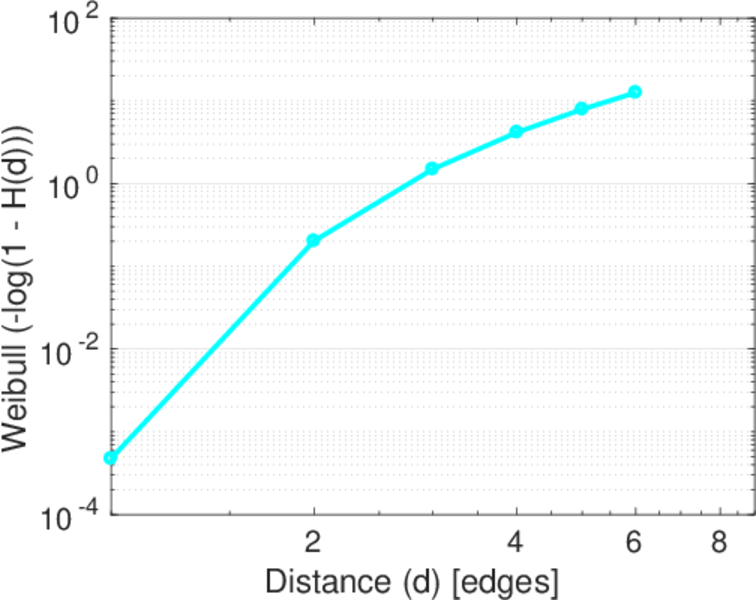
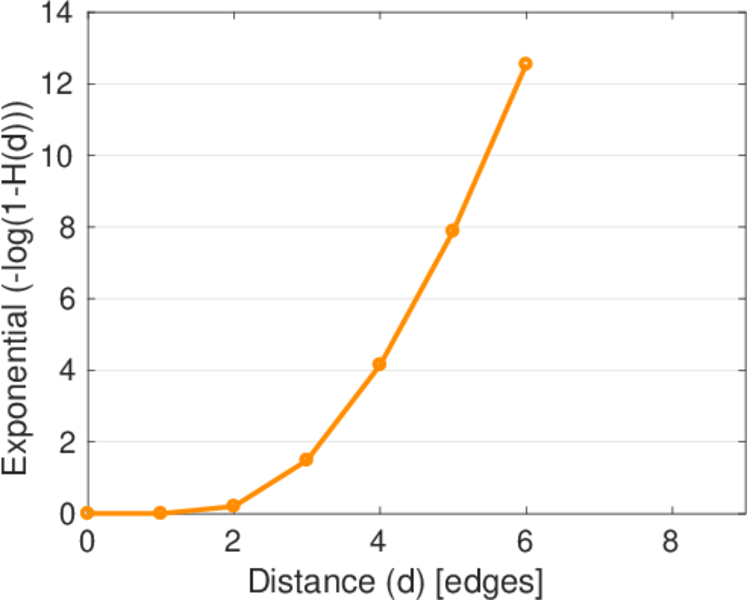
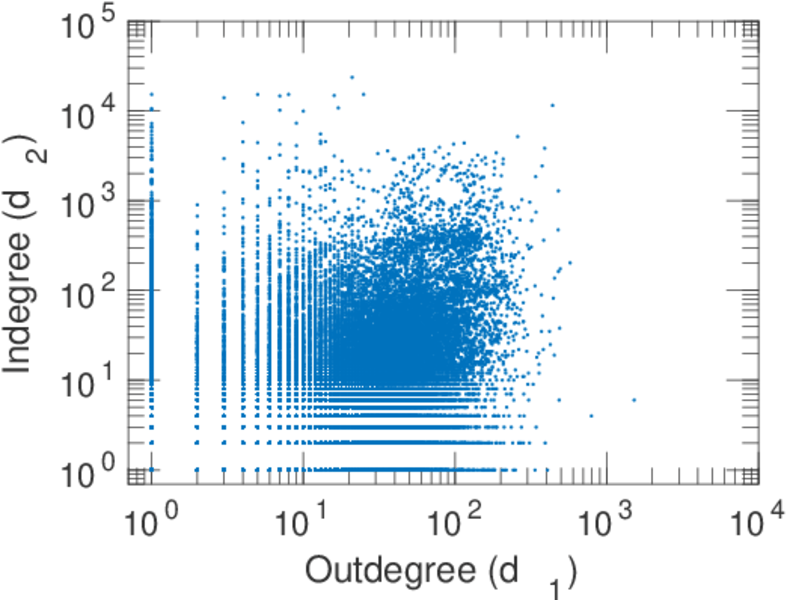
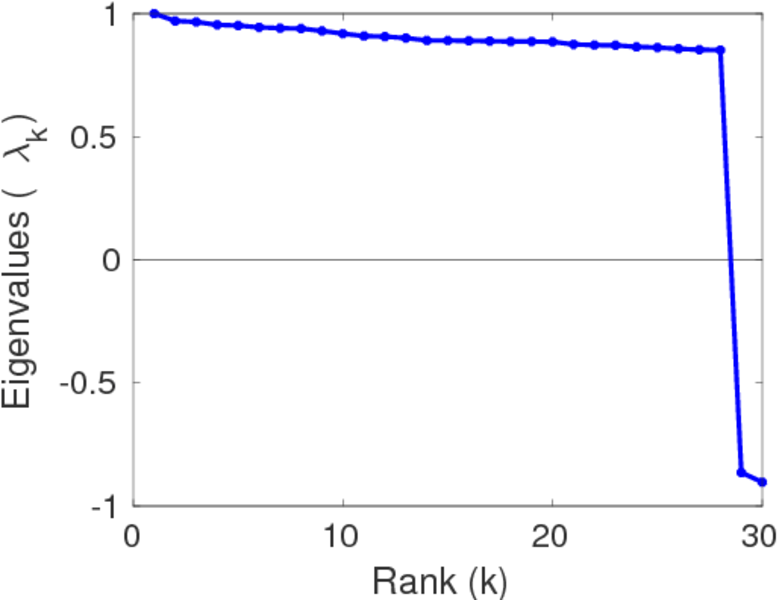
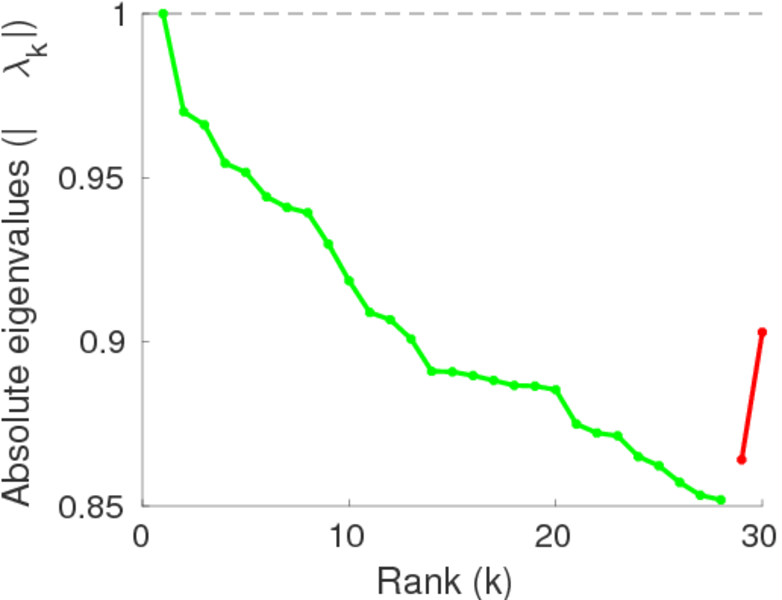
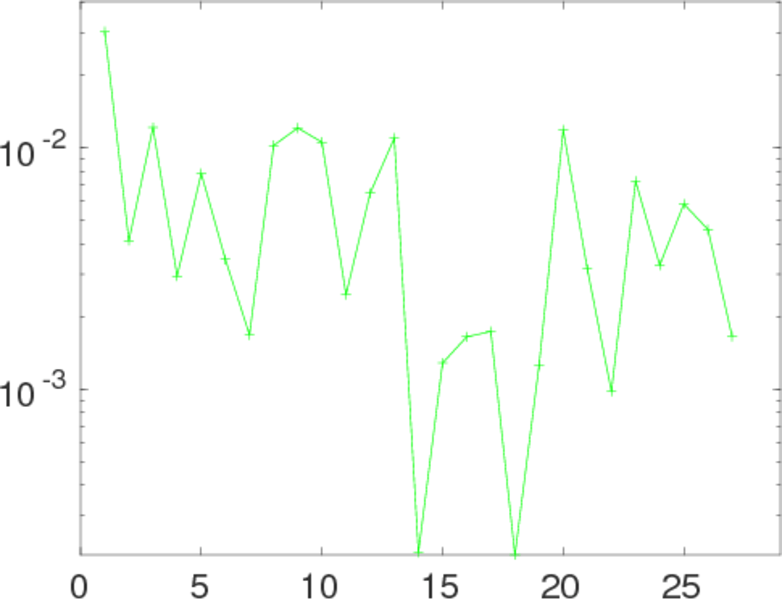
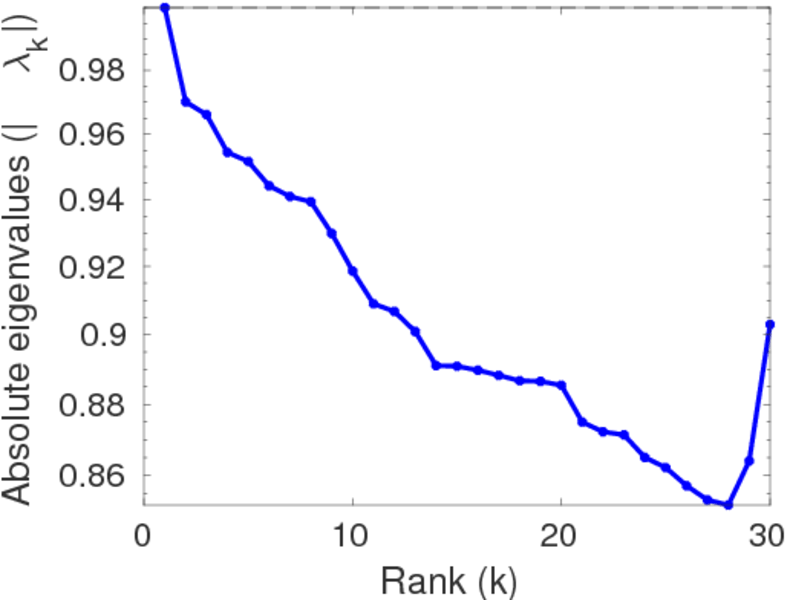
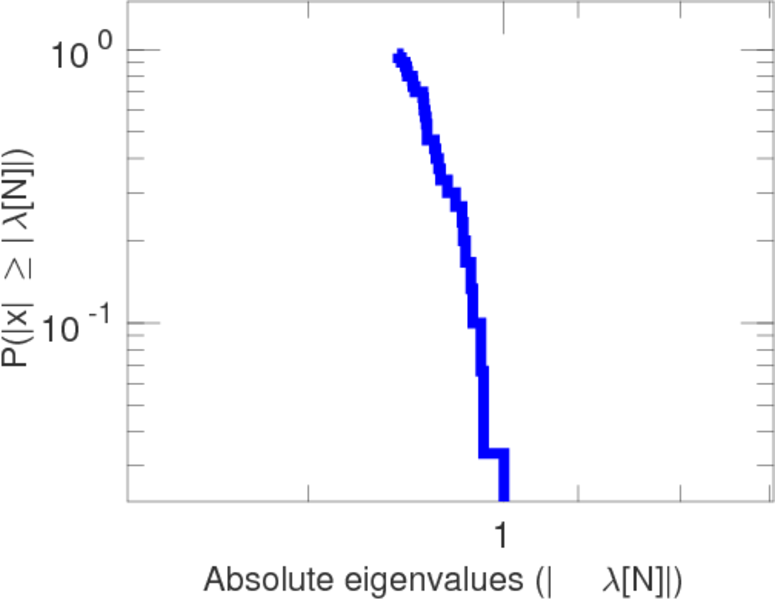
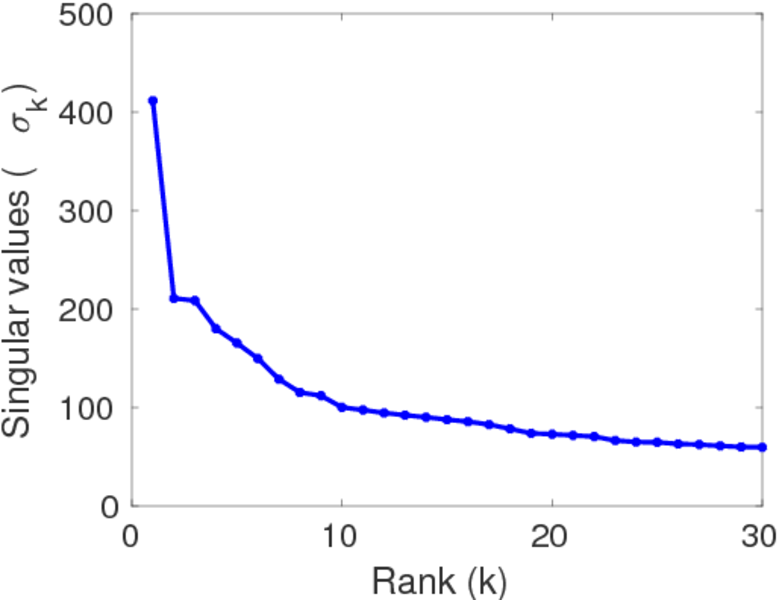
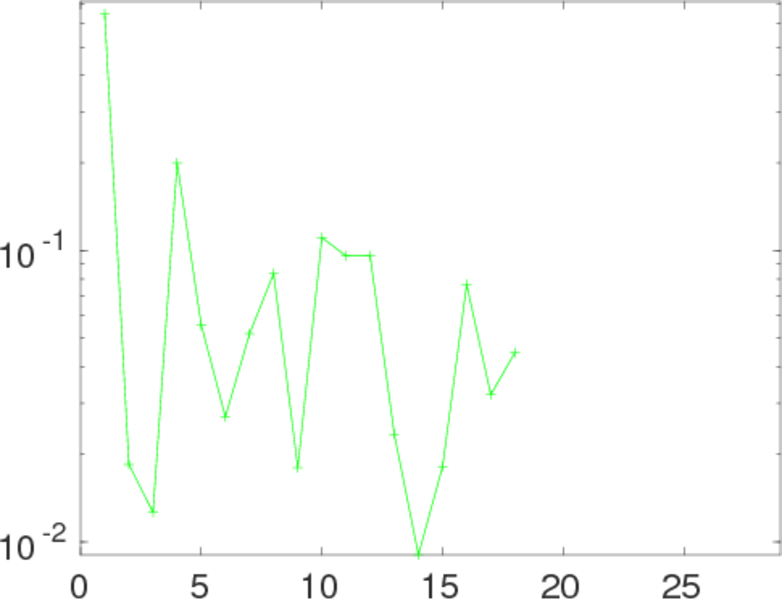
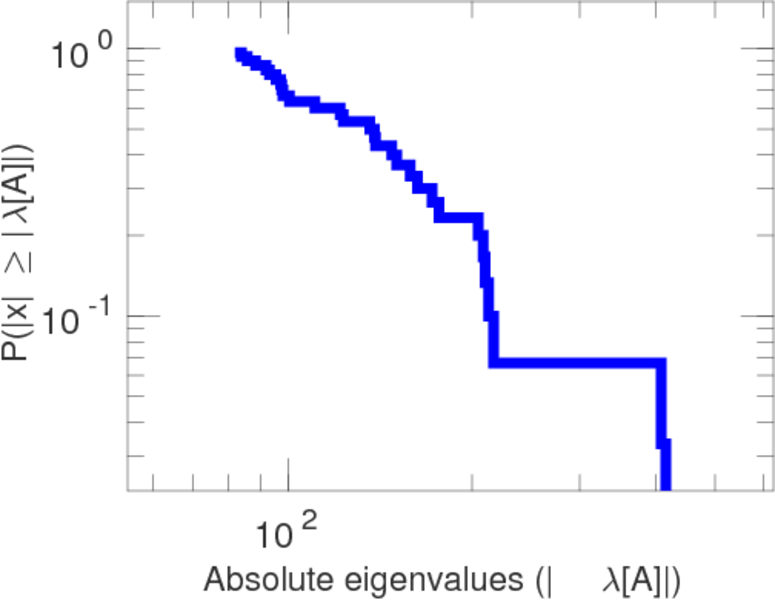
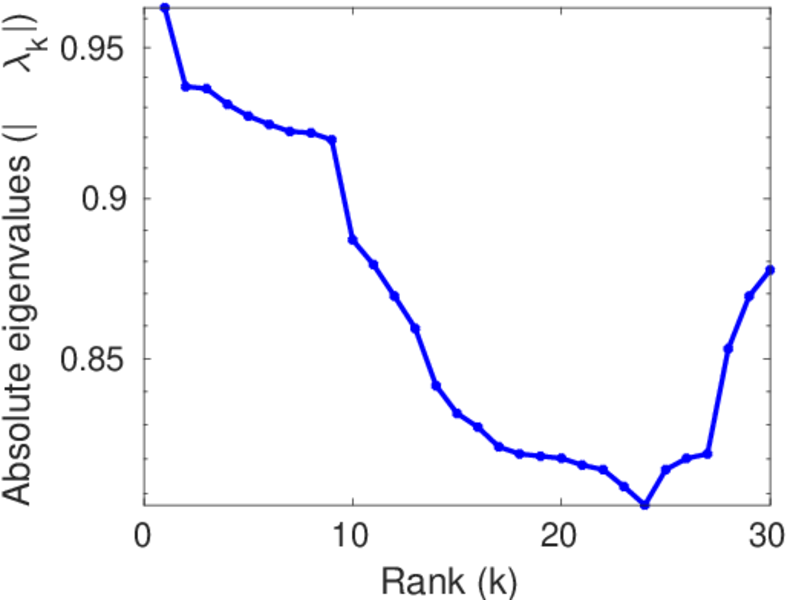
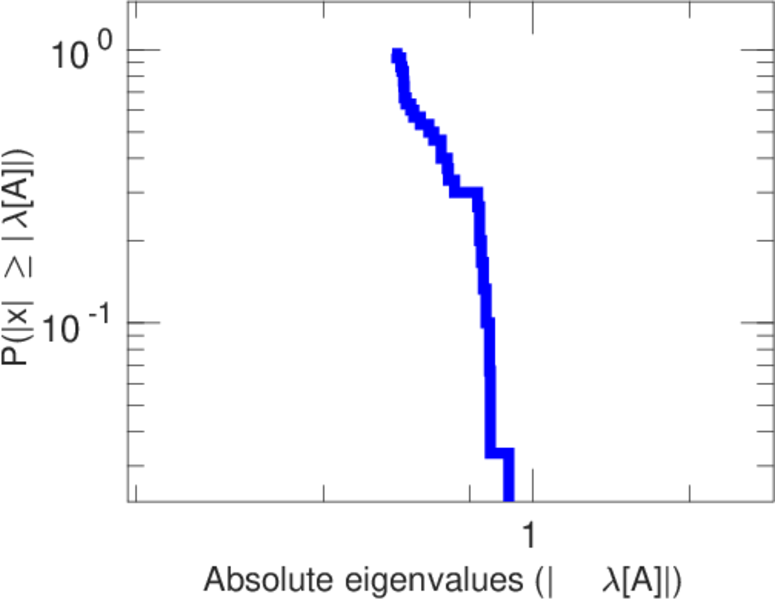
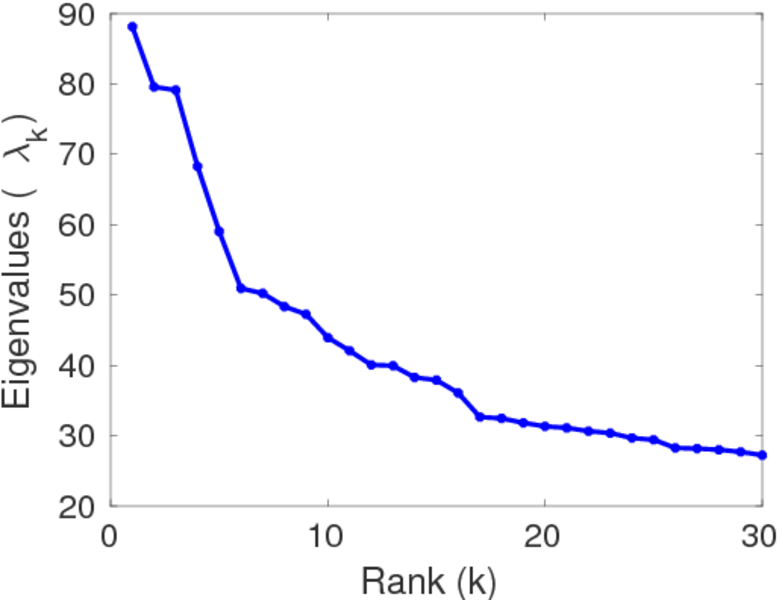
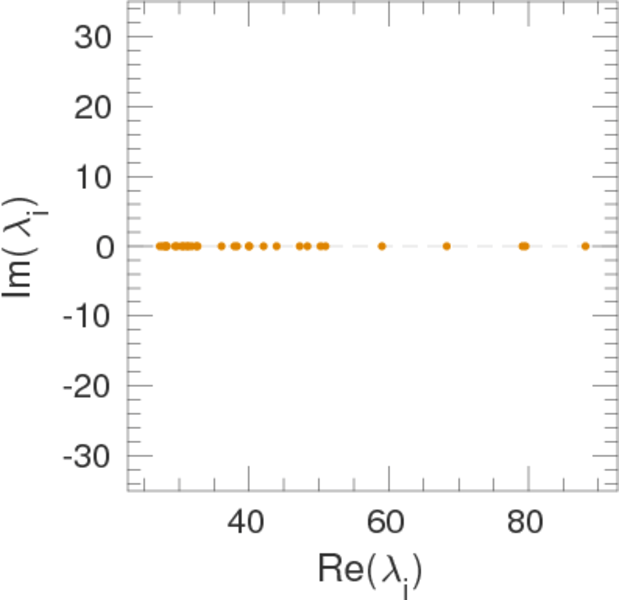
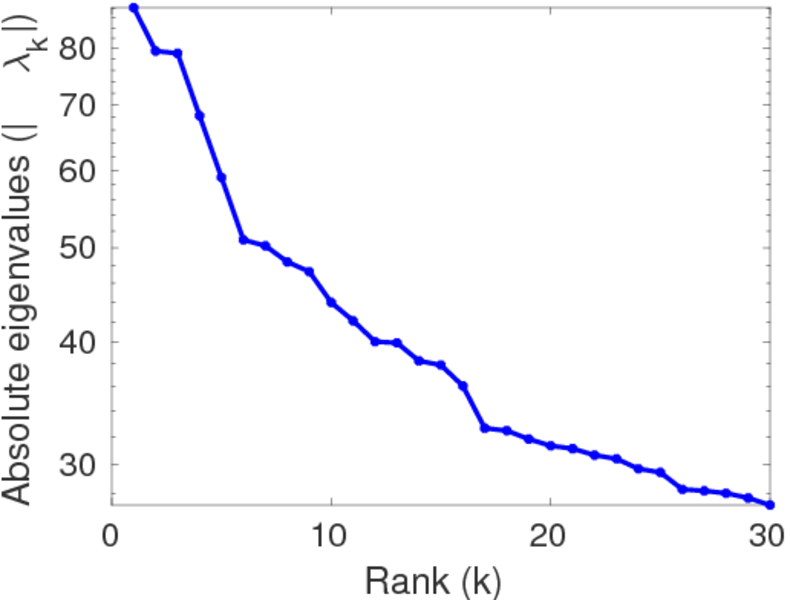
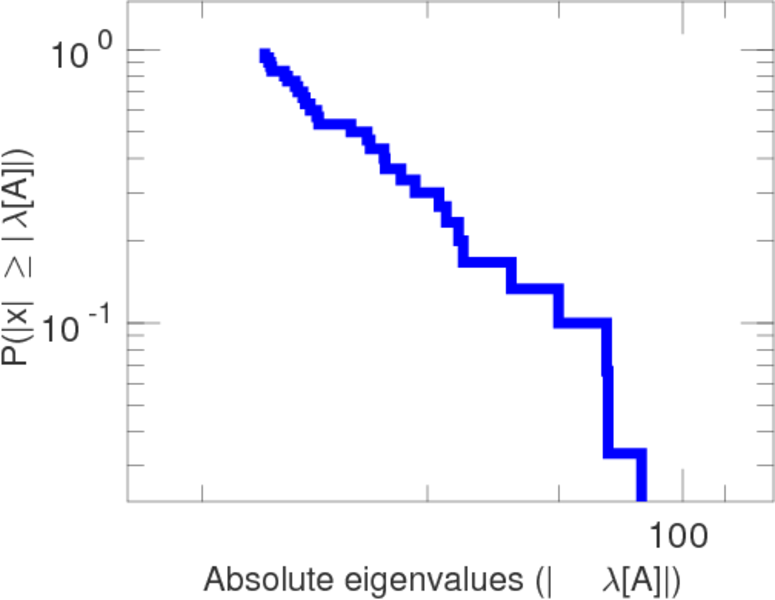
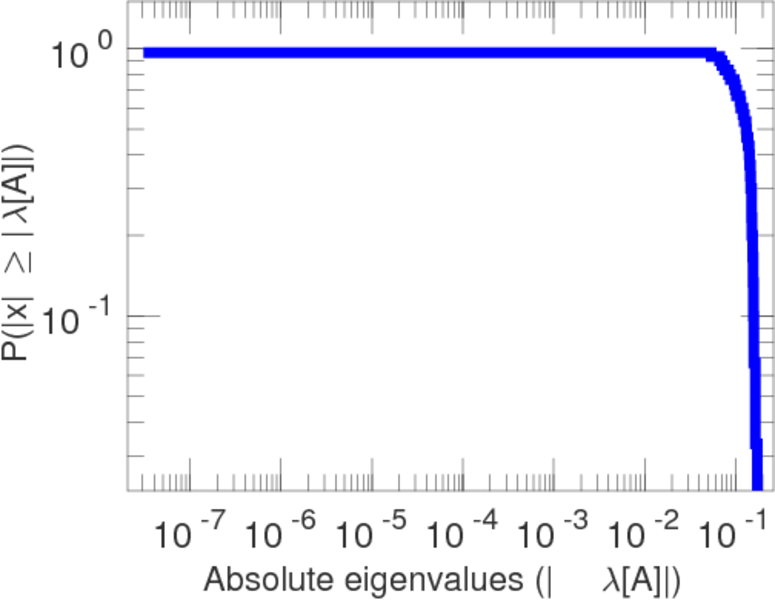
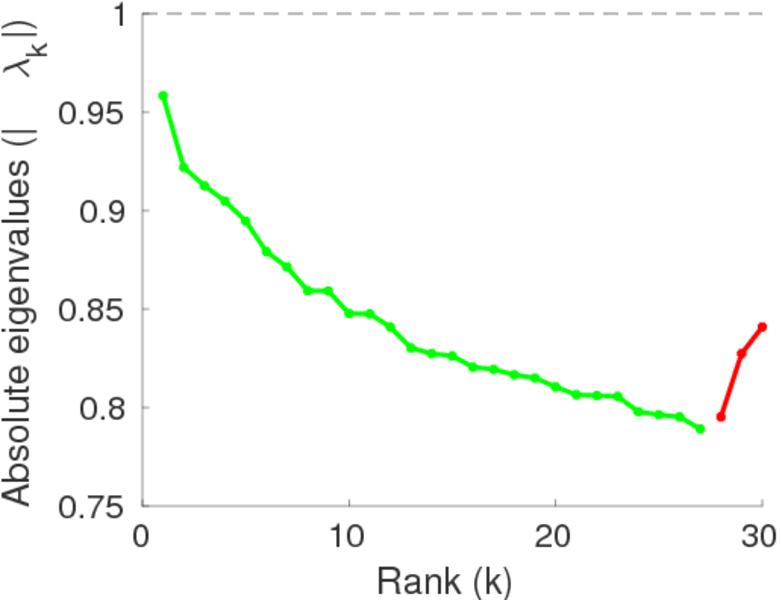
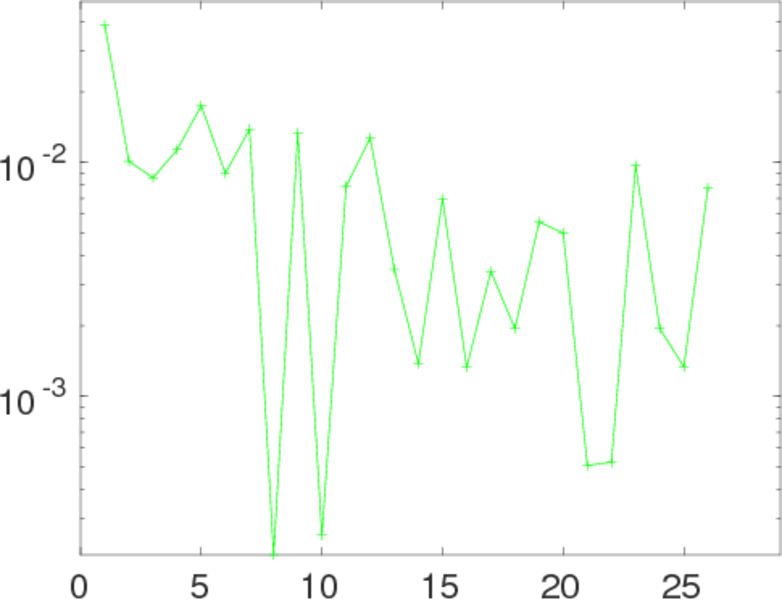
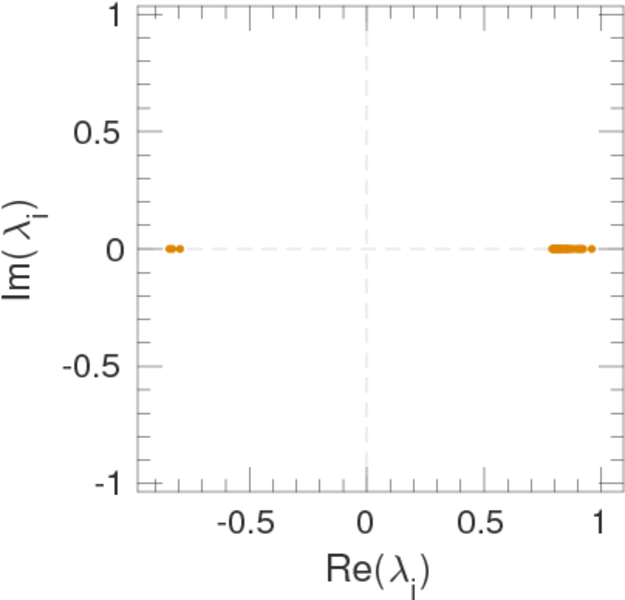
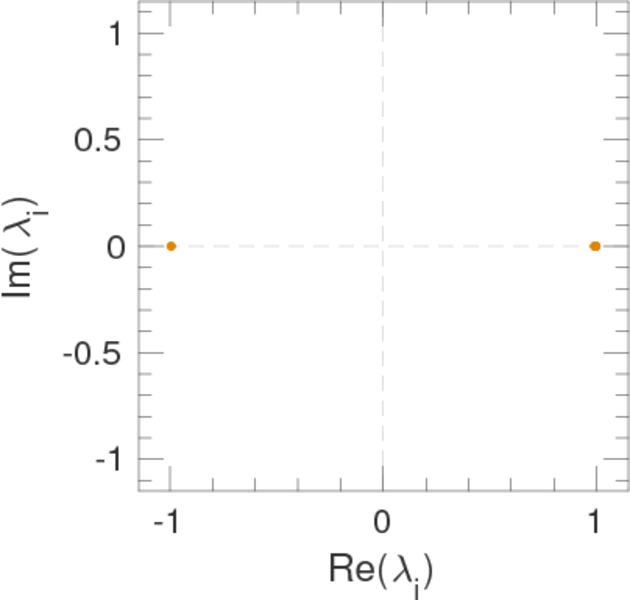
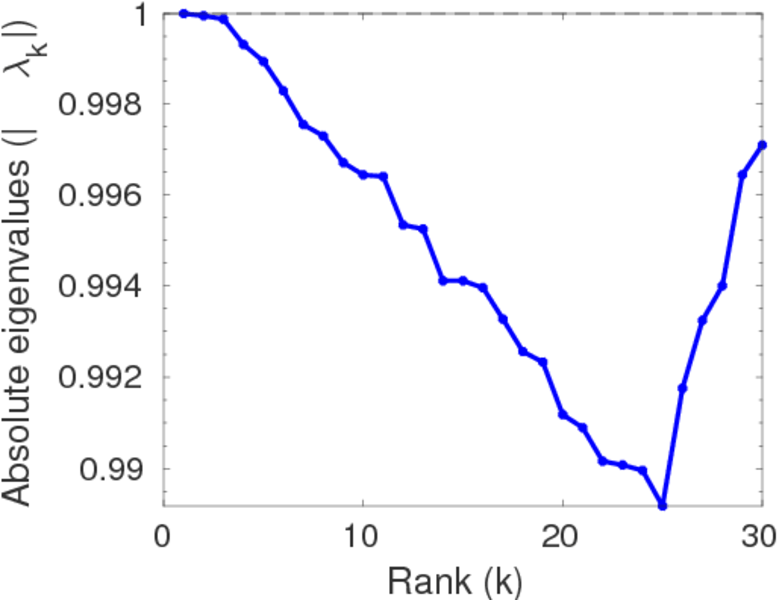
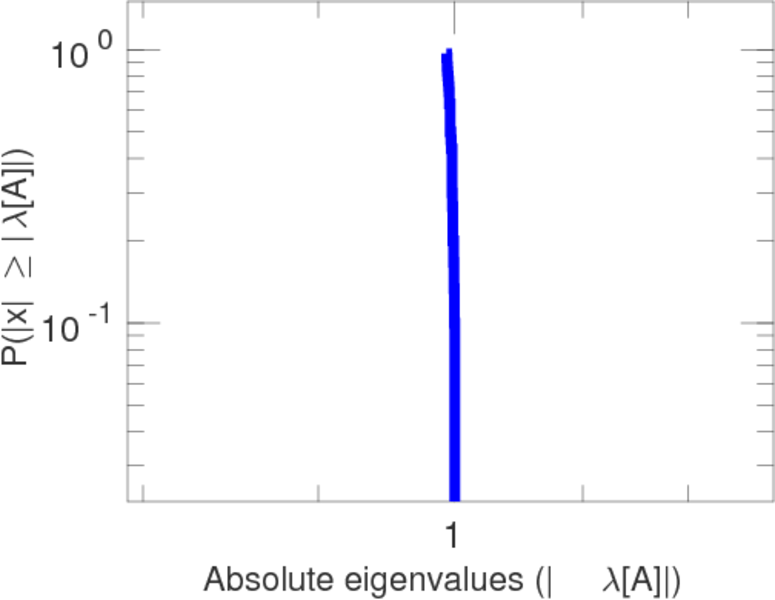
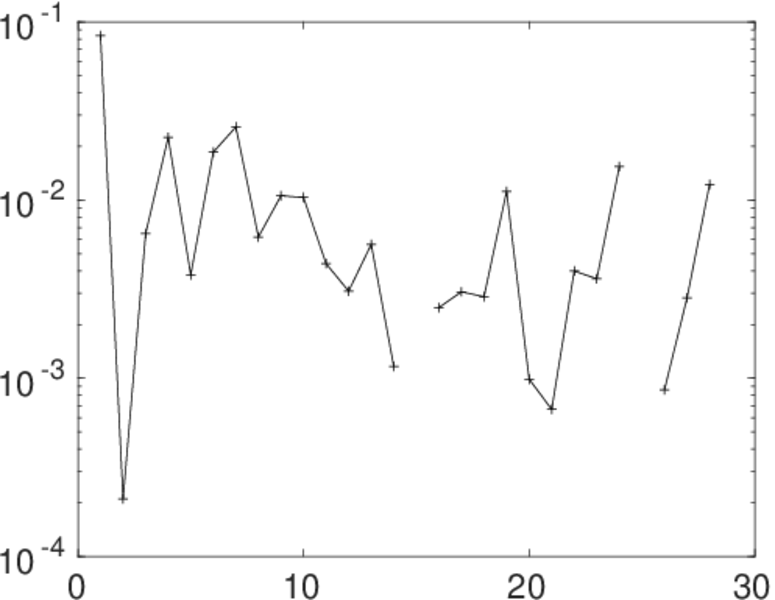
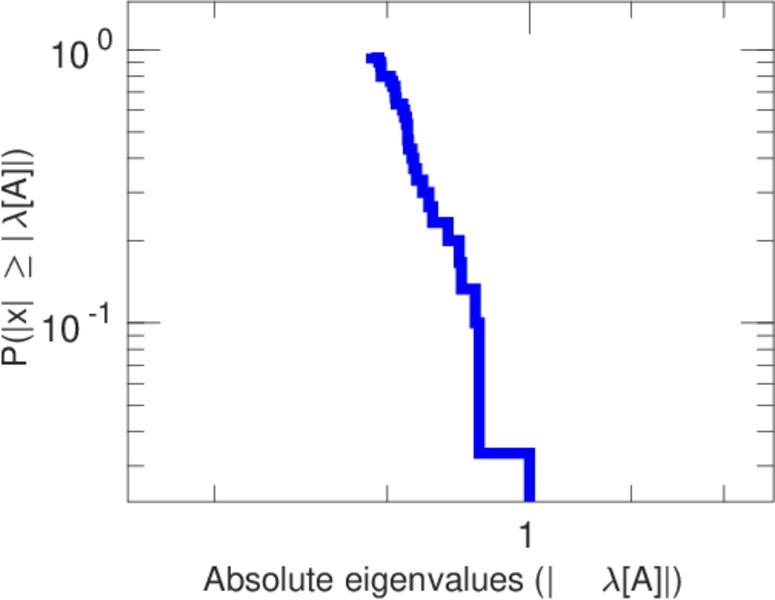
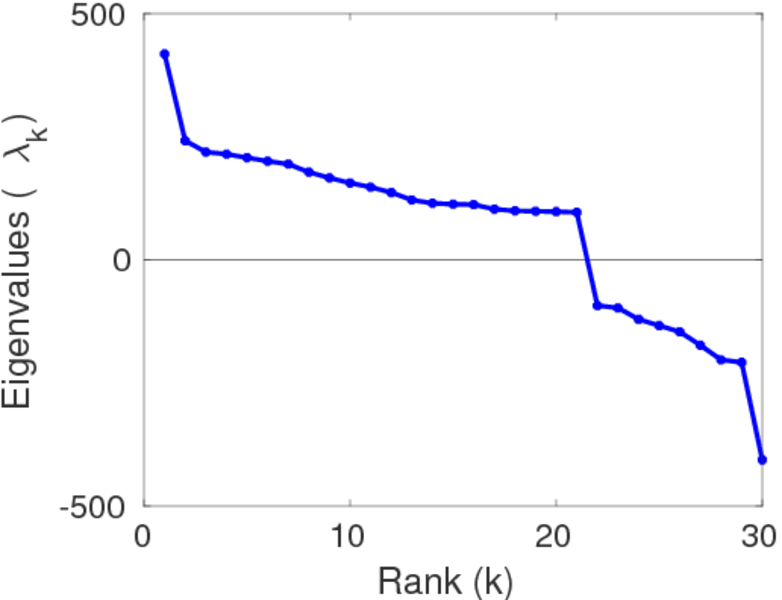
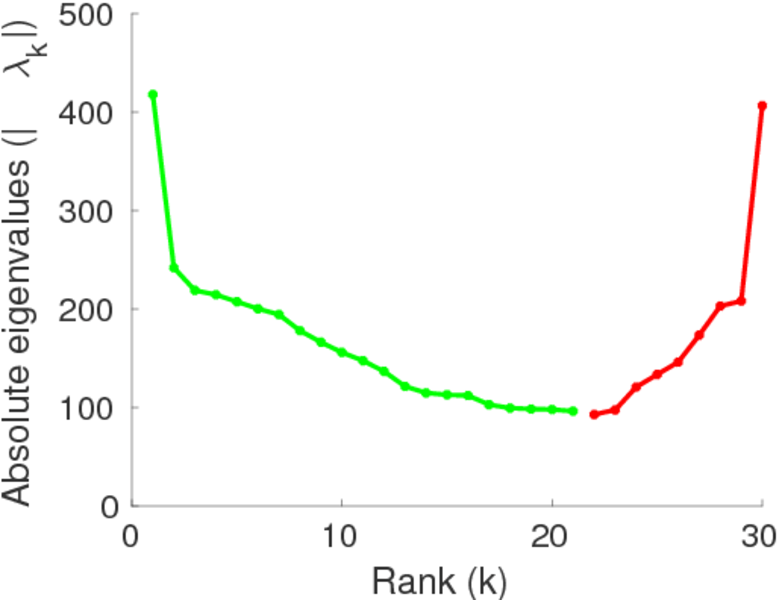
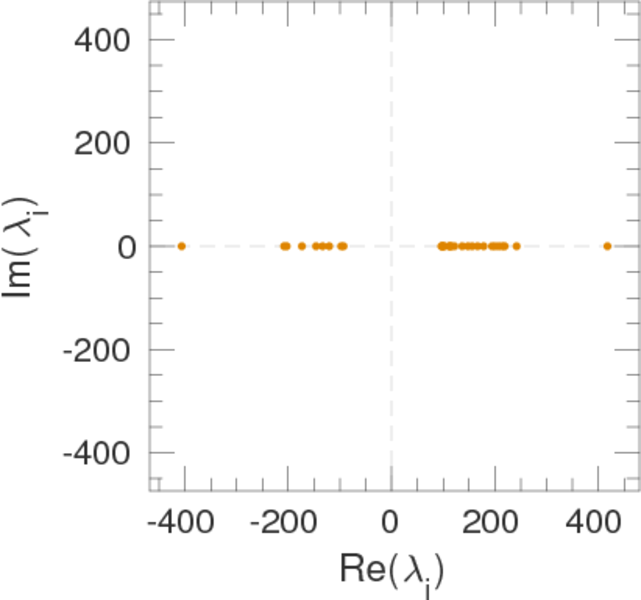
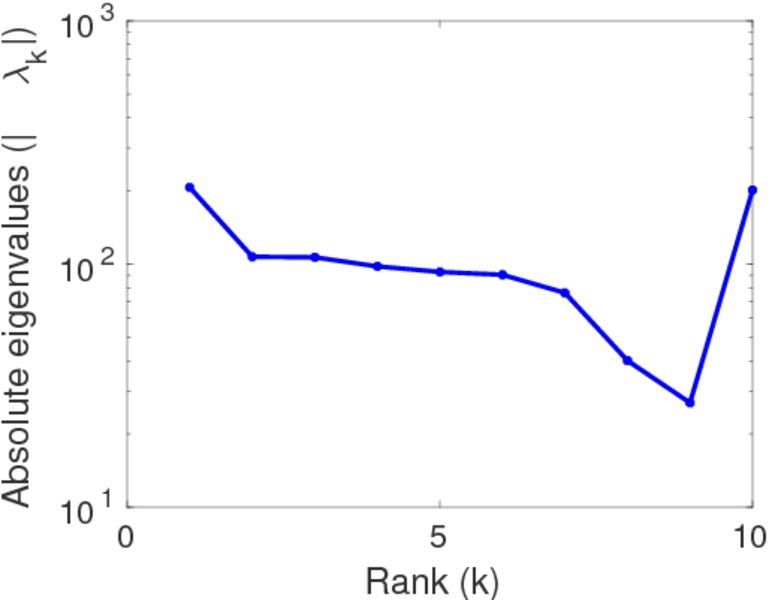
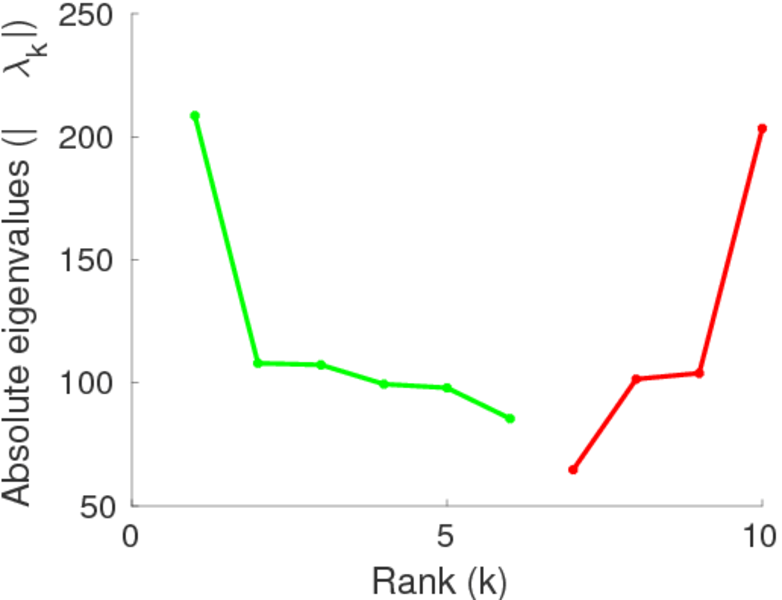
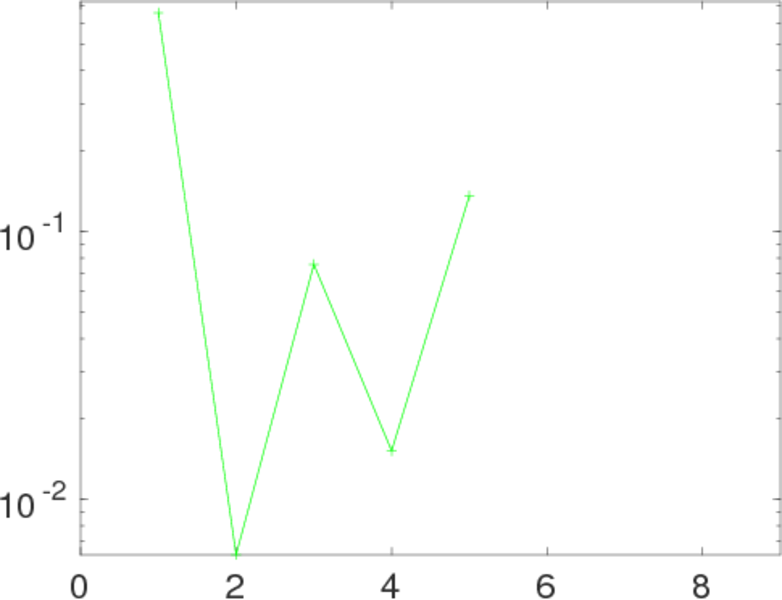
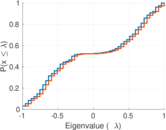
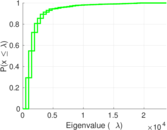
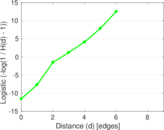
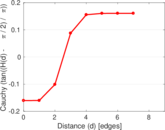
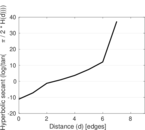
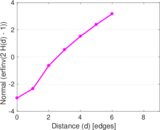
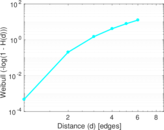
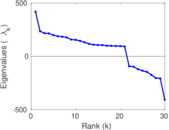
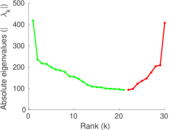
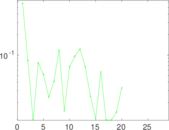
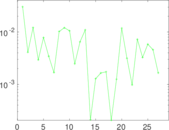
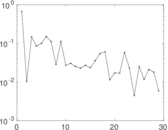
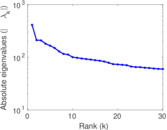
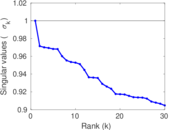
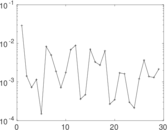
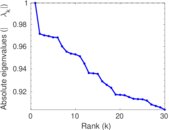
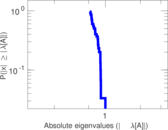
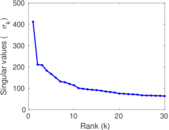
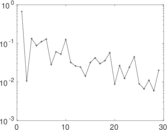
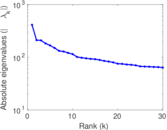
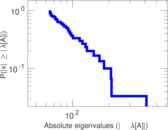
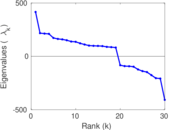
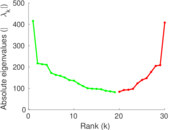
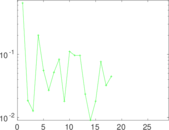
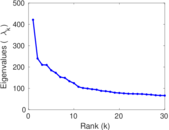
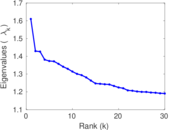
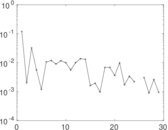
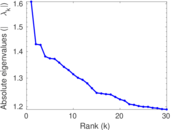
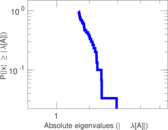
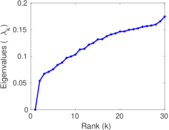
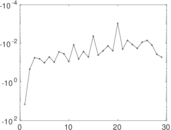
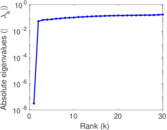
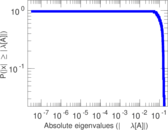
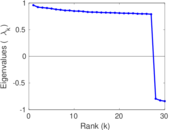
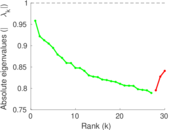
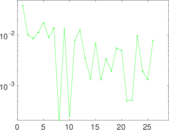
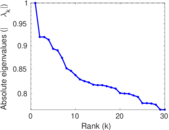
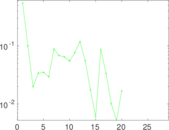
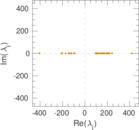
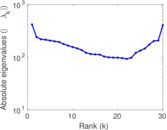
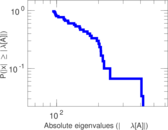
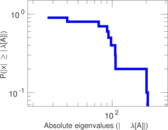
Plots


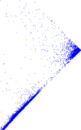
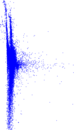


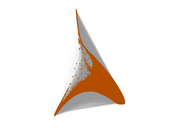
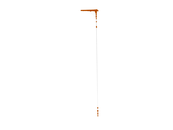
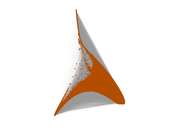

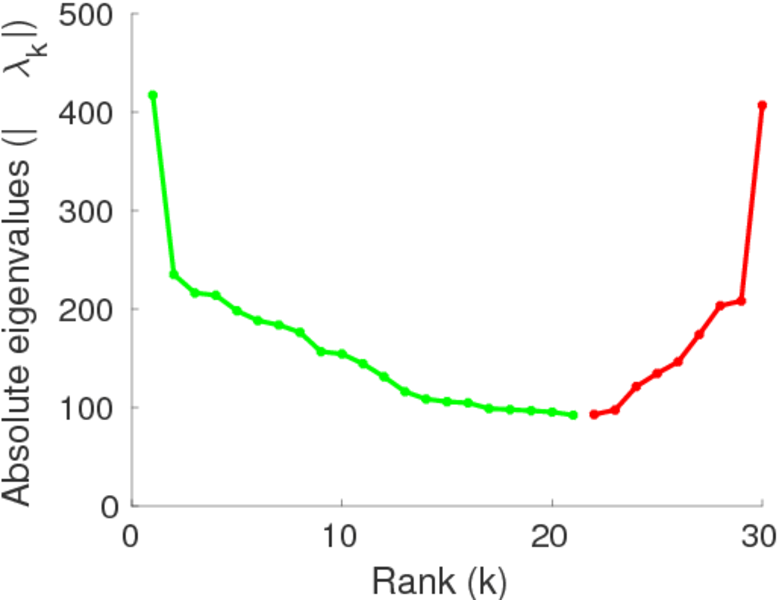
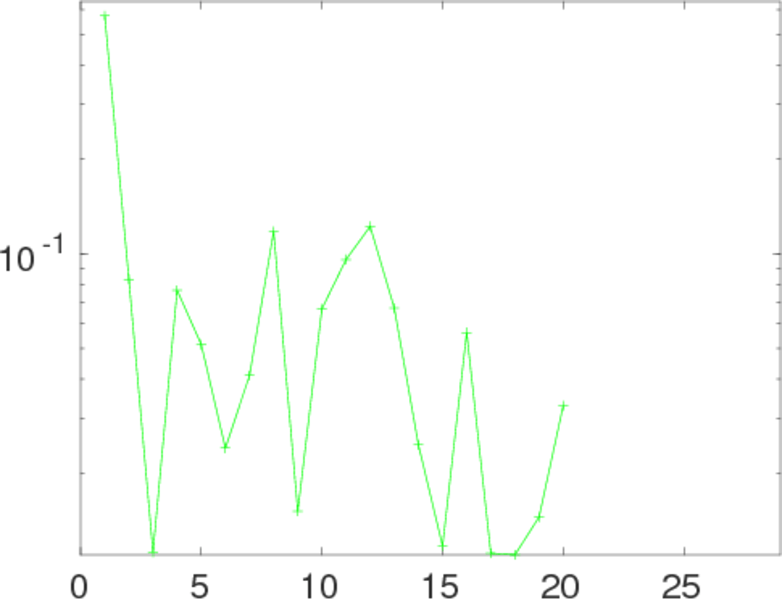
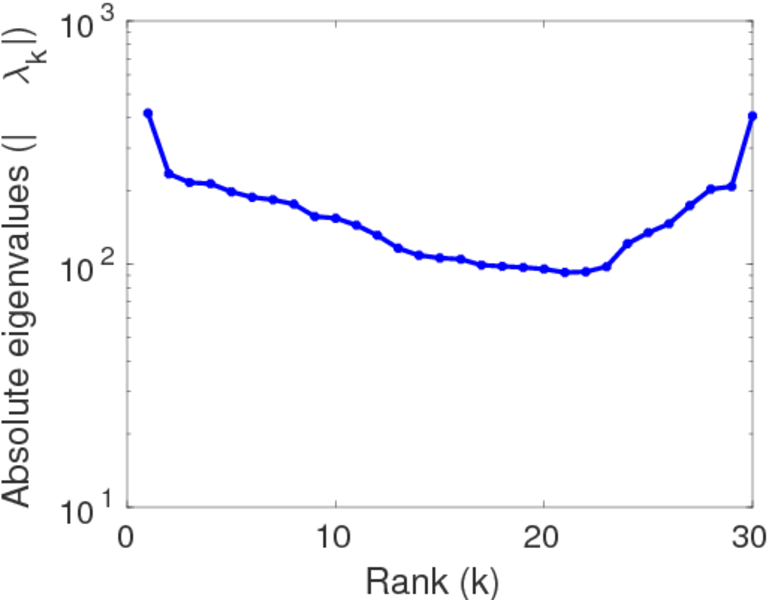
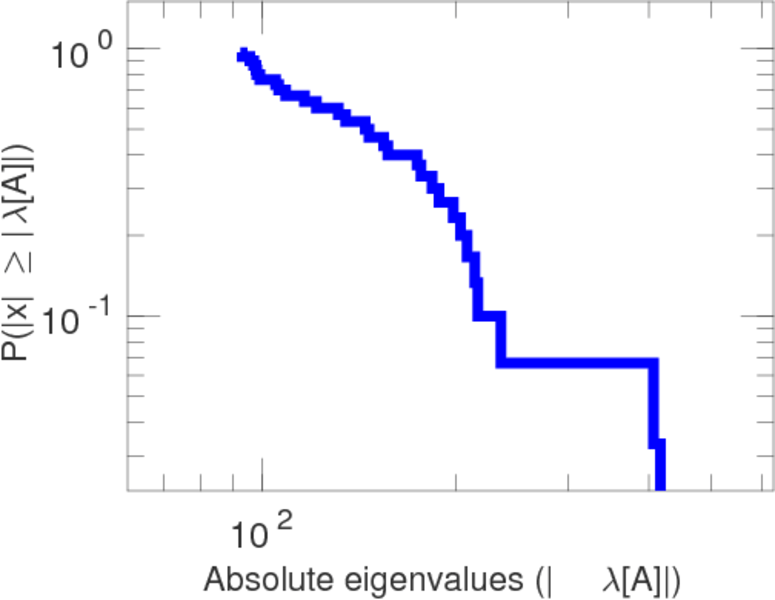
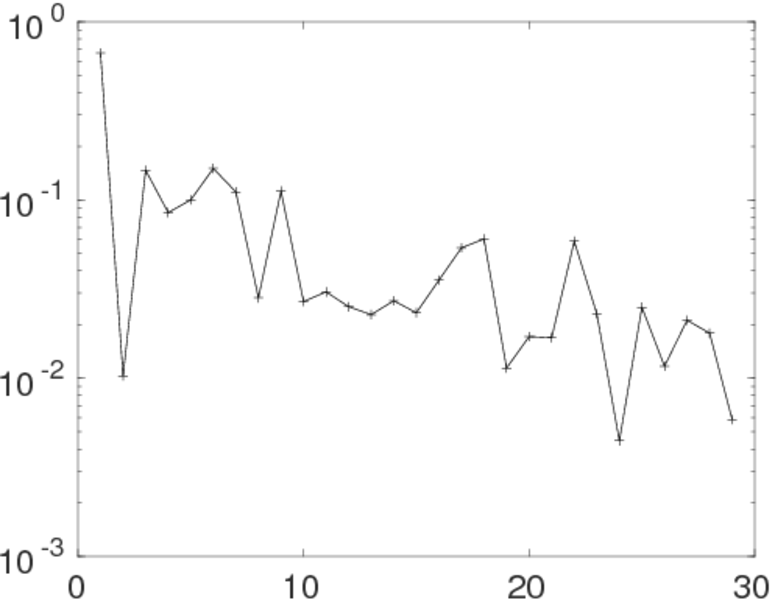
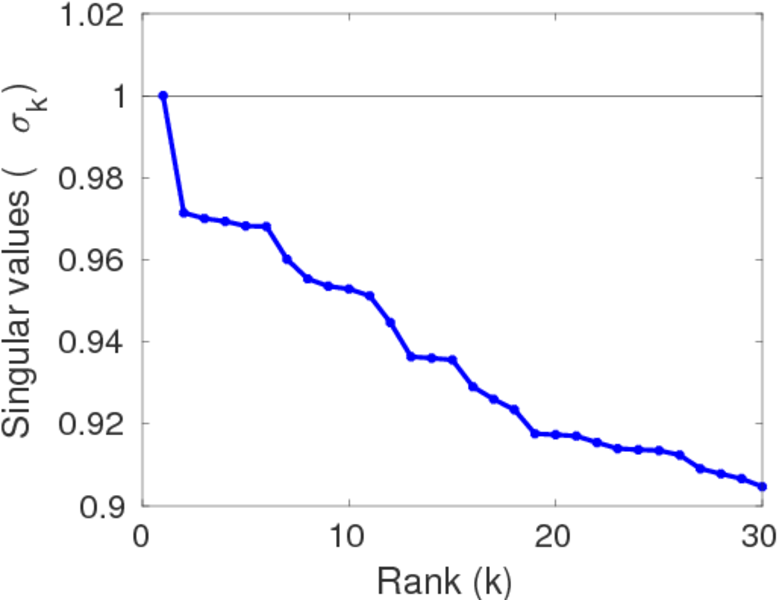
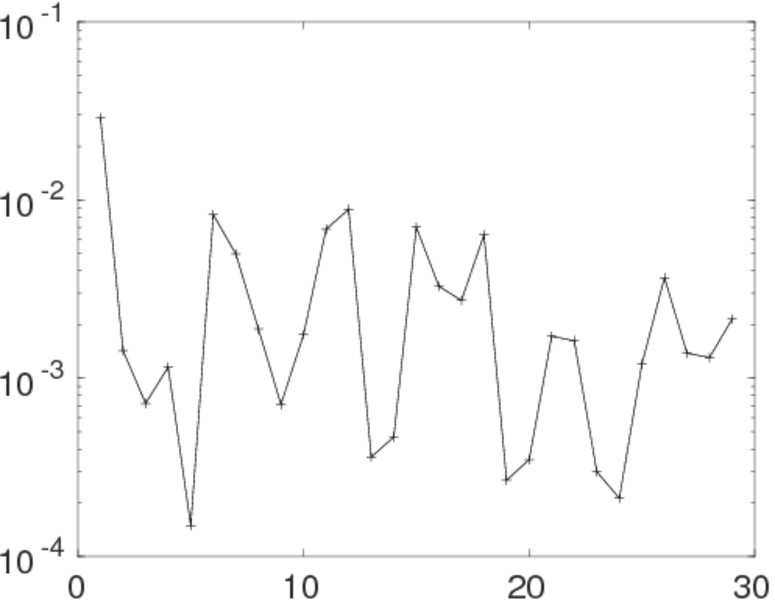
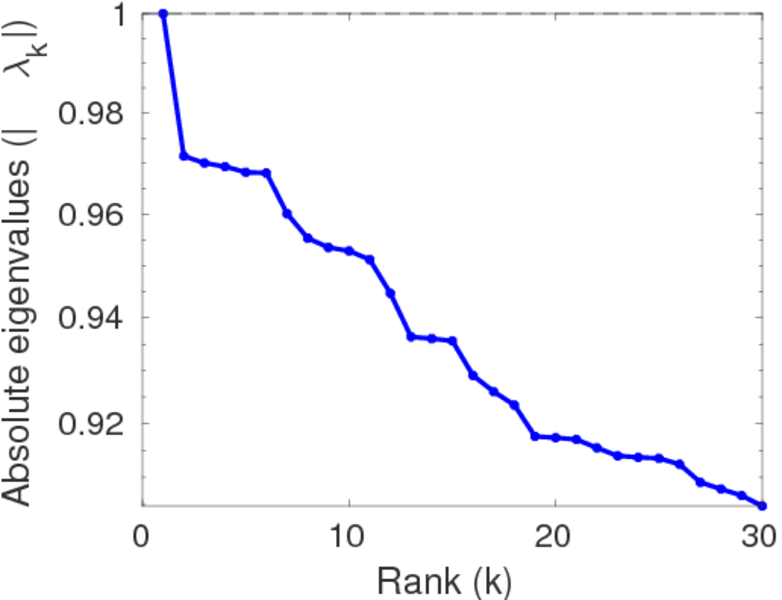
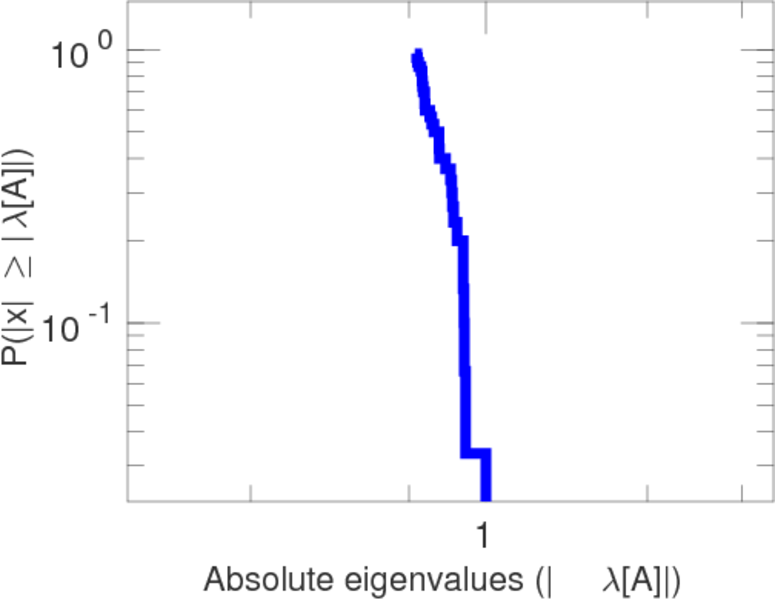
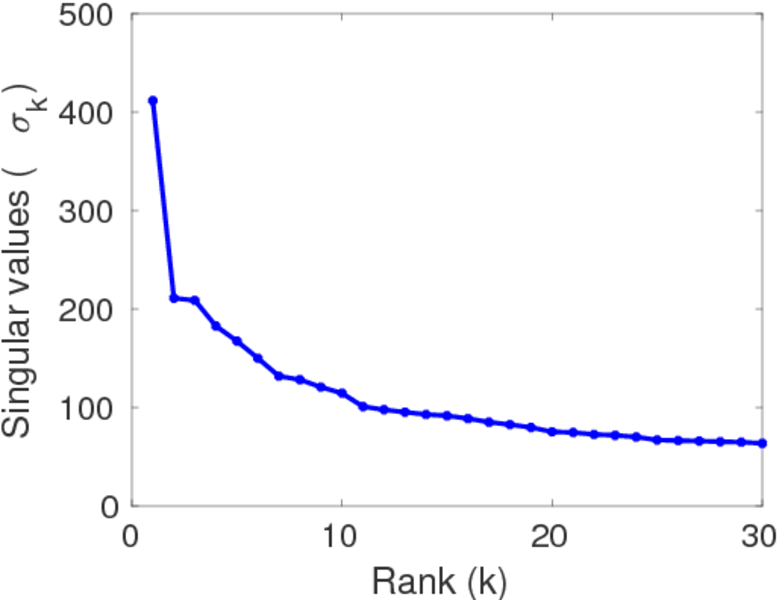
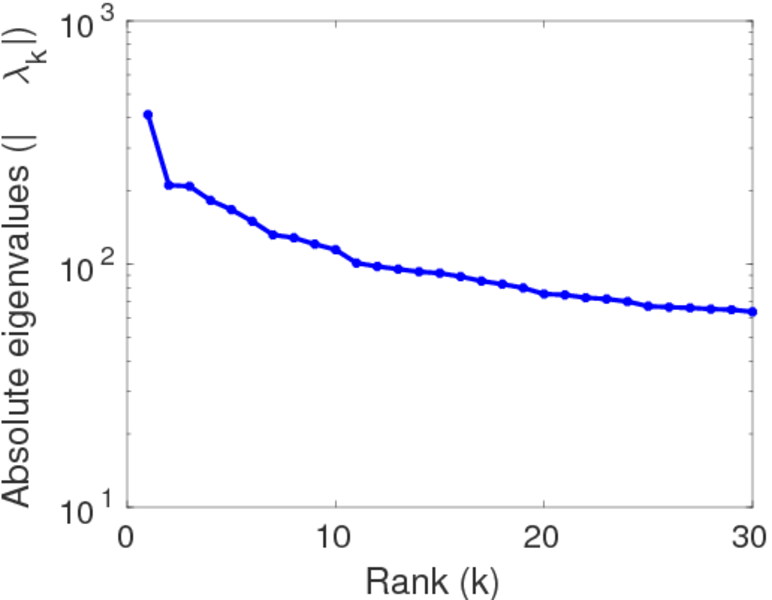
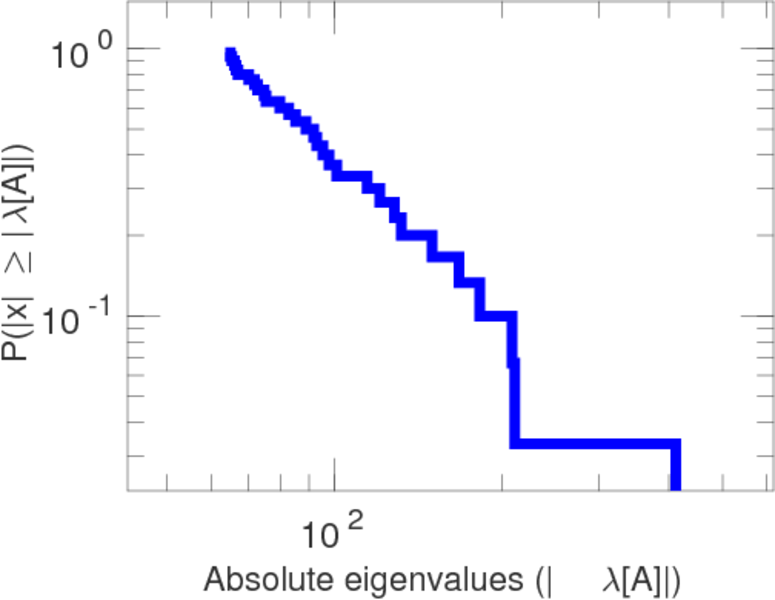
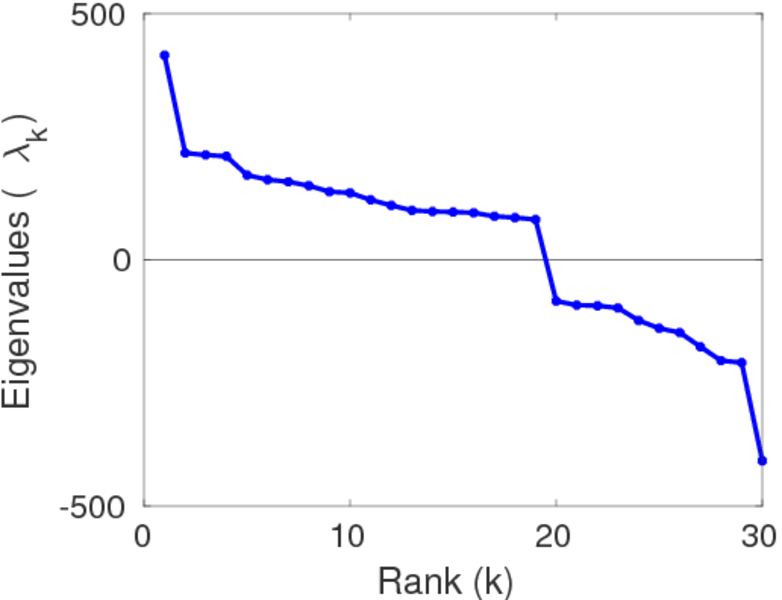
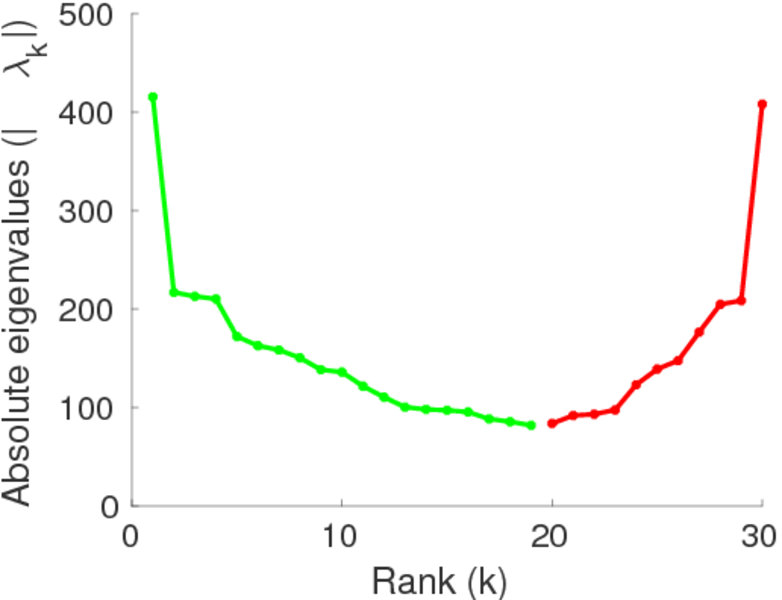
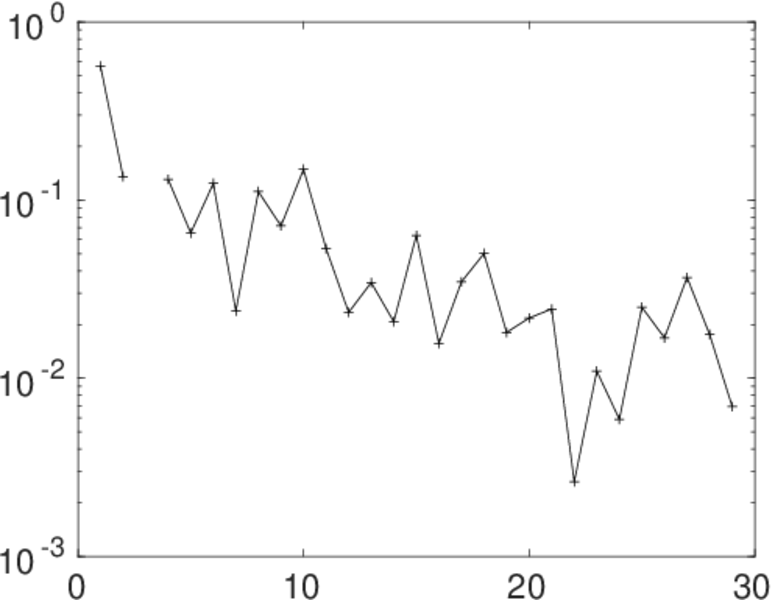
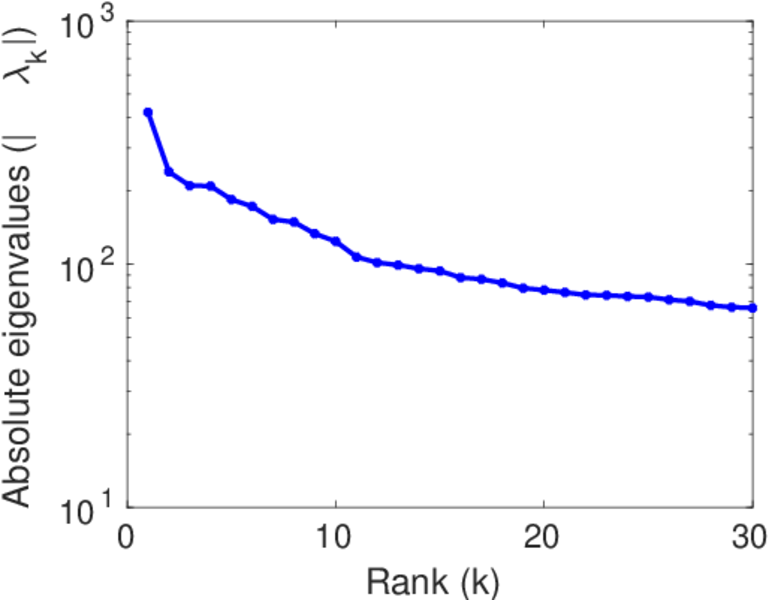
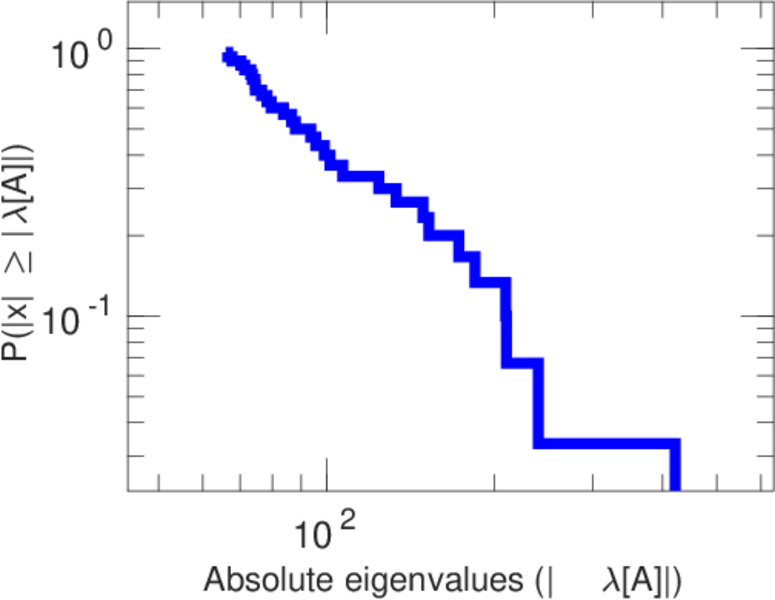
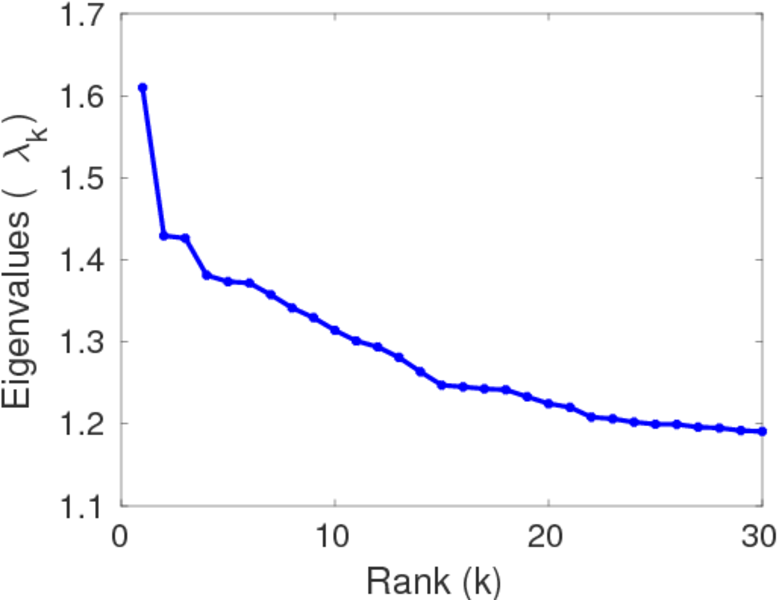
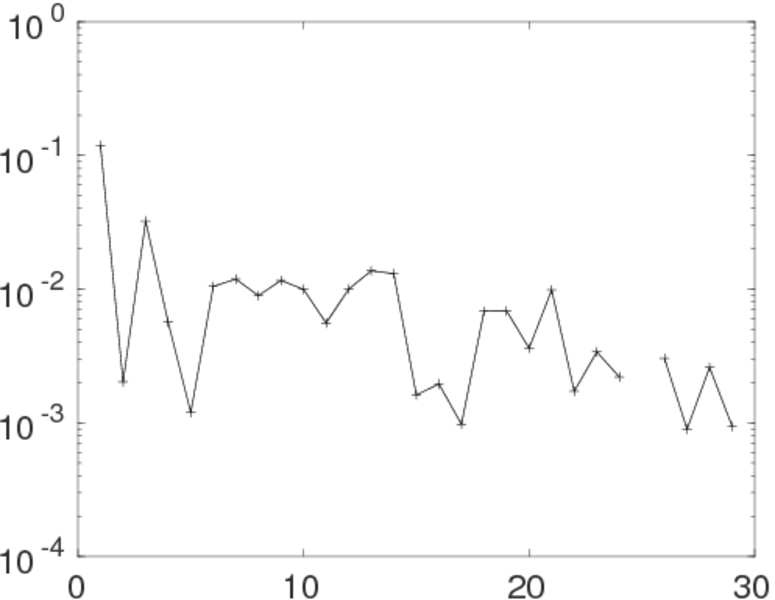
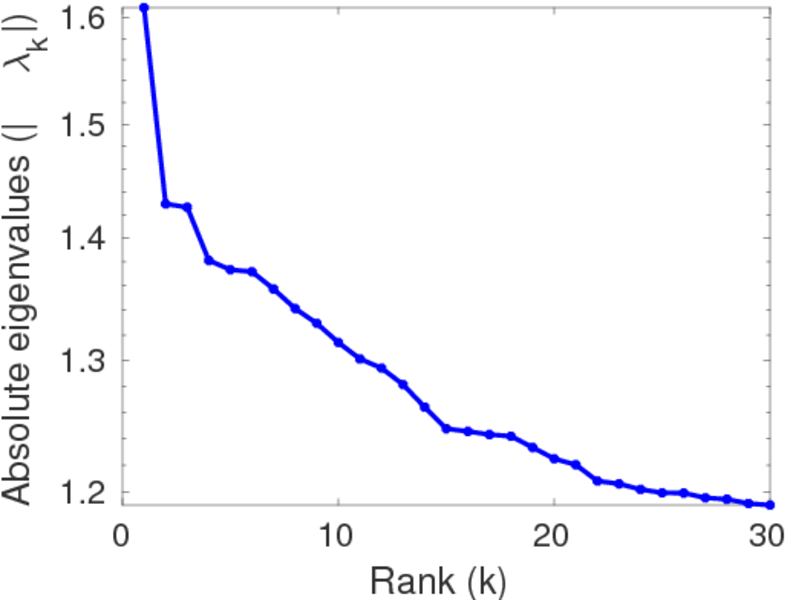
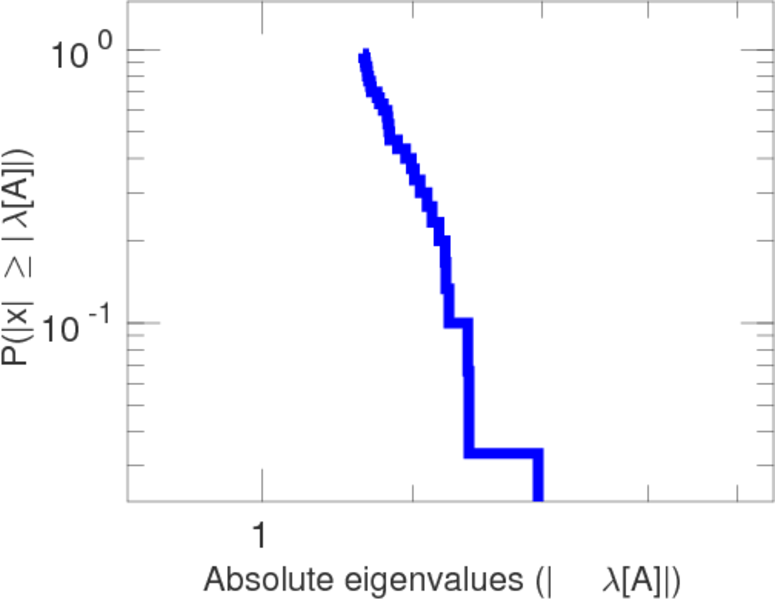
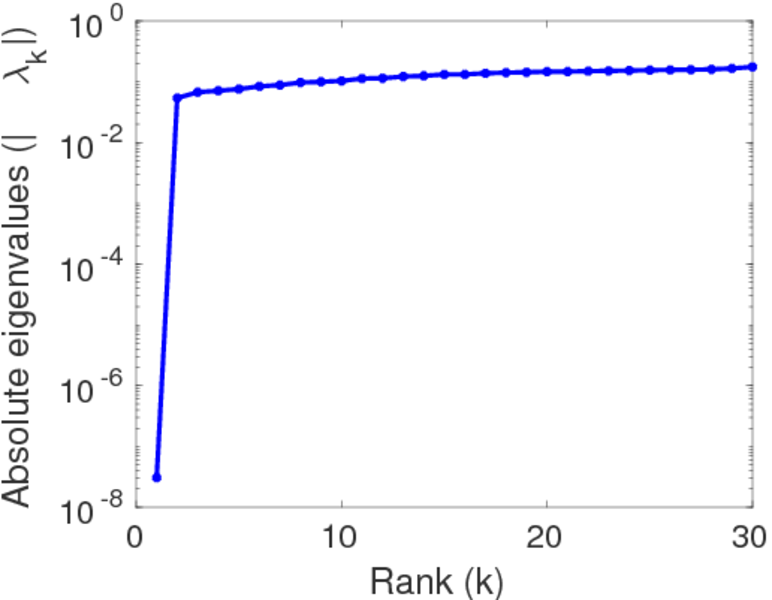
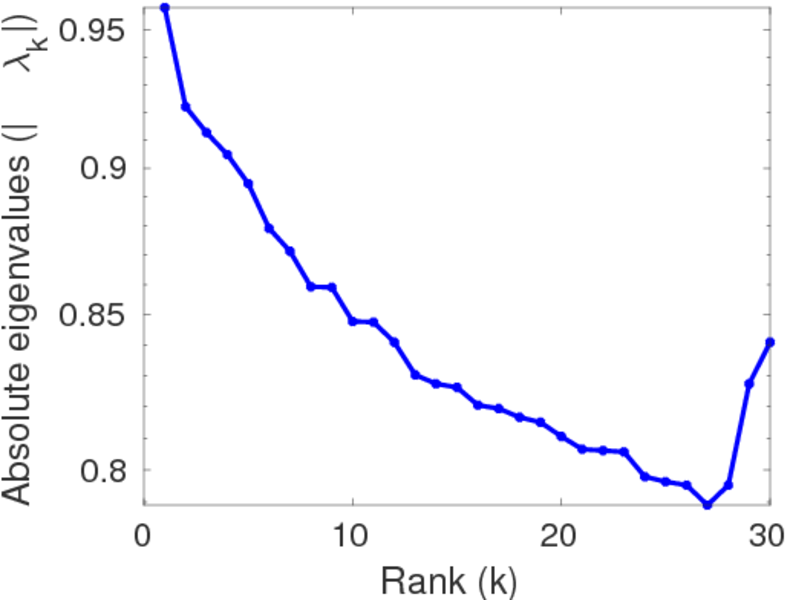
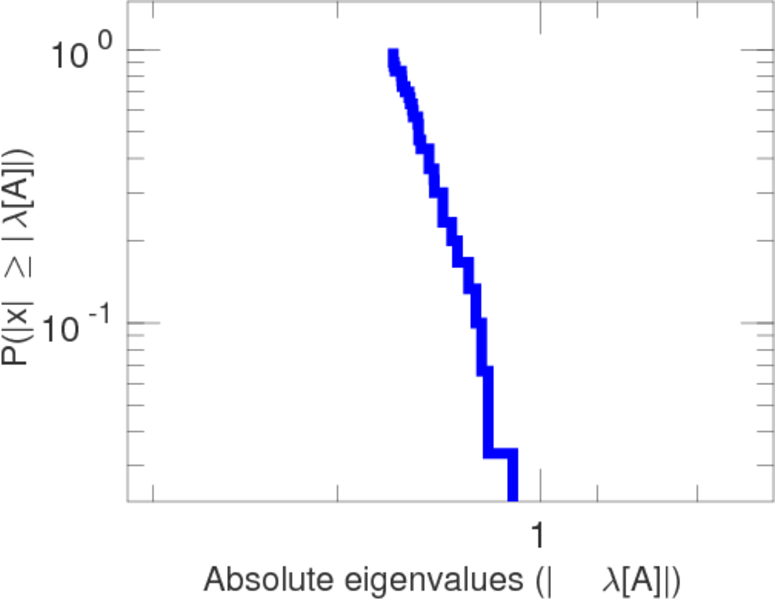
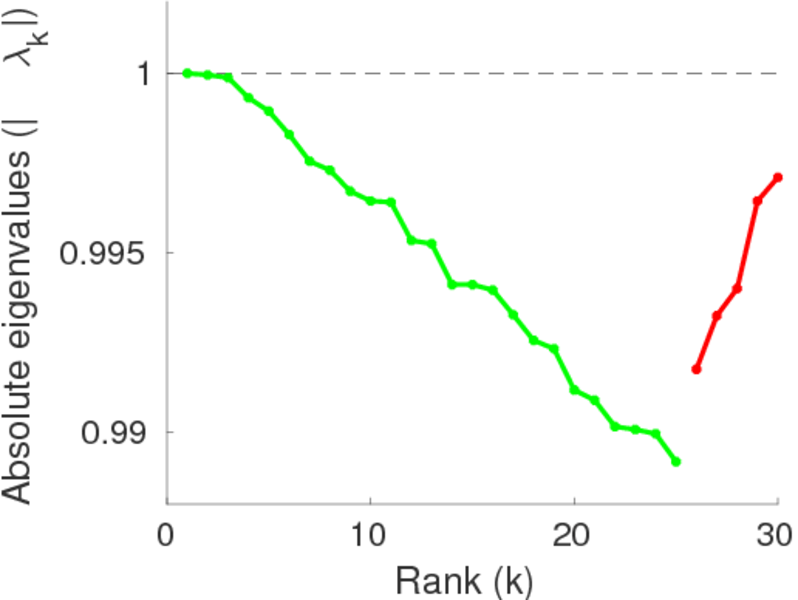
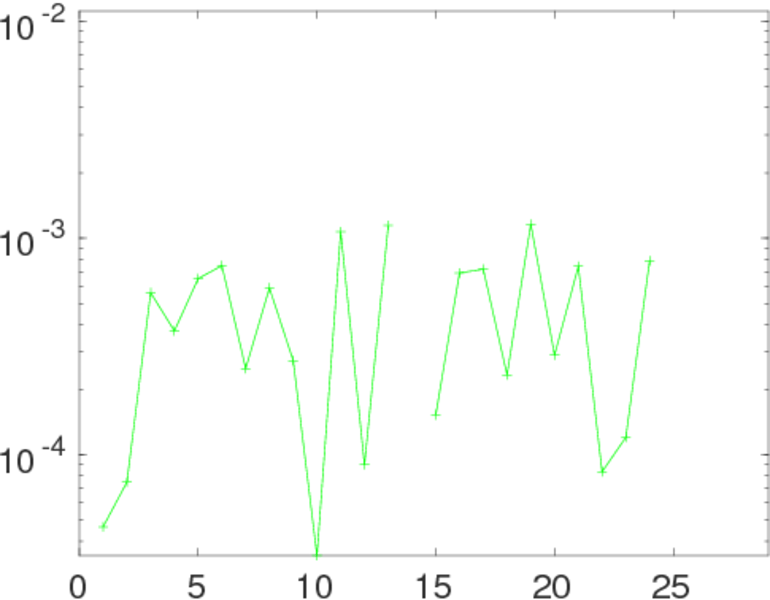
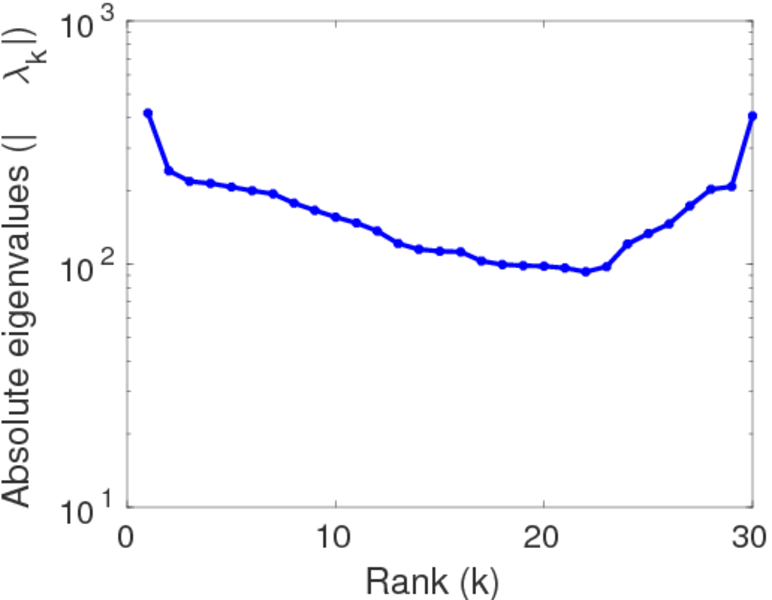
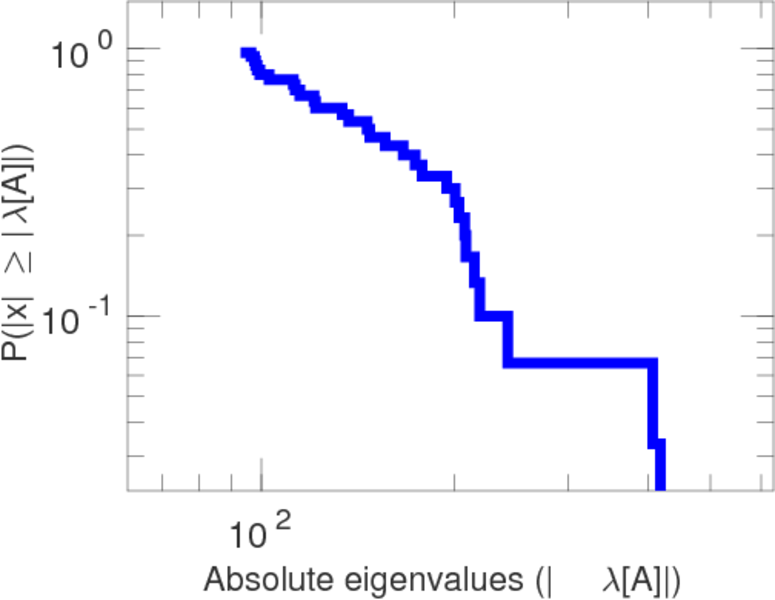
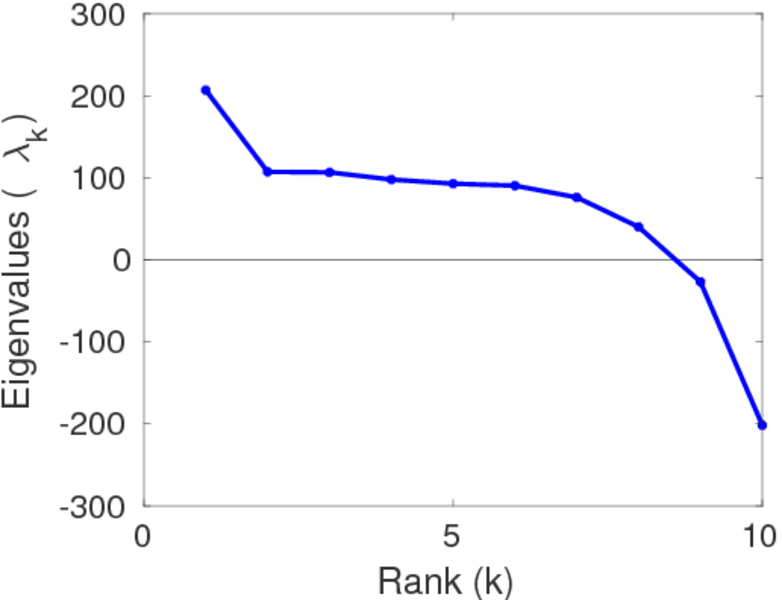
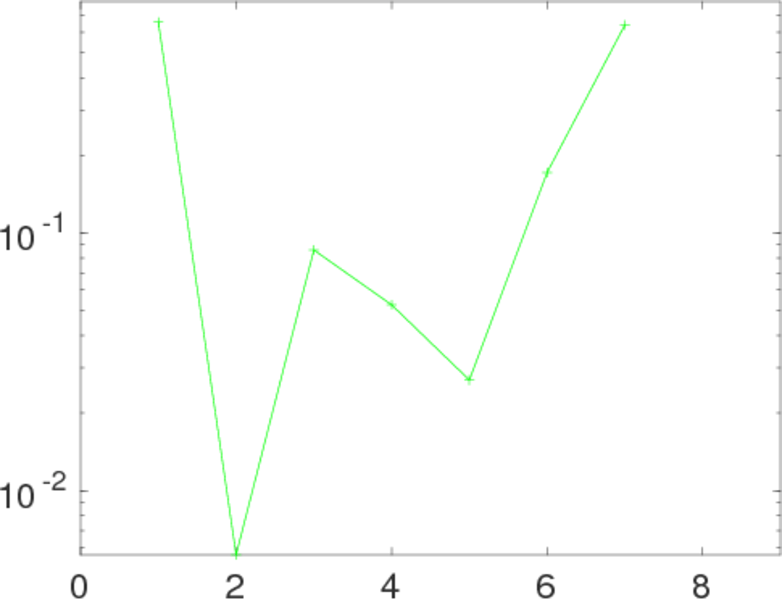
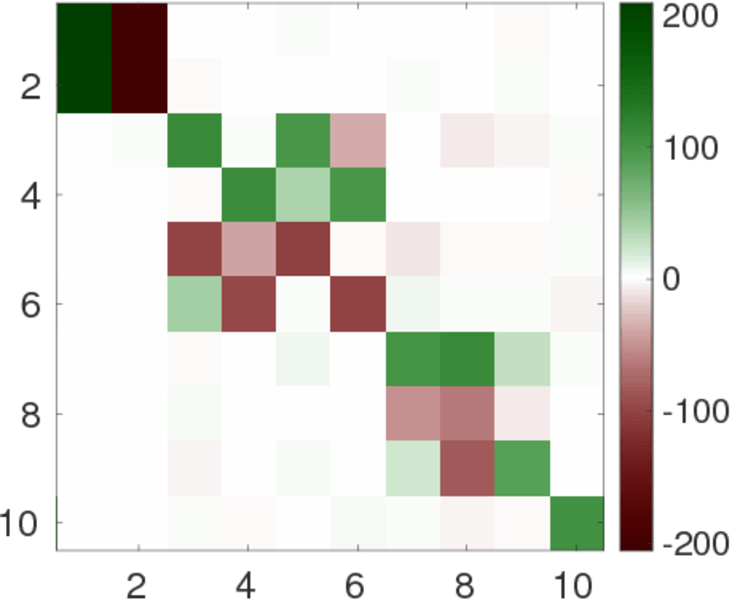
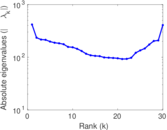
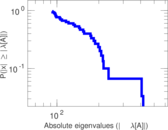
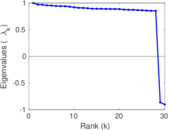
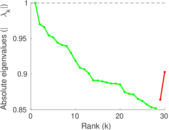
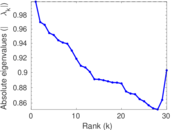
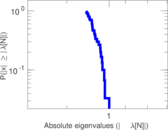
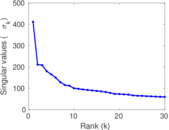
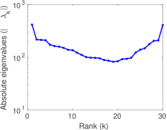
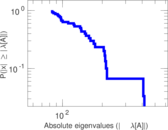
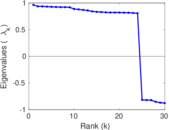
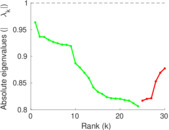
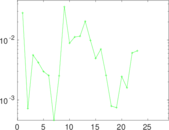
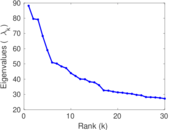
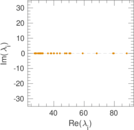
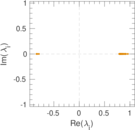
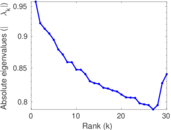
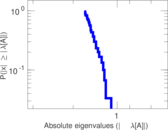
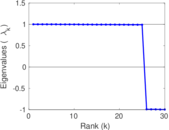
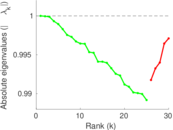
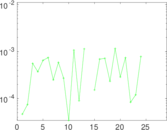
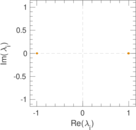
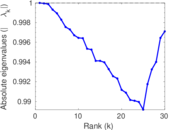
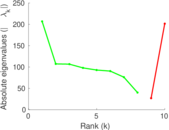
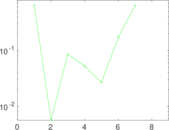
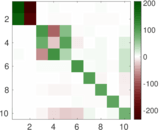
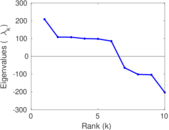
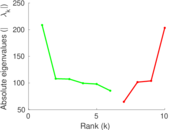
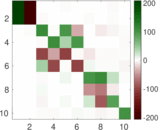
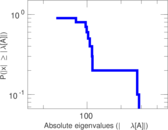
Matrix decompositions plots


Downloads
References
|
[1]
|
Jérôme Kunegis.
KONECT – The Koblenz Network Collection.
In Proc. Int. Conf. on World Wide Web Companion, pages
1343–1350, 2013.
[ http ]
|
 KONECT ‣ Networks ‣
Buy Me a Coffee
KONECT ‣ Networks ‣
Buy Me a Coffee