Wikipedia links (ba)
This network consists of the wikilinks of the Wikipedia in the Bashkir language
(ba). Nodes are Wikipedia articles, and directed edges are wikilinks, i.e.,
hyperlinks within one wiki. In the wiki source, these are indicated with
[[double brackets]]. Only pages in the article namespace are included.
Metadata
Statistics
| Size | n = | 52,560
|
| Volume | m = | 1,241,806
|
| Wedge count | s = | 1,919,238,052
|
| Claw count | z = | 11,524,880,566,464
|
| Cross count | x = | 64,370,238,635,795,296
|
| Triangle count | t = | 26,349,922
|
| Square count | q = | 10,521,933,206
|
| 4-Tour count | T4 = | 89,038,016,864
|
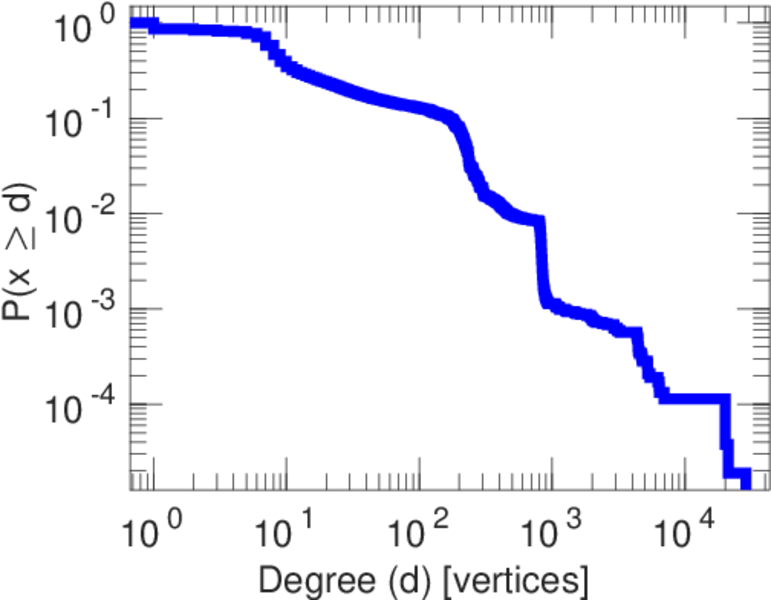
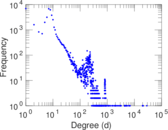
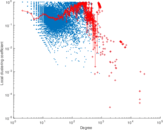
| Maximum degree | dmax = | 28,739
|
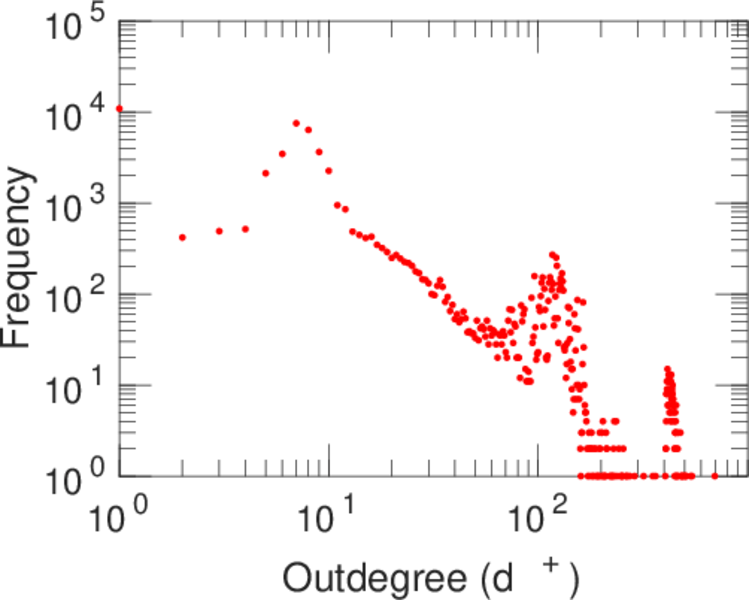
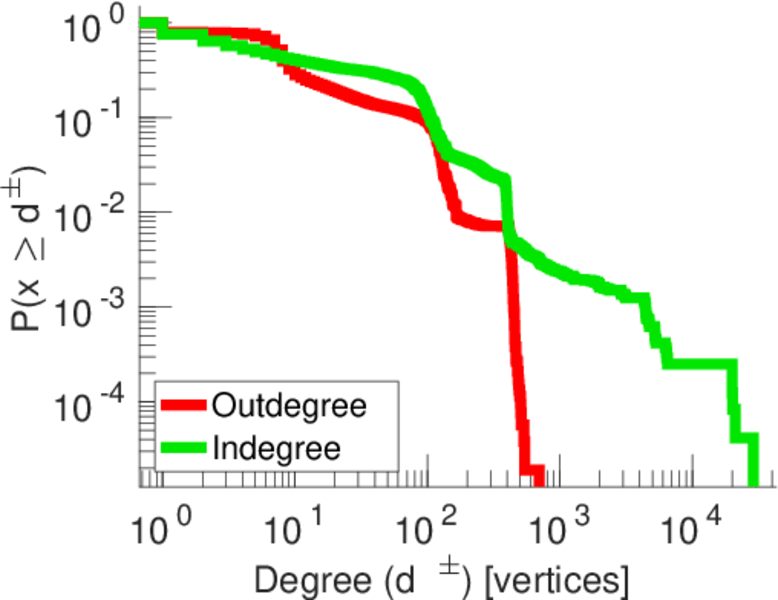
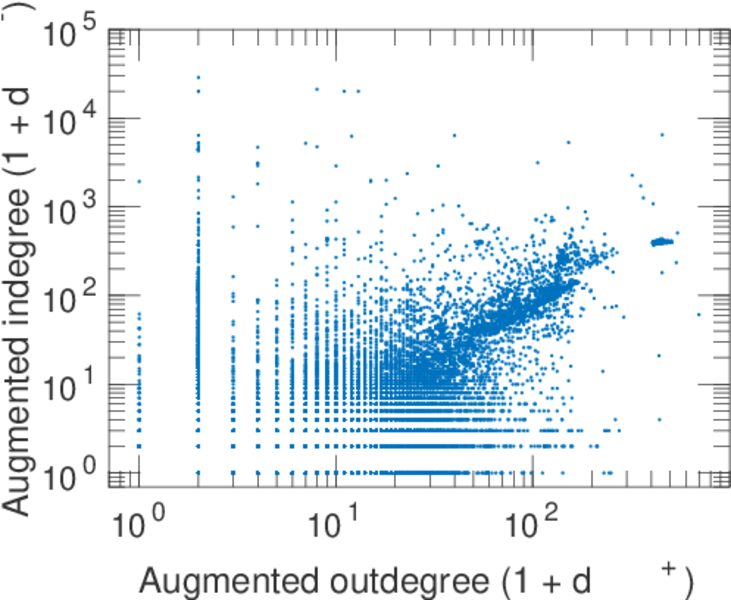
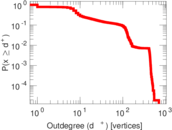
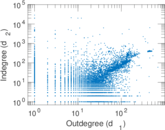
| Maximum outdegree | d+max = | 698
|
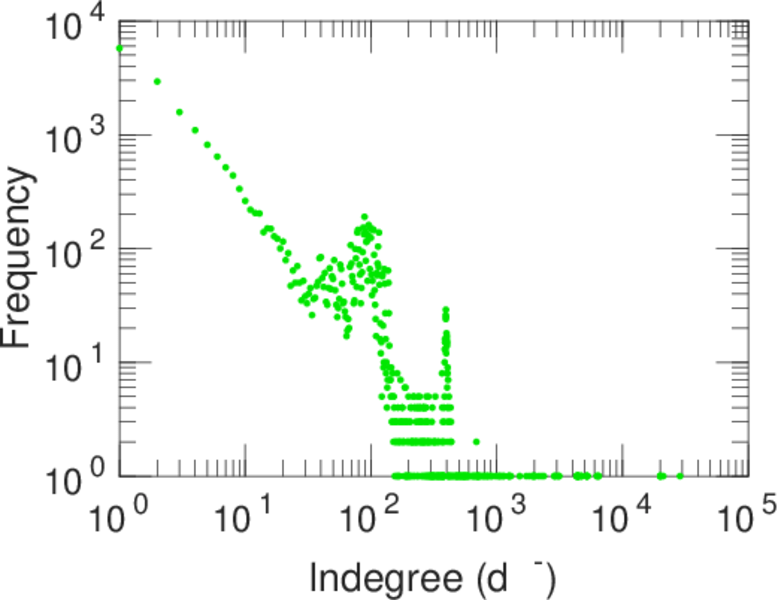
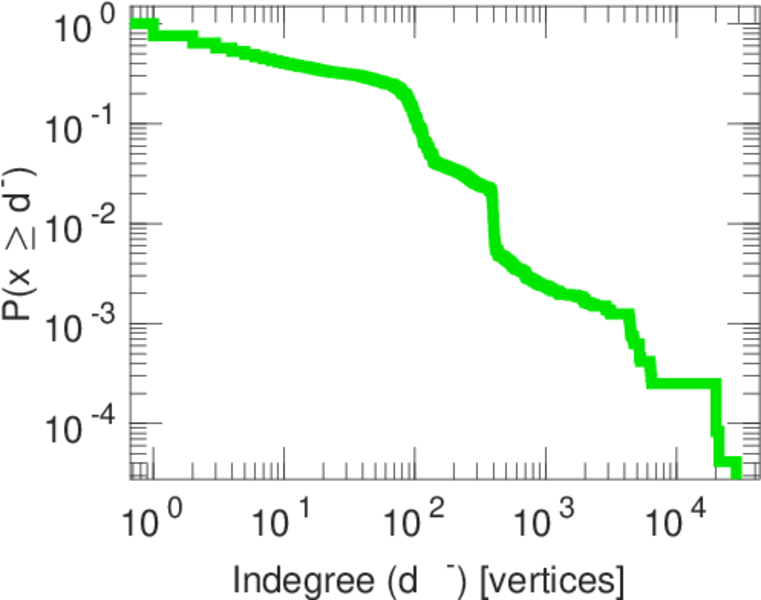
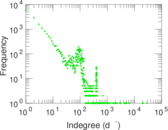
| Maximum indegree | d−max = | 28,738
|
| Average degree | d = | 47.252 9
|
| Fill | p = | 0.000 449 514
|
| Size of LCC | N = | 52,533
|
| Size of LSCC | Ns = | 18,559
|
| Relative size of LSCC | Nrs = | 0.353 101
|
| Diameter | δ = | 8
|
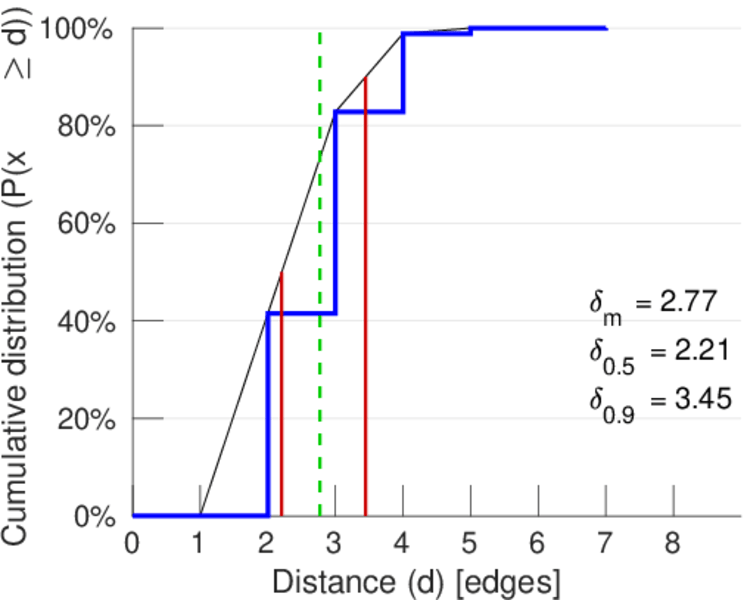
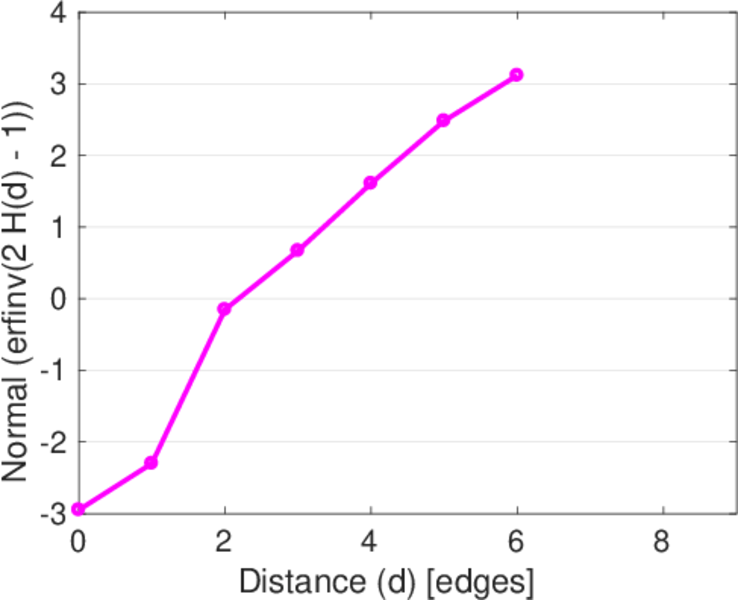
| 50-Percentile effective diameter | δ0.5 = | 2.206 38
|
| 90-Percentile effective diameter | δ0.9 = | 3.448 05
|
| Median distance | δM = | 3
|
| Mean distance | δm = | 2.768 29
|
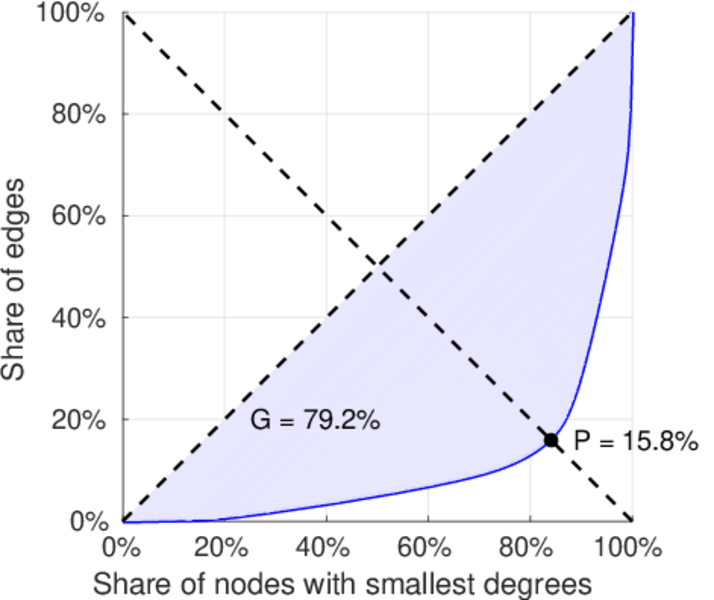
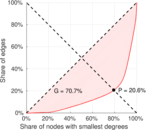
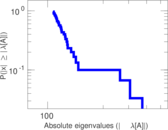
| Gini coefficient | G = | 0.792 162
|
| Balanced inequality ratio | P = | 0.157 500
|
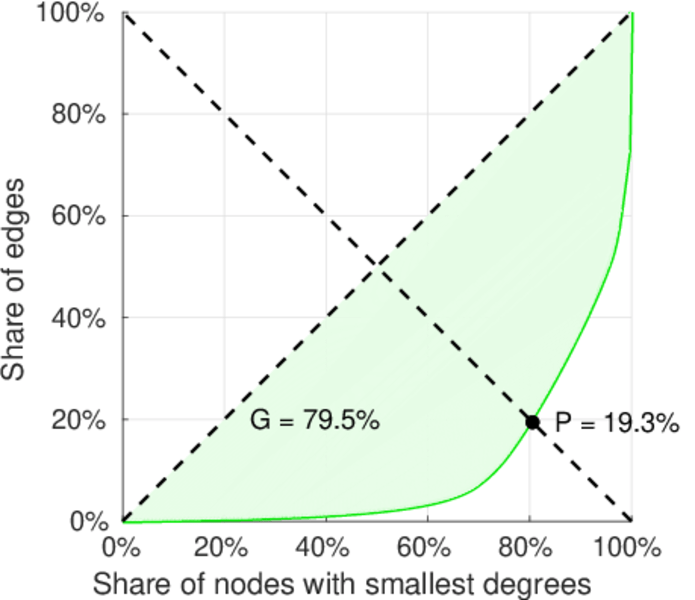
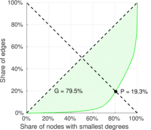
| Outdegree balanced inequality ratio | P+ = | 0.205 866
|
| Indegree balanced inequality ratio | P− = | 0.192 852
|
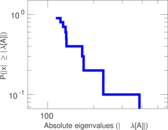
| Tail power law exponent | γt = | 1.811 00
|
| Degree assortativity | ρ = | −0.133 977
|
| Degree assortativity p-value | pρ = | 0.000 00
|
| In/outdegree correlation | ρ± = | +0.692 309
|
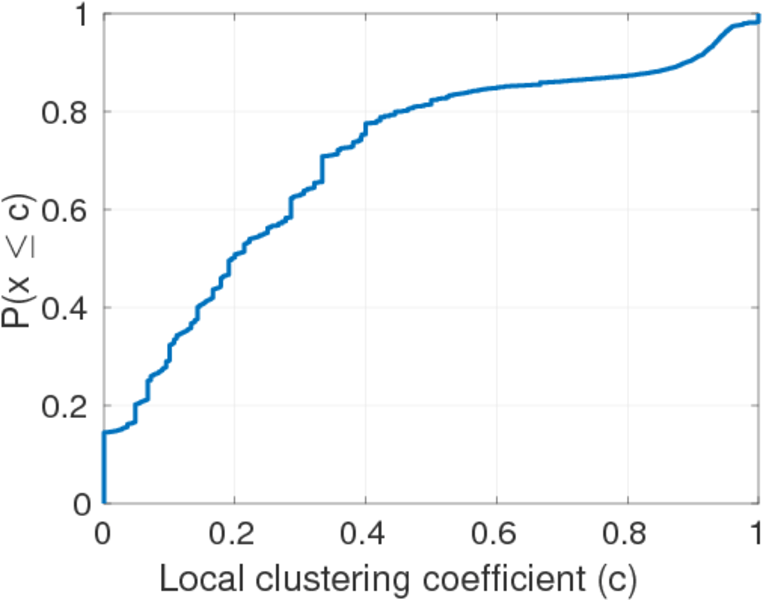
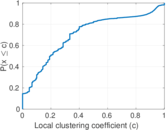
| Clustering coefficient | c = | 0.041 188 1
|
| Directed clustering coefficient | c± = | 0.785 640
|
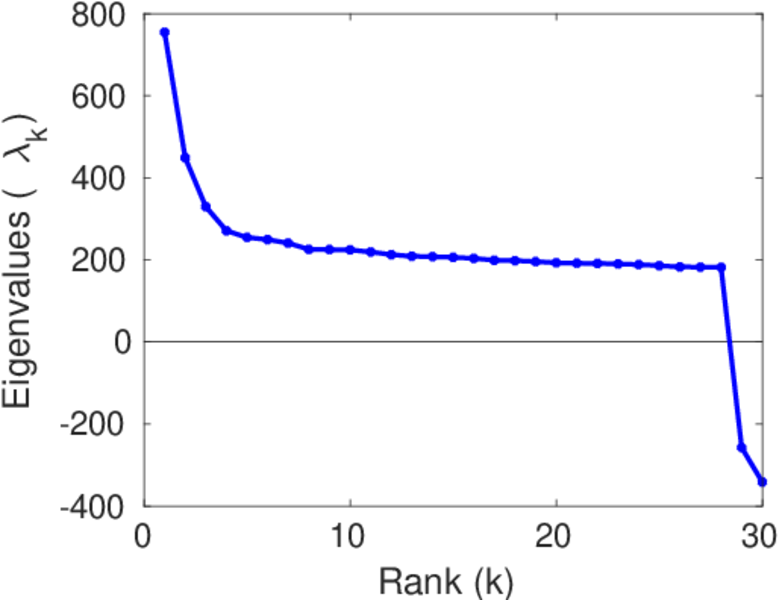
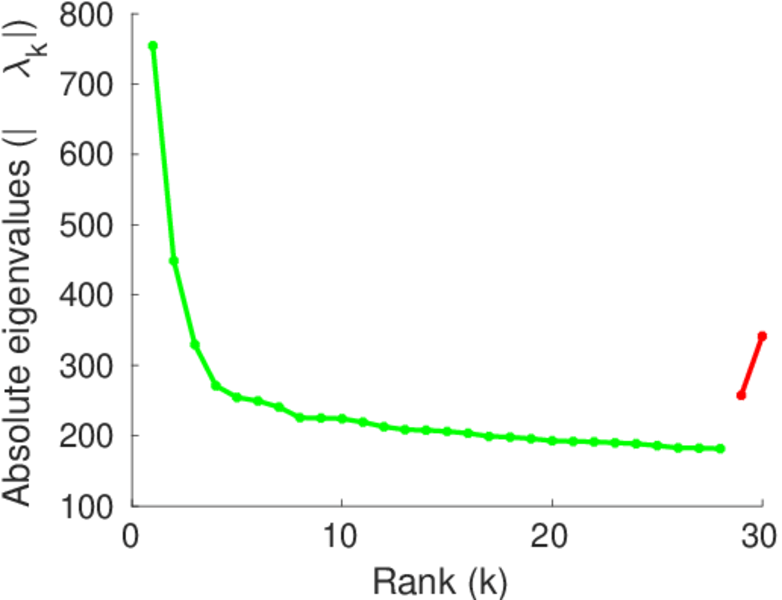
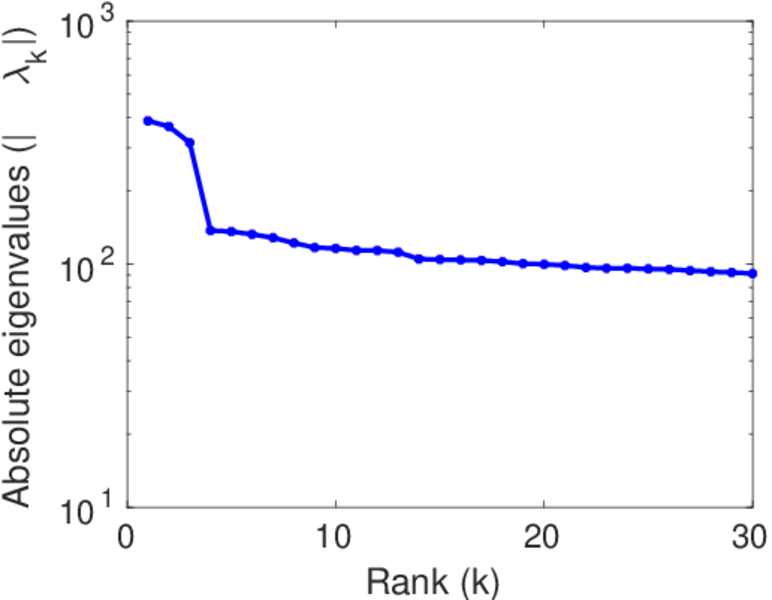
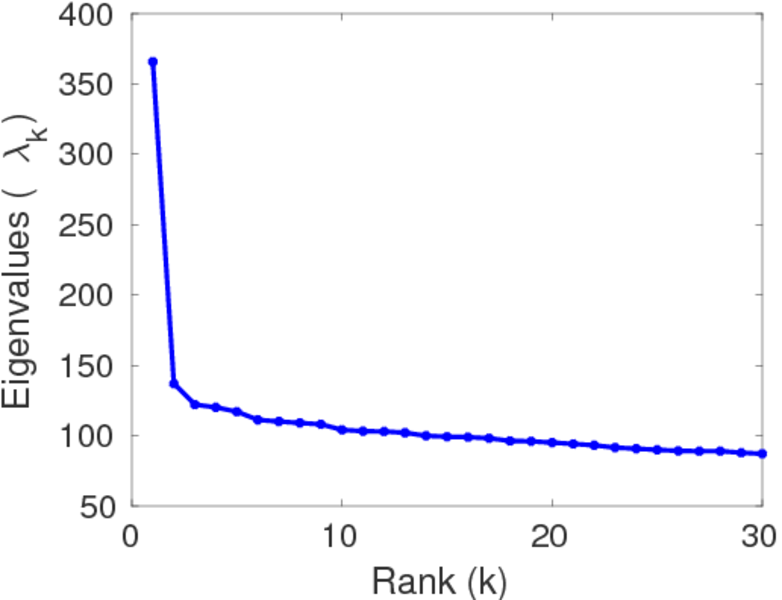
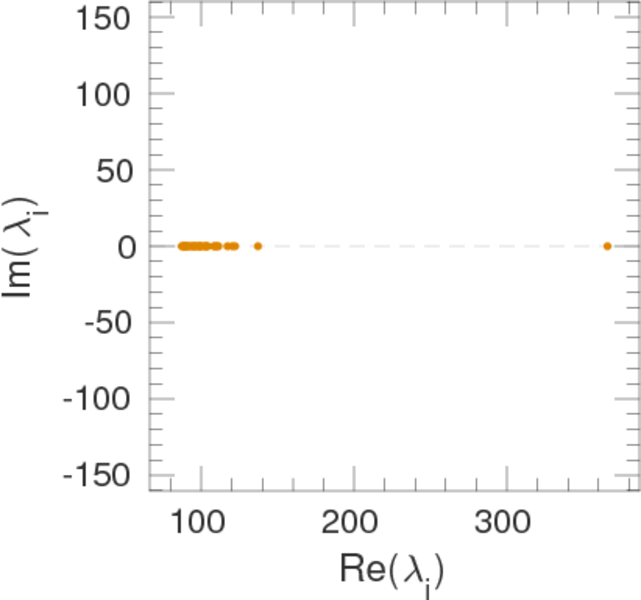
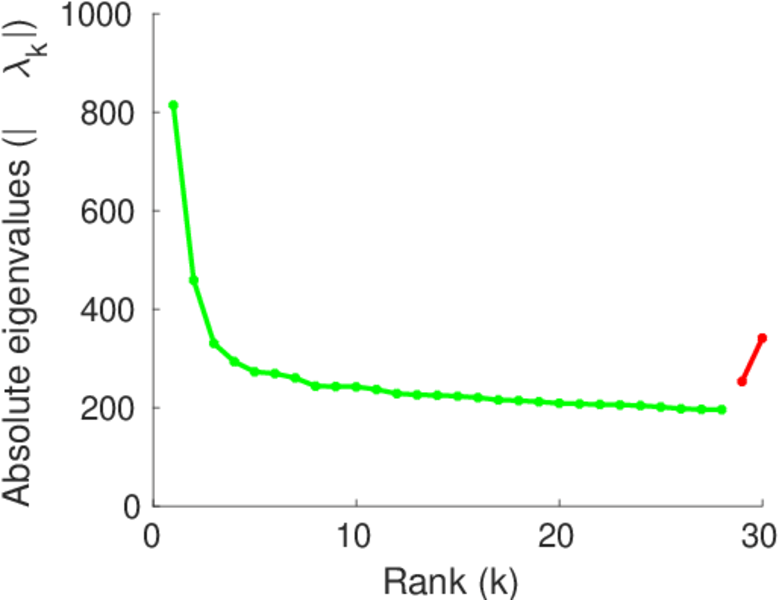
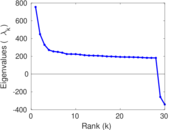
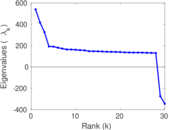
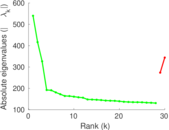
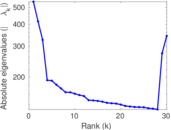
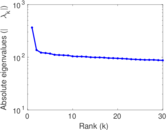
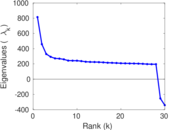
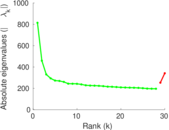
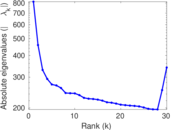
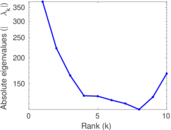
| Spectral norm | α = | 754.459
|
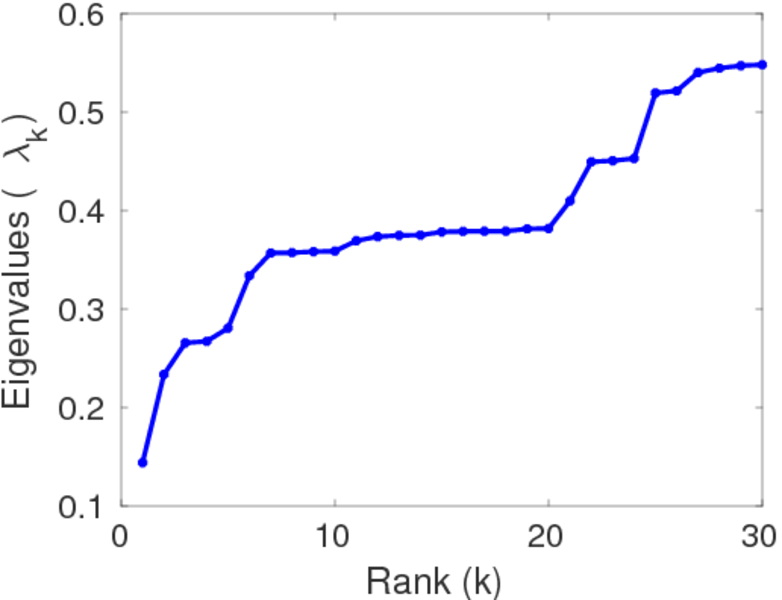
| Algebraic connectivity | a = | 0.144 115
|
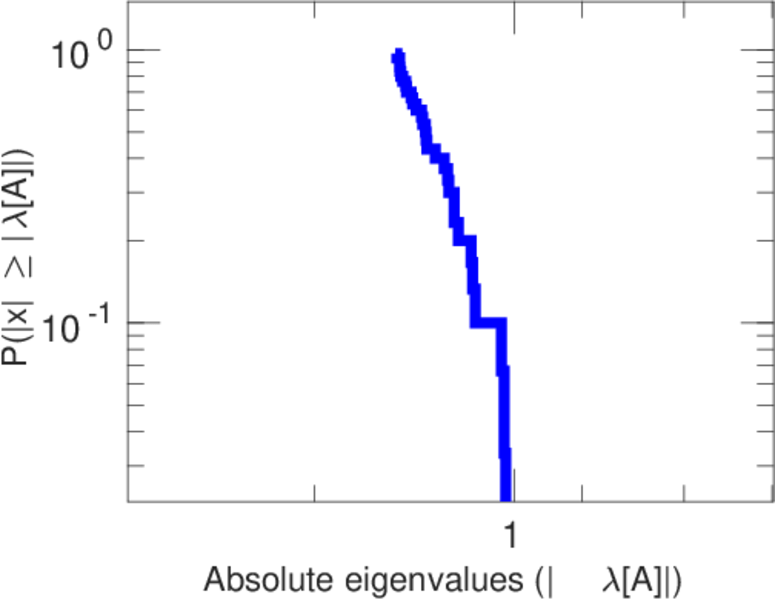
| Spectral separation | |λ1[A] / λ2[A]| = | 1.680 87
|
| Reciprocity | y = | 0.532 757
|
| Non-bipartivity | bA = | 0.547 334
|
| Normalized non-bipartivity | bN = | 0.087 051 1
|
| Spectral bipartite frustration | bK = | 0.001 038 77
|
| Controllability | C = | 30,339
|
| Relative controllability | Cr = | 0.577 226
|
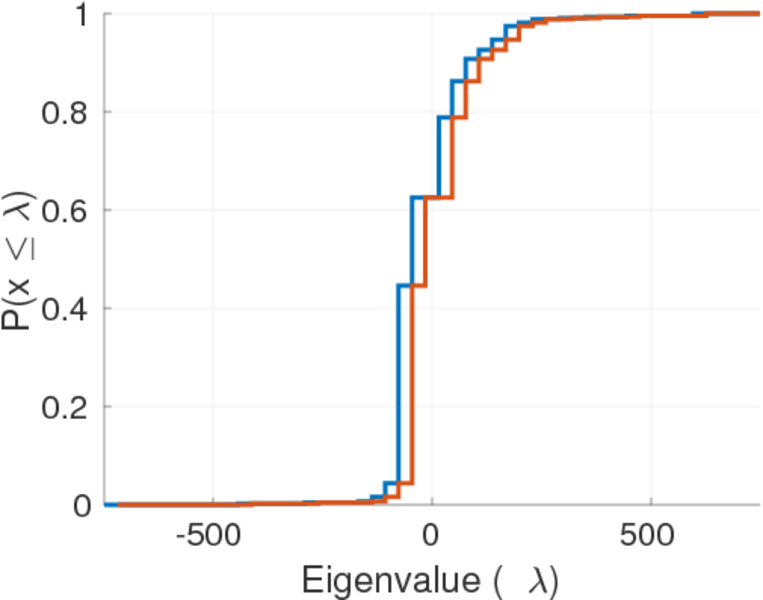
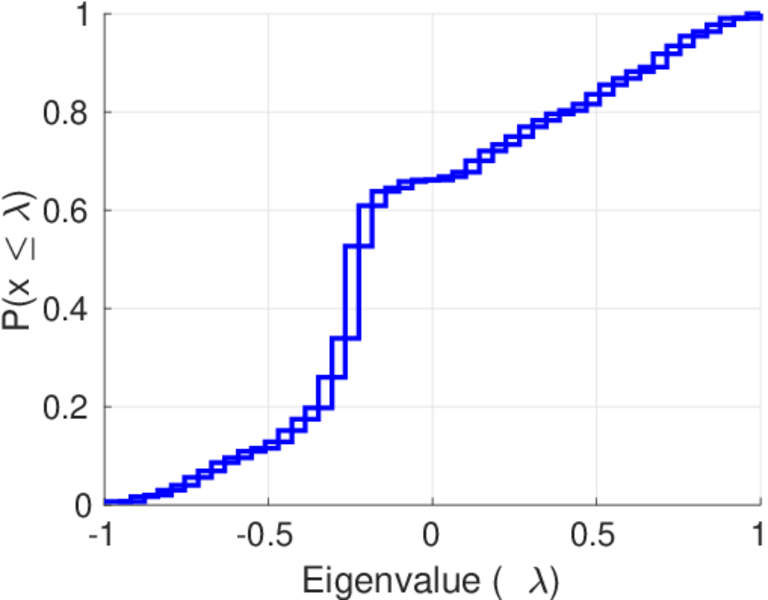
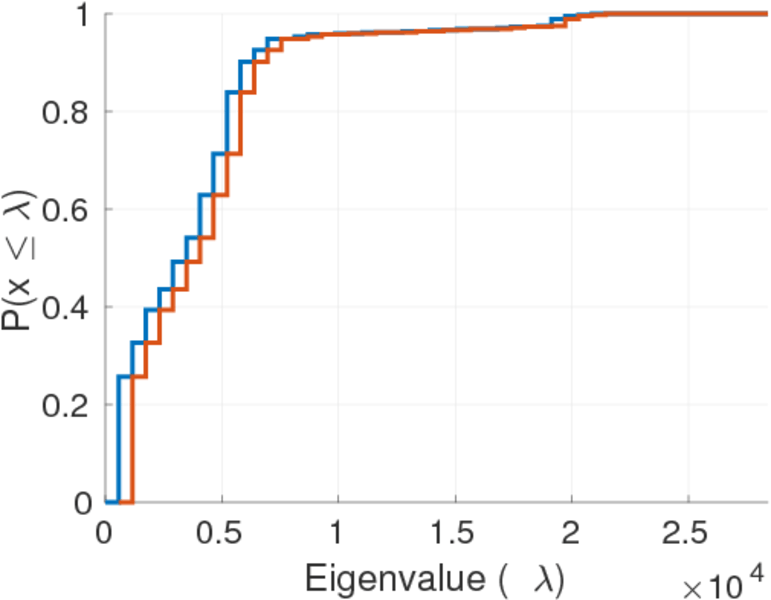
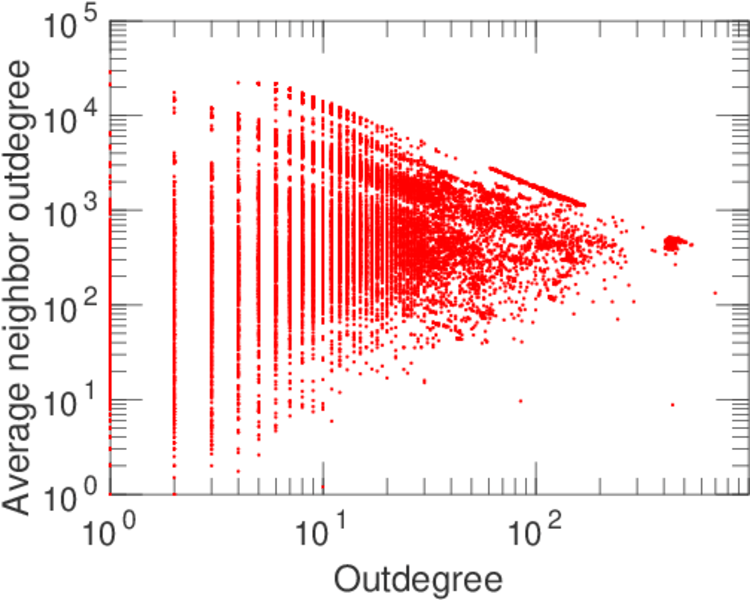
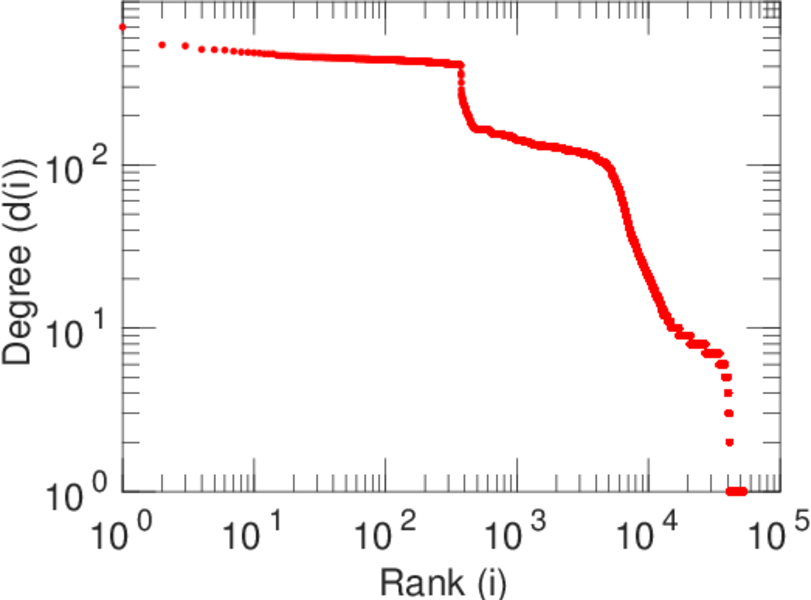
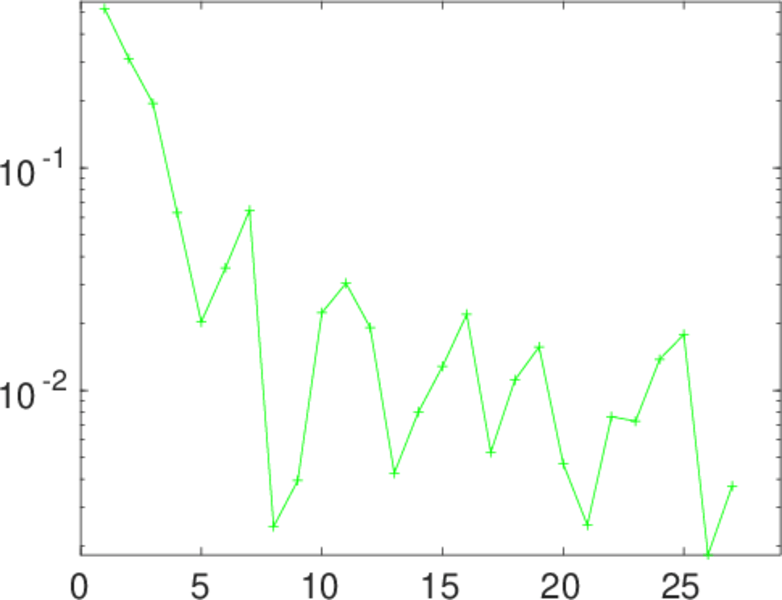
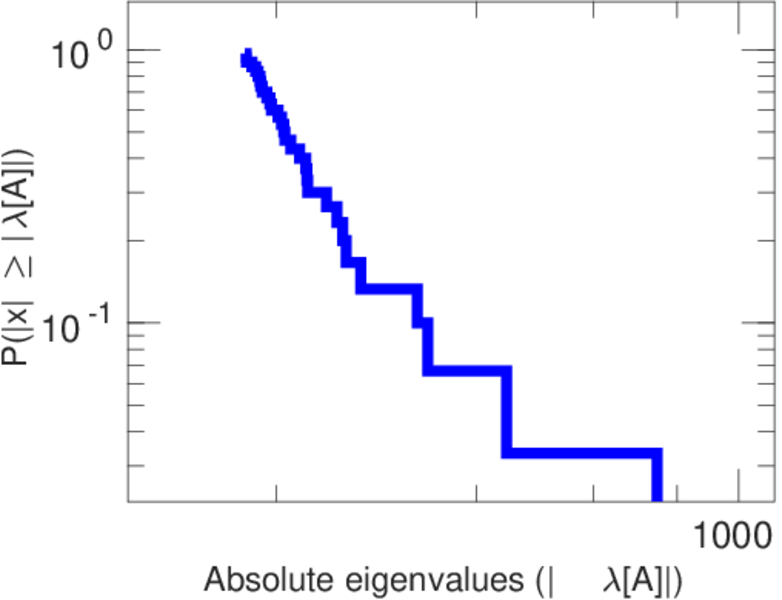
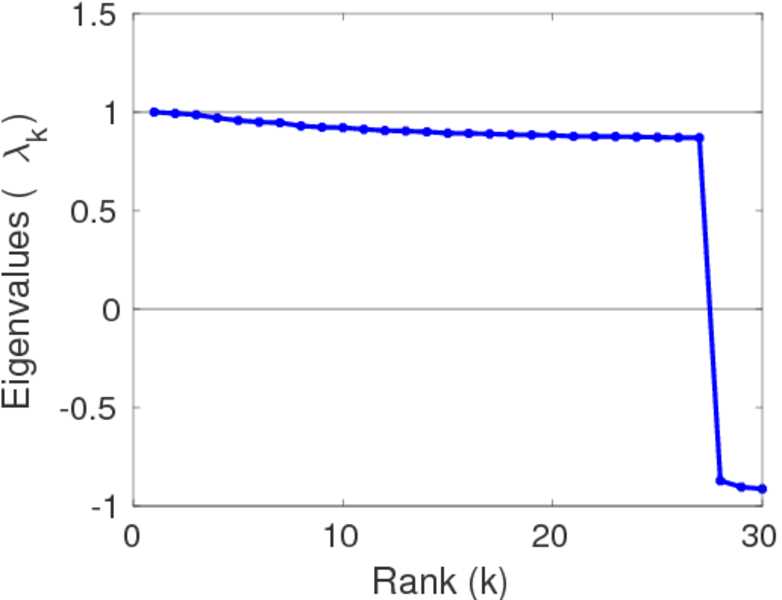
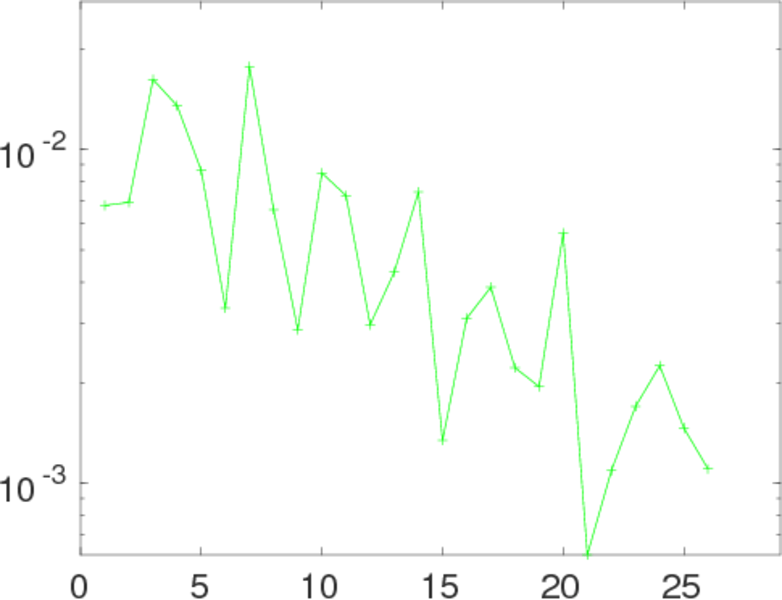
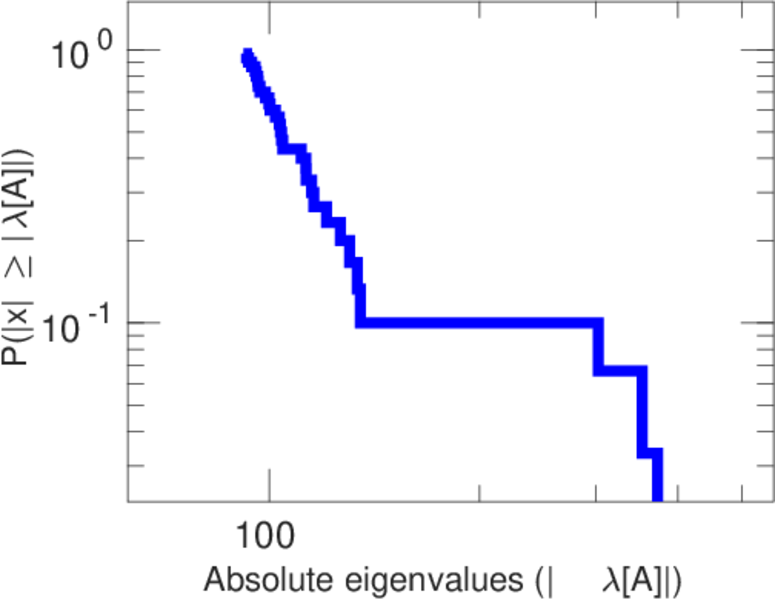
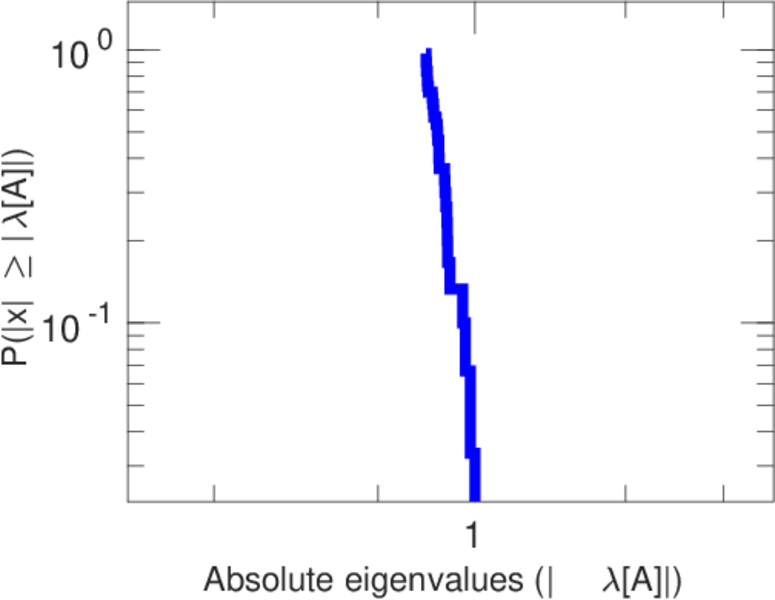
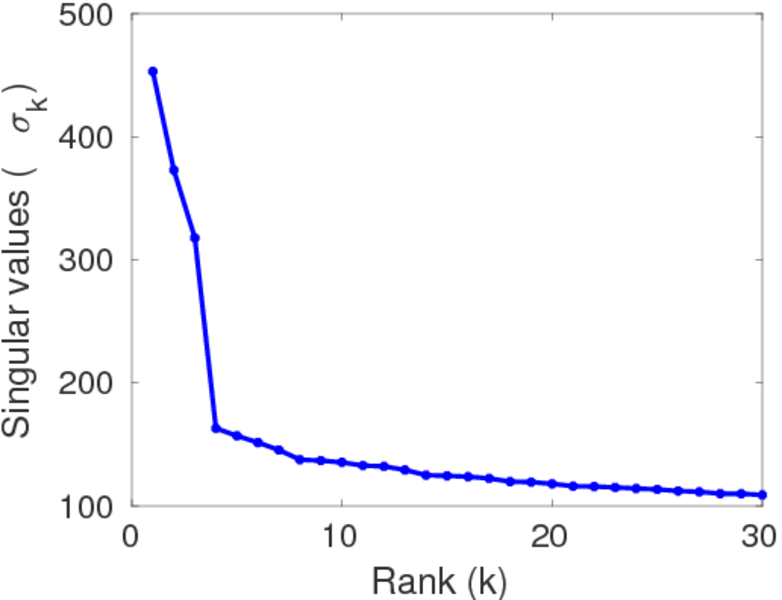
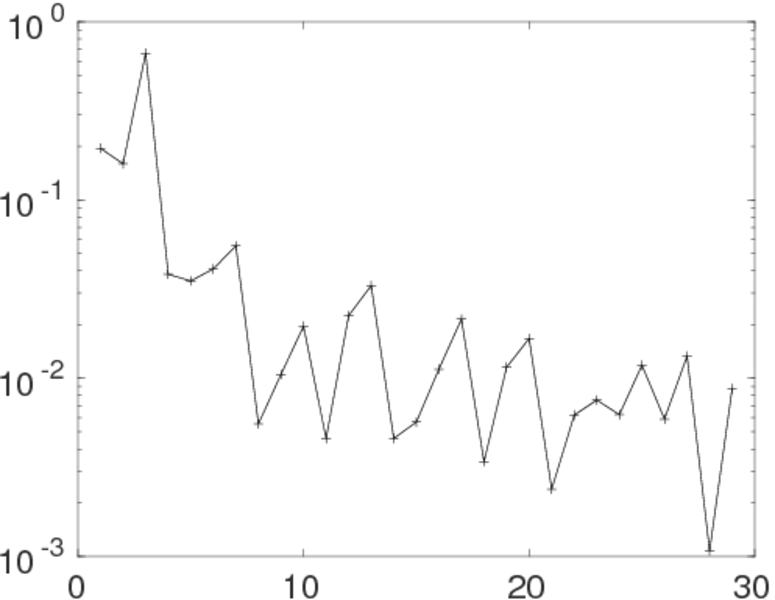
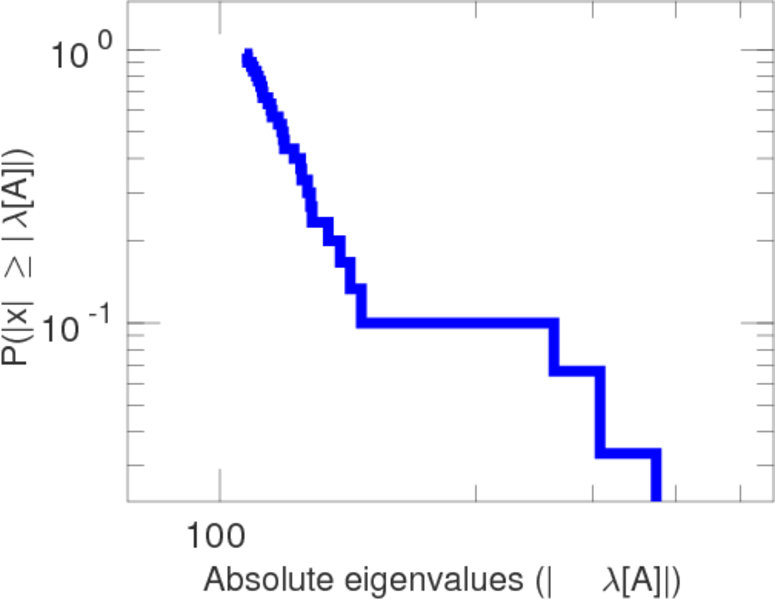
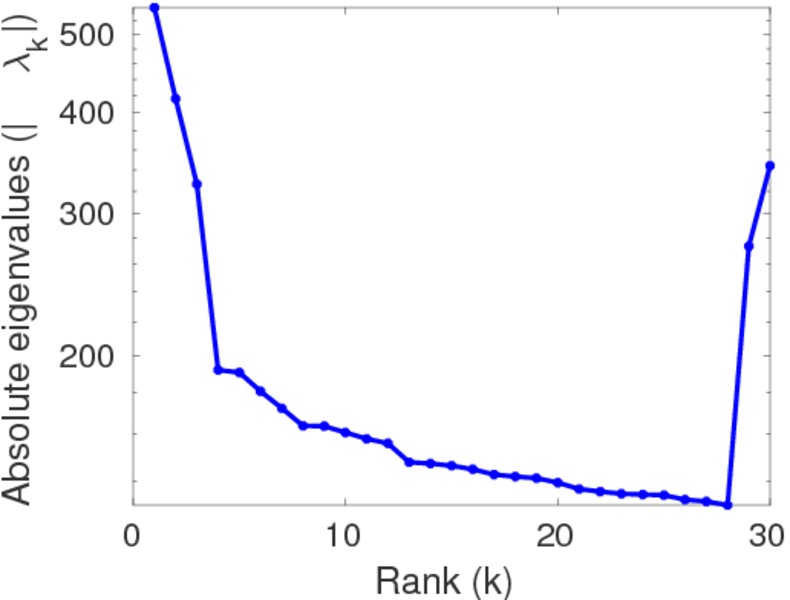
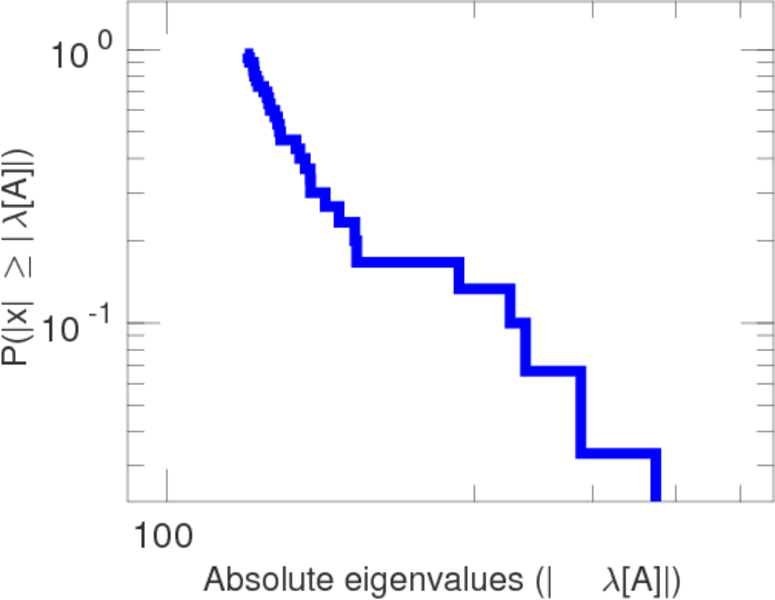
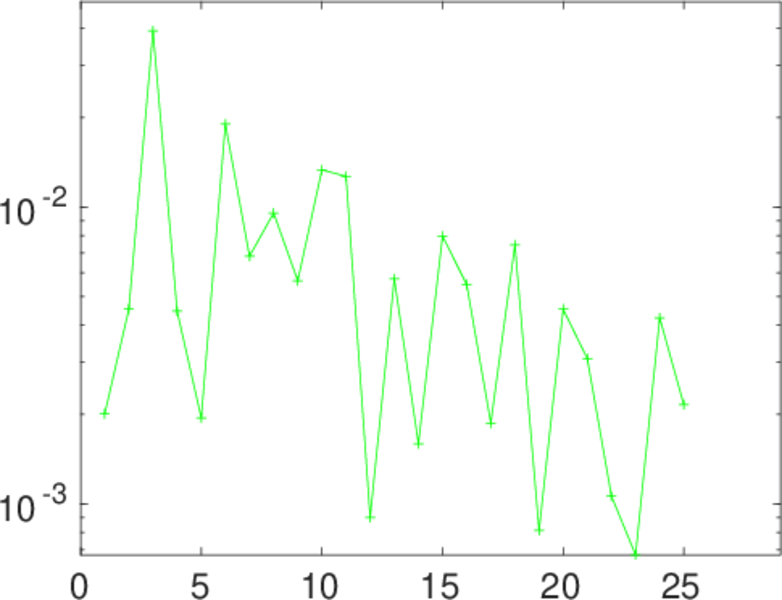
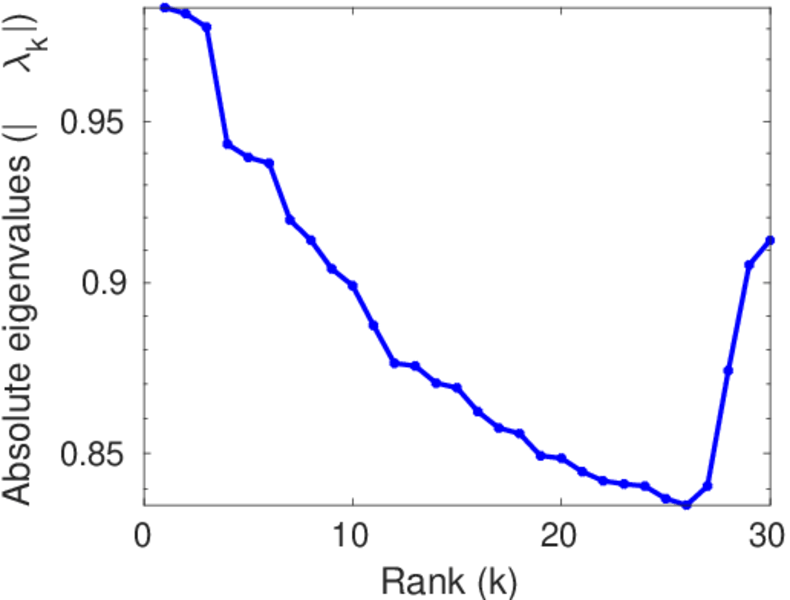
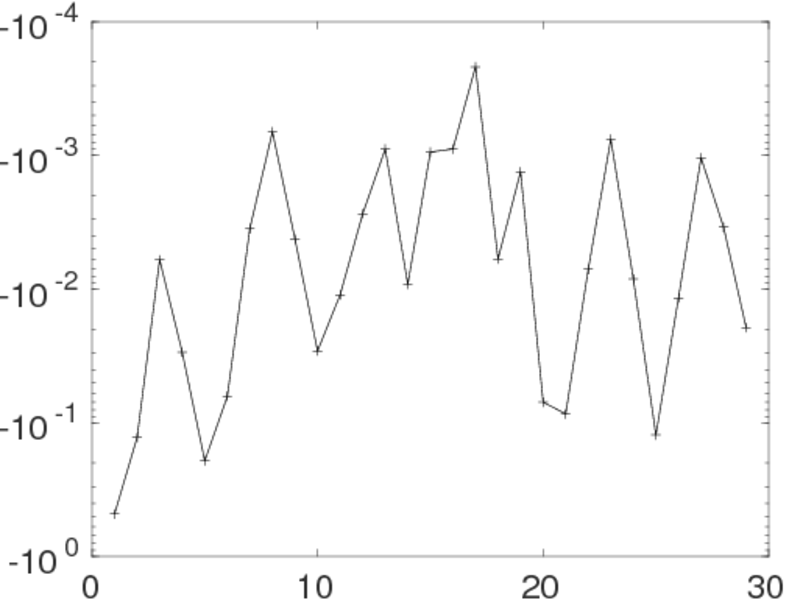
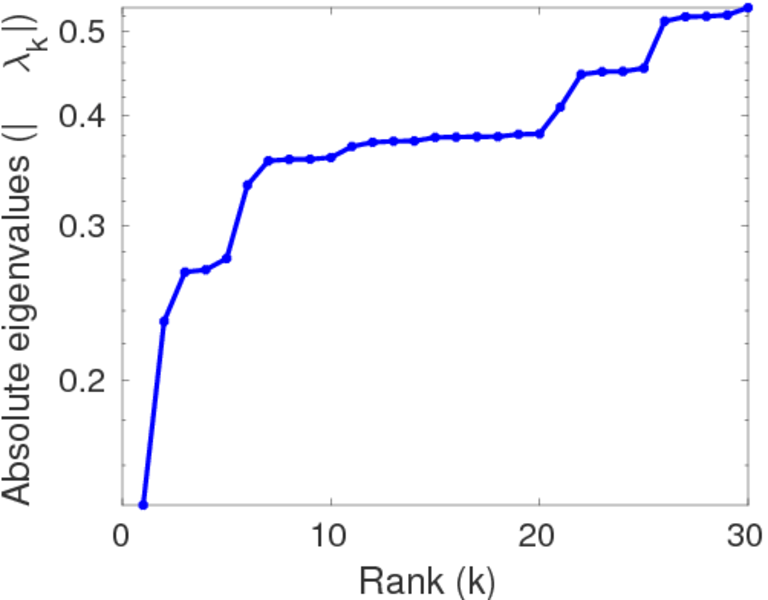
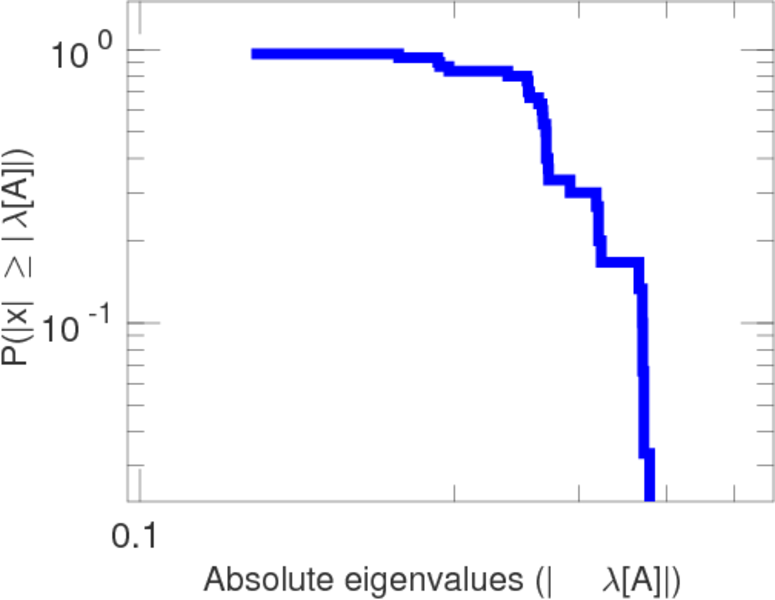
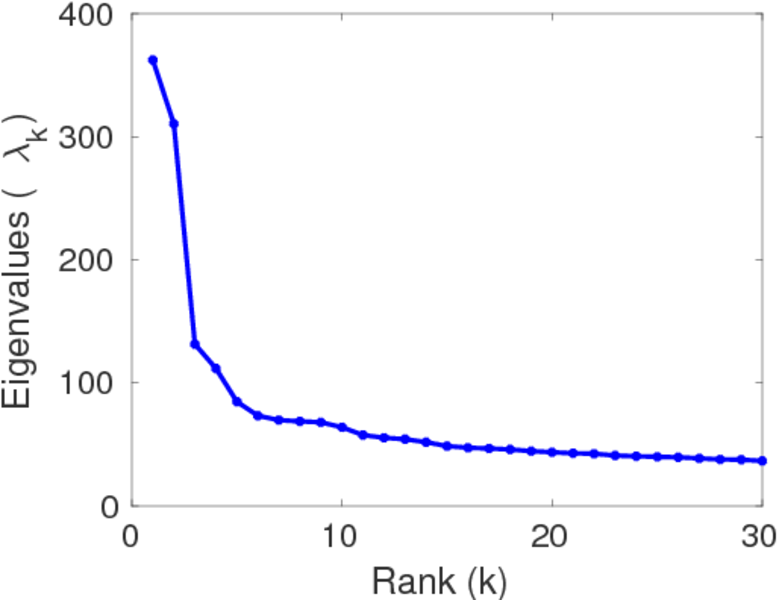
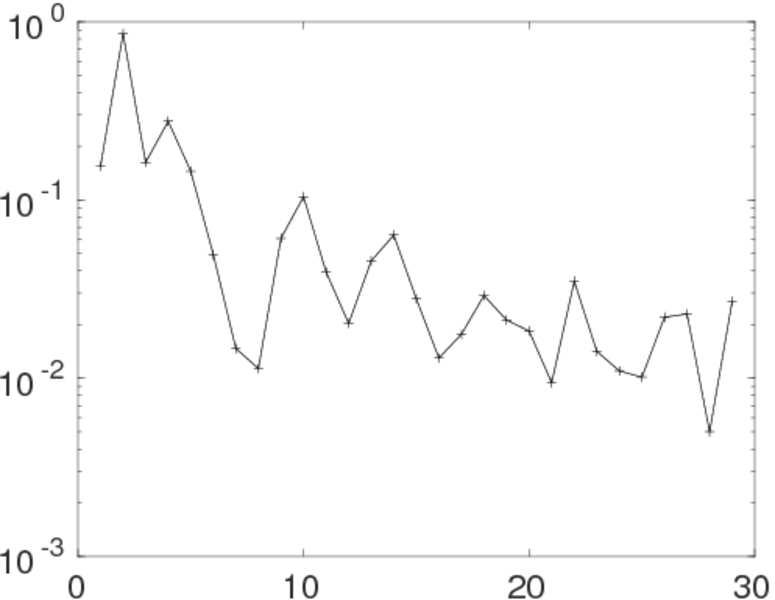
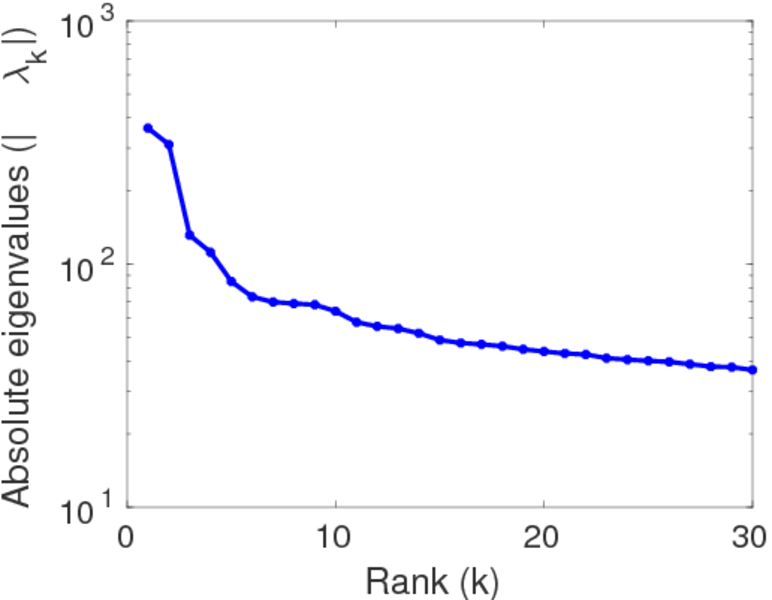
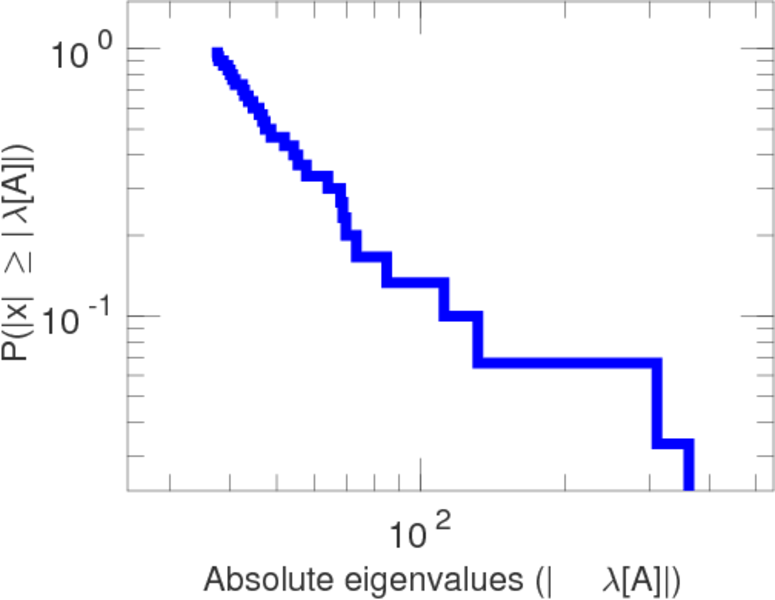
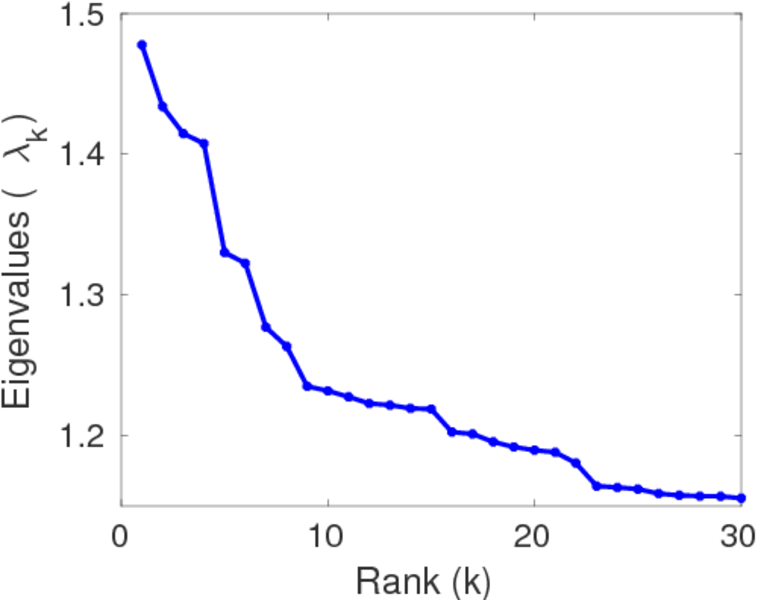
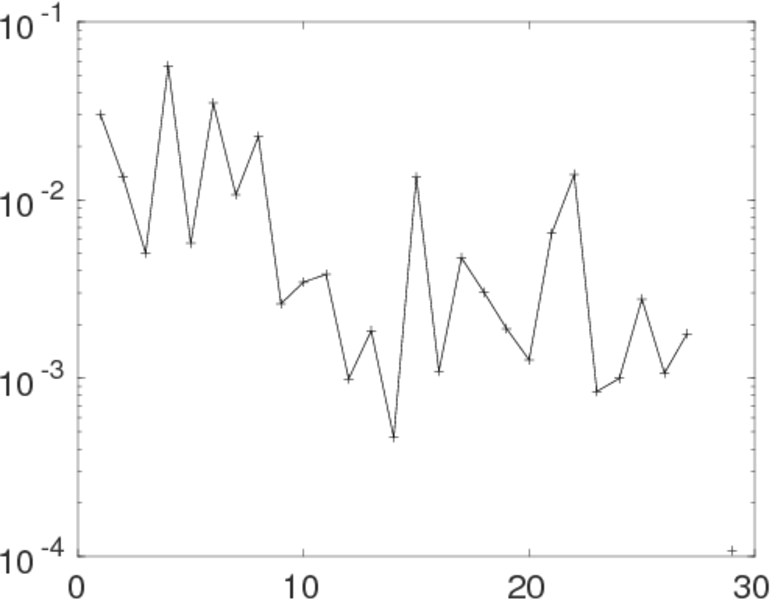
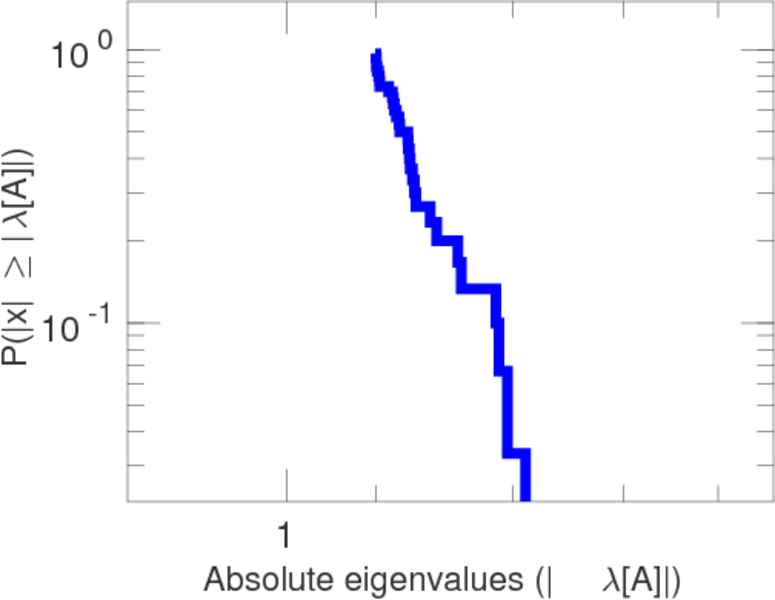
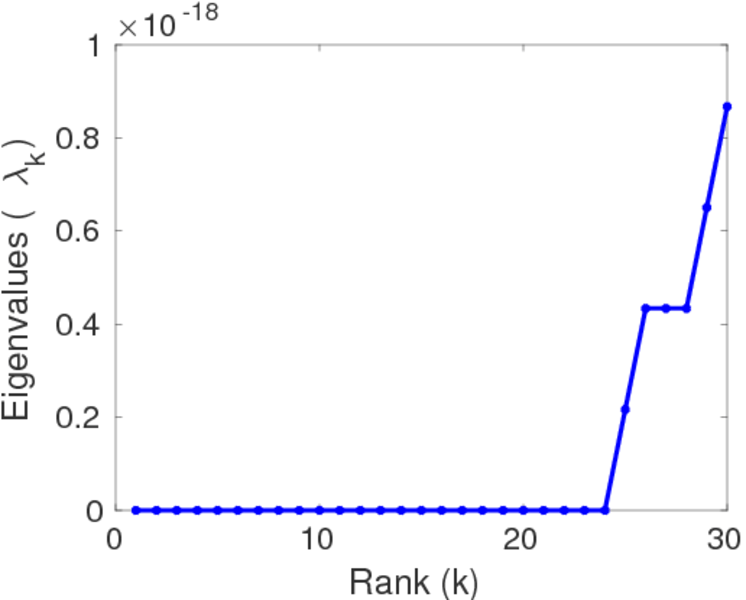
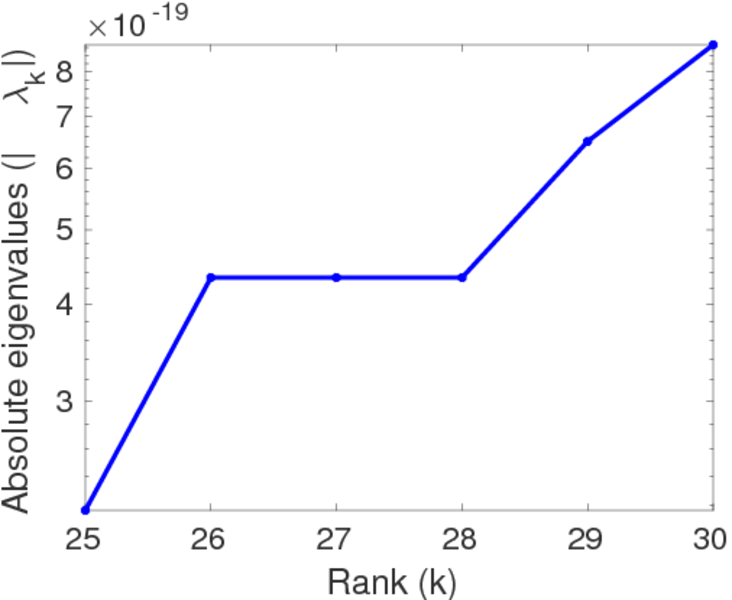
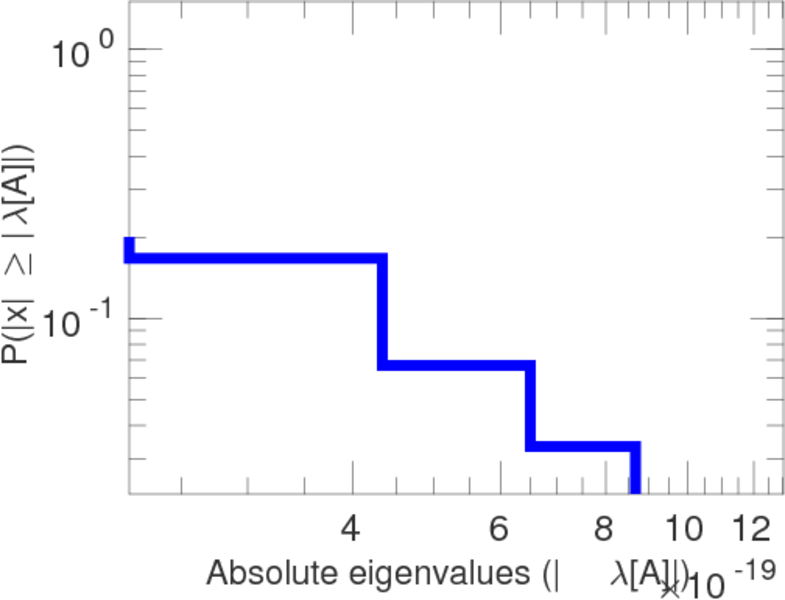
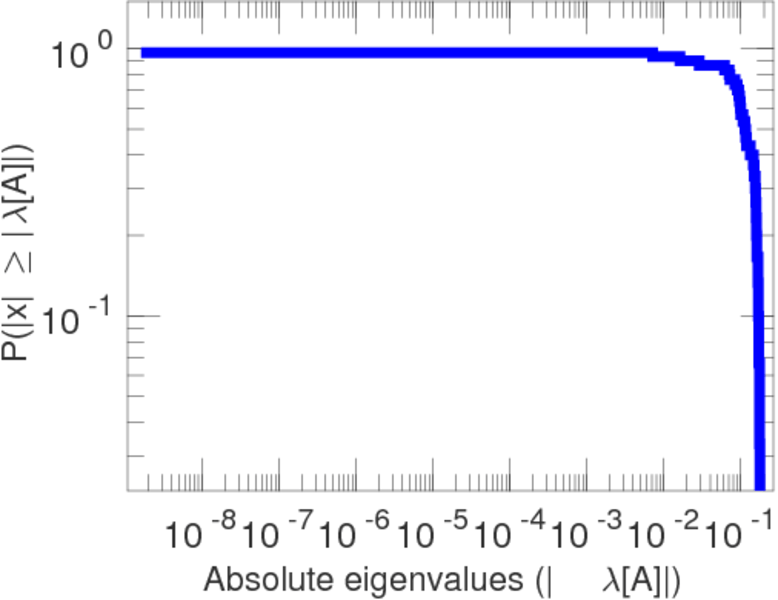
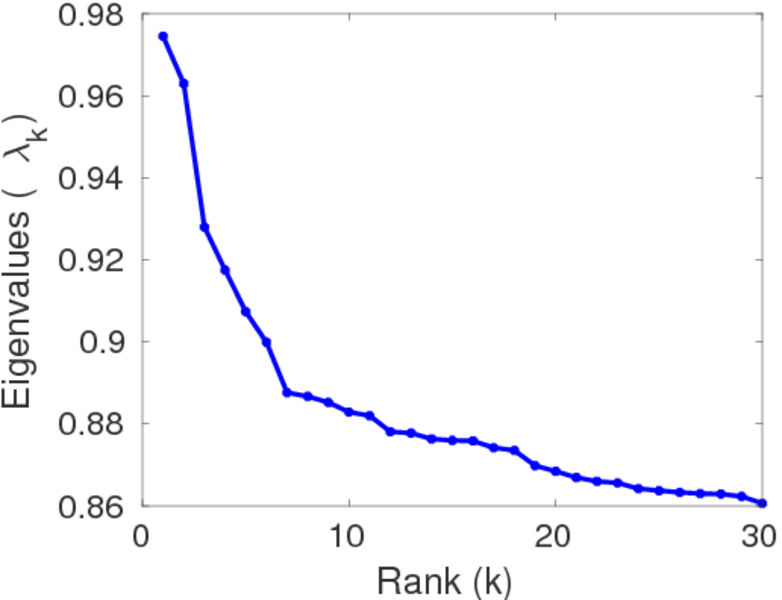
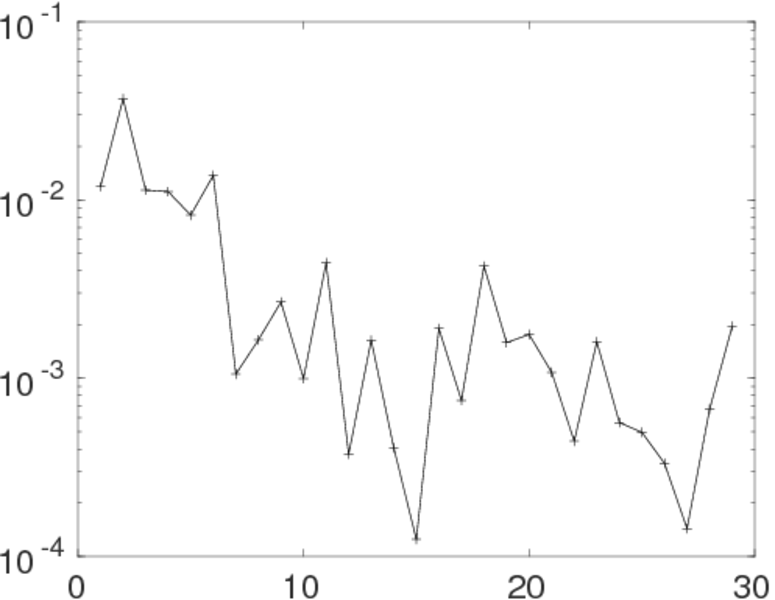
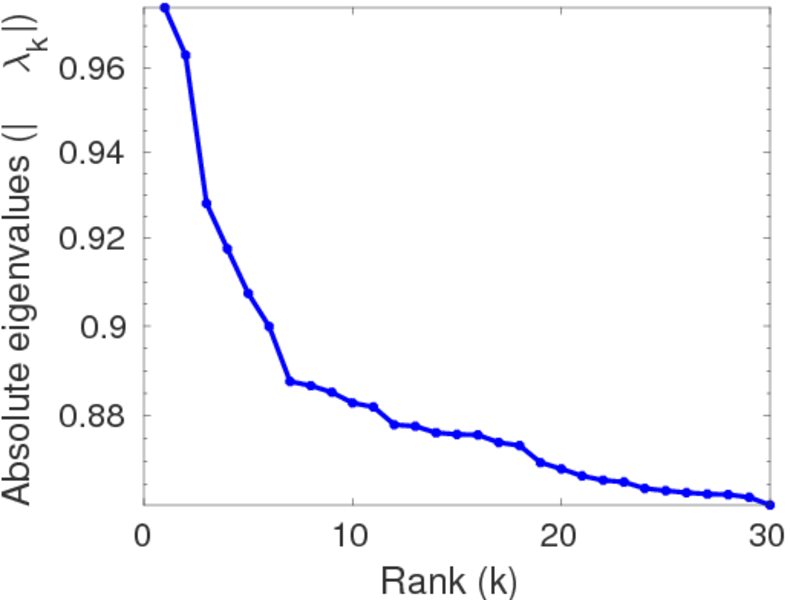
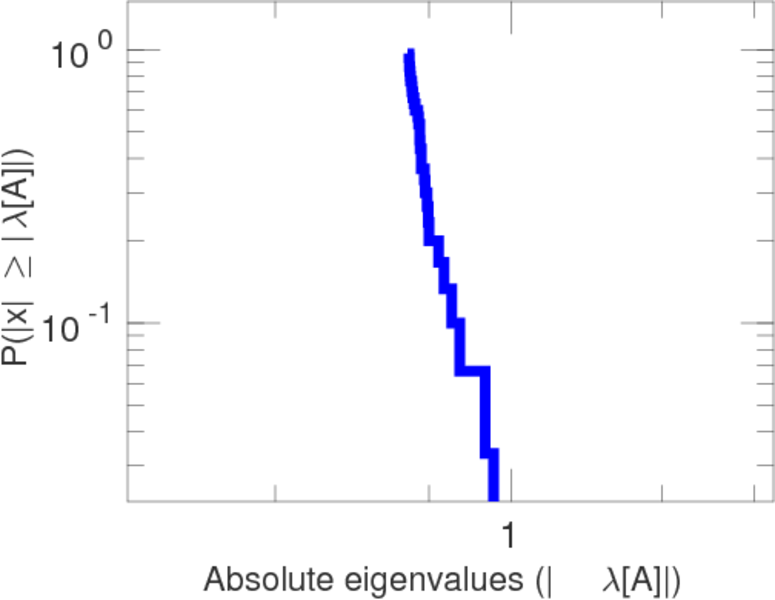
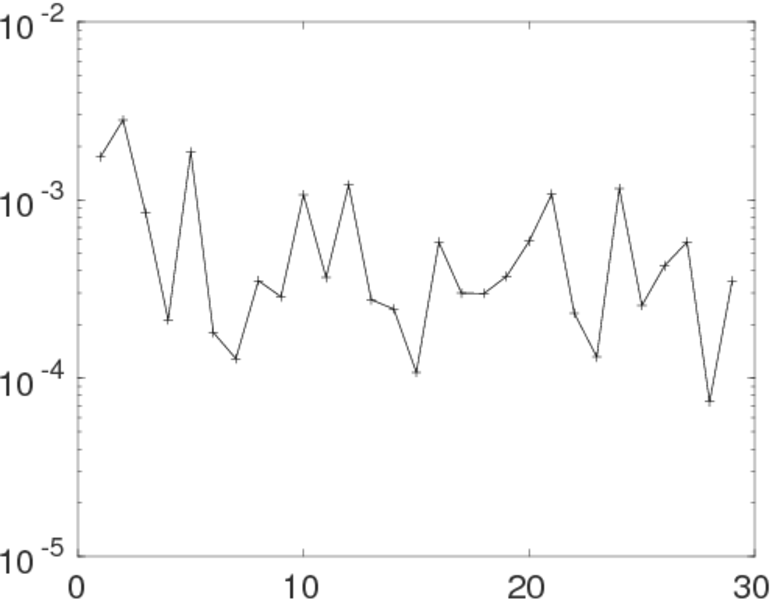
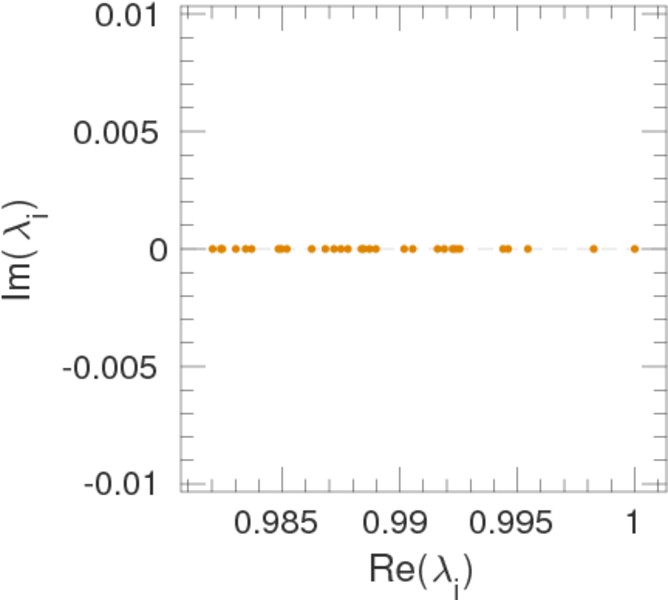
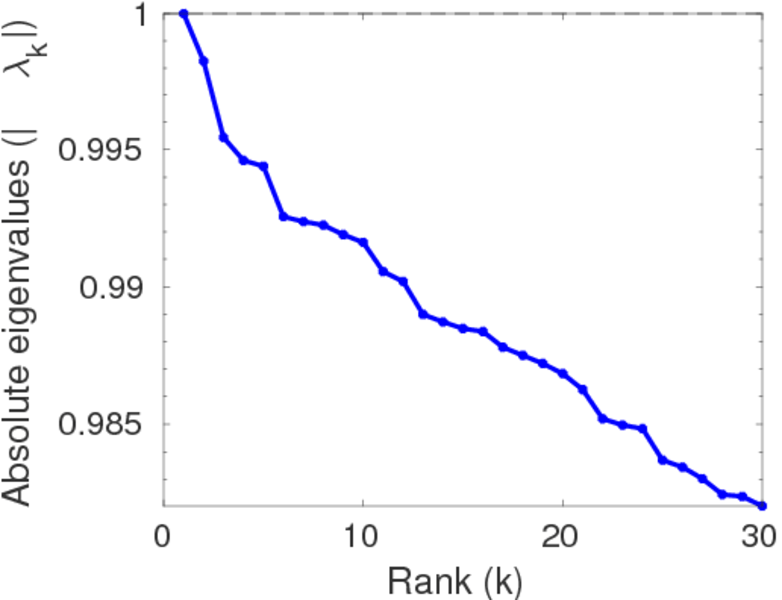
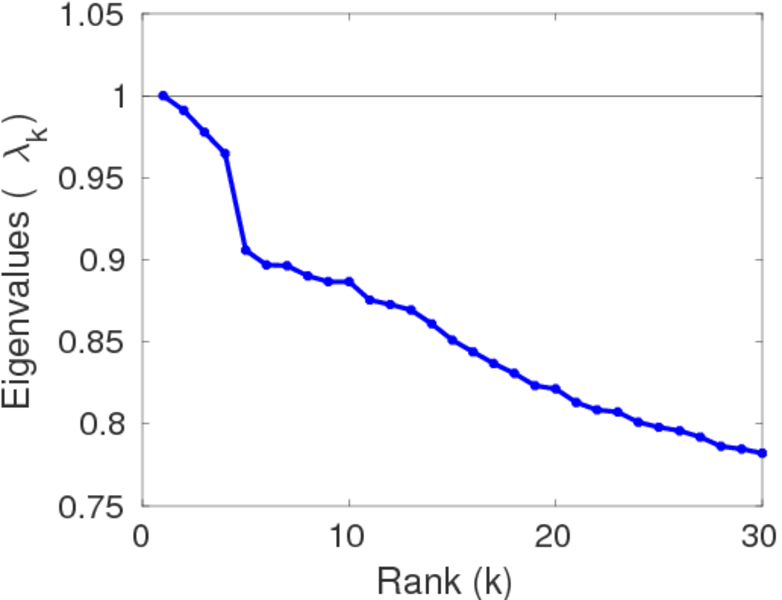
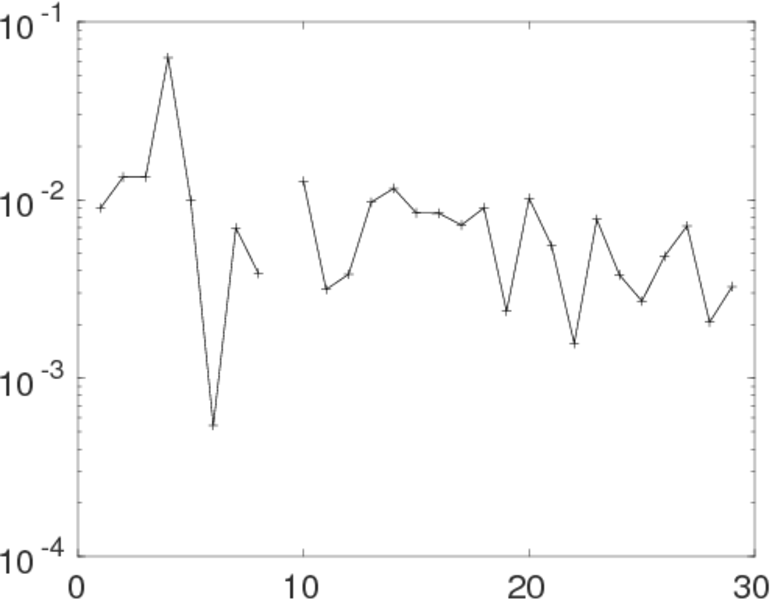
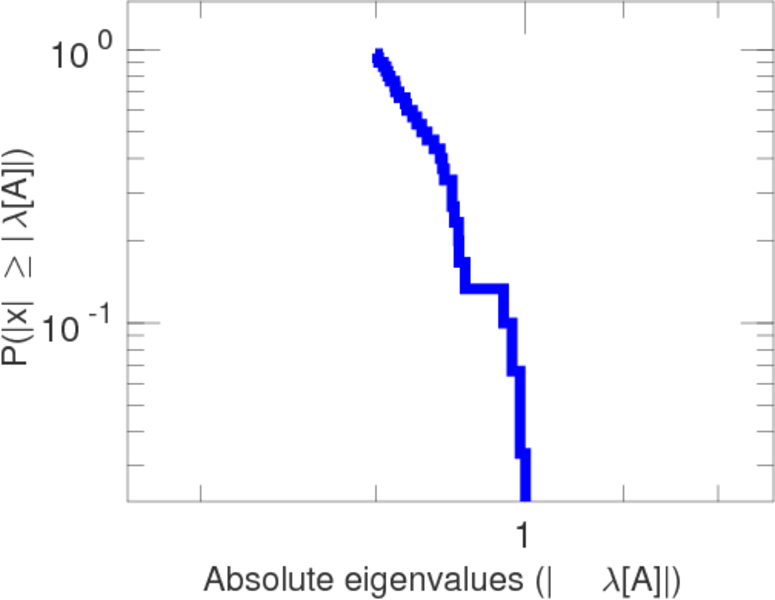
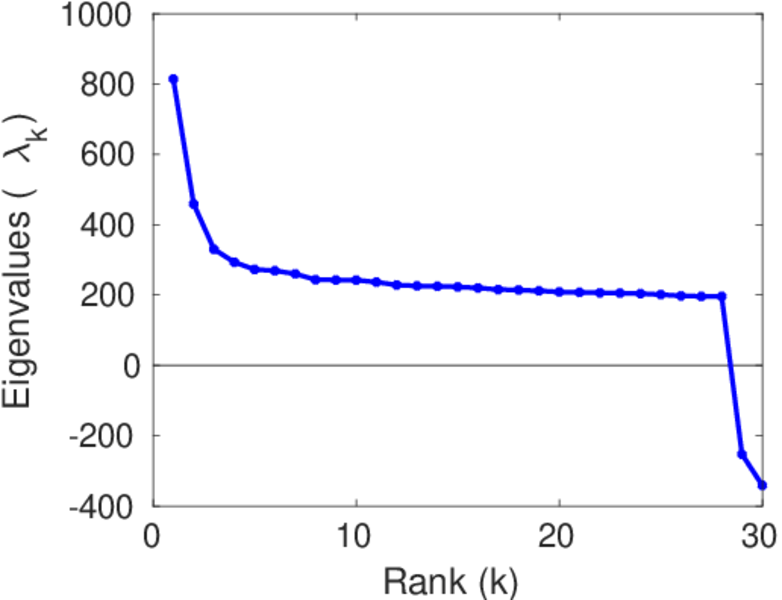
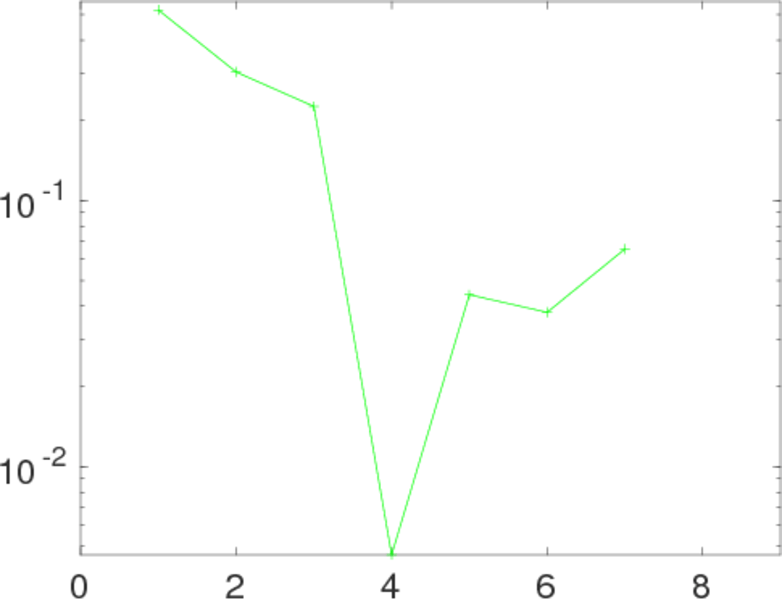
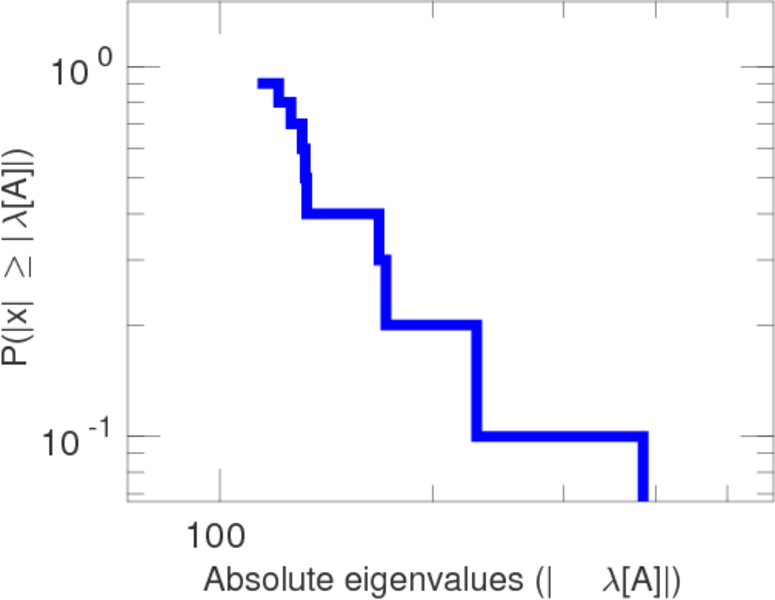
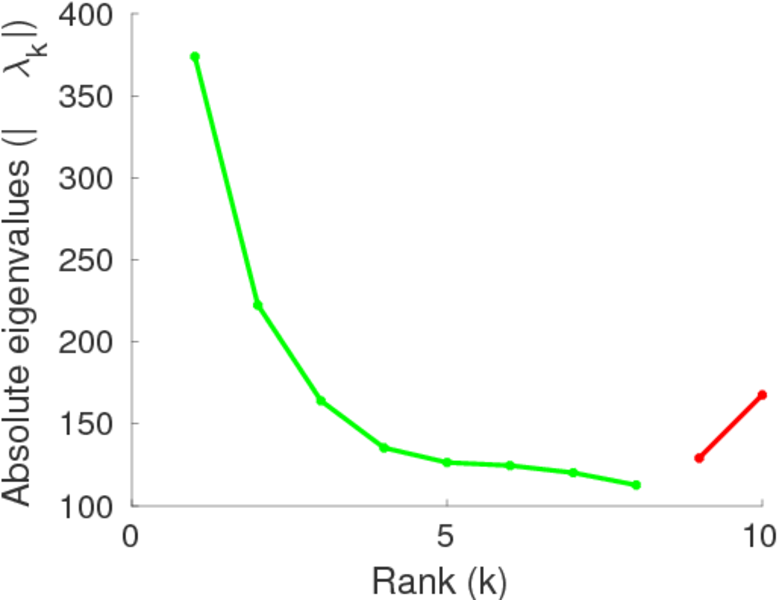
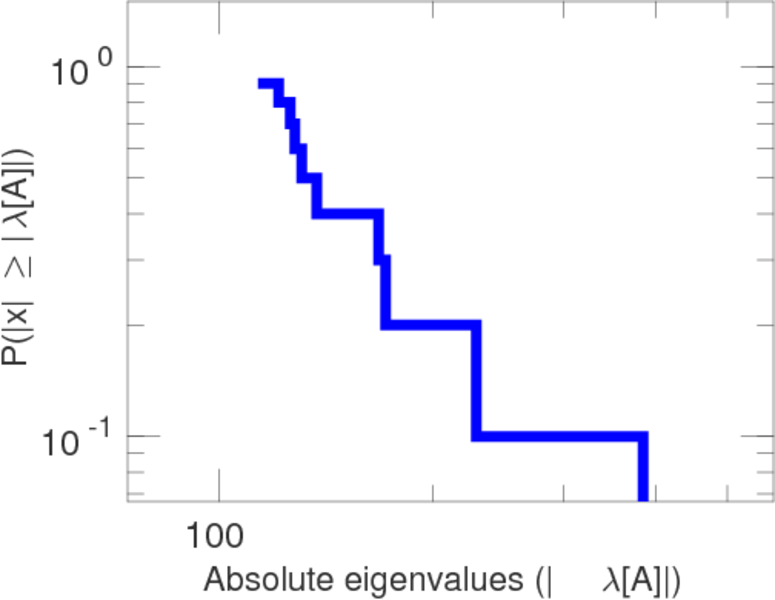
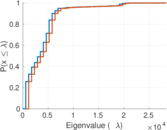
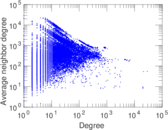
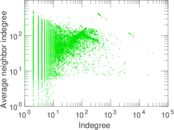
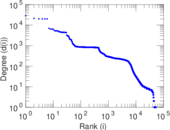
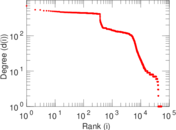
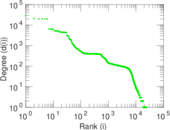
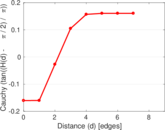
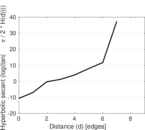
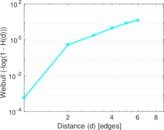
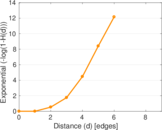
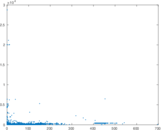
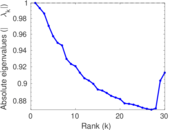
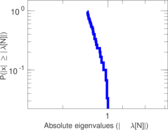
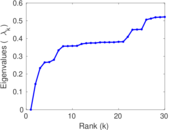
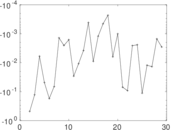
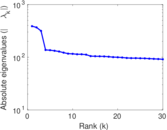
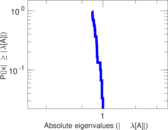
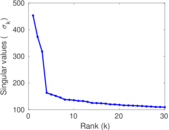
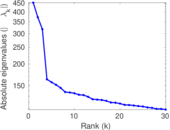
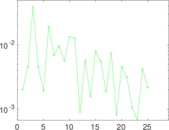
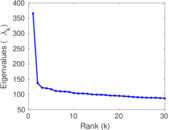
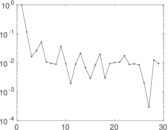
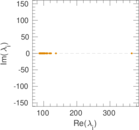
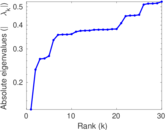
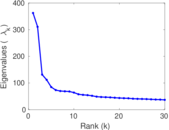
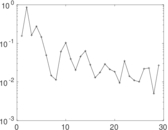
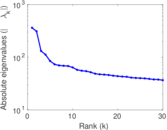
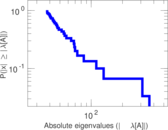
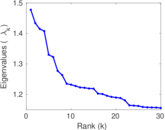
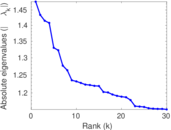
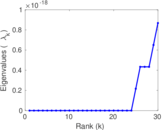
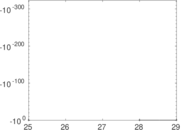
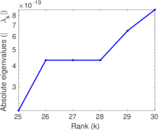
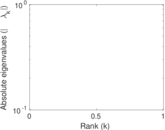
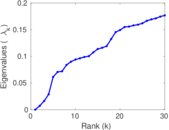
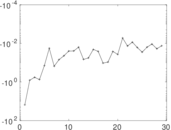
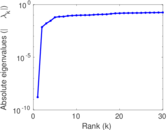
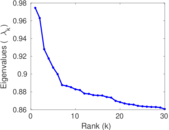
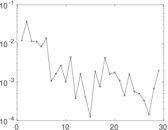
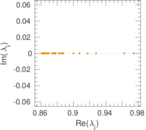
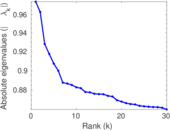
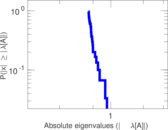
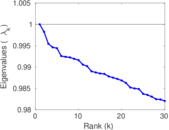
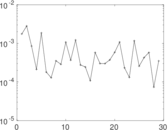
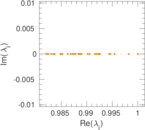
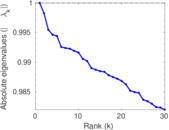
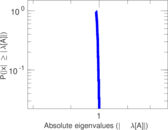
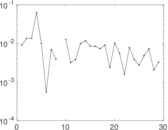
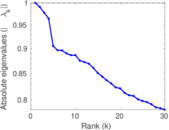
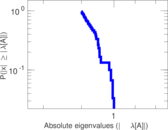
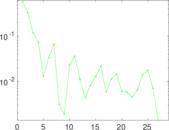
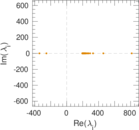
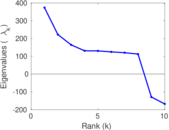
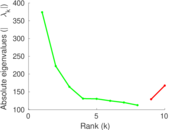
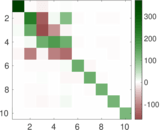
Plots


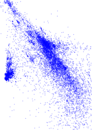


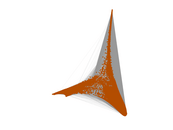


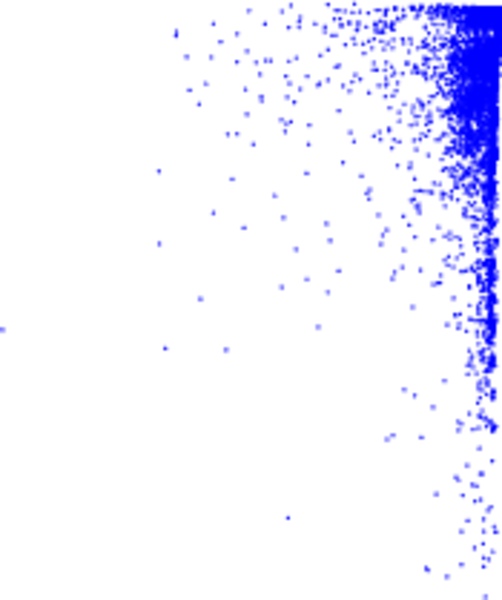
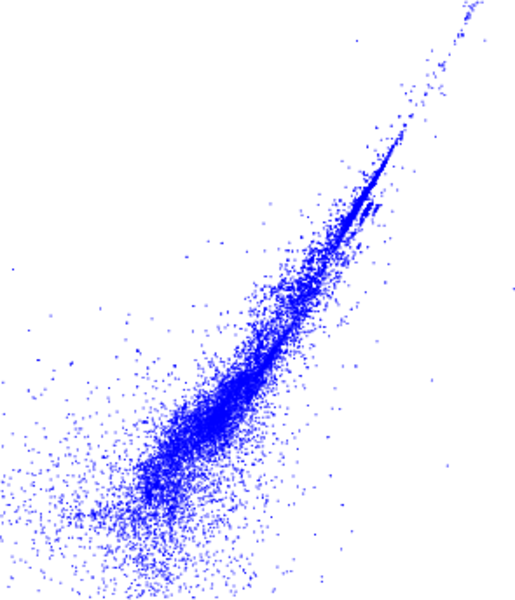
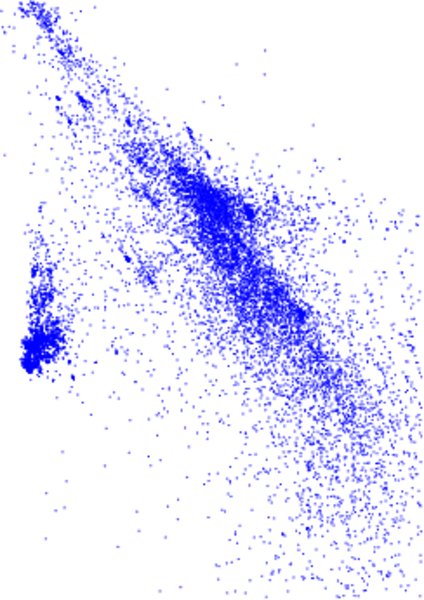
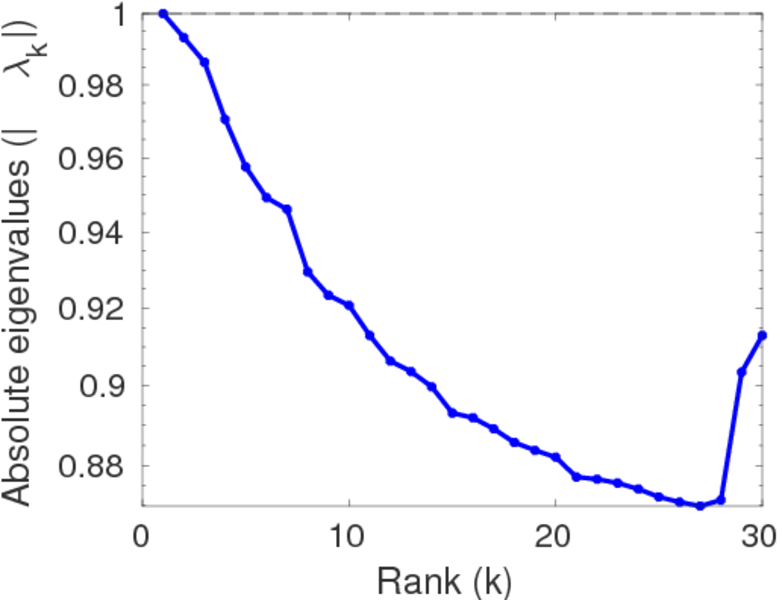
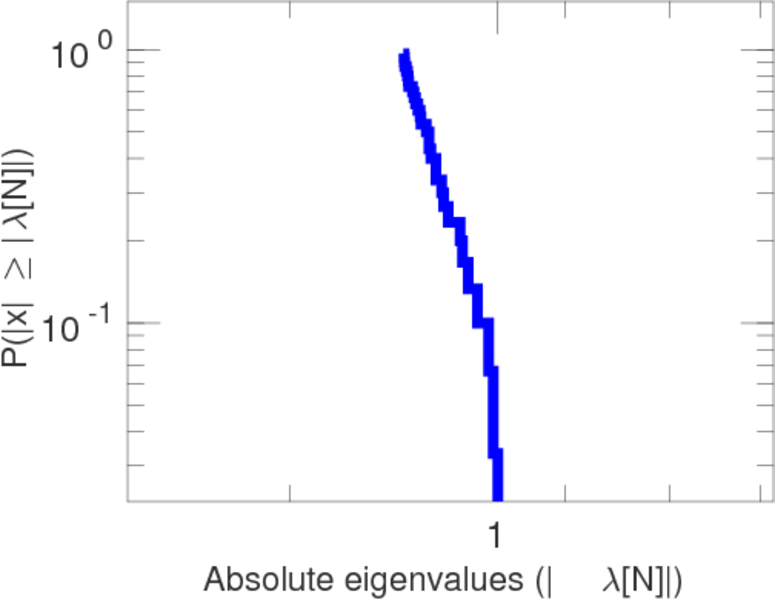
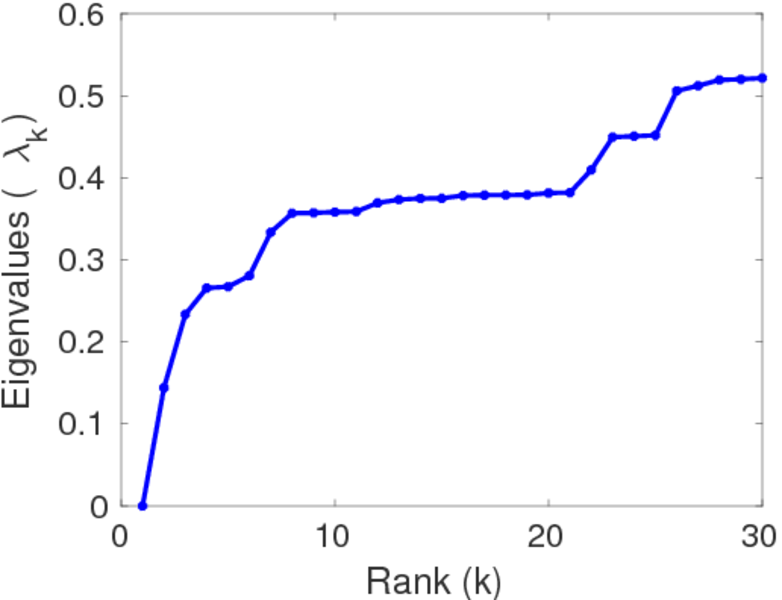
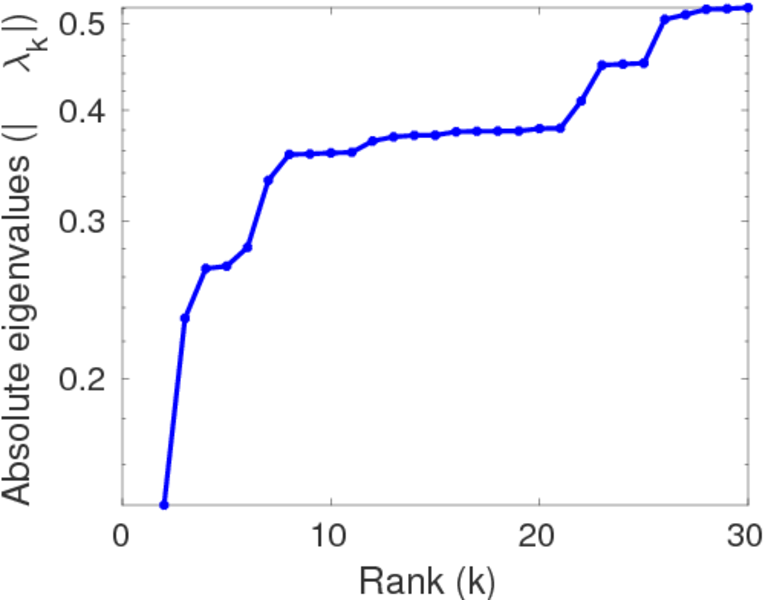
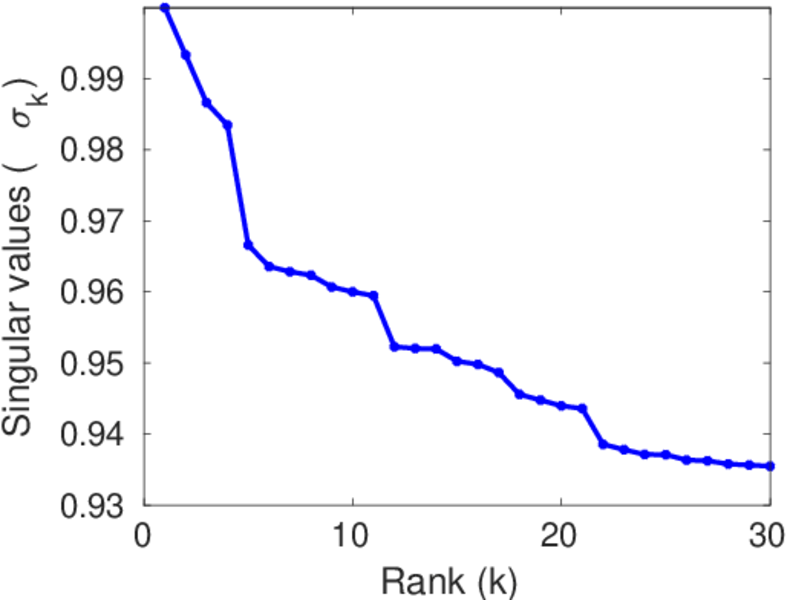
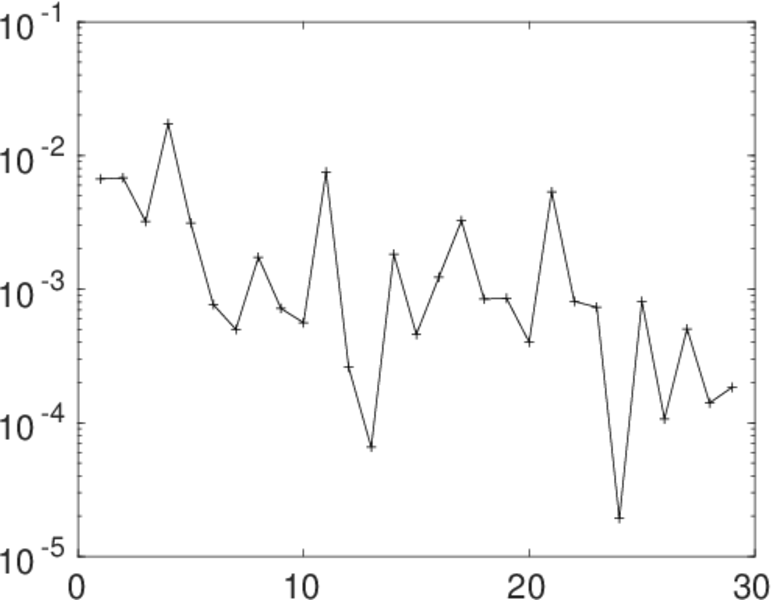
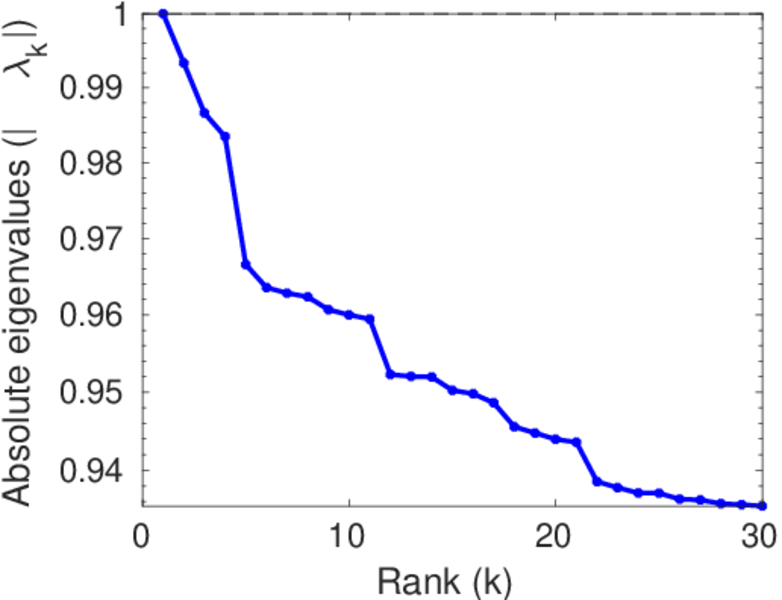
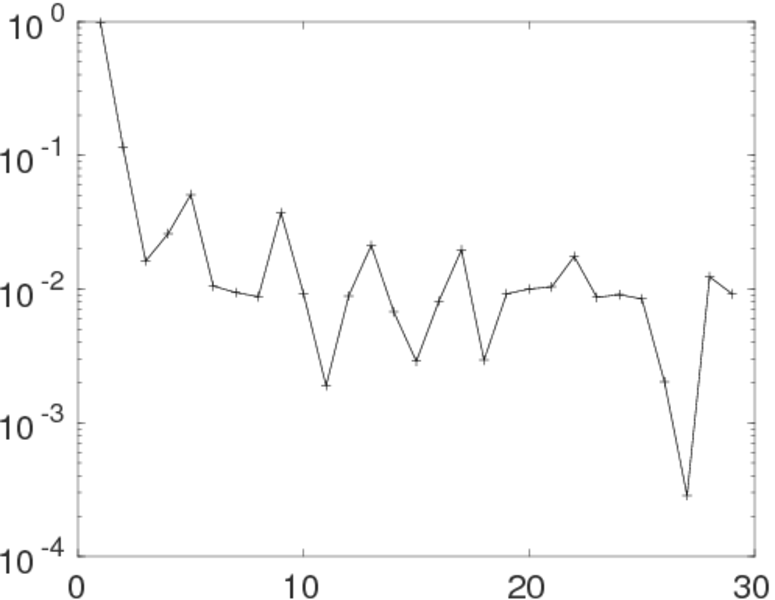
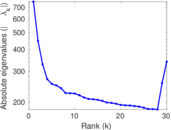
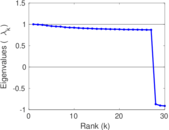
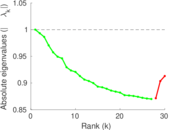
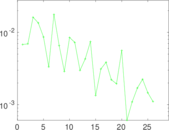
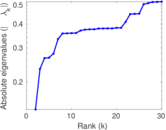
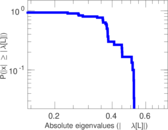
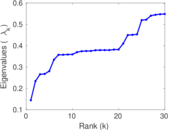
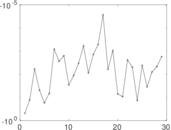
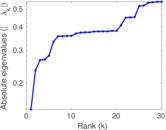
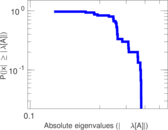
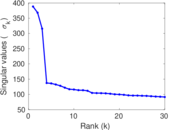
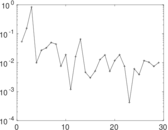
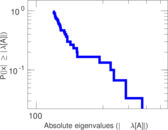
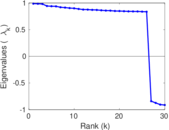
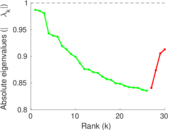
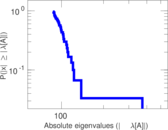
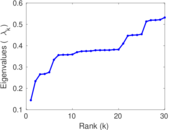
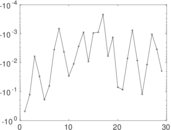
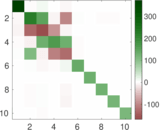
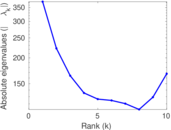
Matrix decompositions plots


Downloads
References
|
[1]
|
Jérôme Kunegis.
KONECT – The Koblenz Network Collection.
In Proc. Int. Conf. on World Wide Web Companion, pages
1343–1350, 2013.
[ http ]
|
 KONECT ‣ Networks ‣
Buy Me a Coffee
KONECT ‣ Networks ‣
Buy Me a Coffee