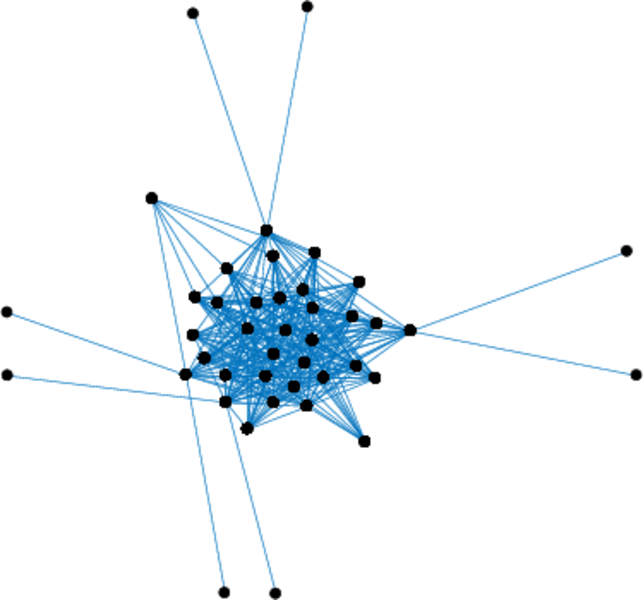
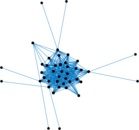
Wikipedia links (br)
This network consists of the wikilinks of the Wikipedia in the Breton language
(br). Nodes are Wikipedia articles, and directed edges are wikilinks, i.e.,
hyperlinks within one wiki. In the wiki source, these are indicated with
[[double brackets]]. Only pages in the article namespace are included.
Metadata
Statistics
| Size | n = | 83,392
|
| Volume | m = | 1,553,757
|
| Loop count | l = | 49
|
| Wedge count | s = | 639,409,253
|
| Claw count | z = | 838,081,484,001
|
| Triangle count | t = | 18,145,263
|
| Square count | q = | 4,634,360,337
|
| 4-Tour count | T4 = | 39,635,092,942
|
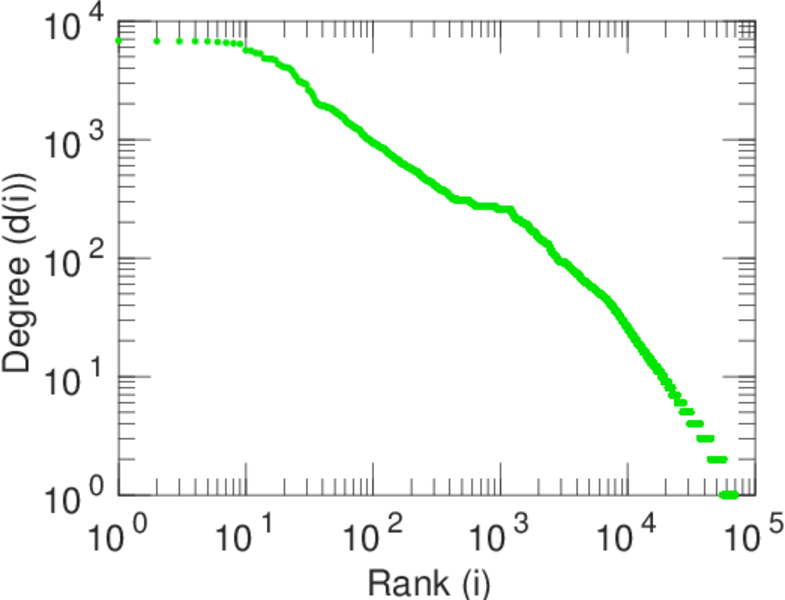
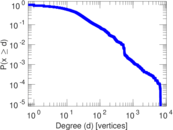
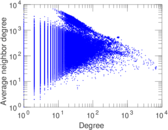
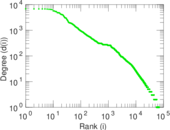
| Maximum degree | dmax = | 6,851
|
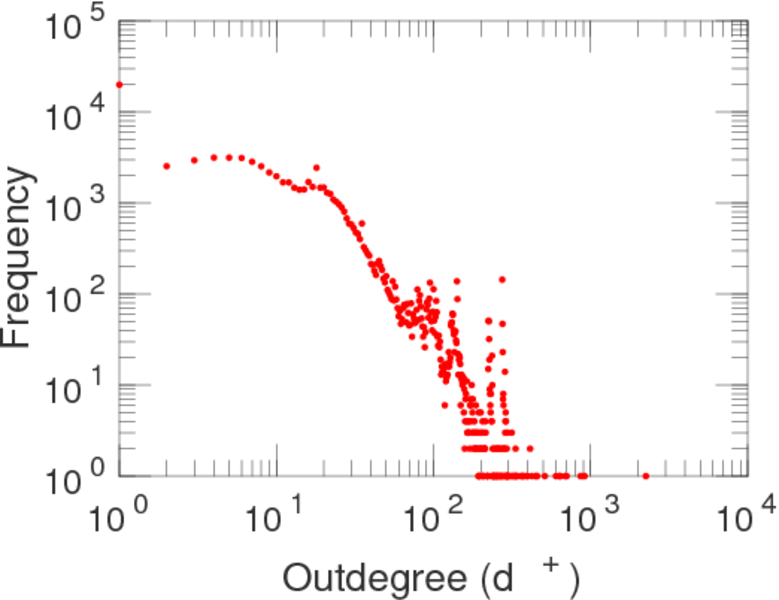
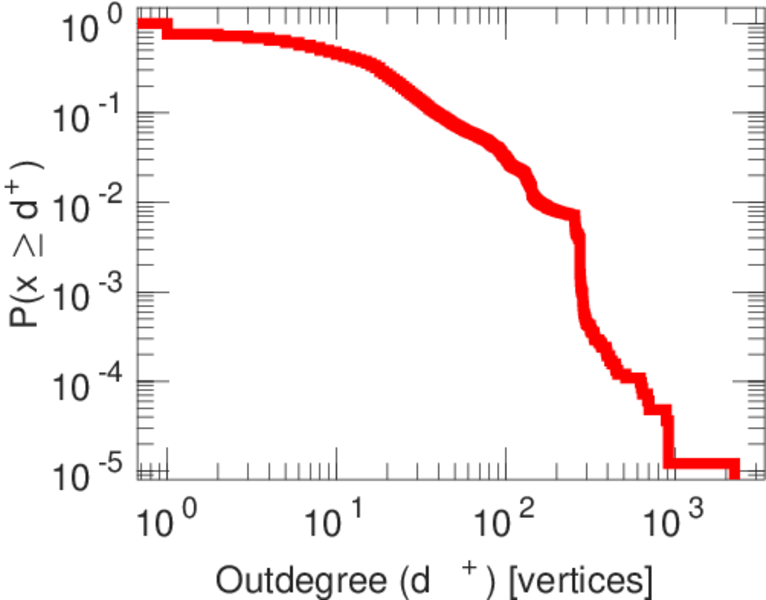
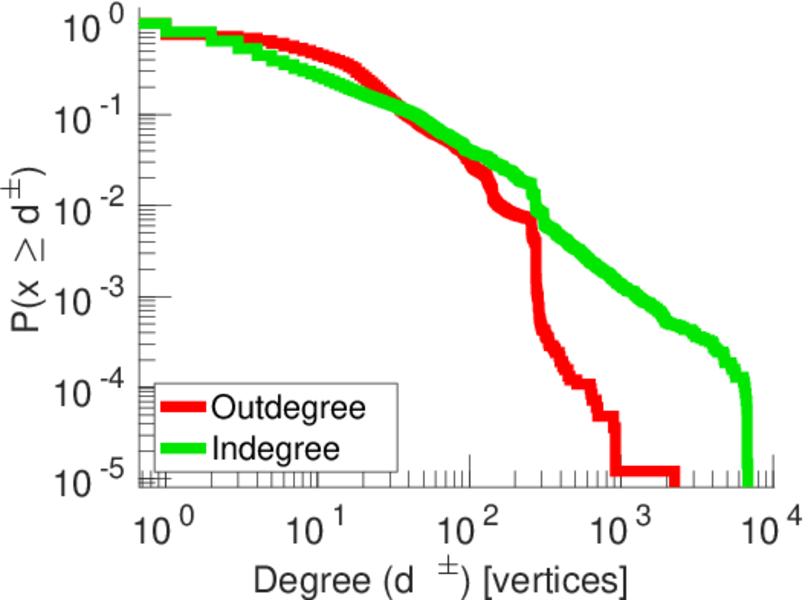
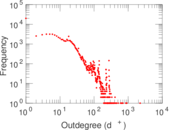
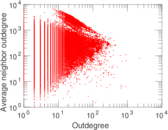
| Maximum outdegree | d+max = | 2,250
|
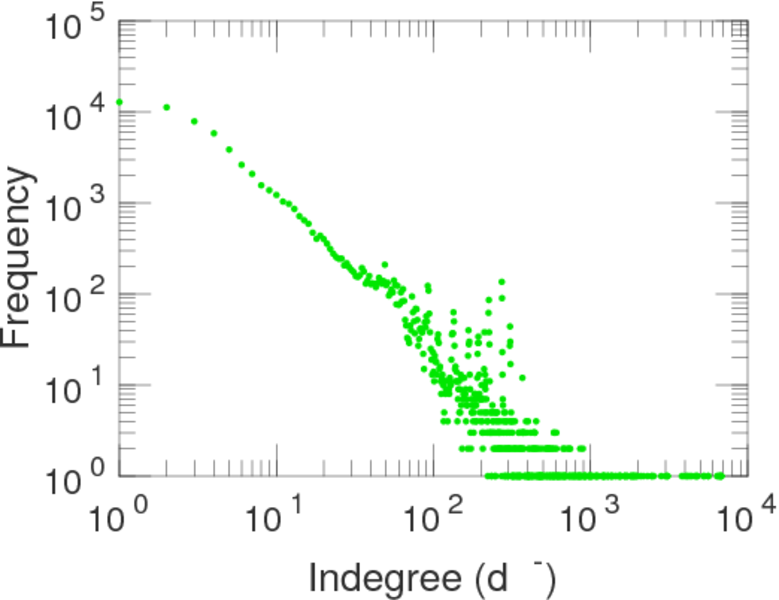
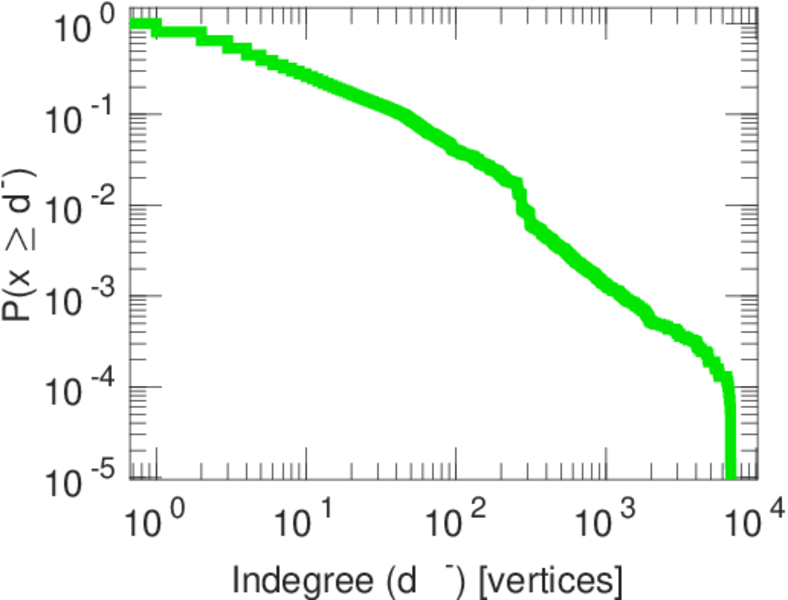
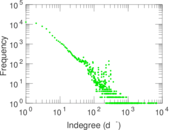
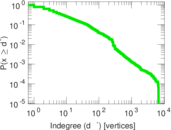
| Maximum indegree | d−max = | 6,821
|
| Average degree | d = | 37.263 9
|
| Fill | p = | 0.000 223 426
|
| Size of LCC | N = | 83,372
|
| Size of LSCC | Ns = | 65,484
|
| Relative size of LSCC | Nrs = | 0.785 255
|
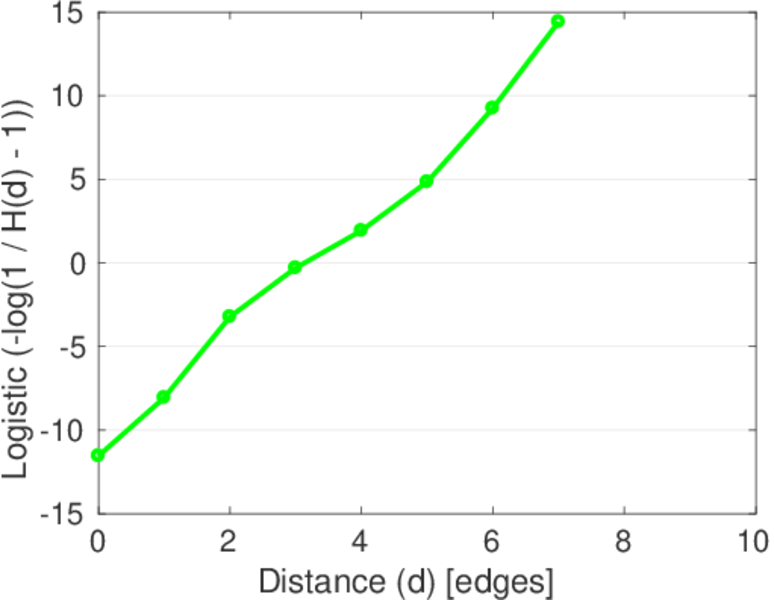
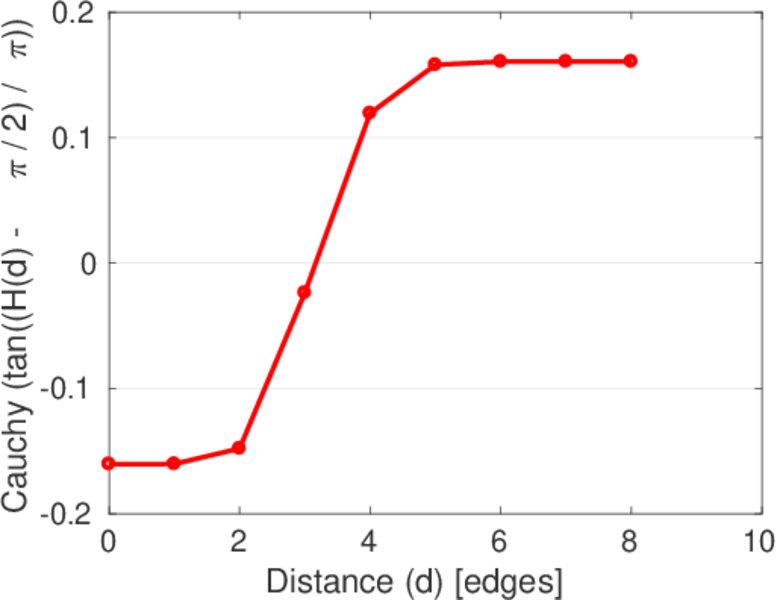
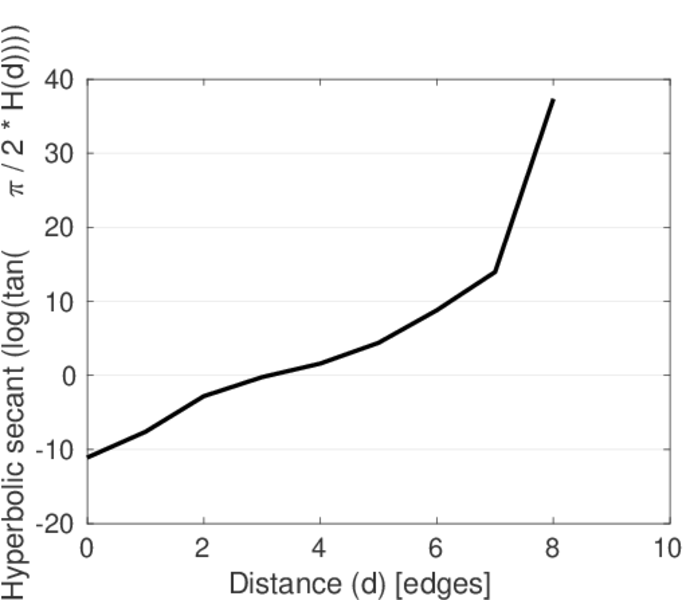
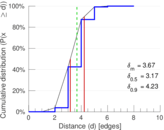
| Diameter | δ = | 9
|
| 50-Percentile effective diameter | δ0.5 = | 3.167 41
|
| 90-Percentile effective diameter | δ0.9 = | 4.226 91
|
| Median distance | δM = | 4
|
| Mean distance | δm = | 3.671 50
|
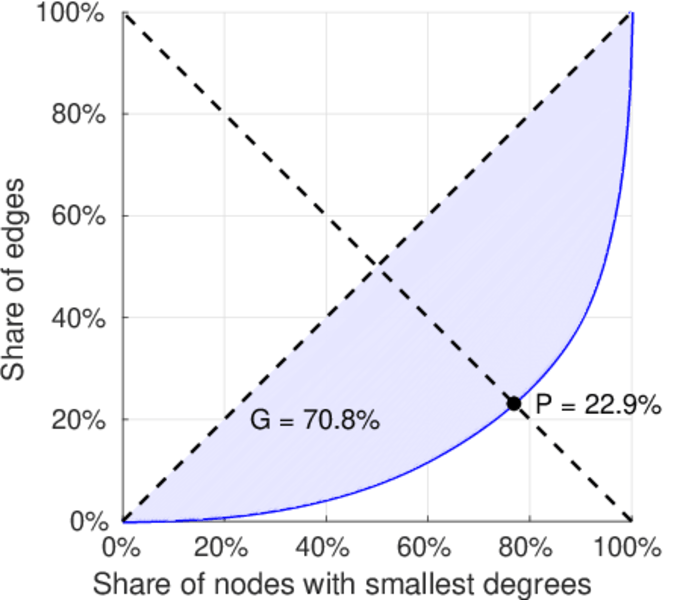
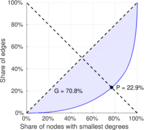
| Gini coefficient | G = | 0.708 144
|
| Balanced inequality ratio | P = | 0.229 500
|
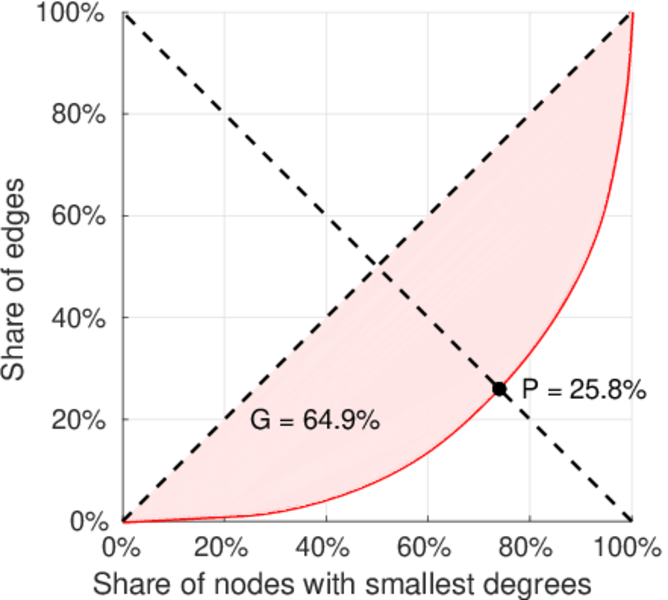
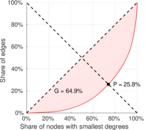
| Outdegree balanced inequality ratio | P+ = | 0.258 445
|
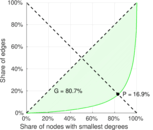
| Indegree balanced inequality ratio | P− = | 0.168 909
|
| Relative edge distribution entropy | Her = | 0.894 664
|
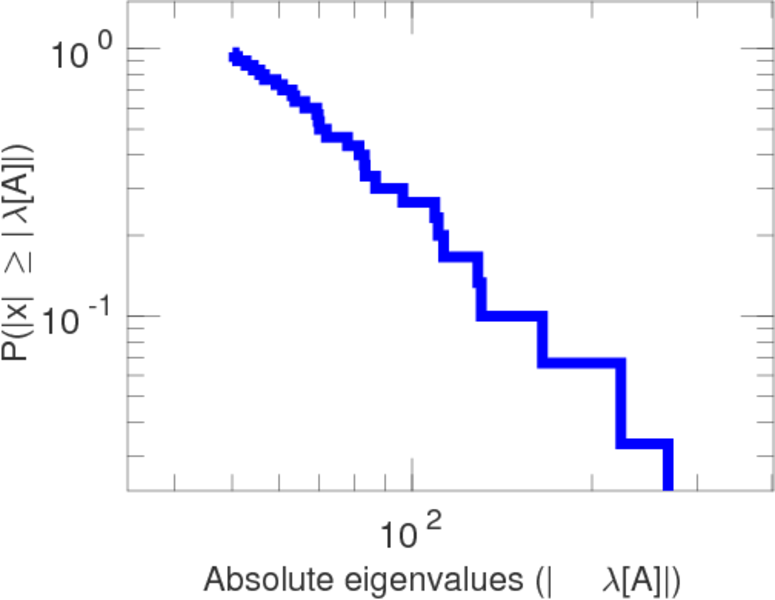
| Tail power law exponent | γt = | 2.221 00
|
| Degree assortativity | ρ = | −0.121 600
|
| Degree assortativity p-value | pρ = | 0.000 00
|
| In/outdegree correlation | ρ± = | +0.517 171
|
| Clustering coefficient | c = | 0.085 134 5
|
| Directed clustering coefficient | c± = | 0.588 891
|
| Spectral norm | α = | 522.298
|
| Operator 2-norm | ν = | 273.157
|
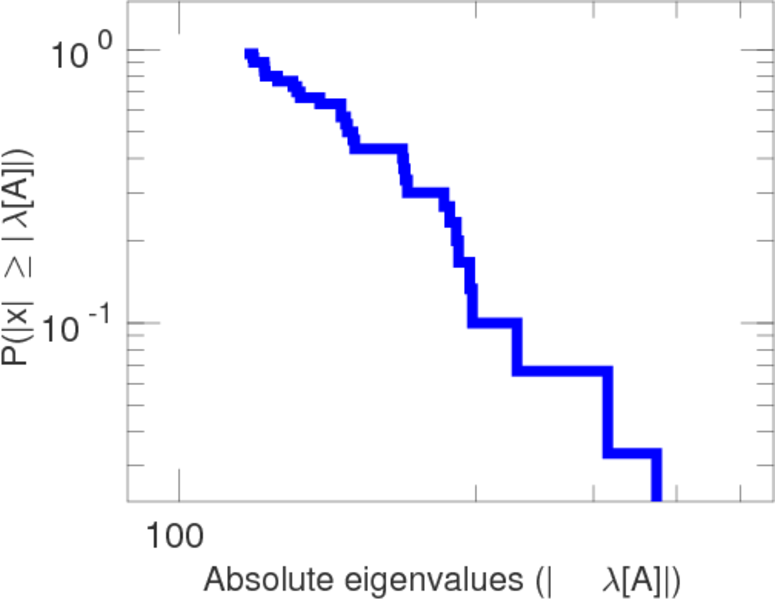
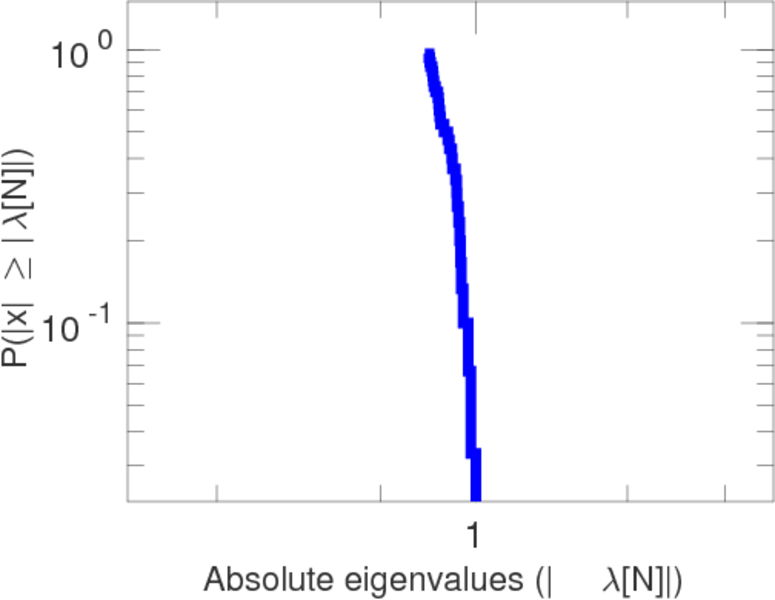
| Spectral separation | |λ1[A] / λ2[A]| = | 1.033 83
|
| Non-bipartivity | bA = | 0.496 177
|
| Normalized non-bipartivity | bN = | 0.094 137 1
|
| Spectral bipartite frustration | bK = | 0.001 275 86
|
| Controllability | C = | 25,587
|
| Relative controllability | Cr = | 0.306 828
|
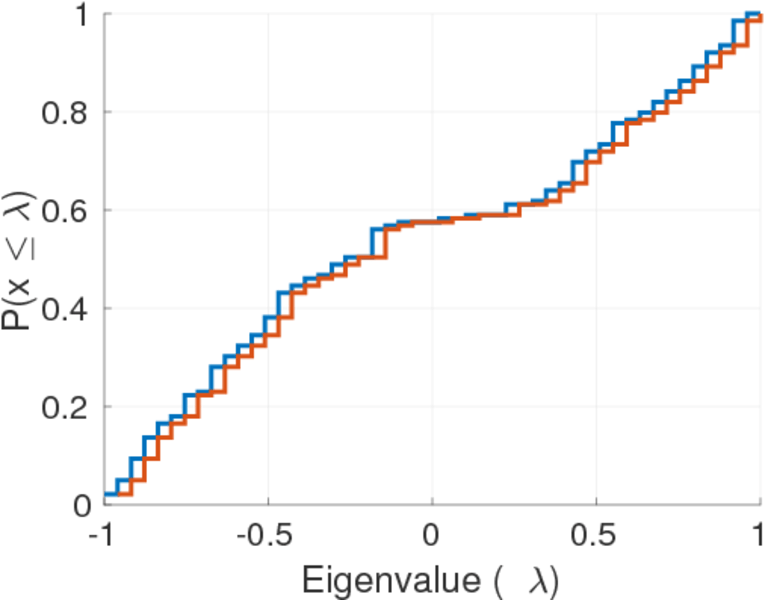
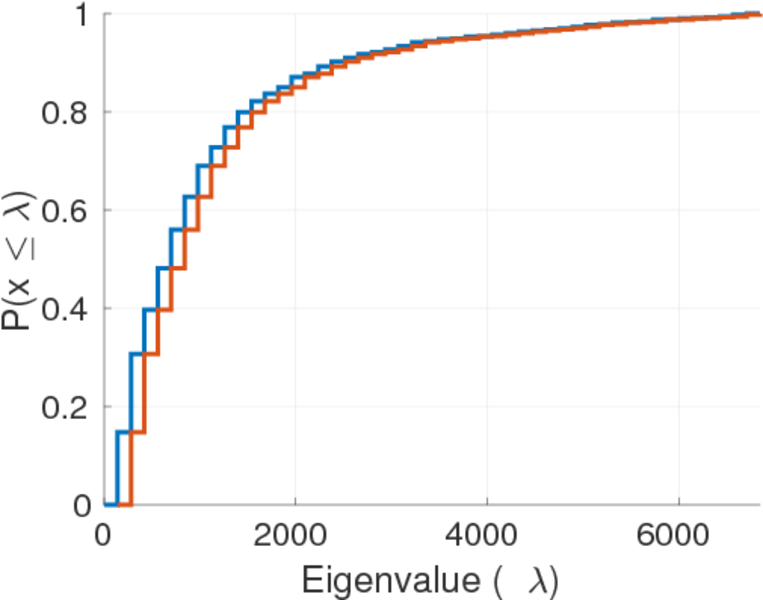
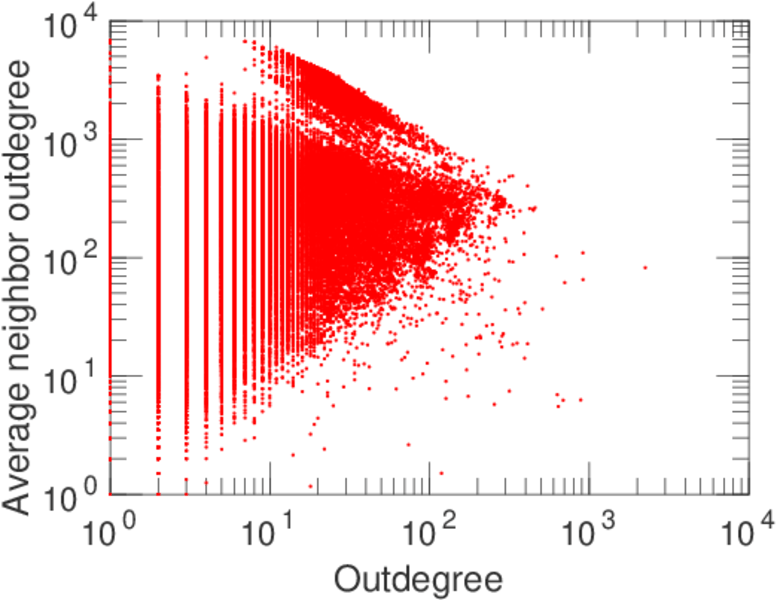
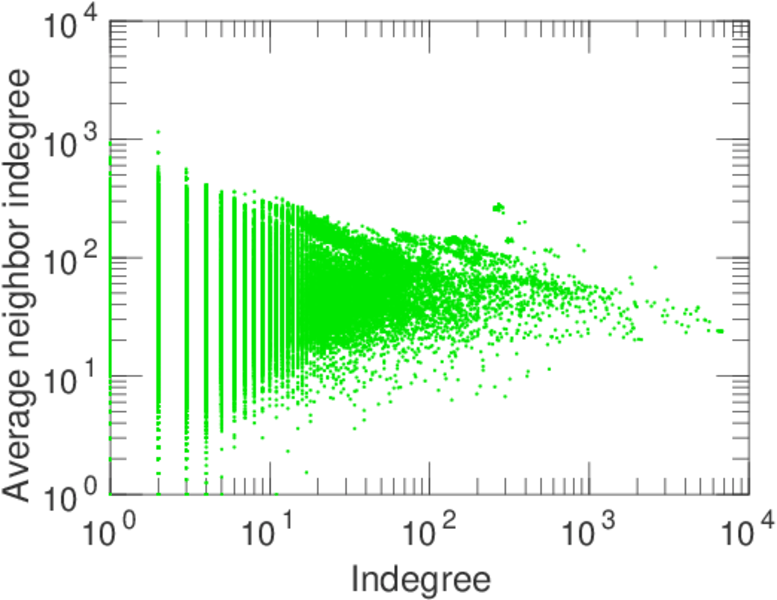
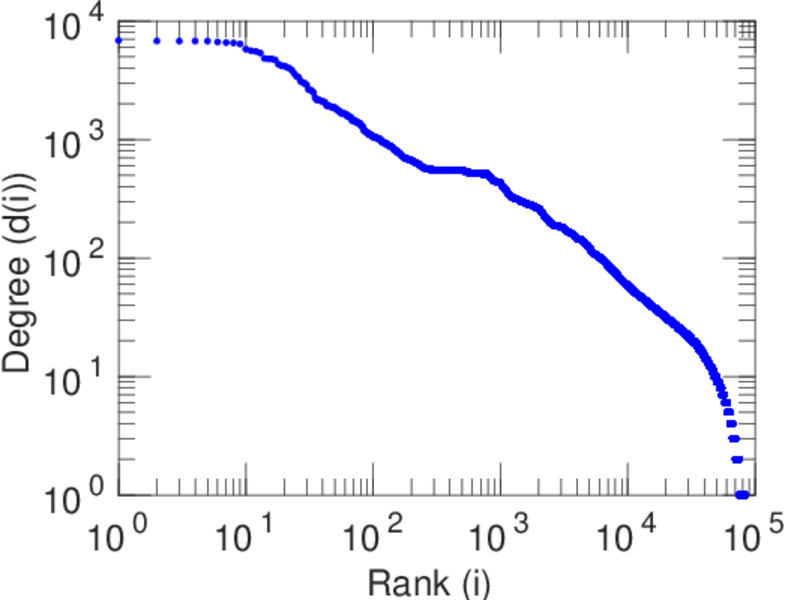
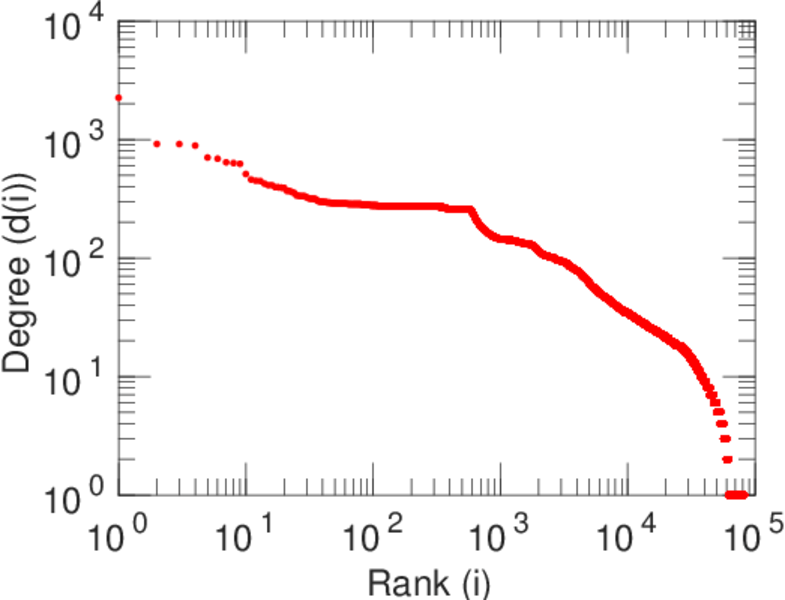
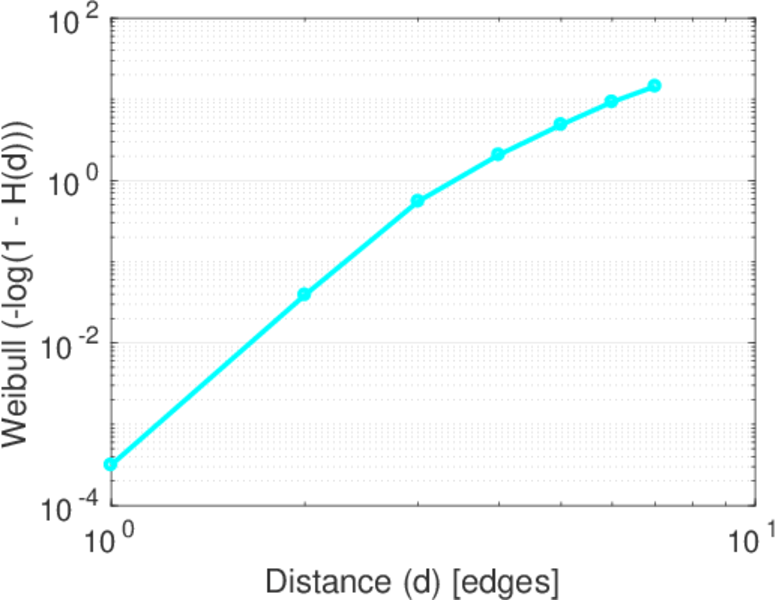
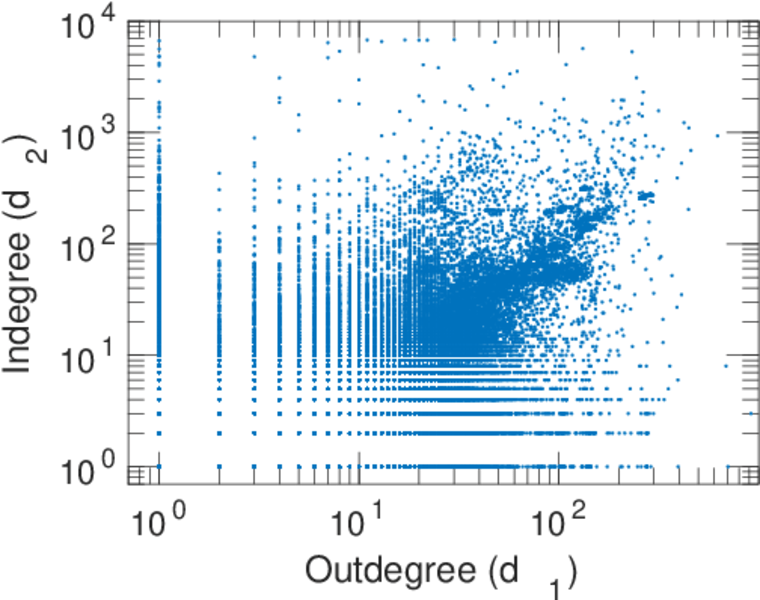
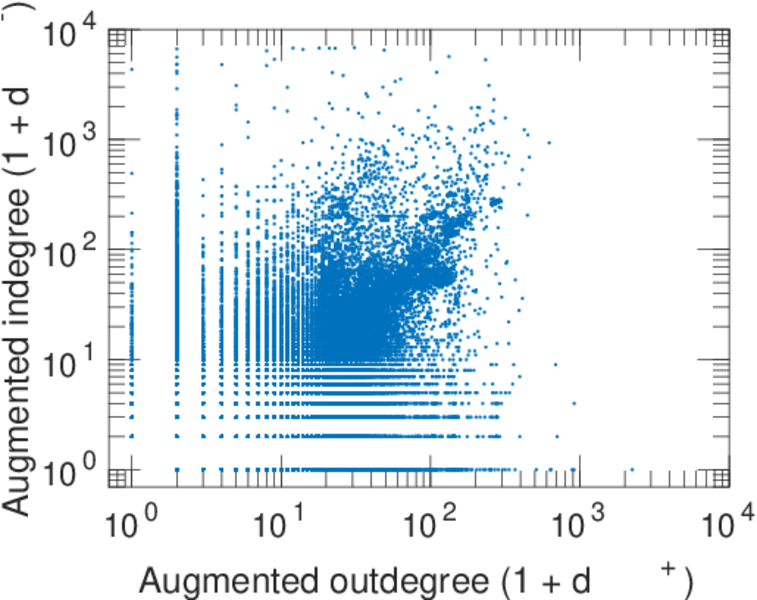
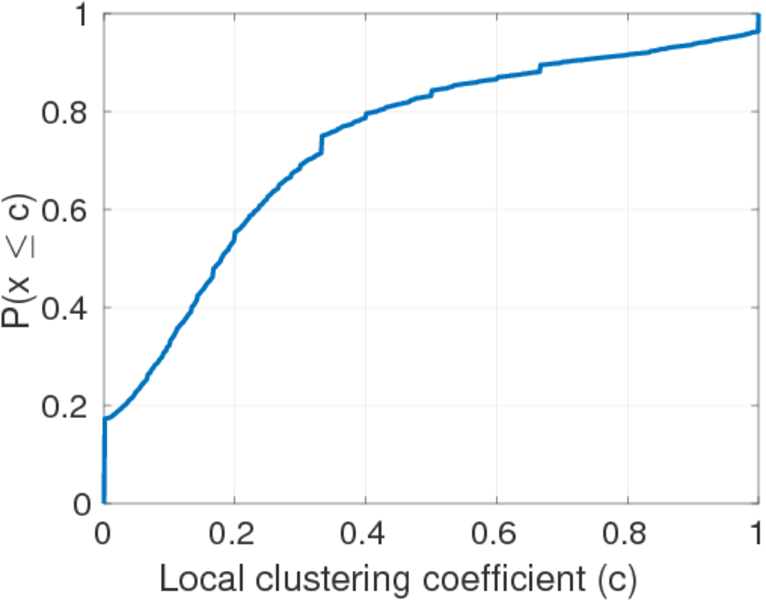
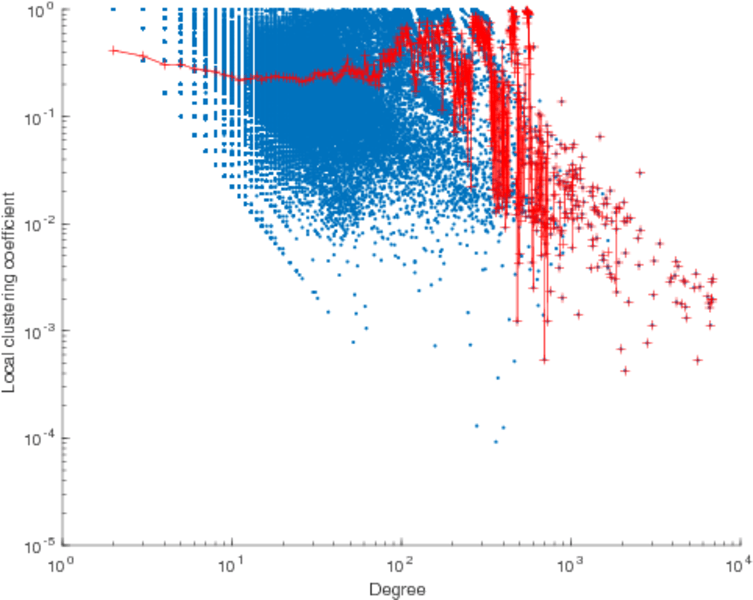
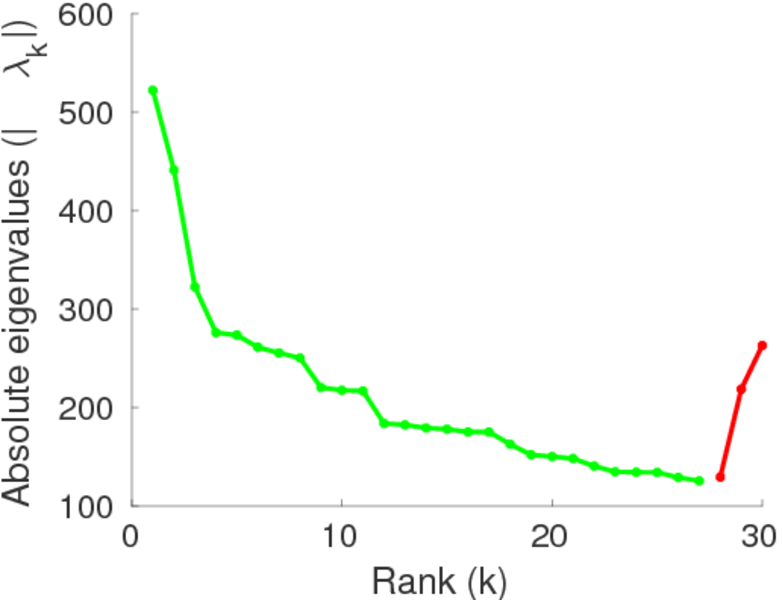
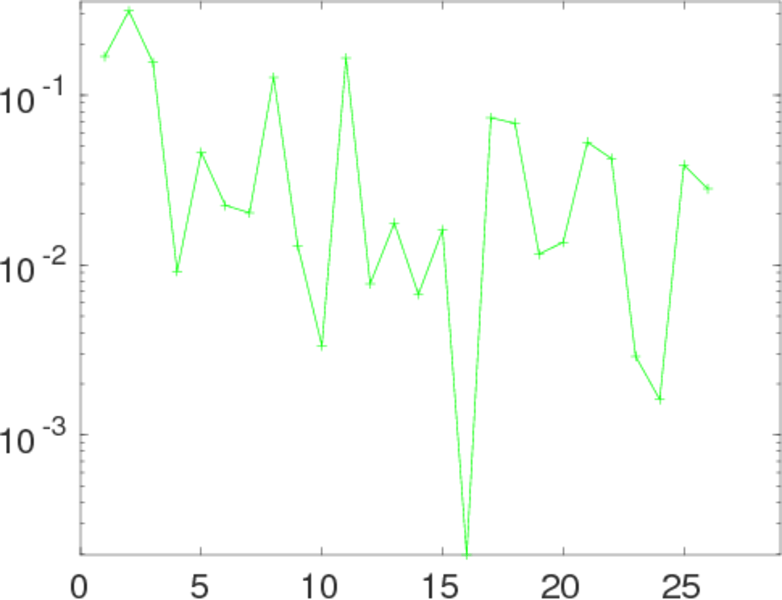
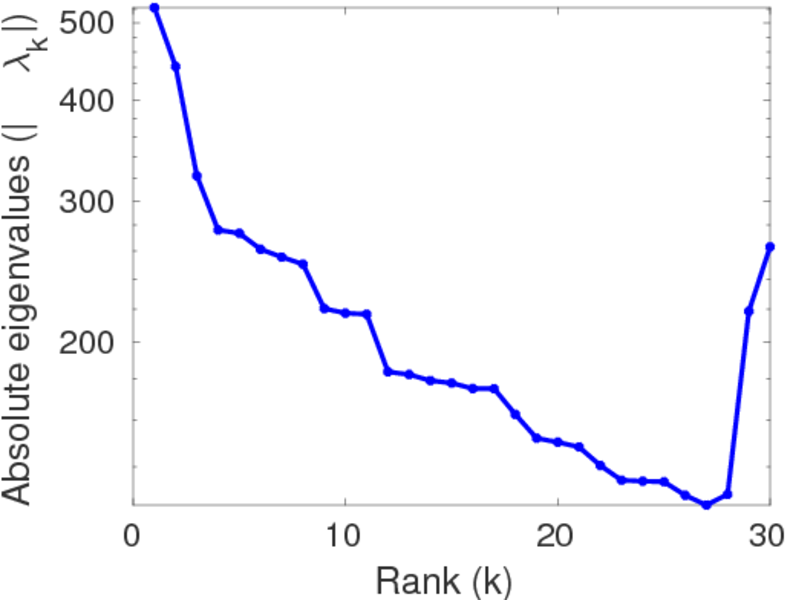
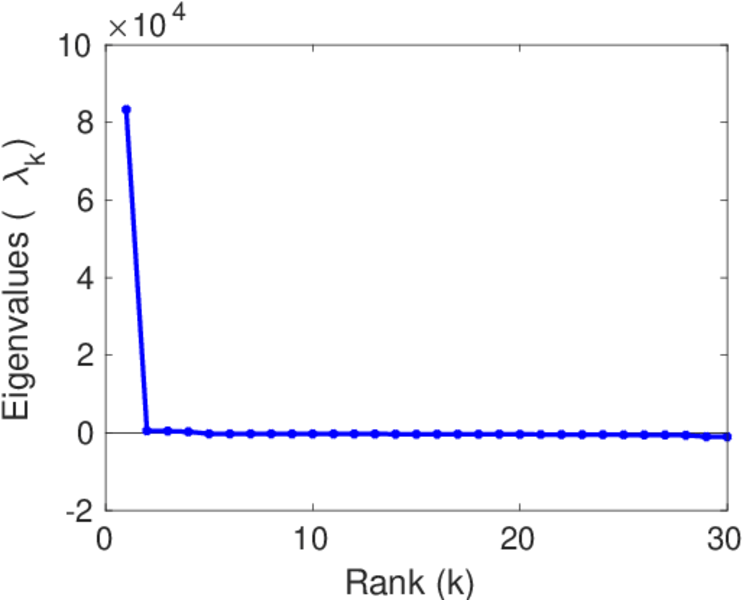
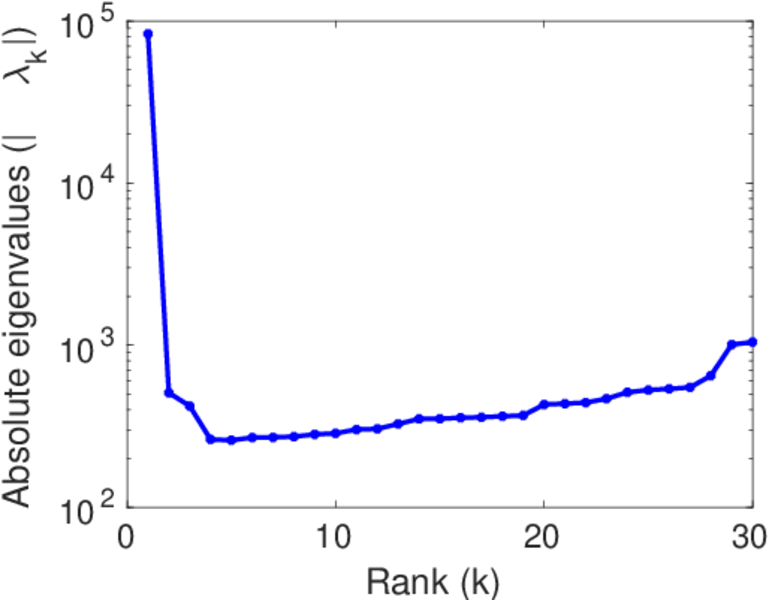
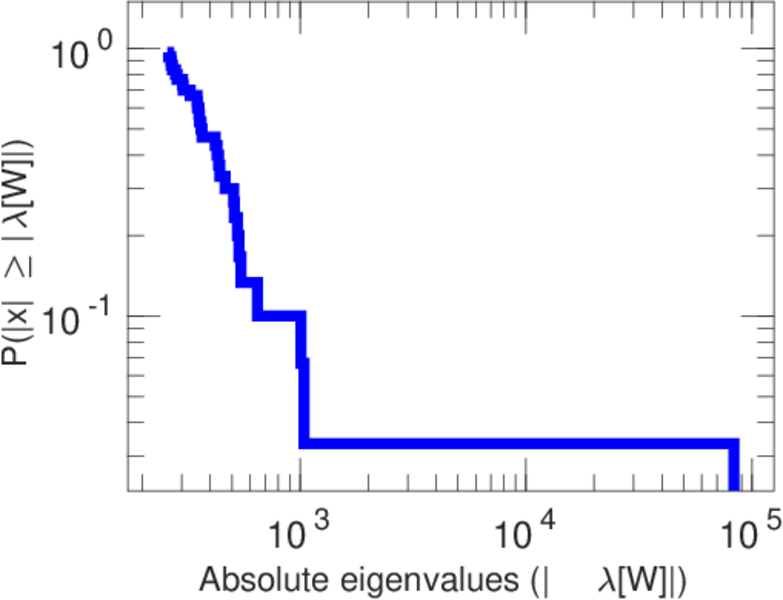
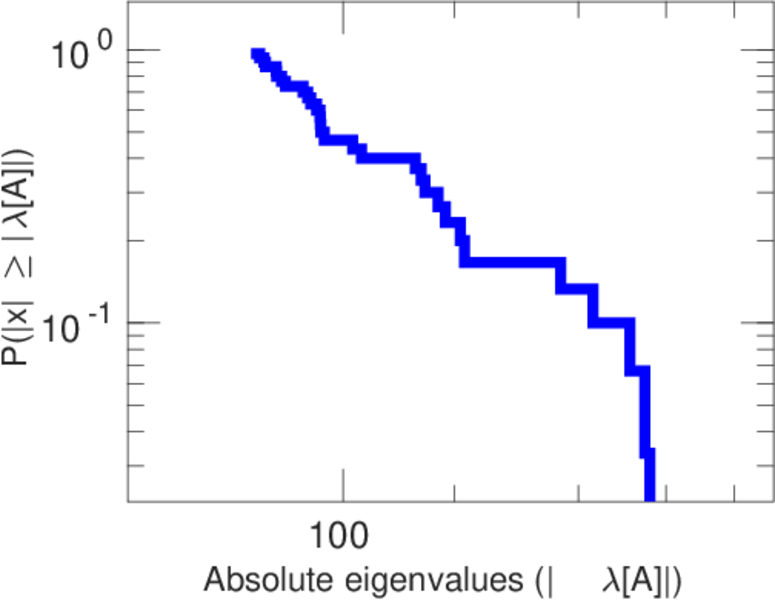
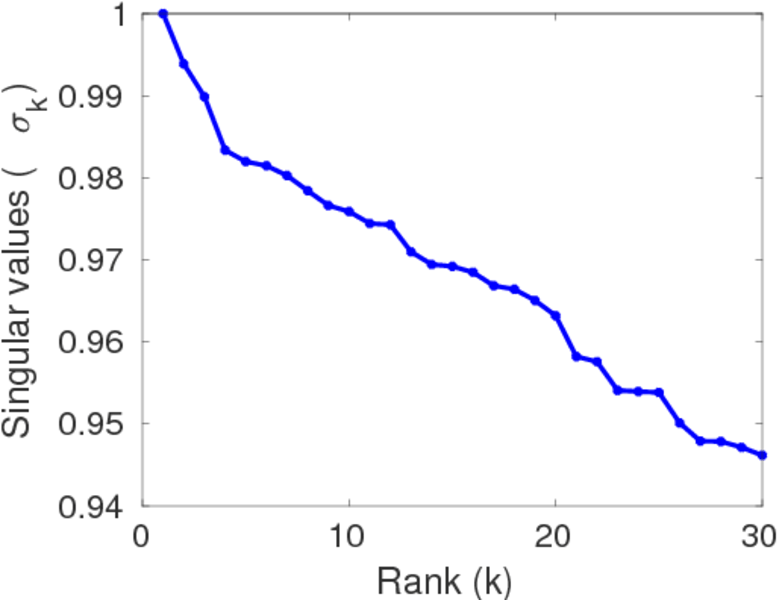
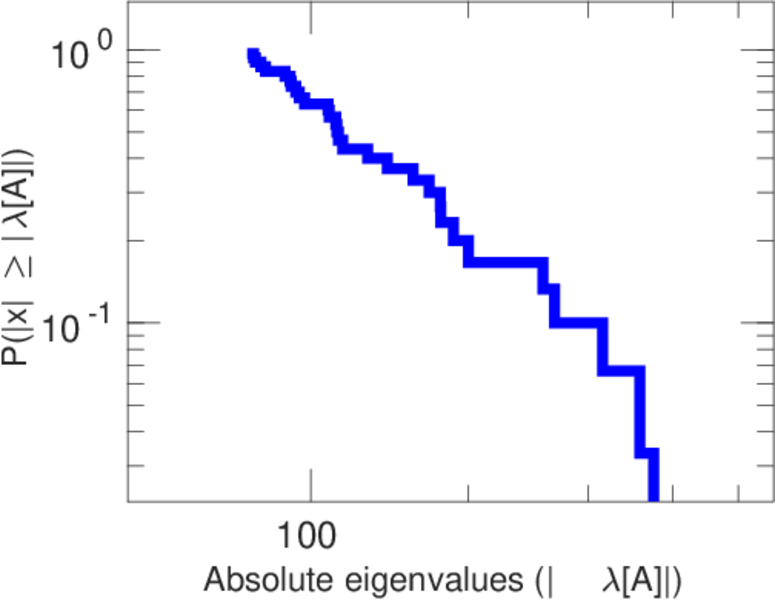
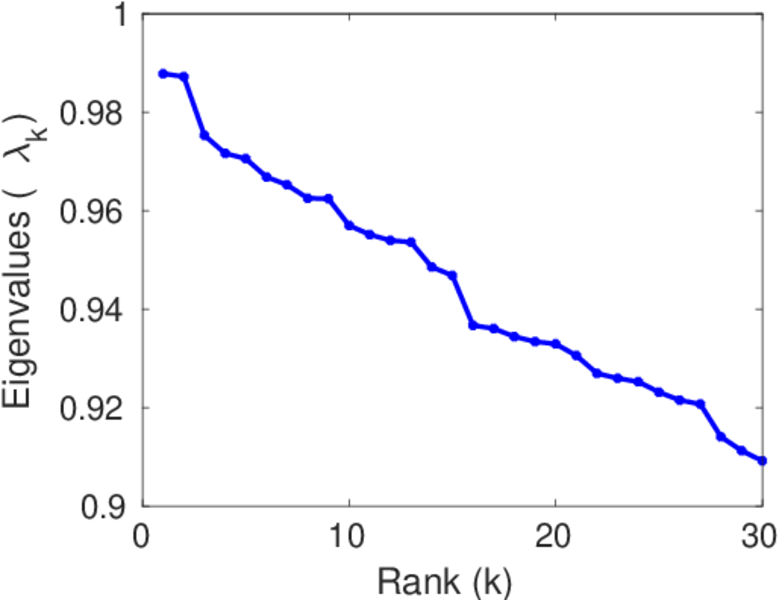
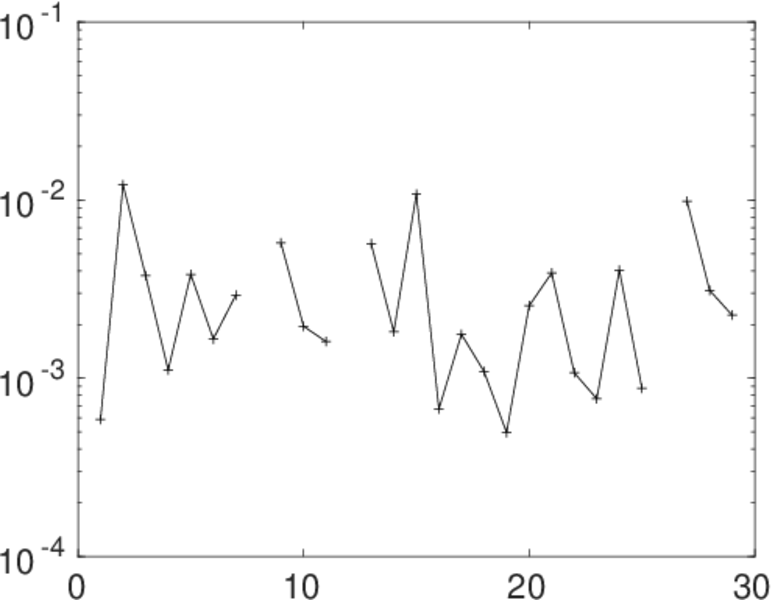
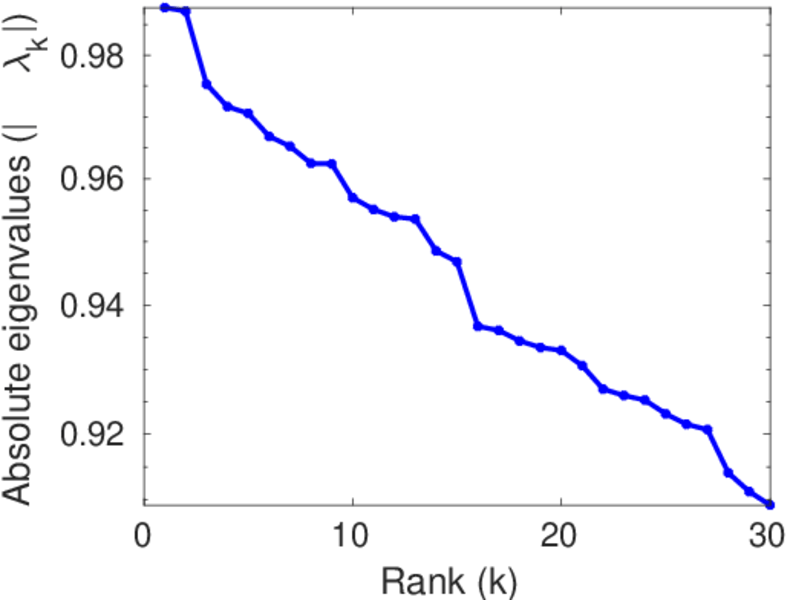
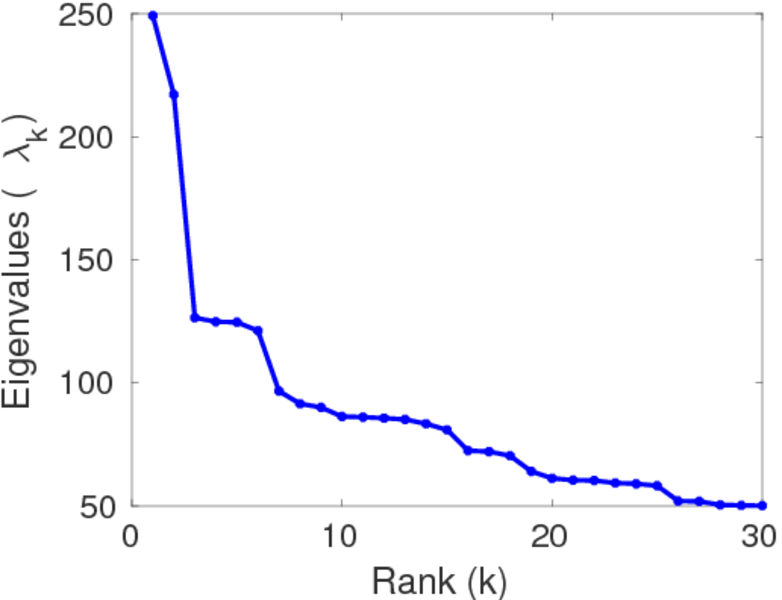
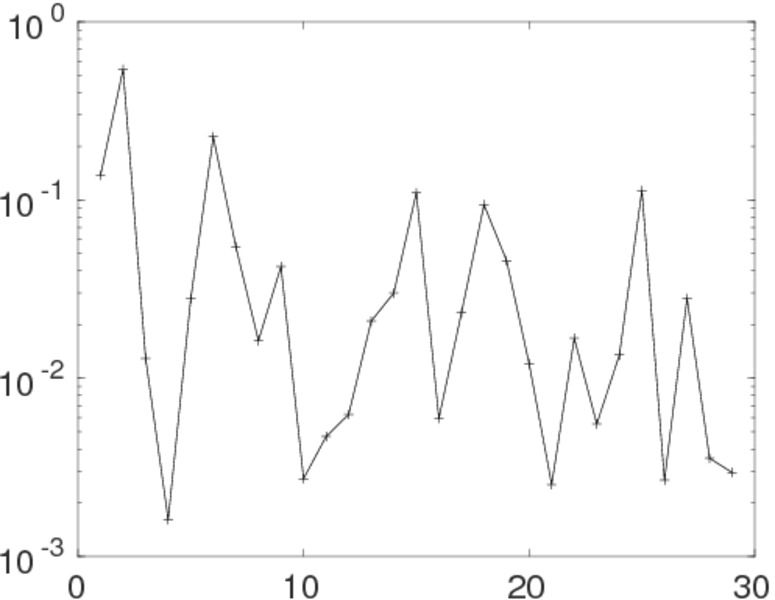
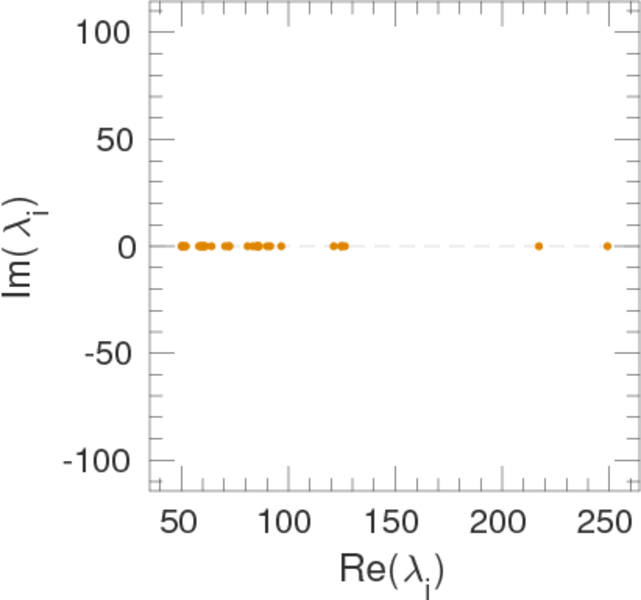
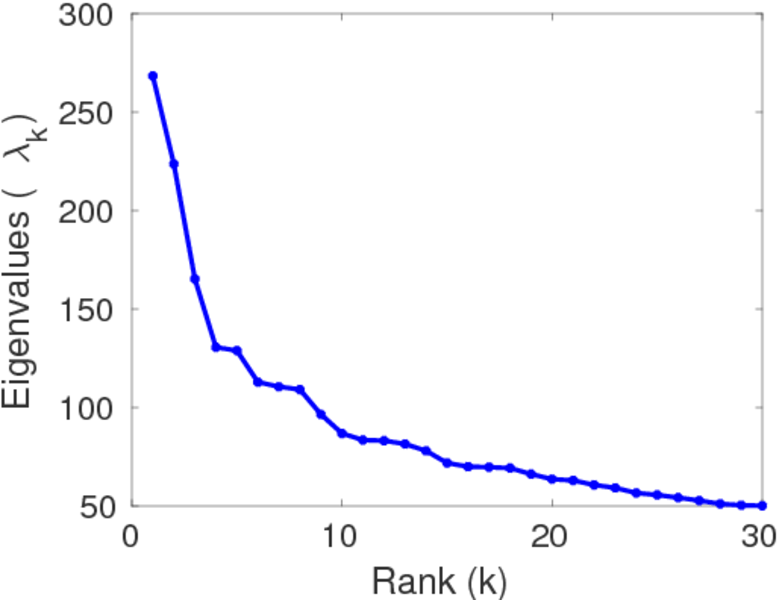
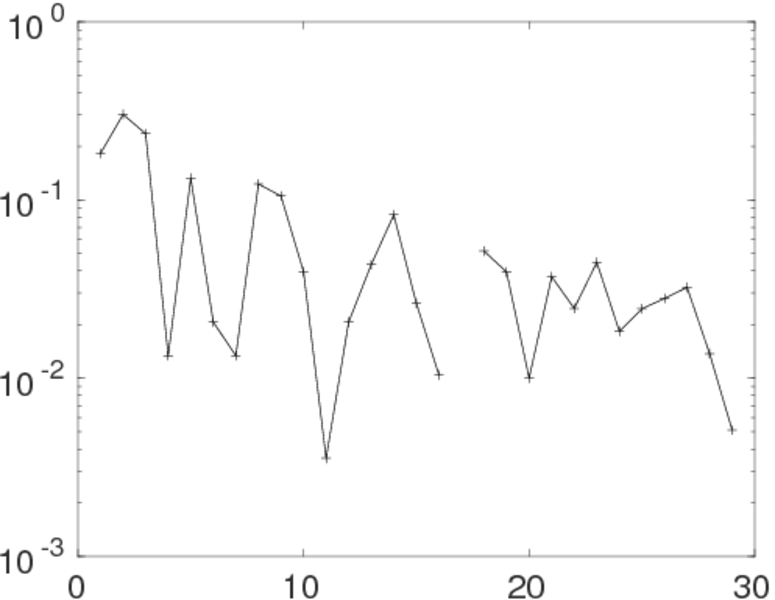
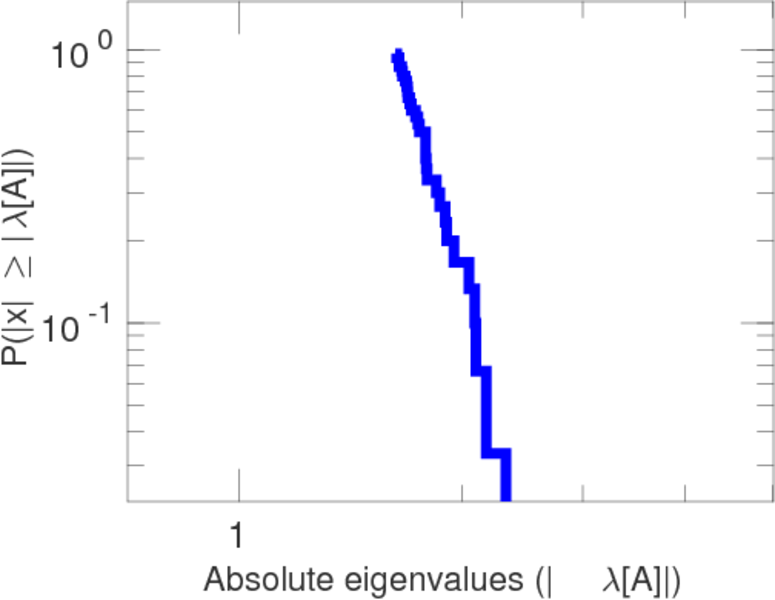
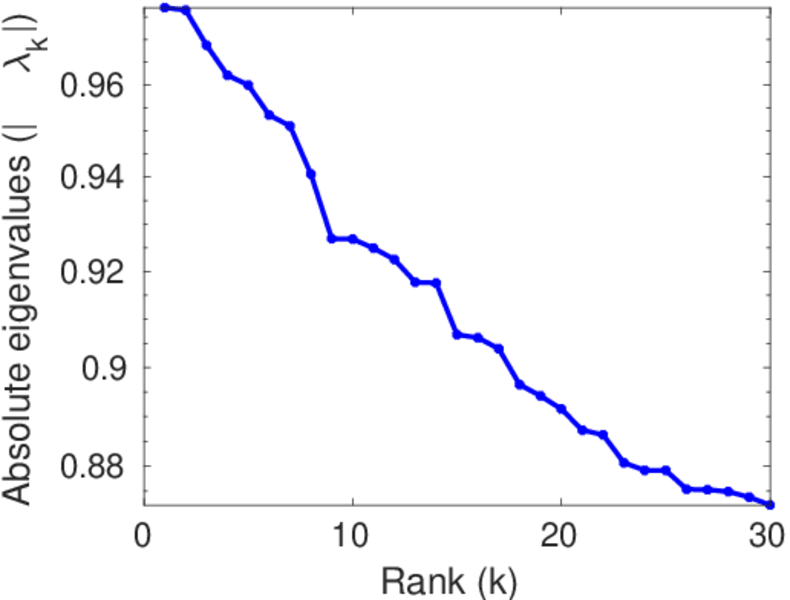
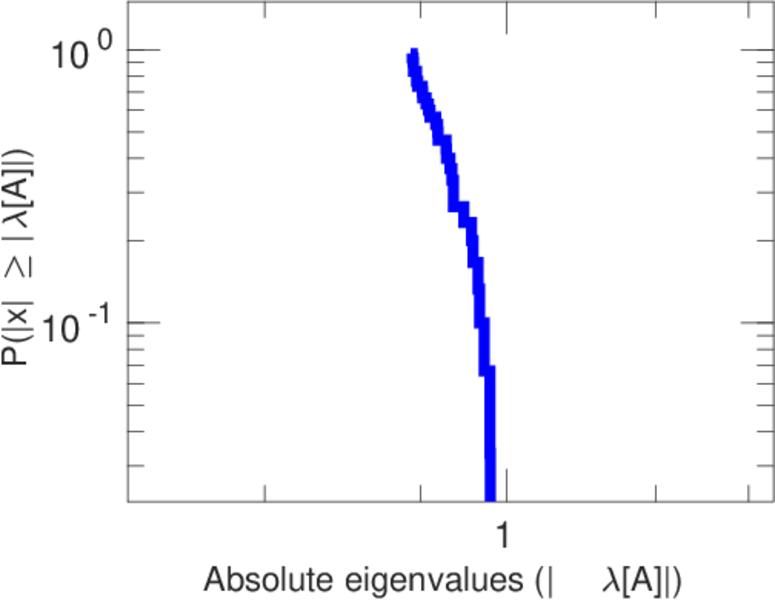
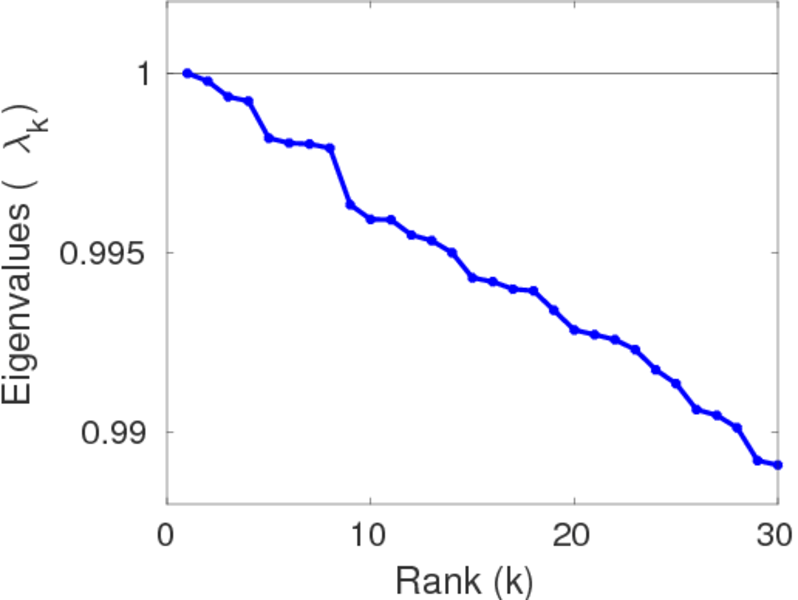
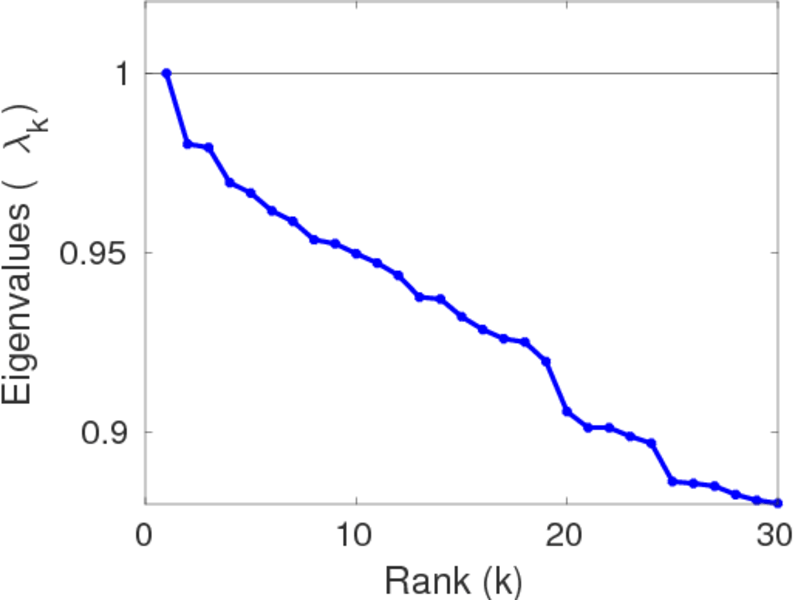
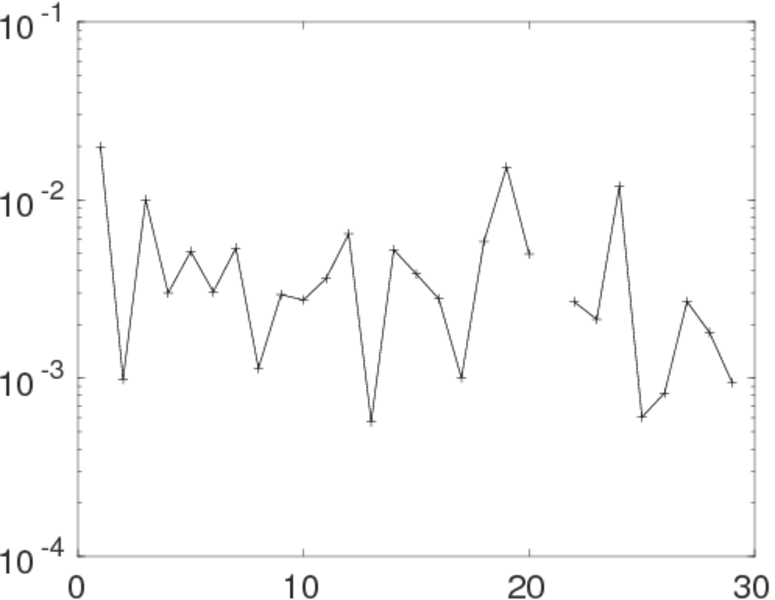
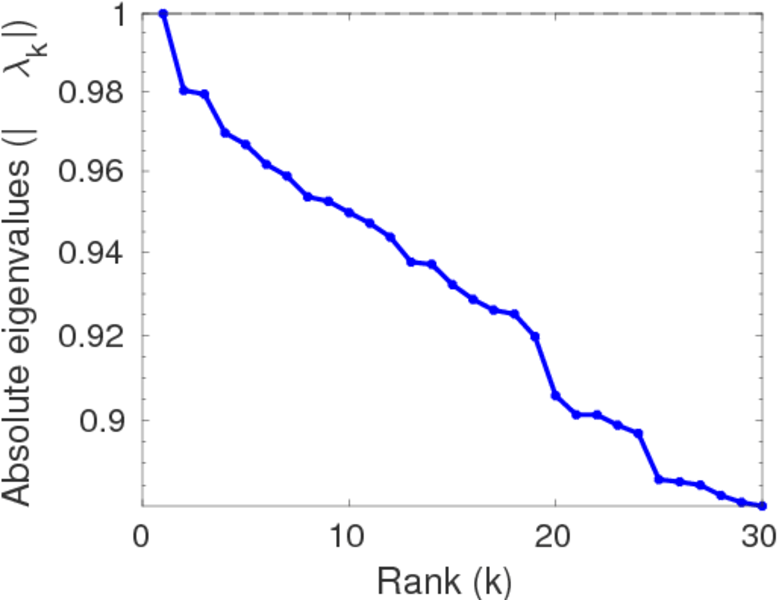
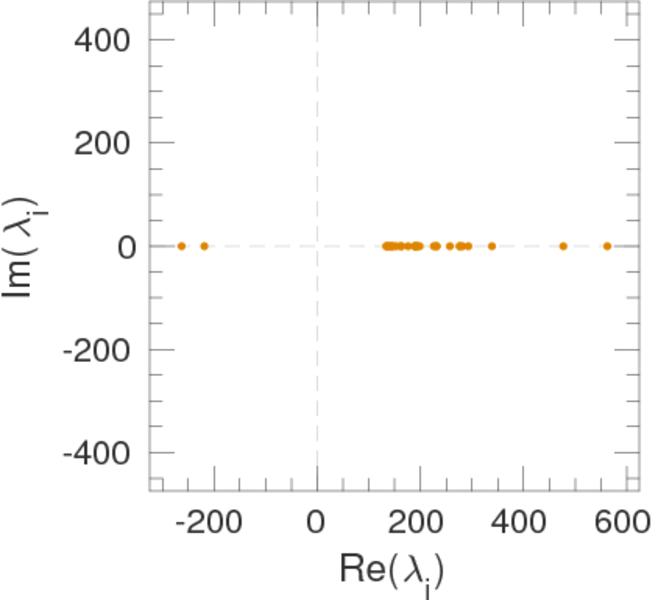
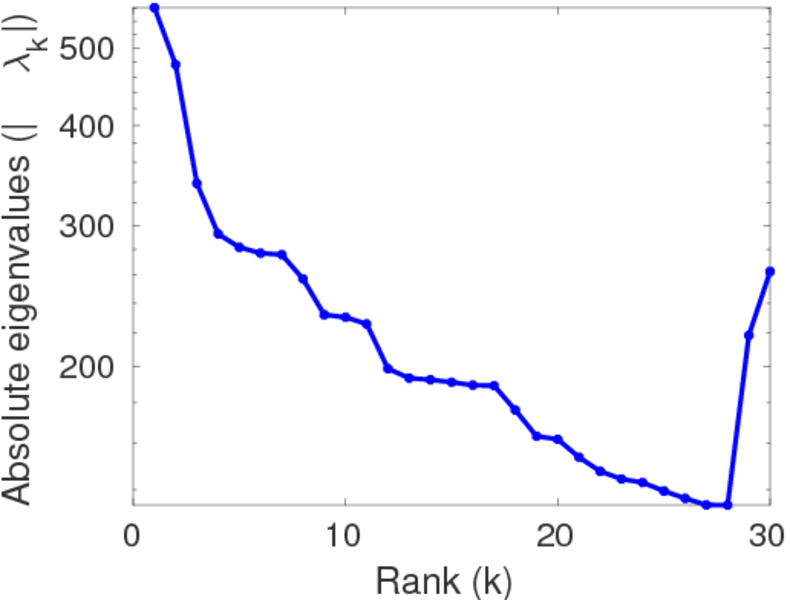
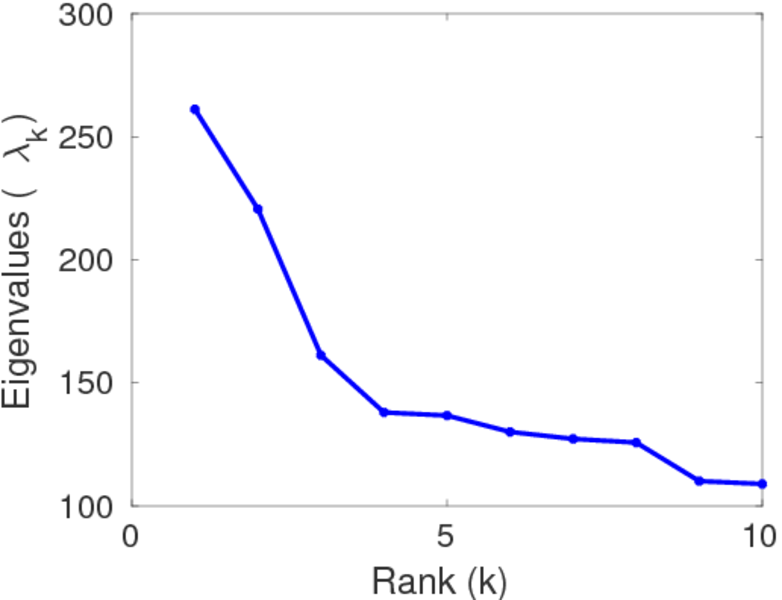
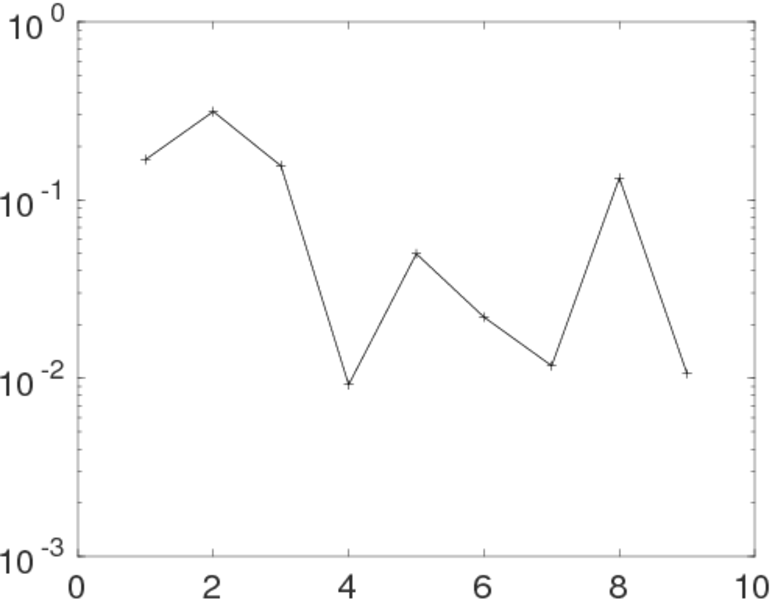
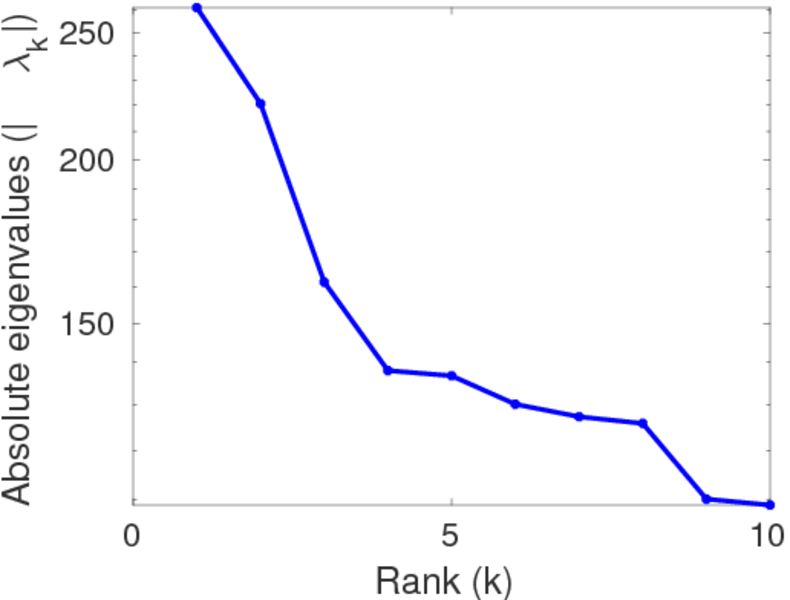
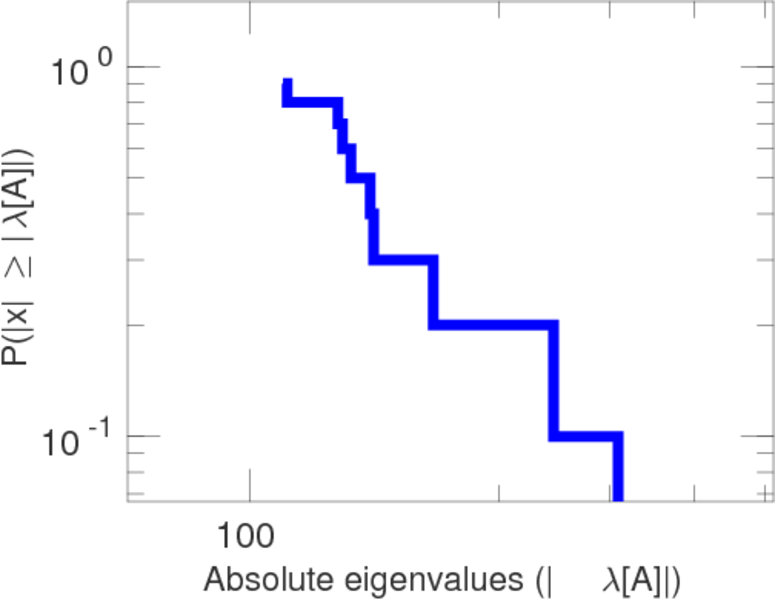
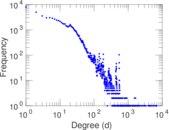
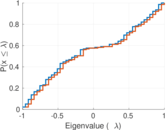
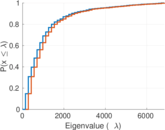
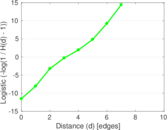
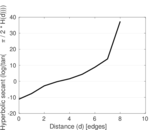
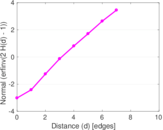
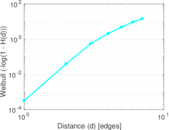
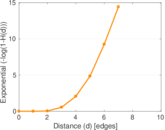
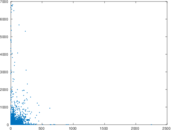
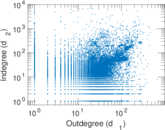
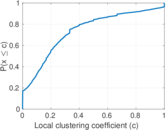
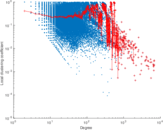
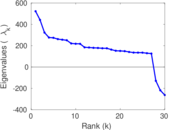
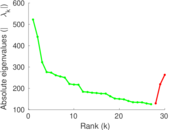
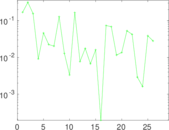
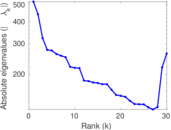
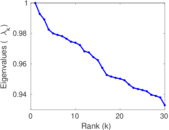
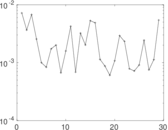
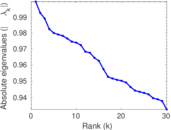
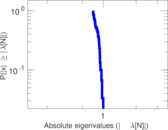
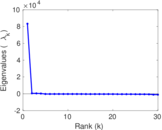
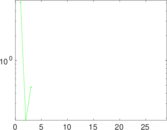
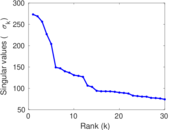
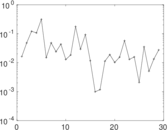
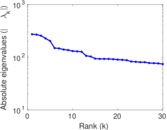
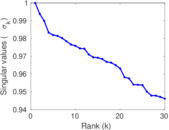
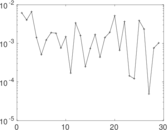
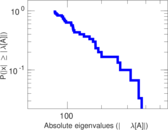
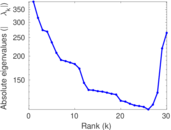
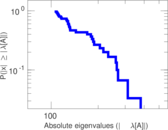
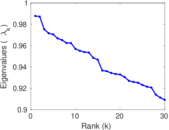
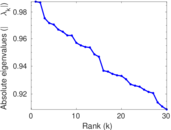
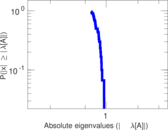
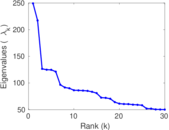
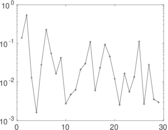
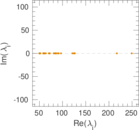
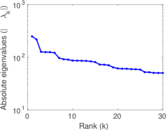
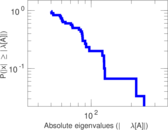
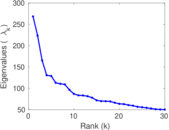
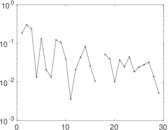
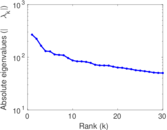
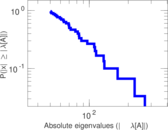
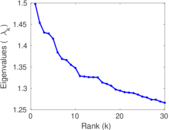
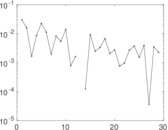
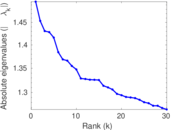
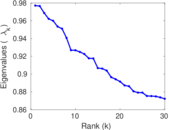
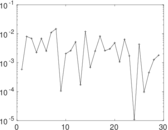
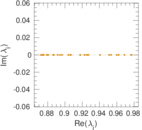
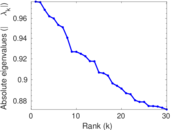
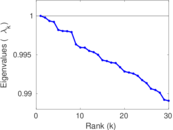
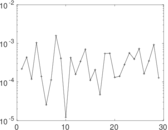
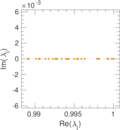
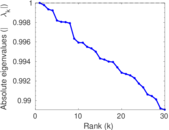
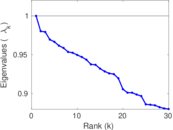
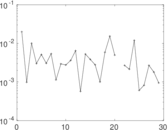
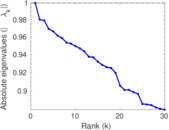
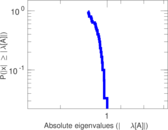
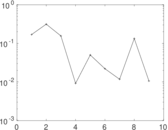
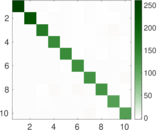
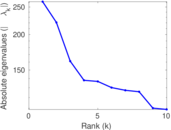
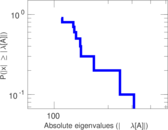
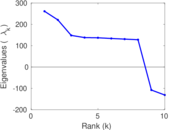
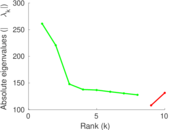
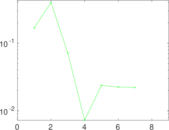
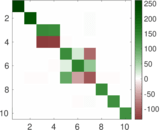
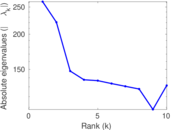
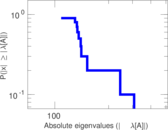
Plots


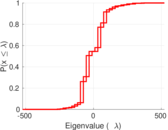
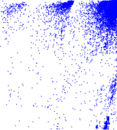
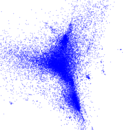


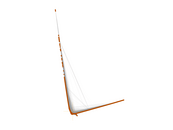
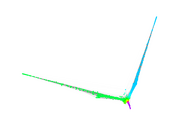

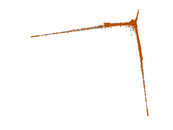


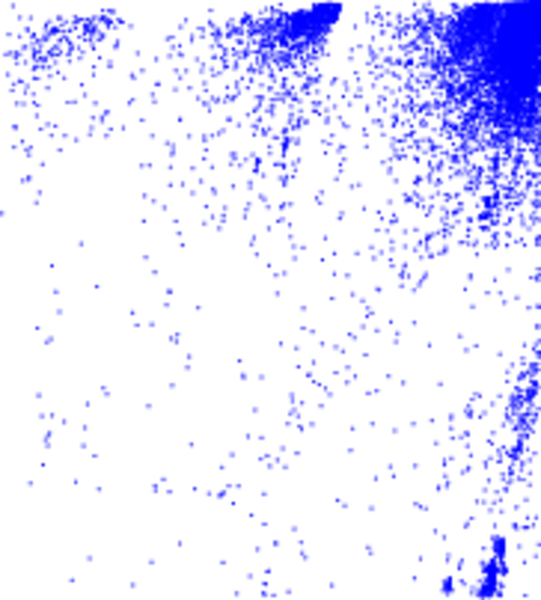
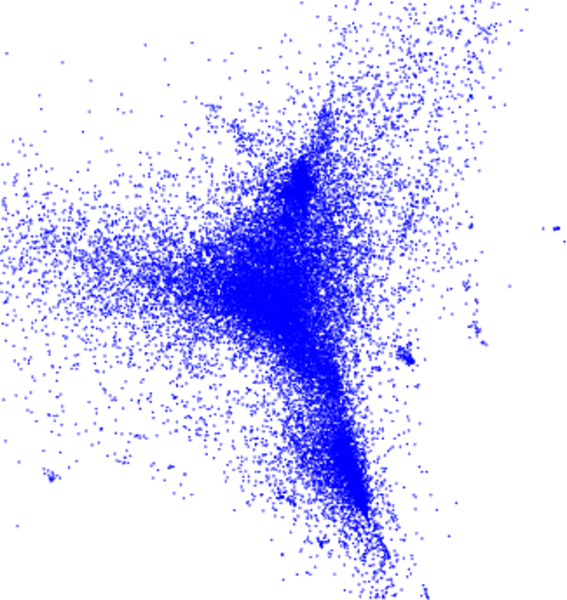
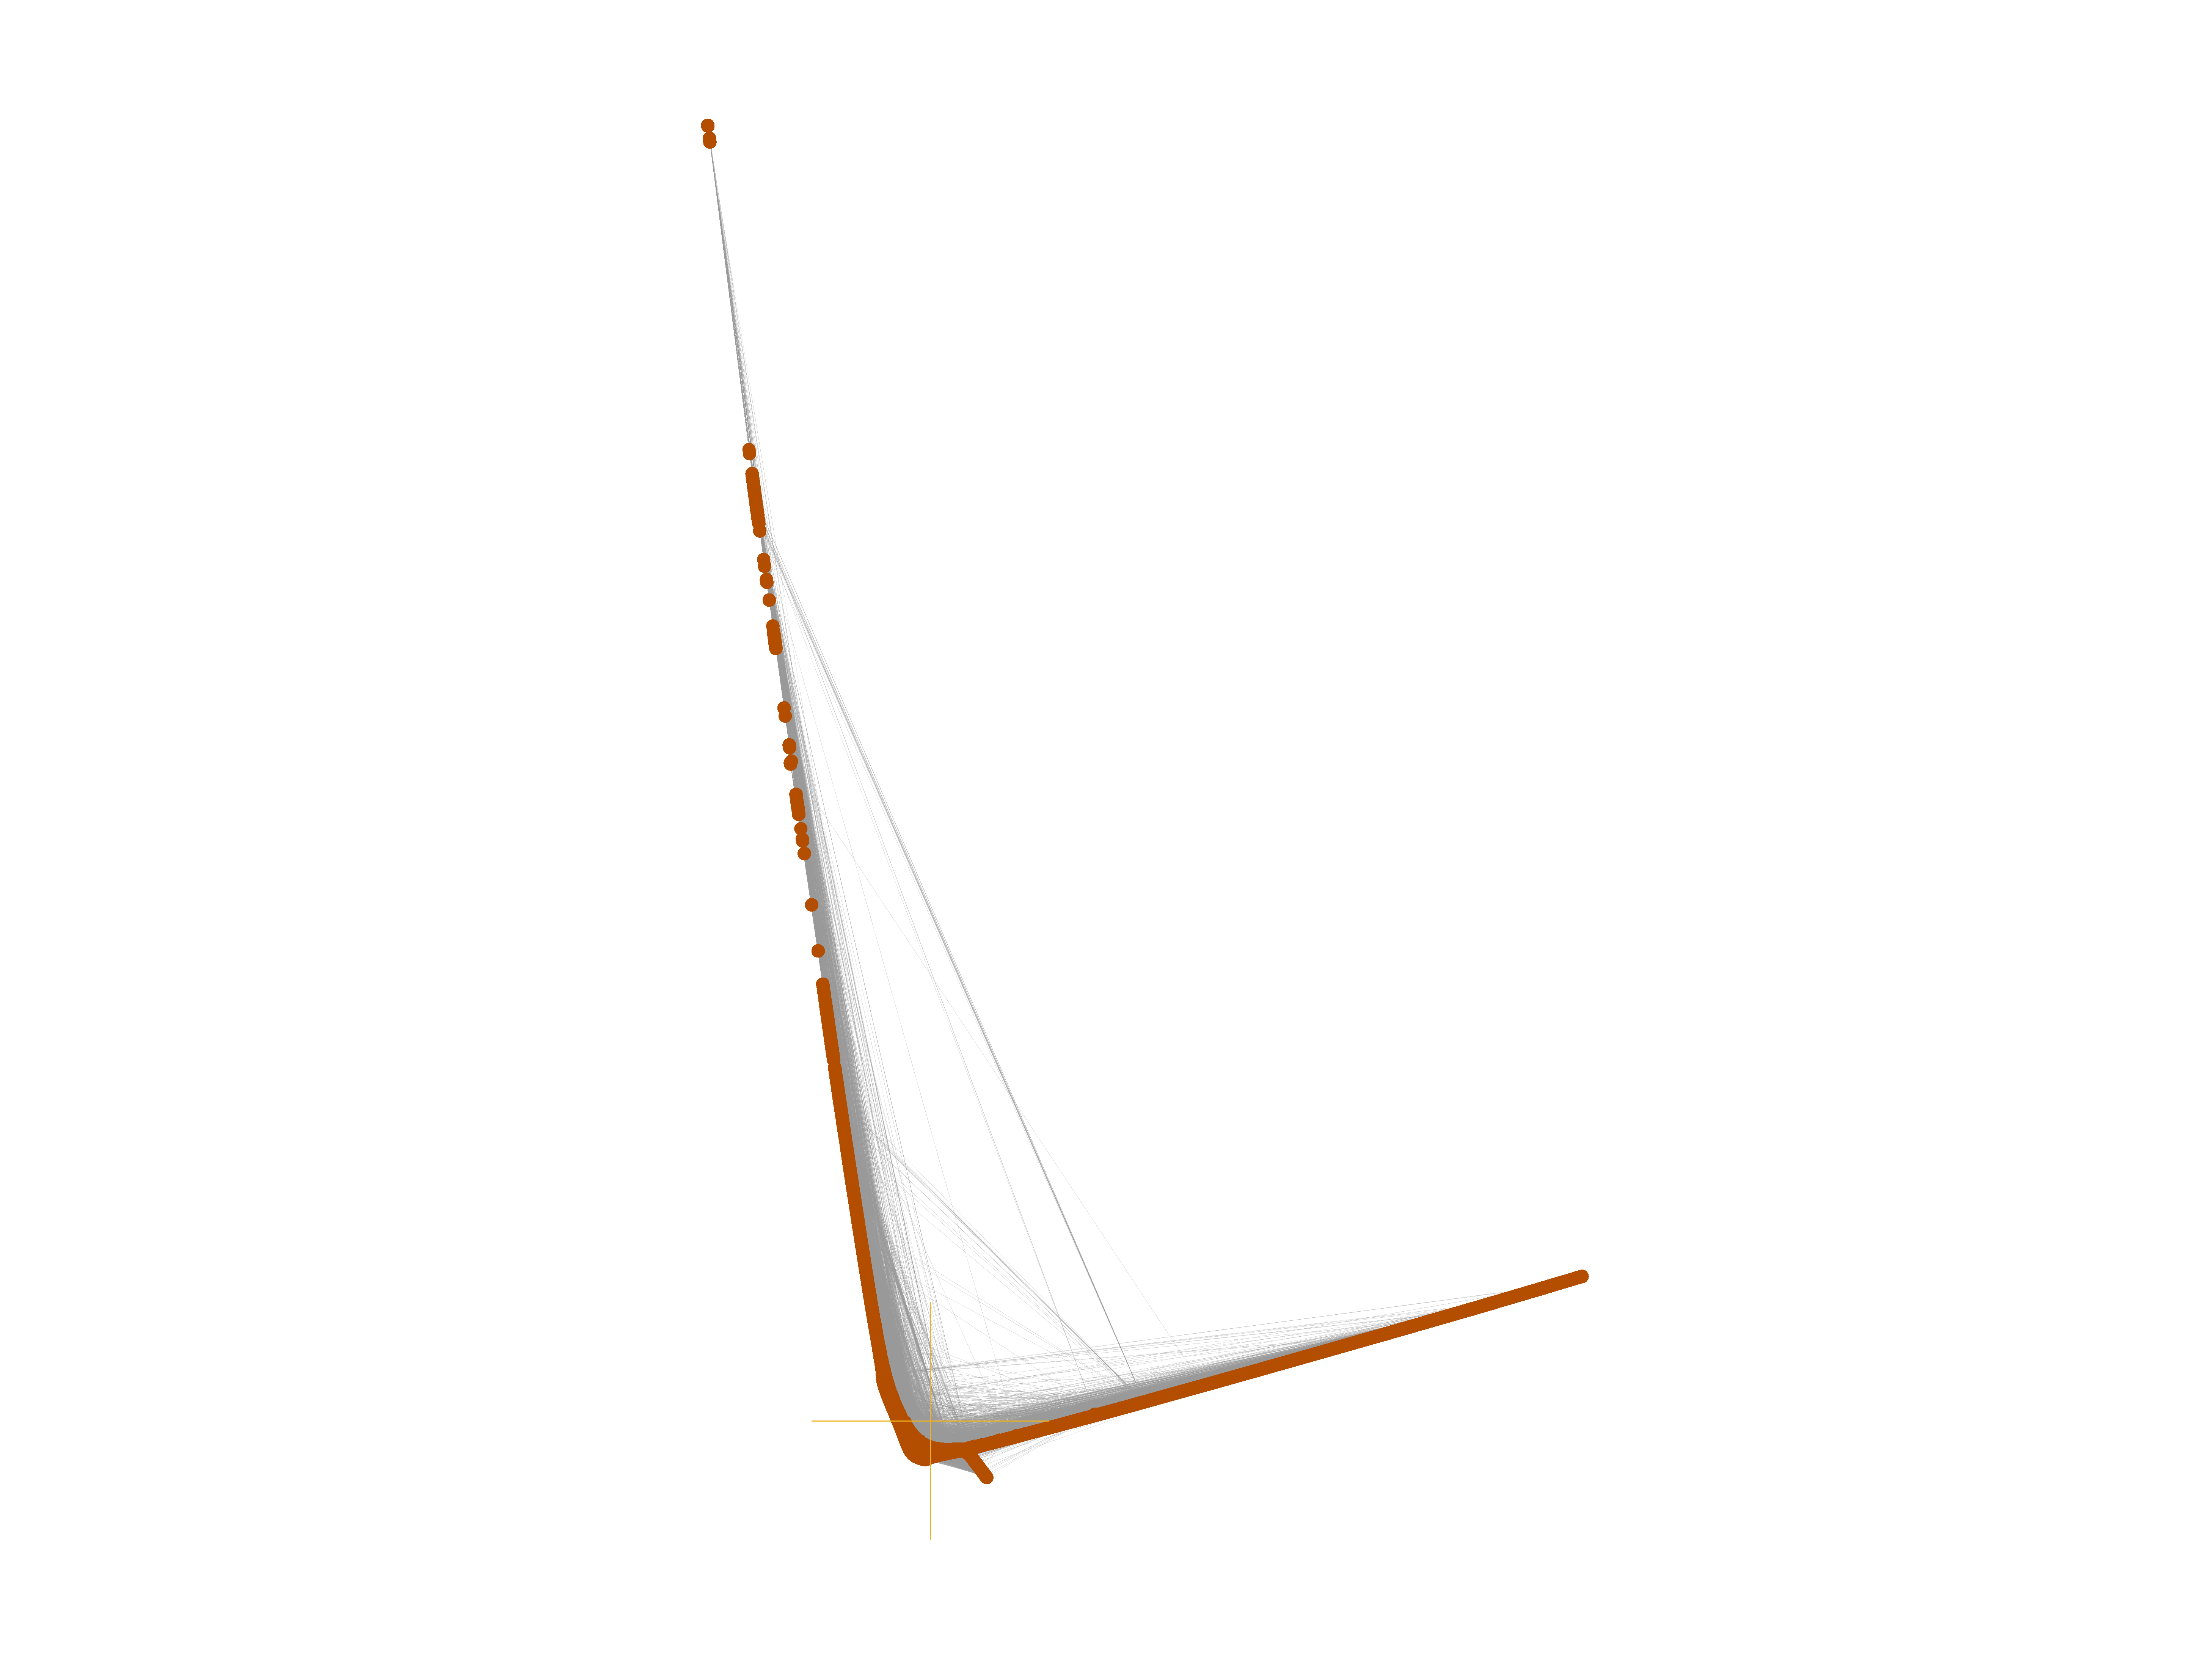
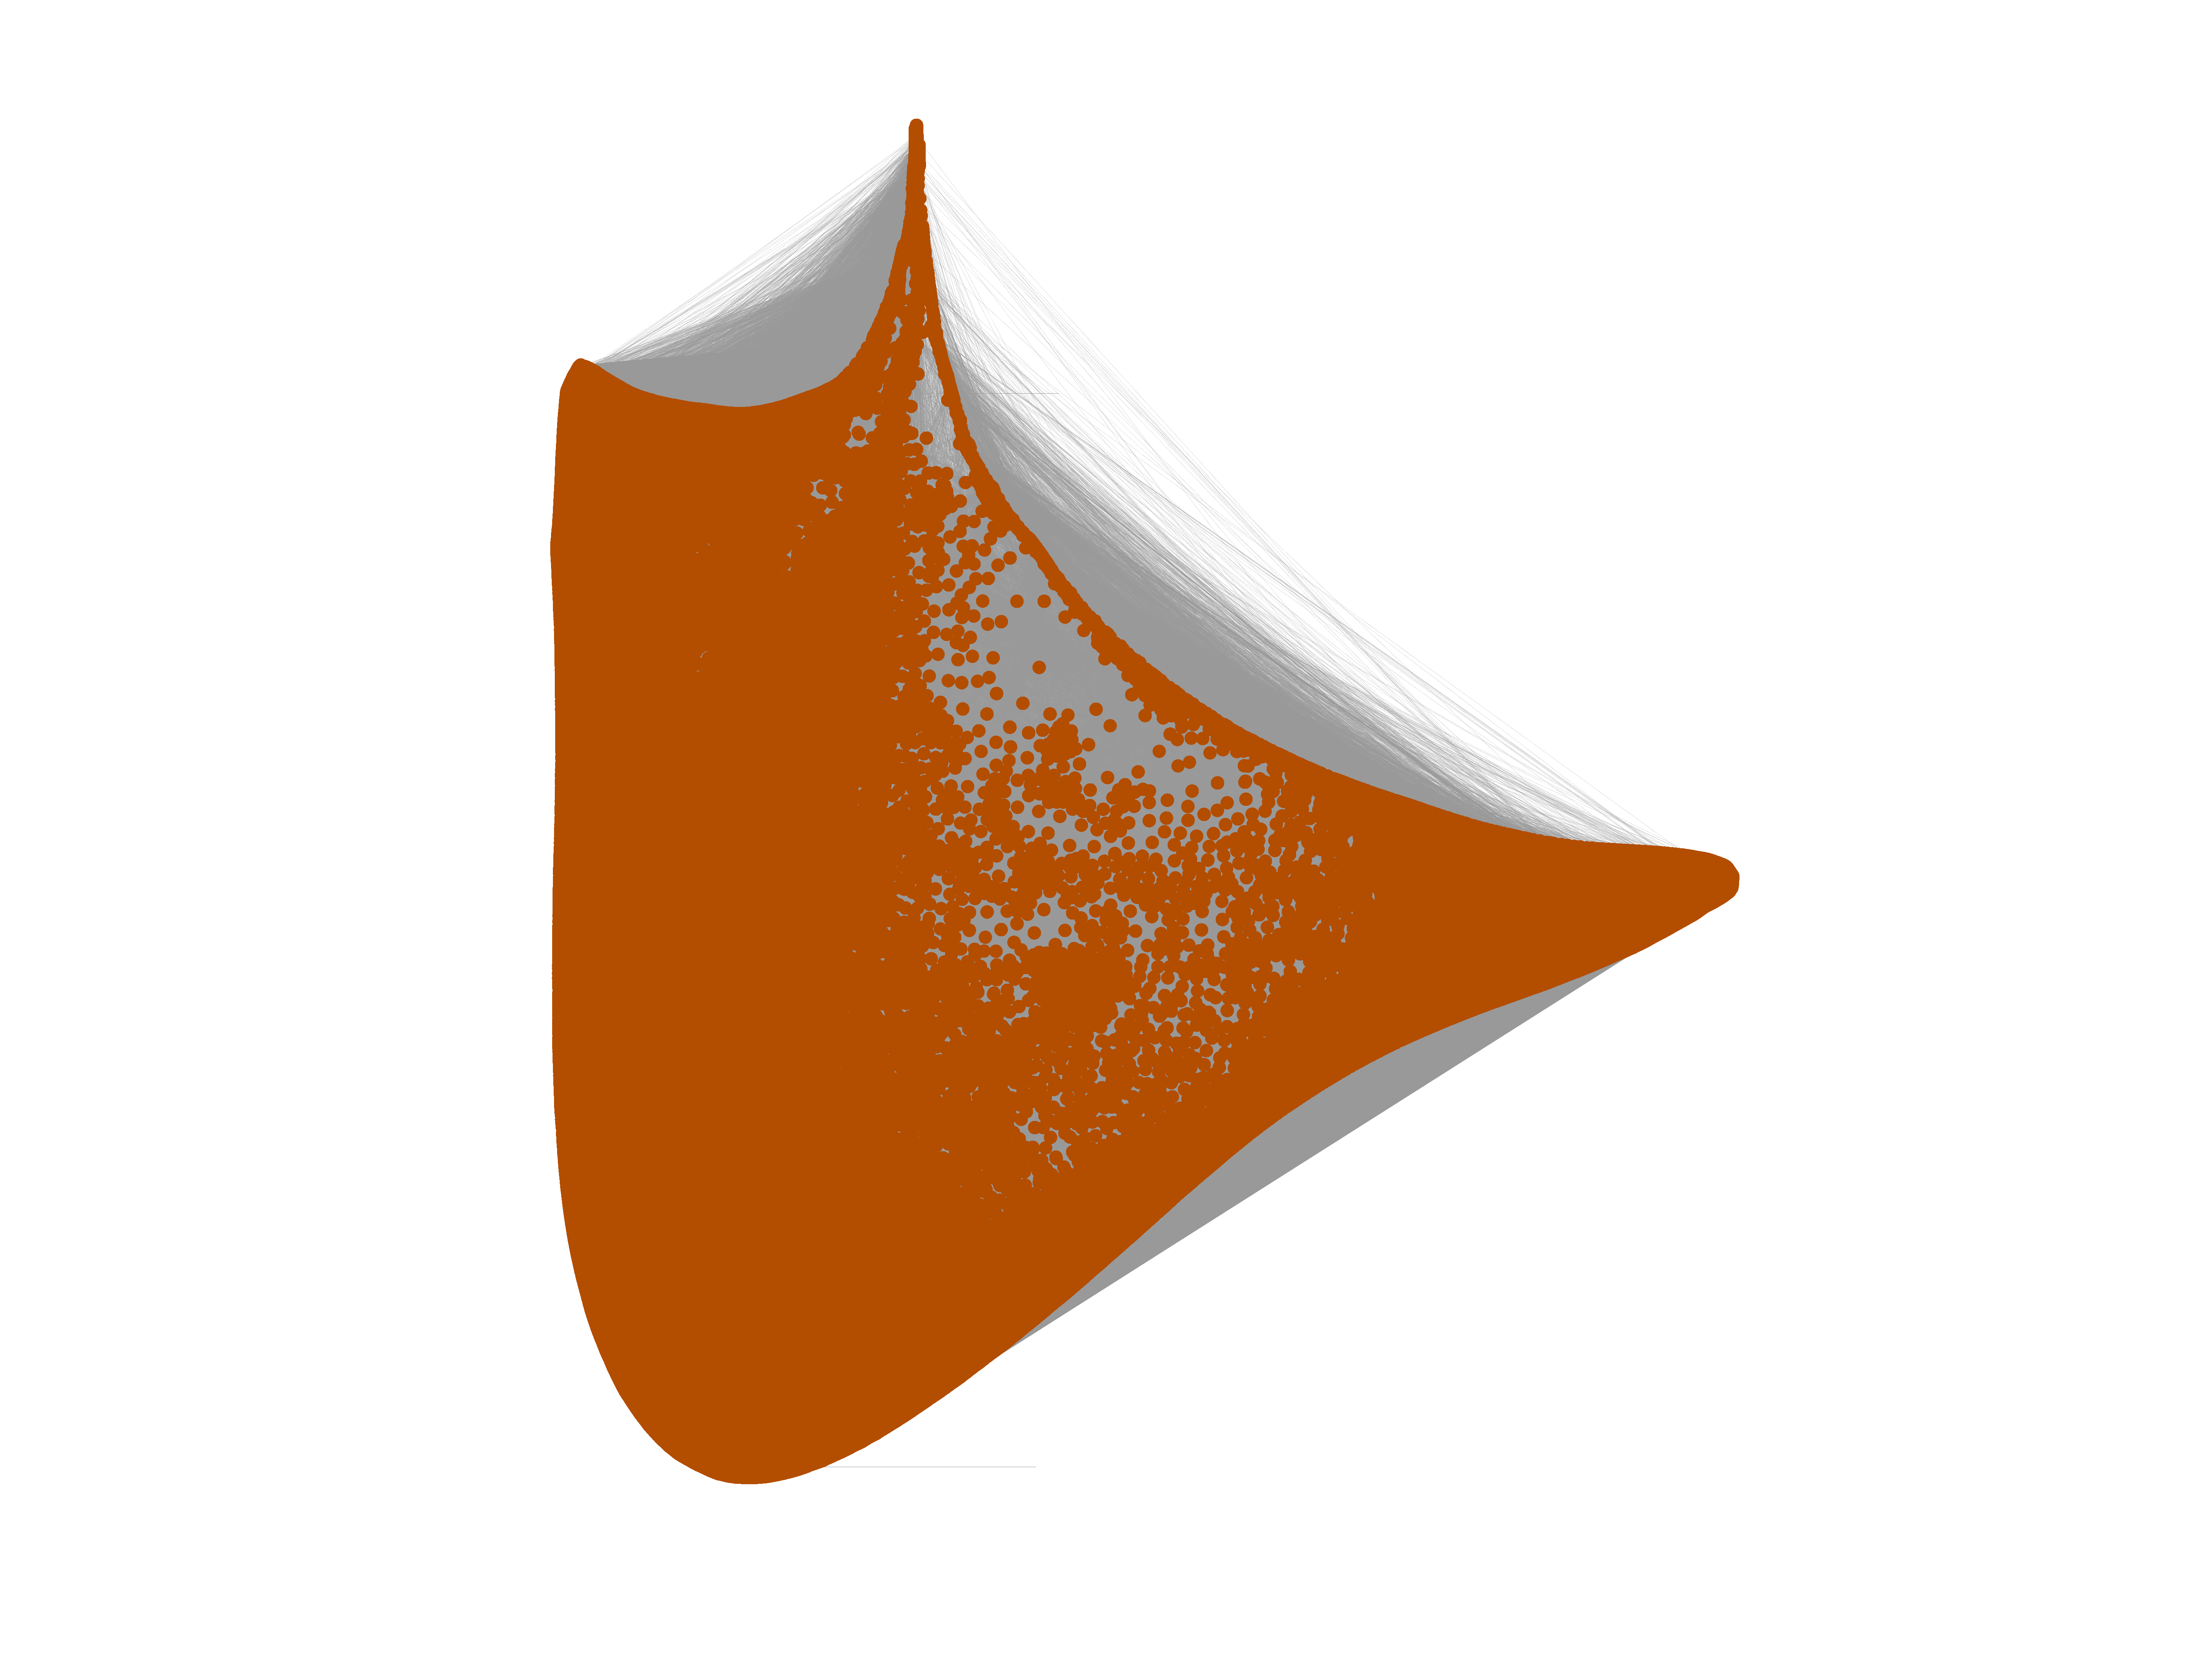
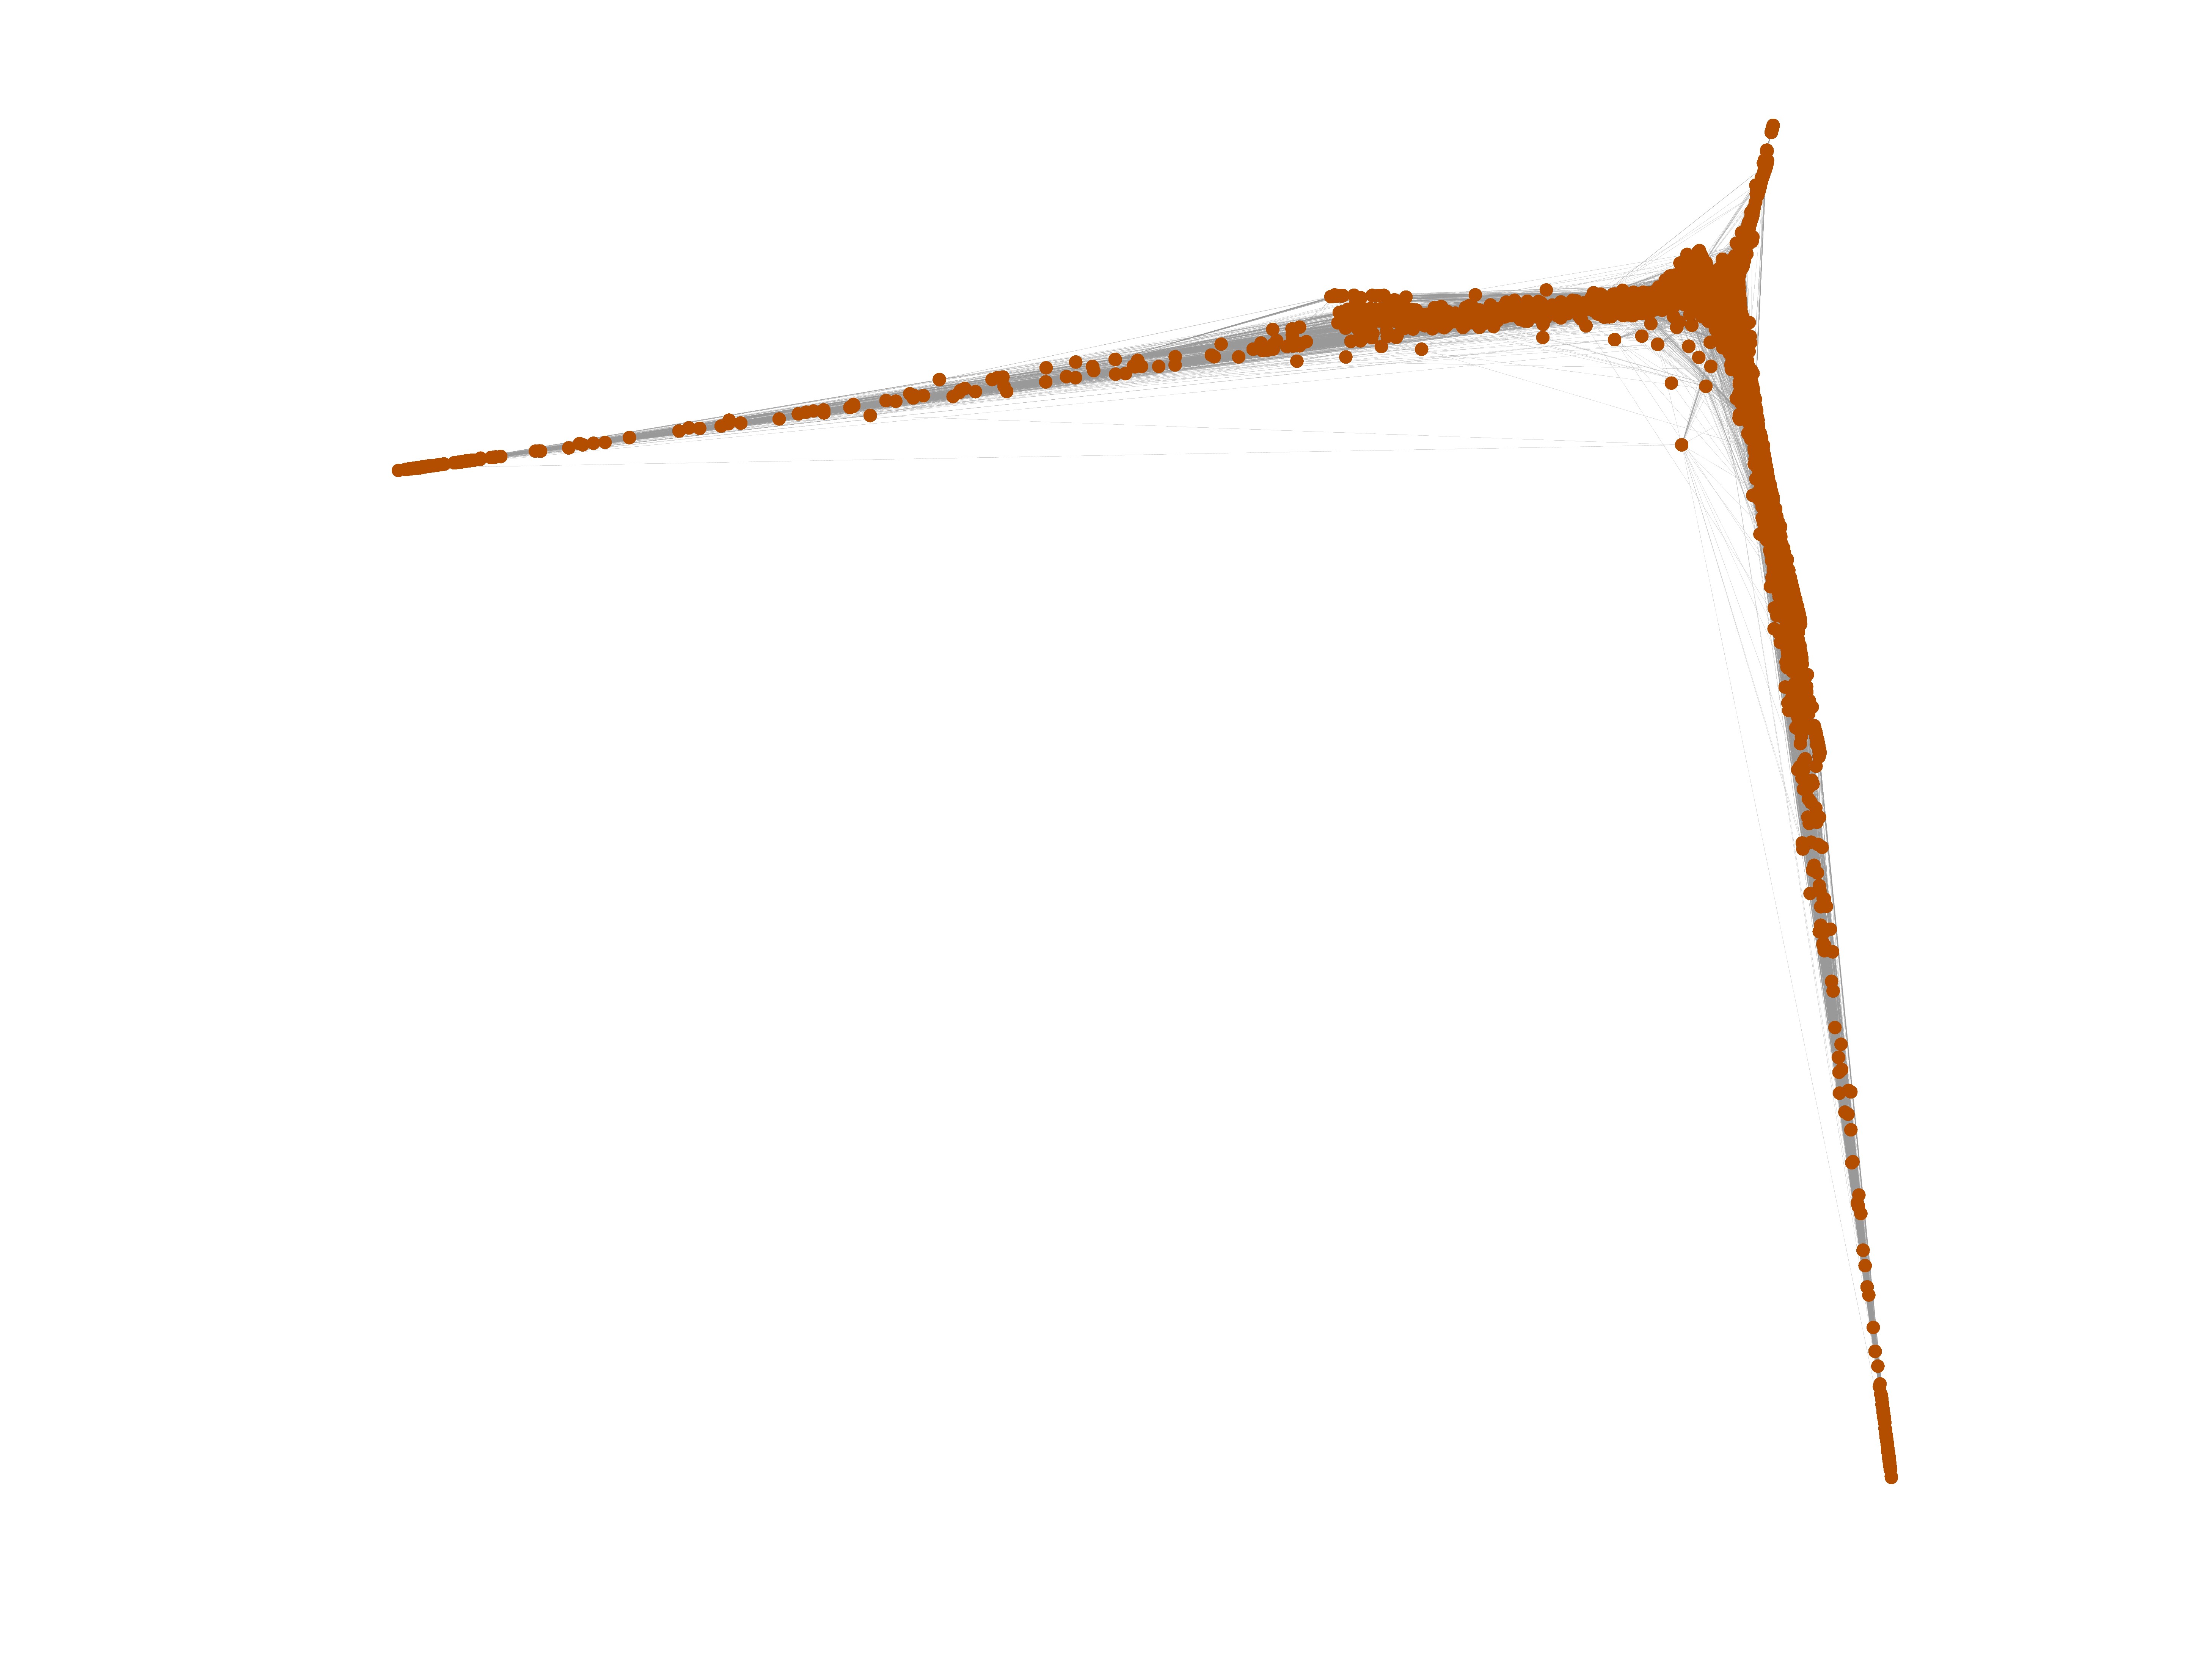
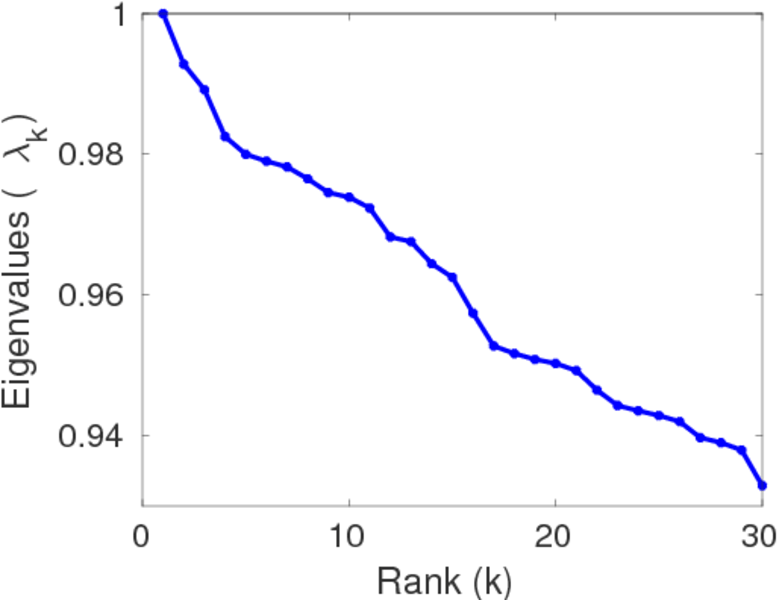
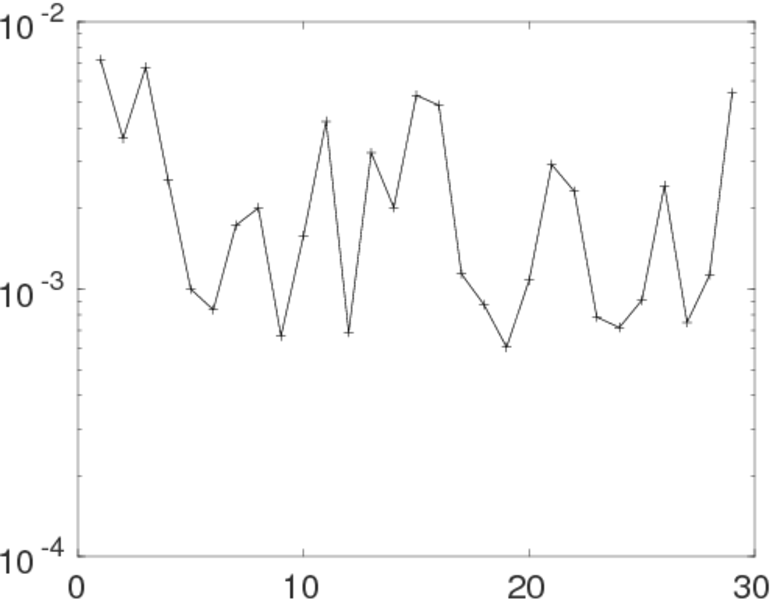
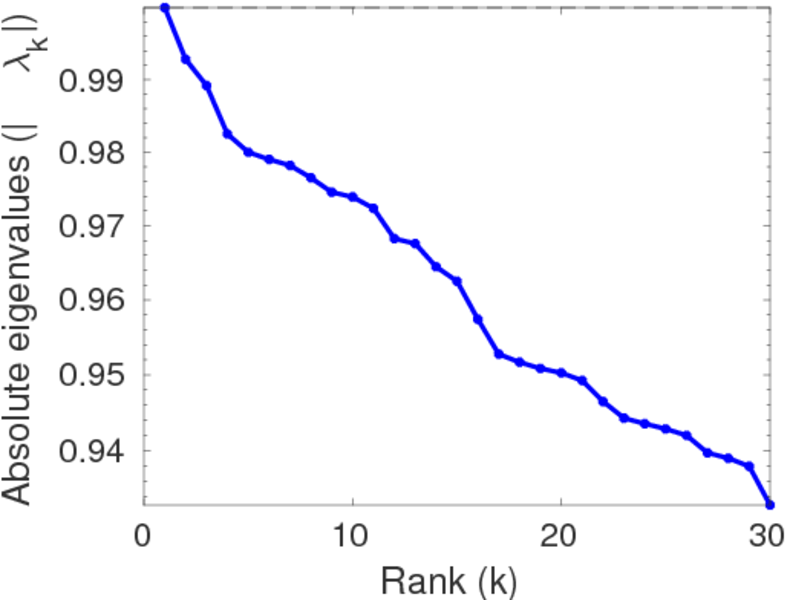
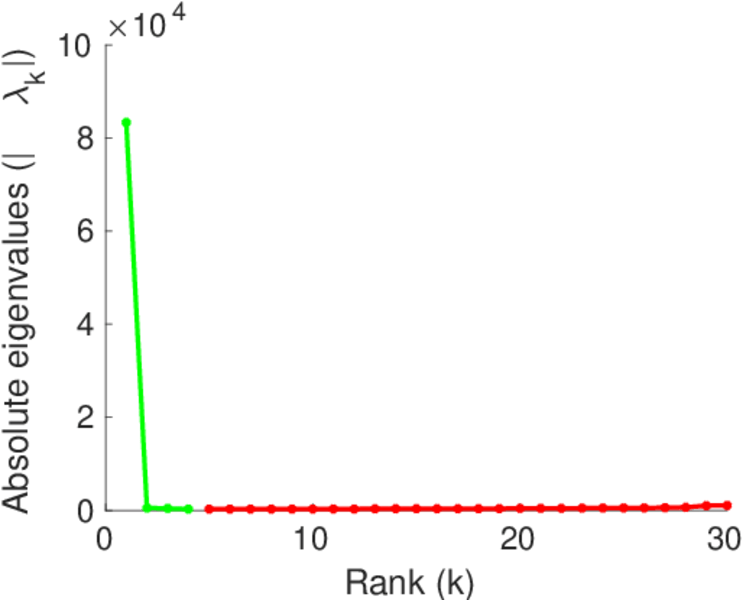
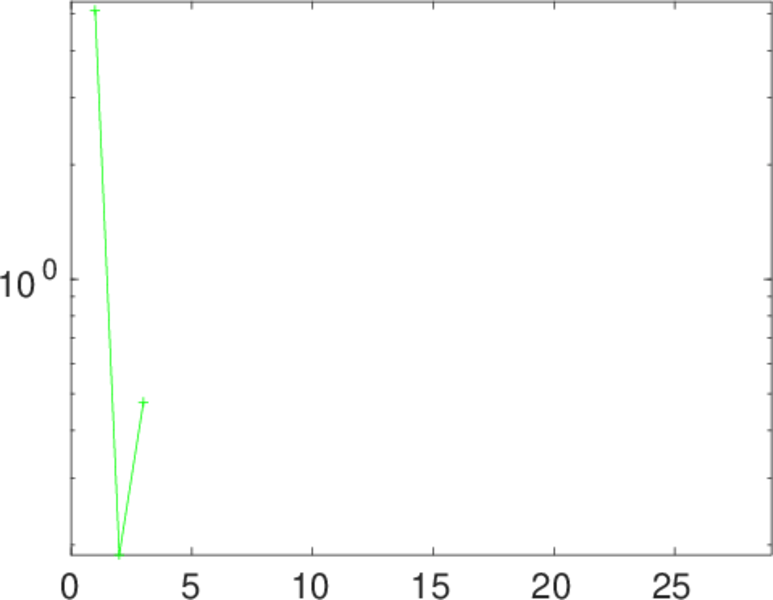
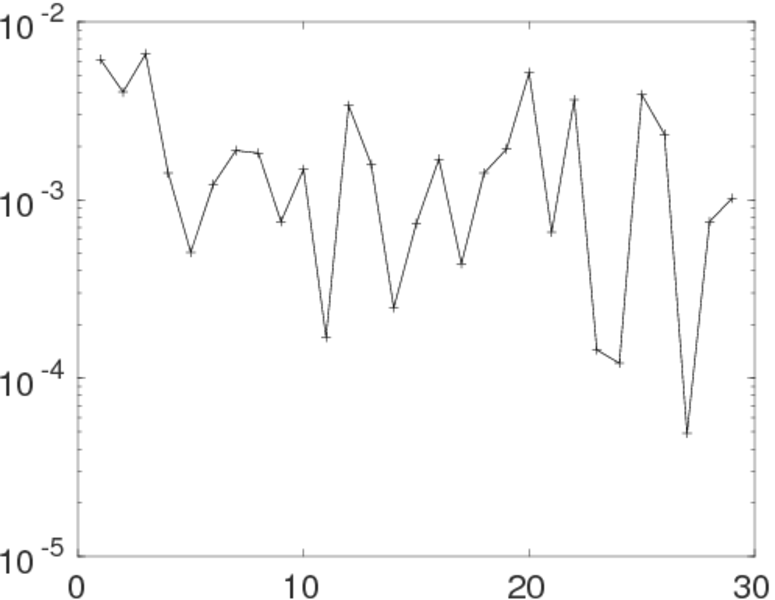
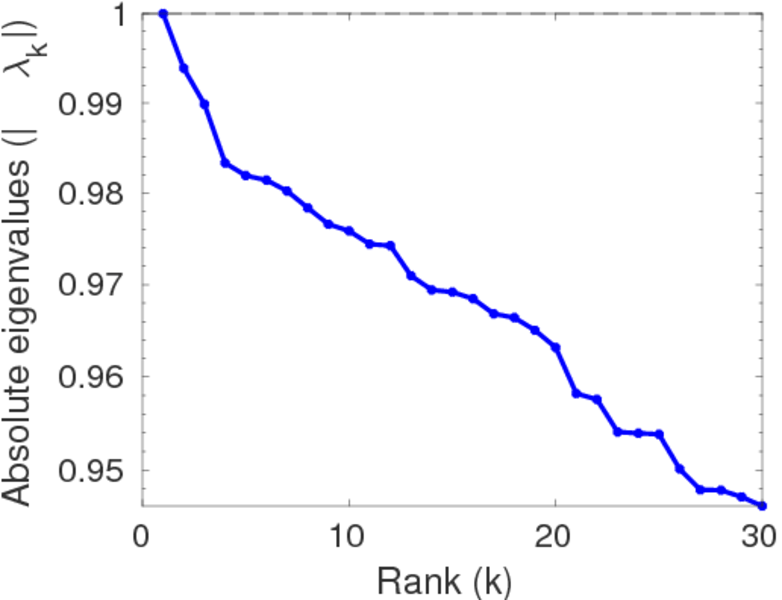
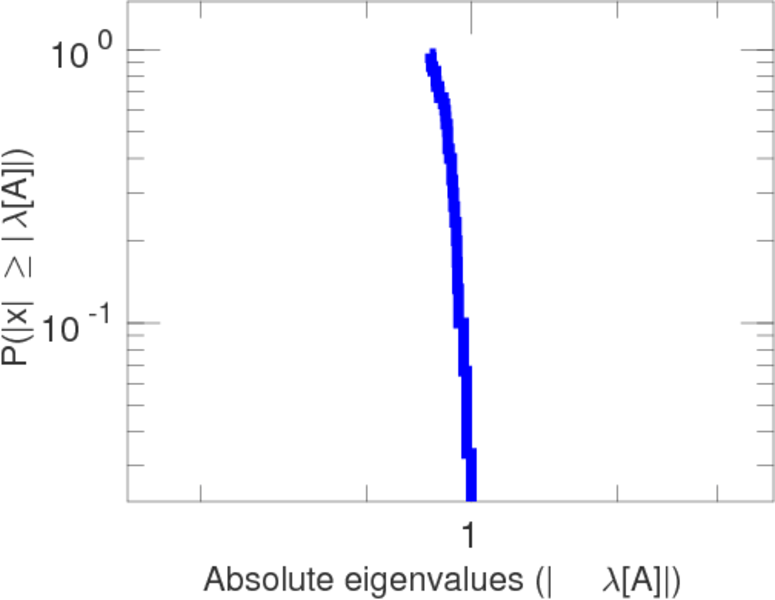
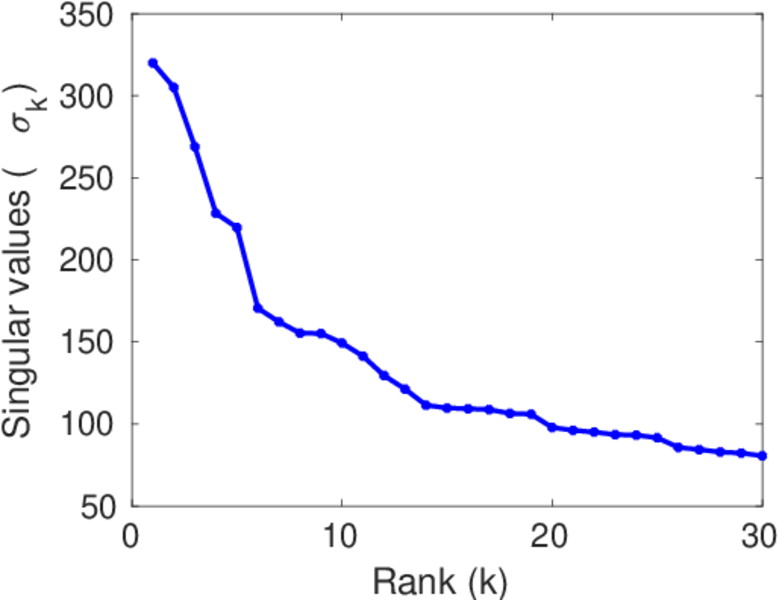
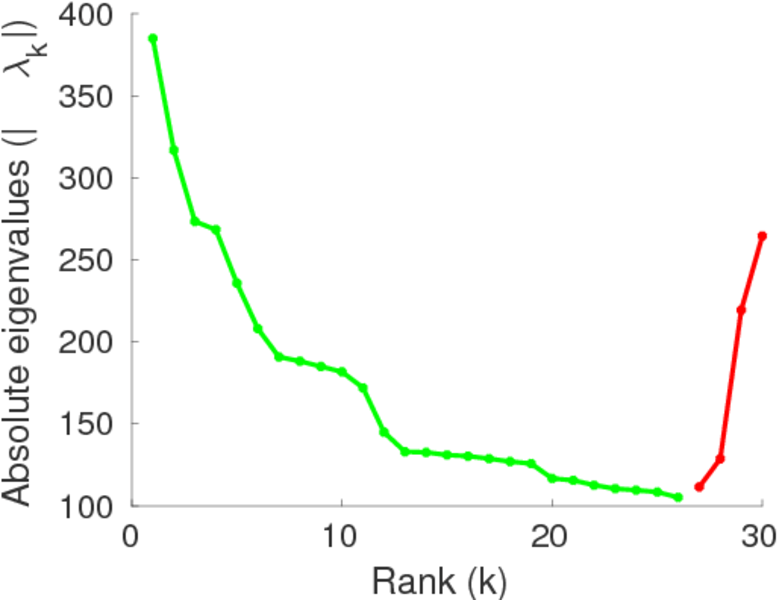
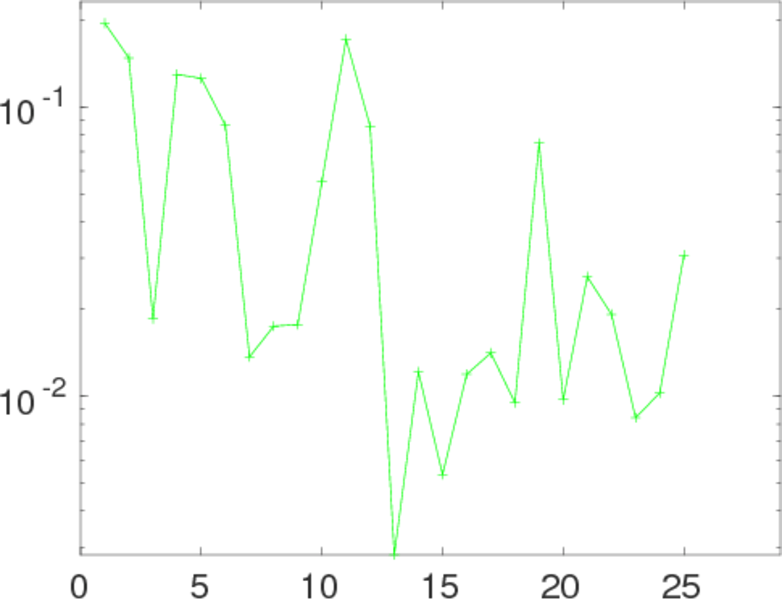
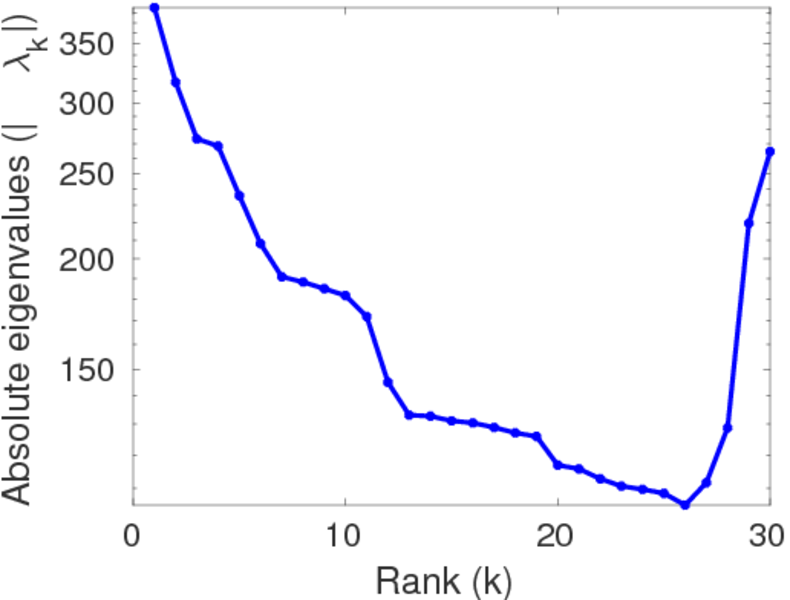
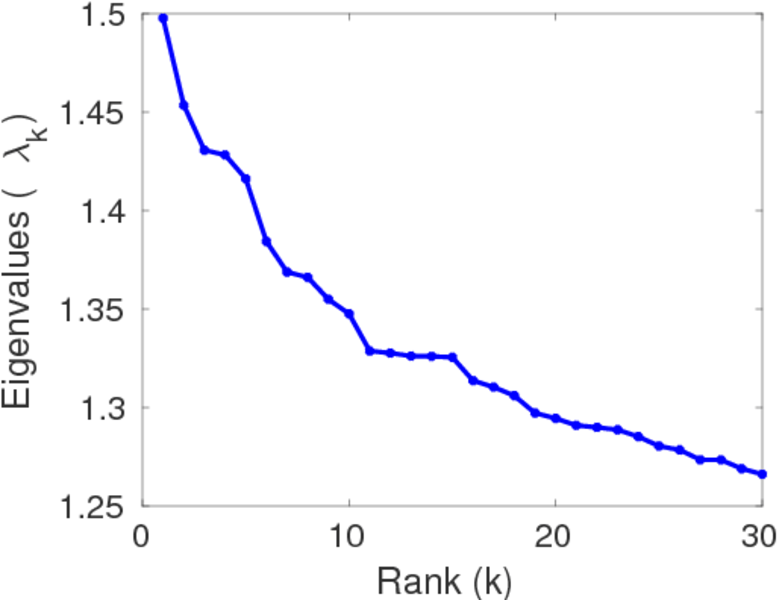
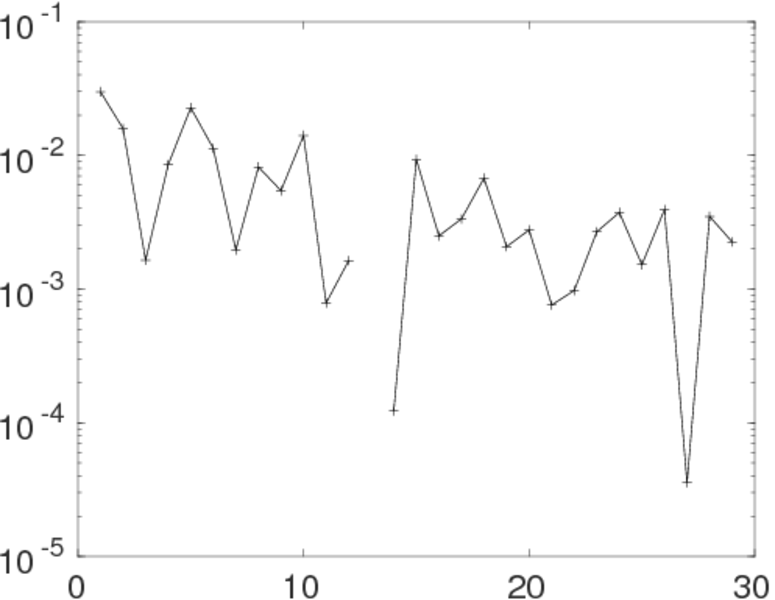
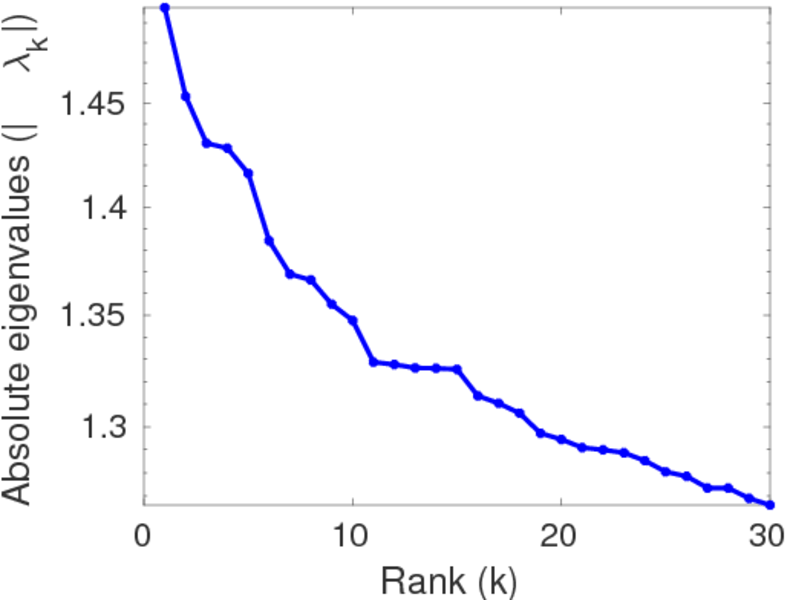
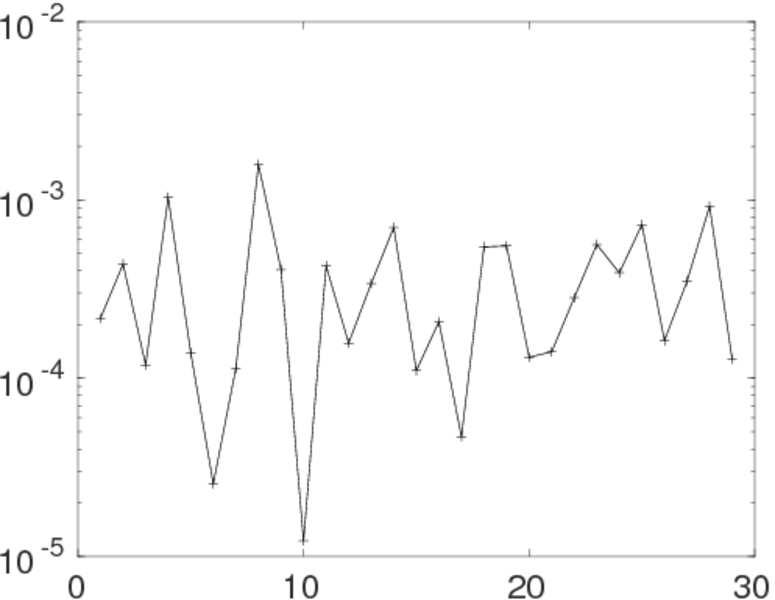
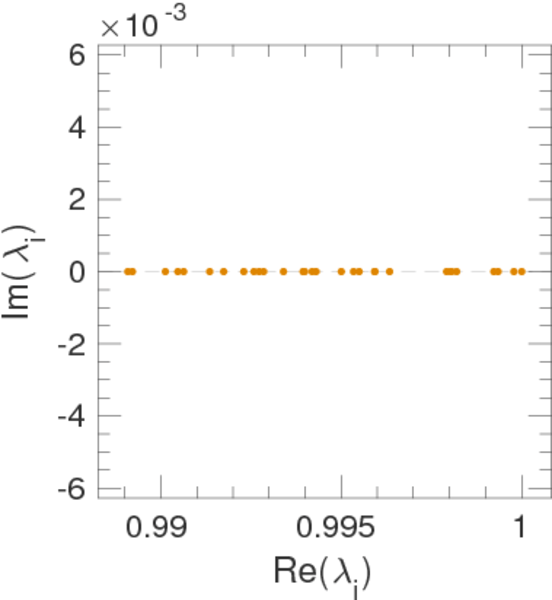
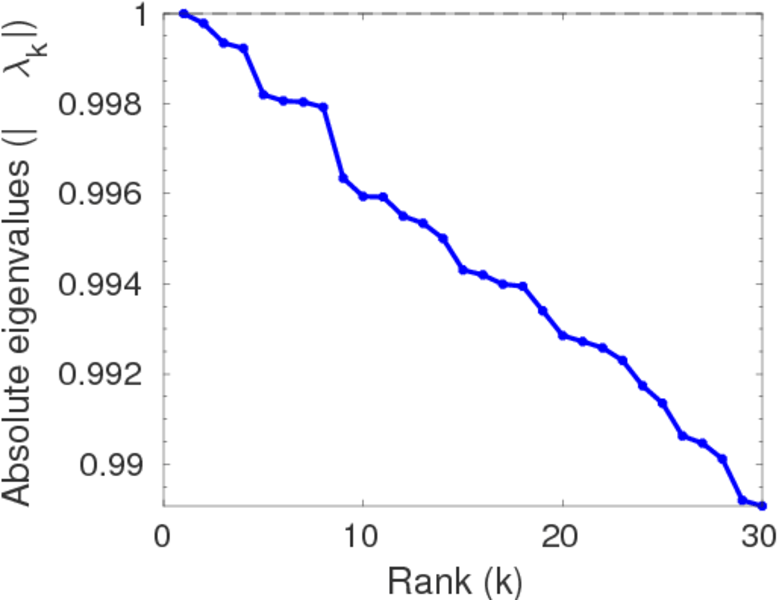
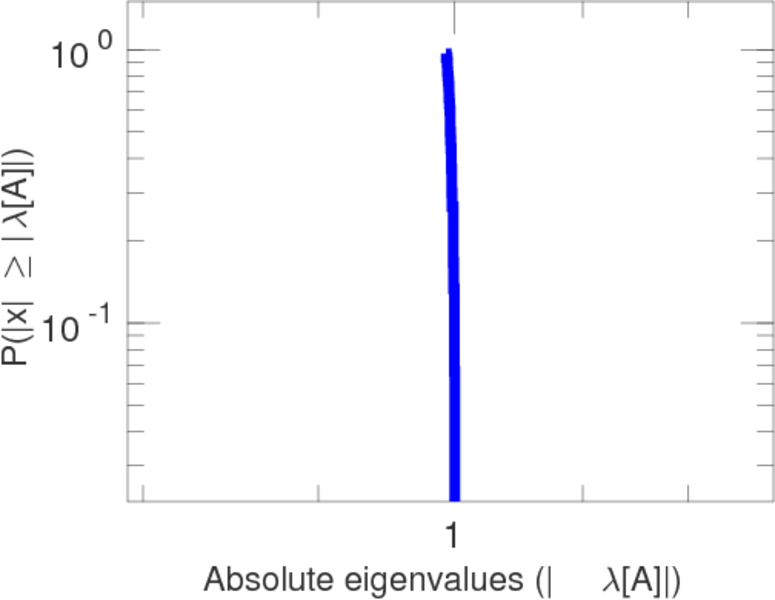
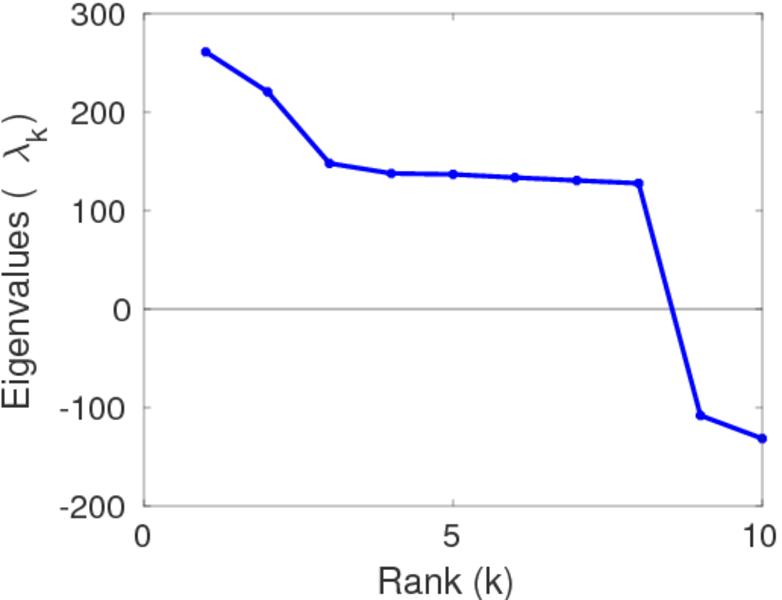
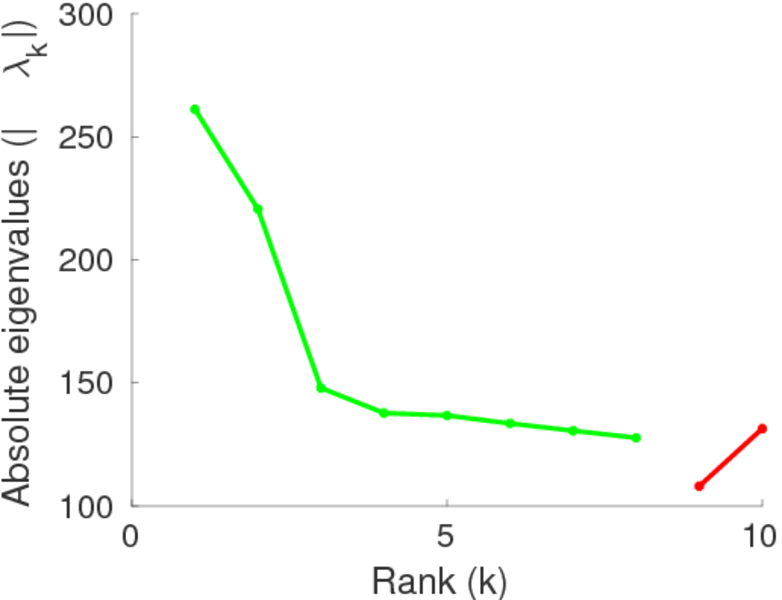
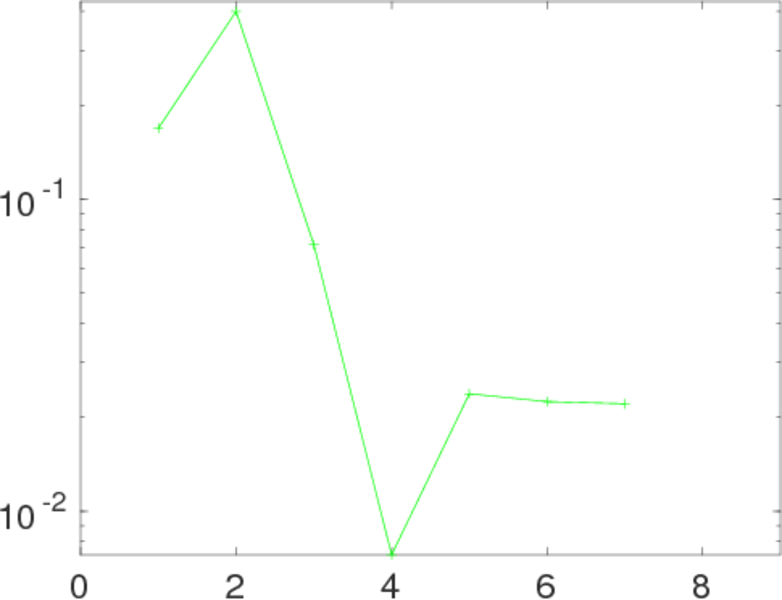
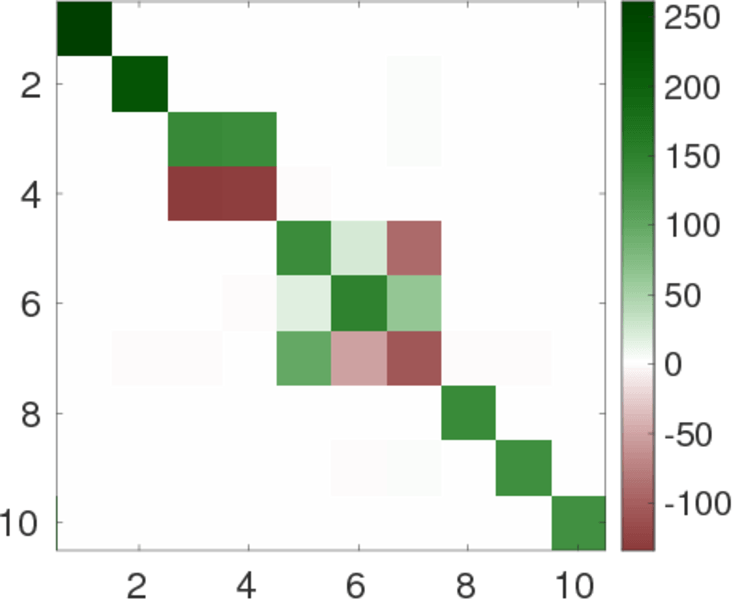
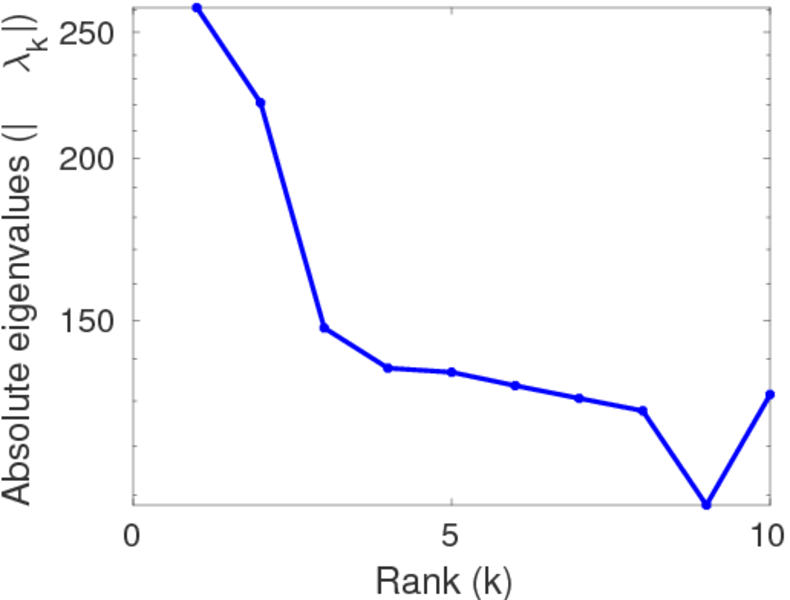
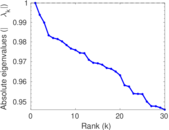
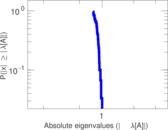
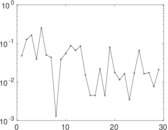
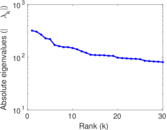
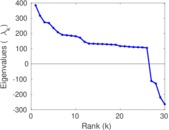
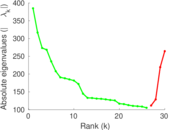
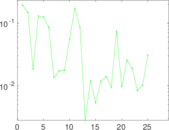
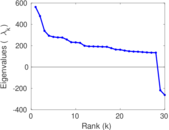
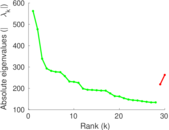
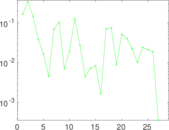
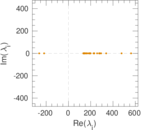
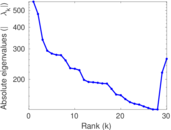
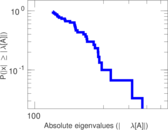
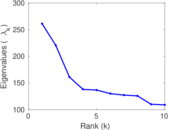
Matrix decompositions plots


Downloads
References
|
[1]
|
Jérôme Kunegis.
KONECT – The Koblenz Network Collection.
In Proc. Int. Conf. on World Wide Web Companion, pages
1343–1350, 2013.
[ http ]
|
 KONECT ‣ Networks ‣
Buy Me a Coffee
KONECT ‣ Networks ‣
Buy Me a Coffee