Wikipedia links (ga)
This network consists of the wikilinks of the Wikipedia in the Irish language
(ga). Nodes are Wikipedia articles, and directed edges are wikilinks, i.e.,
hyperlinks within one wiki. In the wiki source, these are indicated with
[[double brackets]]. Only pages in the article namespace are included.
Metadata
Statistics
| Size | n = | 55,088
|
| Volume | m = | 1,611,606
|
| Wedge count | s = | 1,423,017,598
|
| Cross count | x = | 79,892,283,648,761,760
|
| Triangle count | t = | 68,078,381
|
| Square count | q = | 29,035,376,699
|
| 4-Tour count | T4 = | 235,587,102,986
|
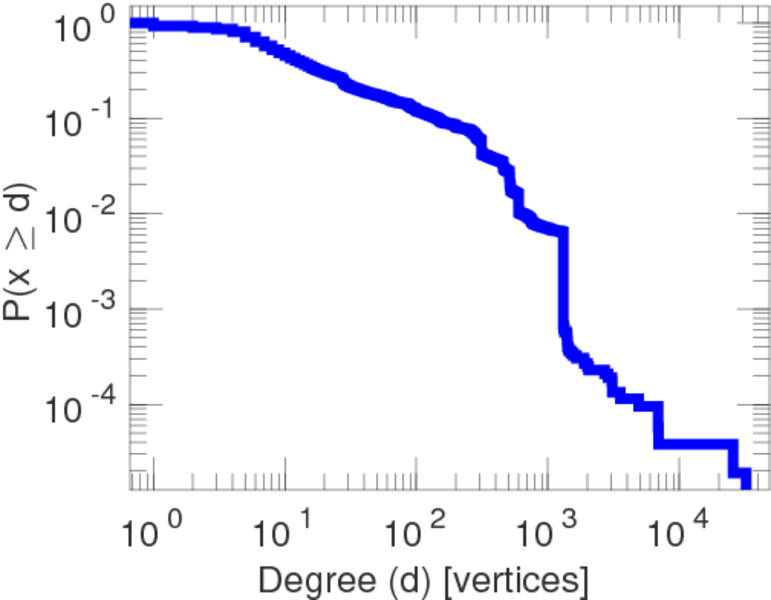
| Maximum degree | dmax = | 34,150
|
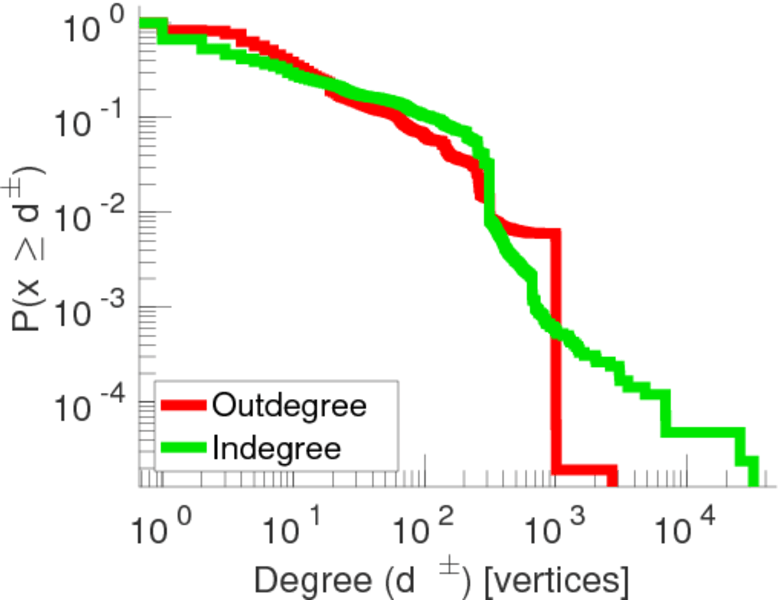
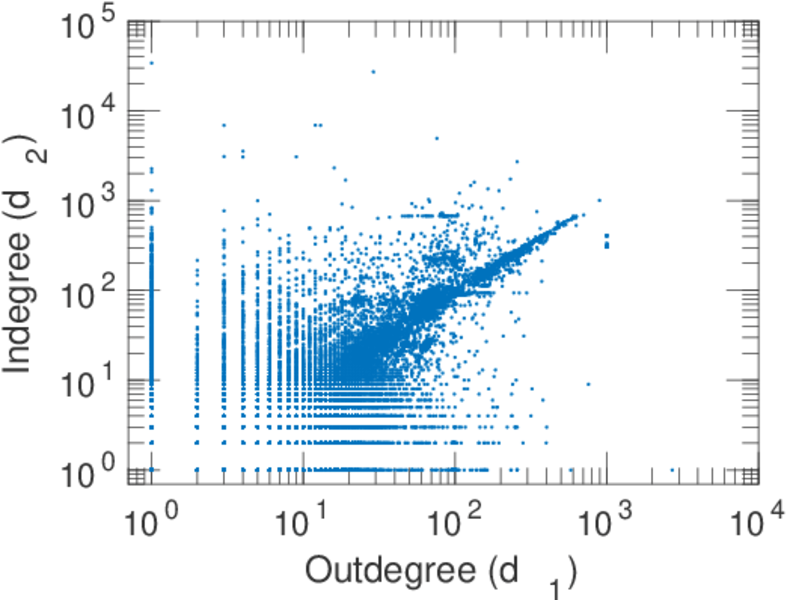
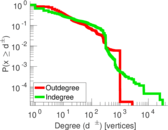
| Maximum outdegree | d+max = | 2,707
|
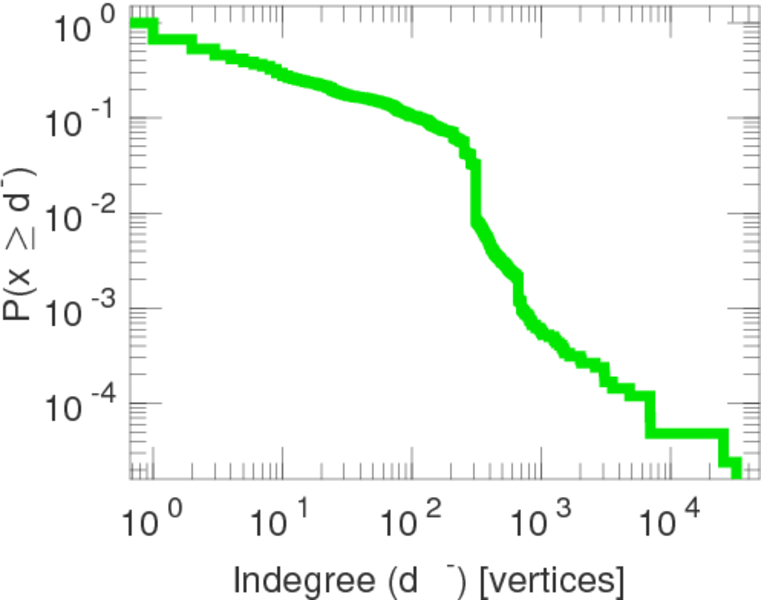
| Maximum indegree | d−max = | 34,149
|
| Average degree | d = | 58.510 2
|
| Fill | p = | 0.000 531 062
|
| Size of LCC | N = | 55,066
|
| Size of LSCC | Ns = | 40,695
|
| Relative size of LSCC | Nrs = | 0.738 727
|
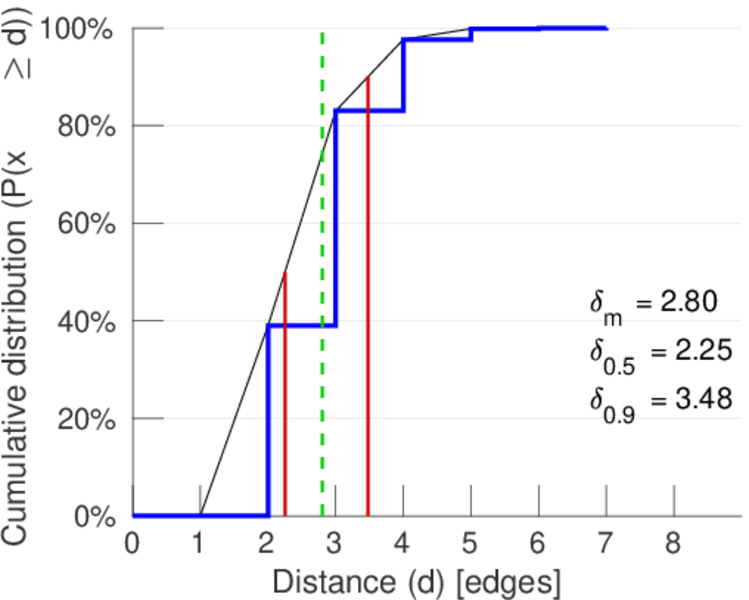
| Diameter | δ = | 8
|
| 50-Percentile effective diameter | δ0.5 = | 2.250 31
|
| 90-Percentile effective diameter | δ0.9 = | 3.477 58
|
| Median distance | δM = | 3
|
| Mean distance | δm = | 2.804 51
|
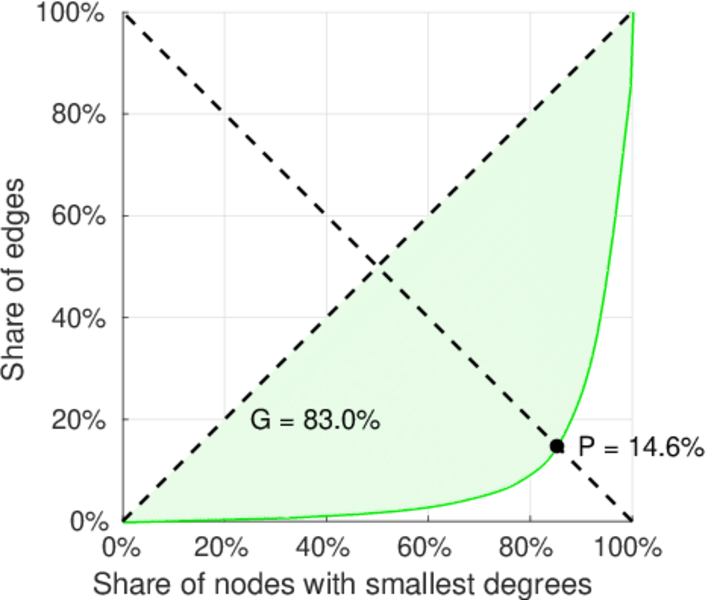
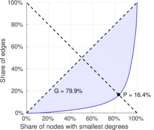
| Gini coefficient | G = | 0.801 543
|
| Balanced inequality ratio | P = | 0.164 165
|
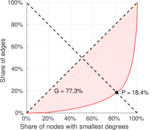
| Outdegree balanced inequality ratio | P+ = | 0.184 121
|
| Indegree balanced inequality ratio | P− = | 0.146 130
|
| Relative edge distribution entropy | Her = | 0.861 390
|
| Power law exponent | γ = | 1.414 31
|
| Tail power law exponent | γt = | 1.701 00
|
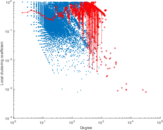
| Degree assortativity | ρ = | −0.051 374 6
|
| Degree assortativity p-value | pρ = | 0.000 00
|
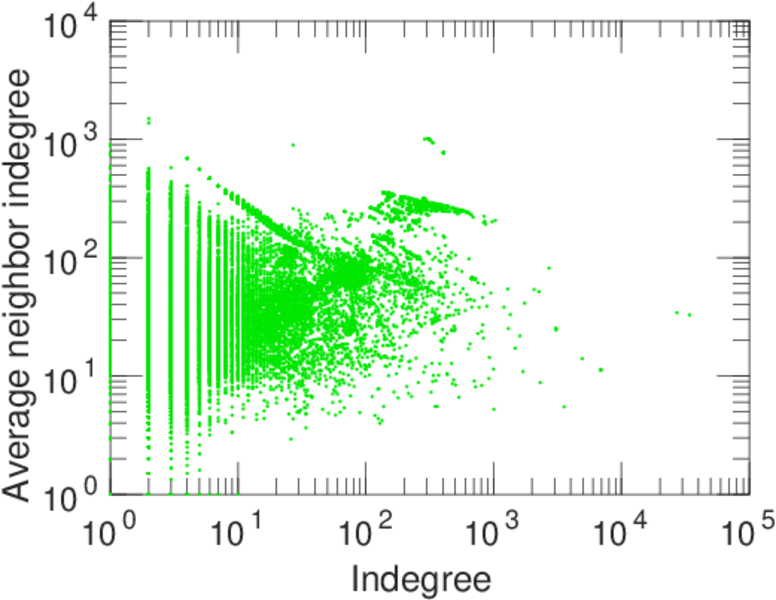
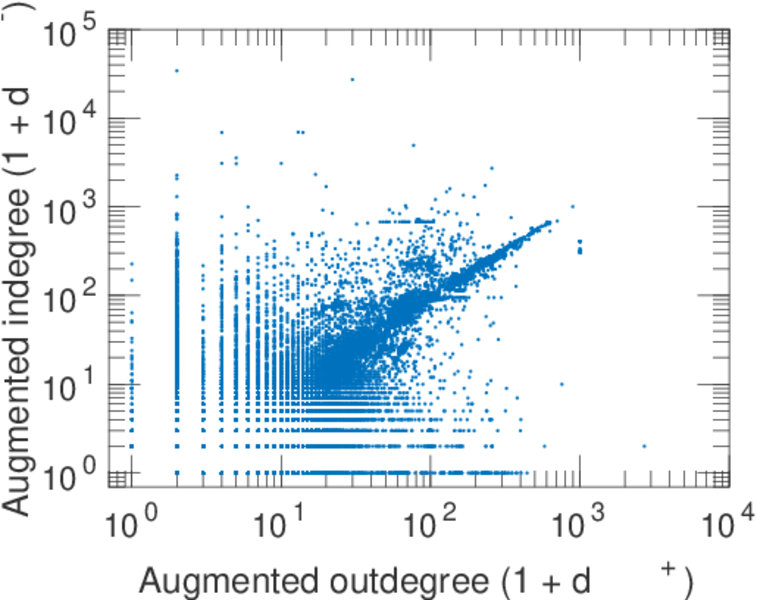
| In/outdegree correlation | ρ± = | +0.649 856
|
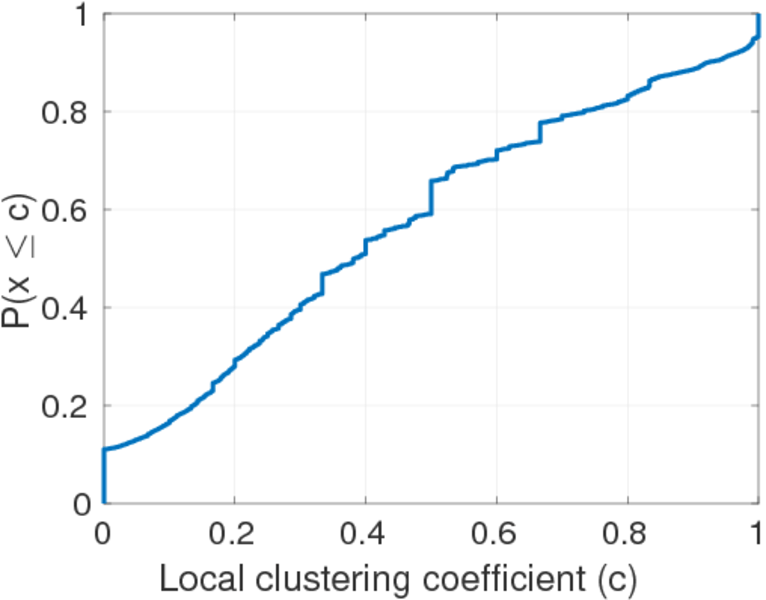
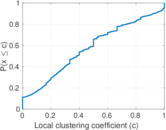
| Clustering coefficient | c = | 0.143 523
|
| Directed clustering coefficient | c± = | 0.849 922
|
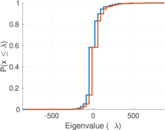
| Spectral norm | α = | 871.030
|
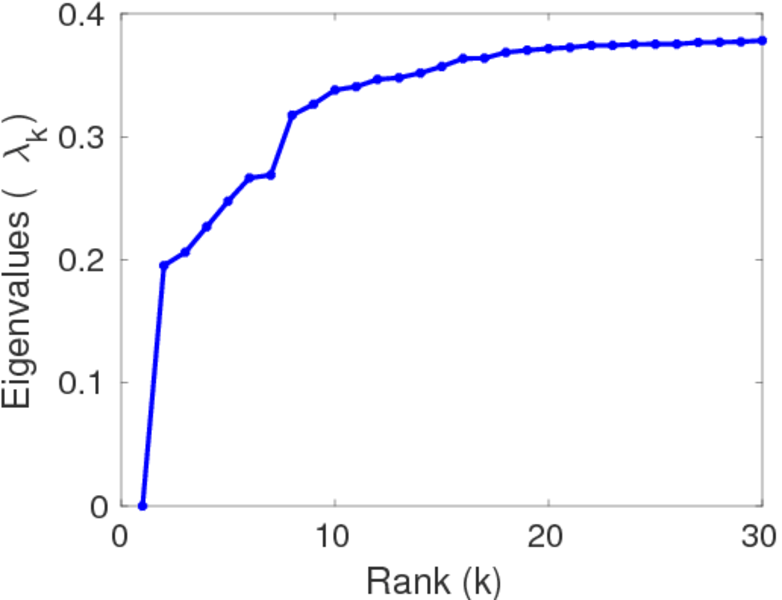
| Algebraic connectivity | a = | 0.195 411
|
| Spectral separation | |λ1[A] / λ2[A]| = | 1.491 87
|
| Reciprocity | y = | 0.542 031
|
| Normalized non-bipartivity | bN = | 0.131 511
|
| Spectral bipartite frustration | bK = | 0.001 144 79
|
| Controllability | C = | 25,915
|
| Relative controllability | Cr = | 0.470 429
|
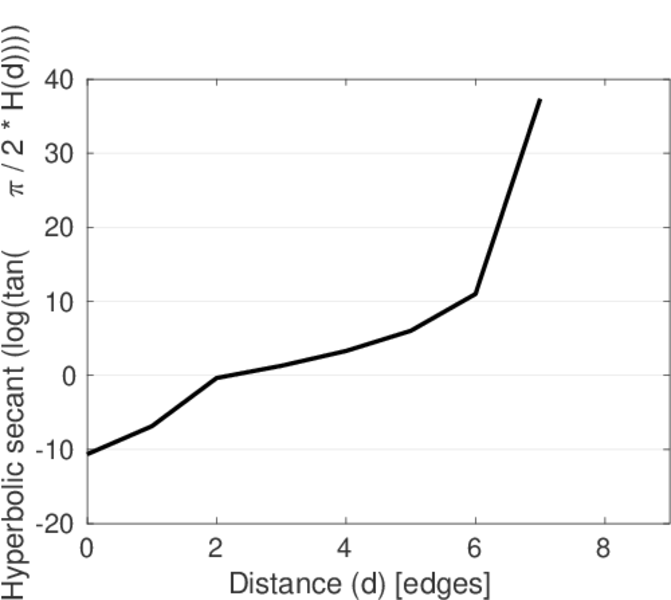
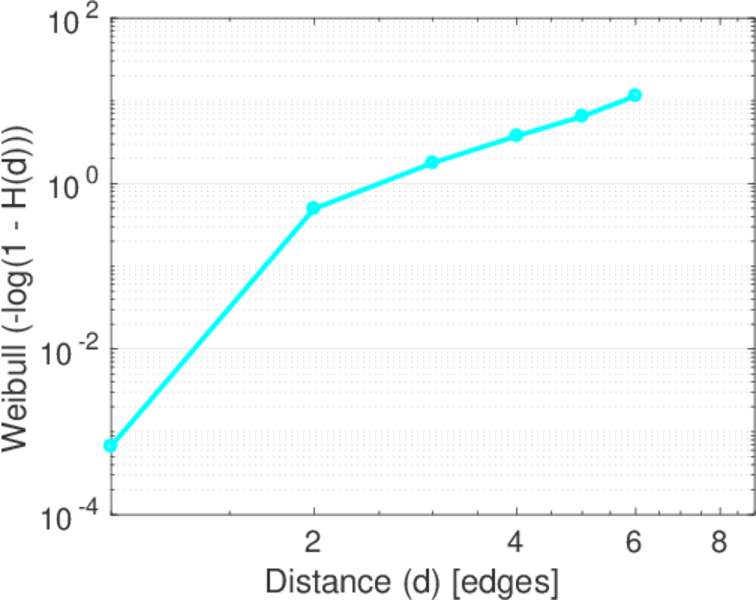
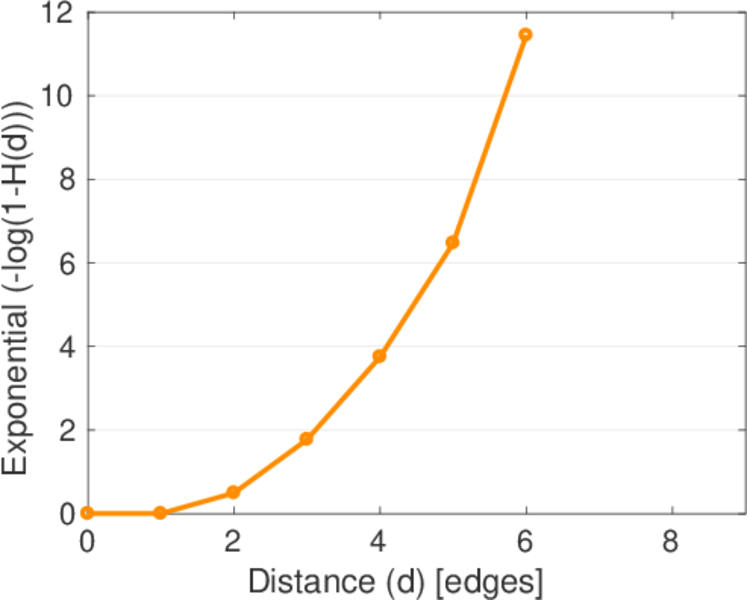
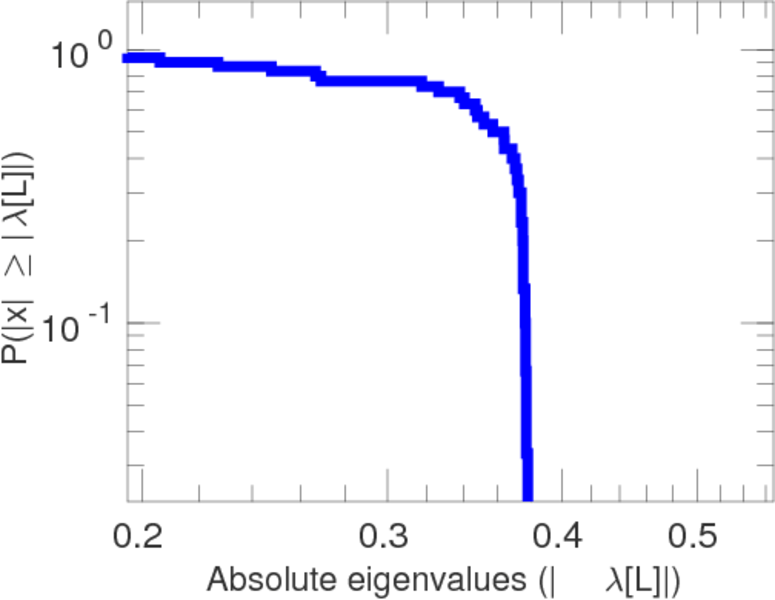
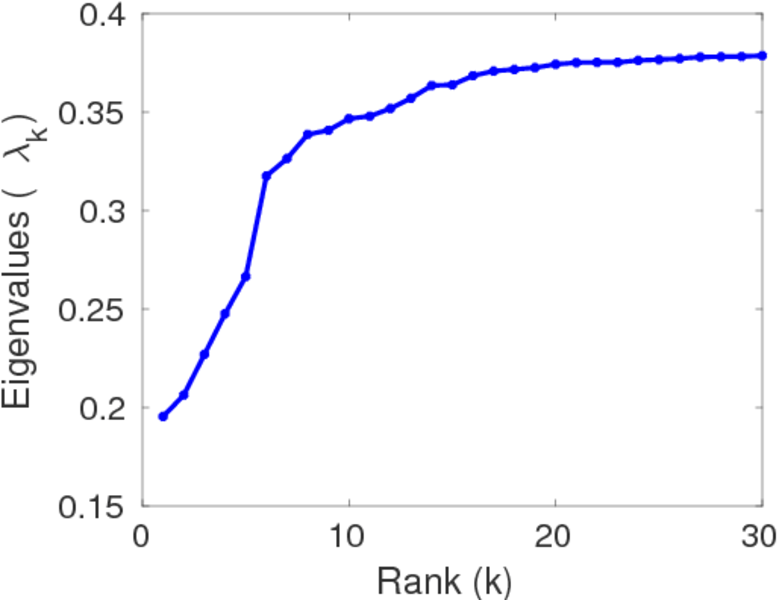
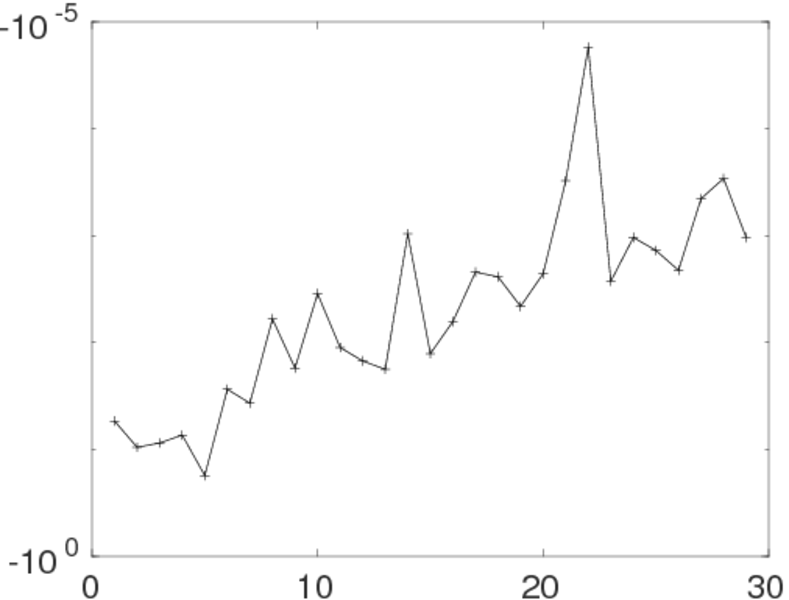
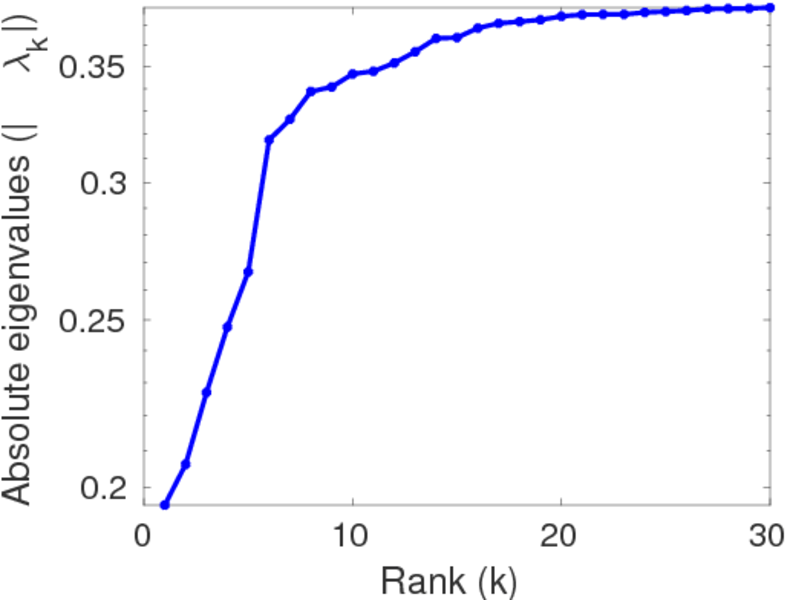
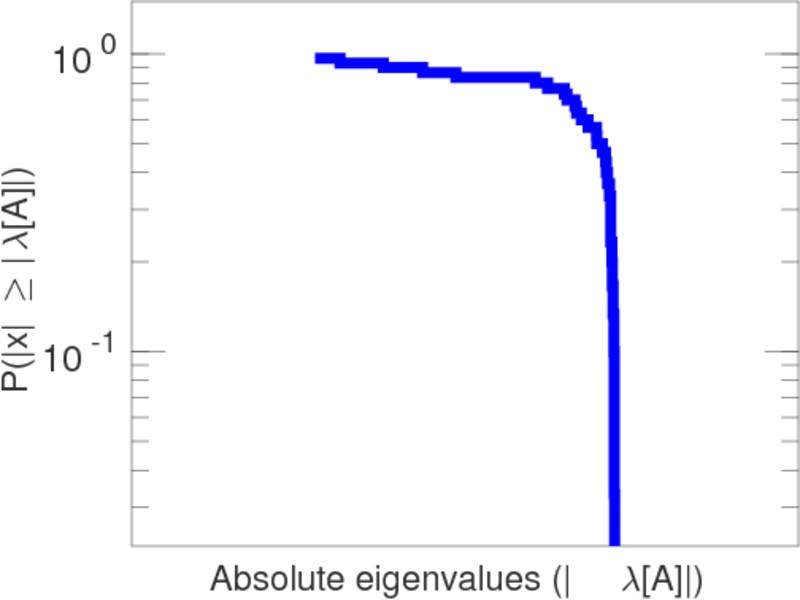
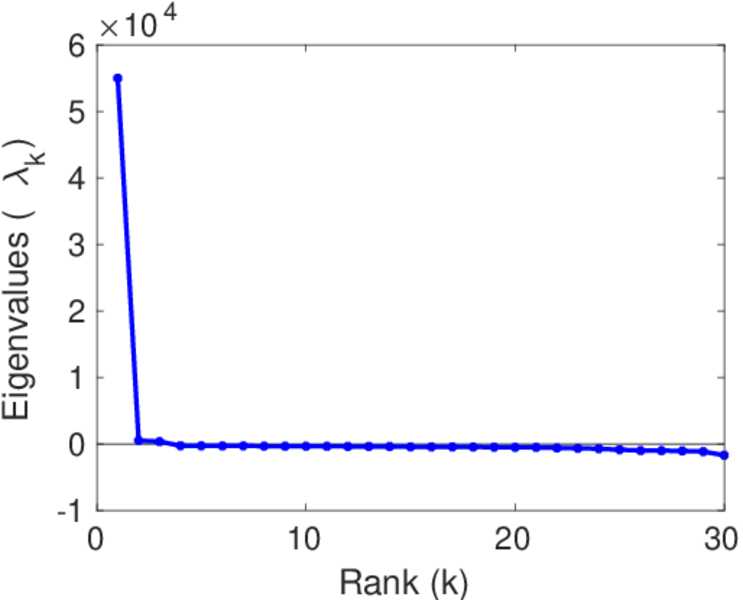
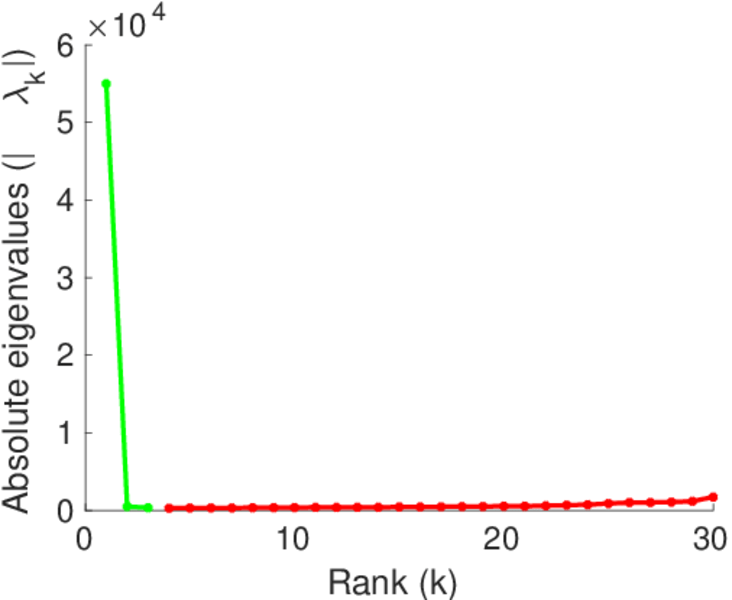
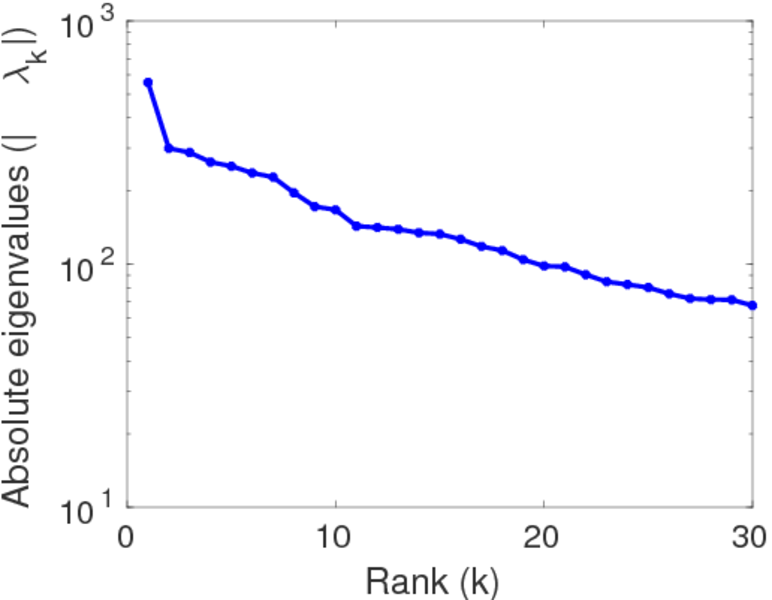
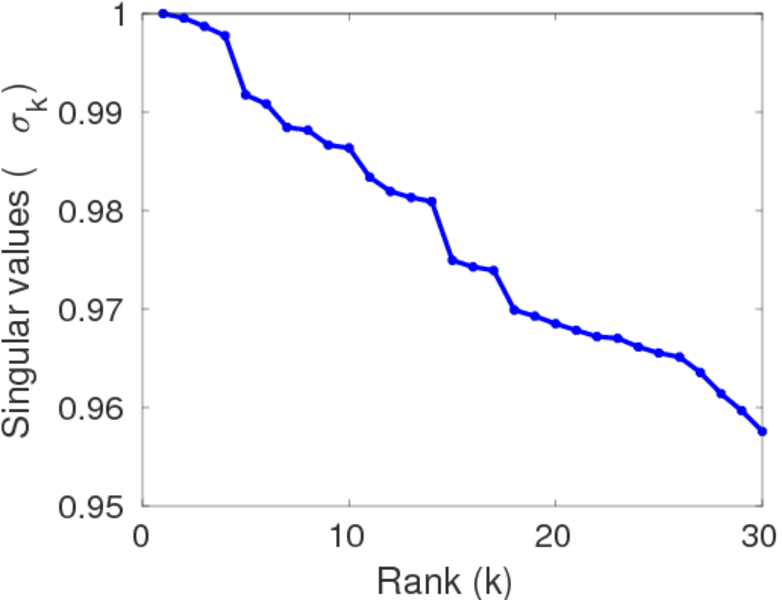
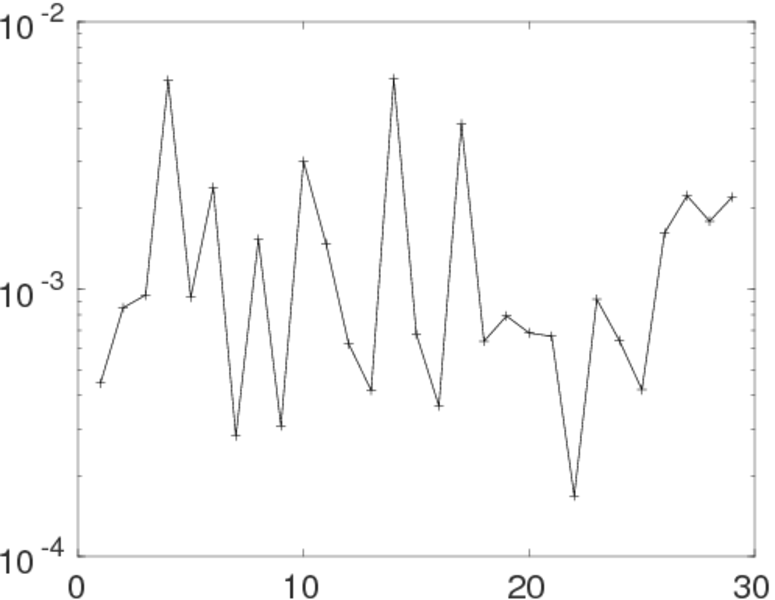
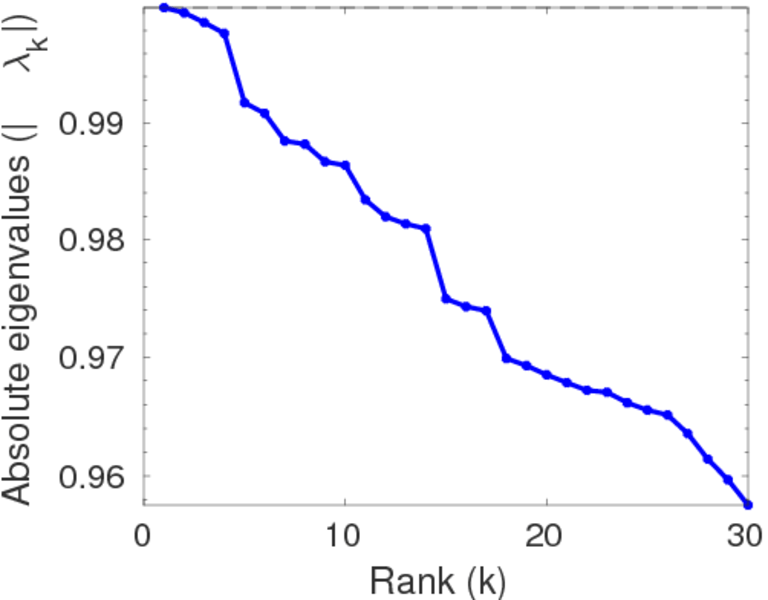
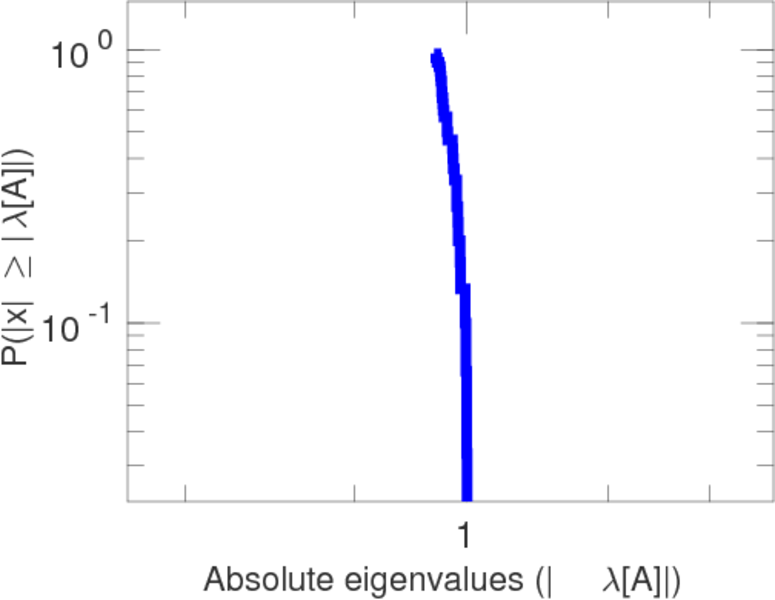
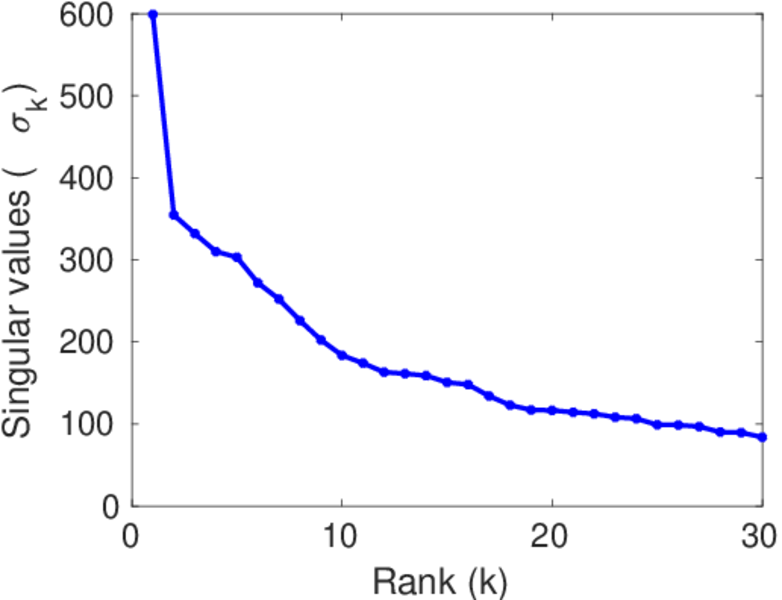
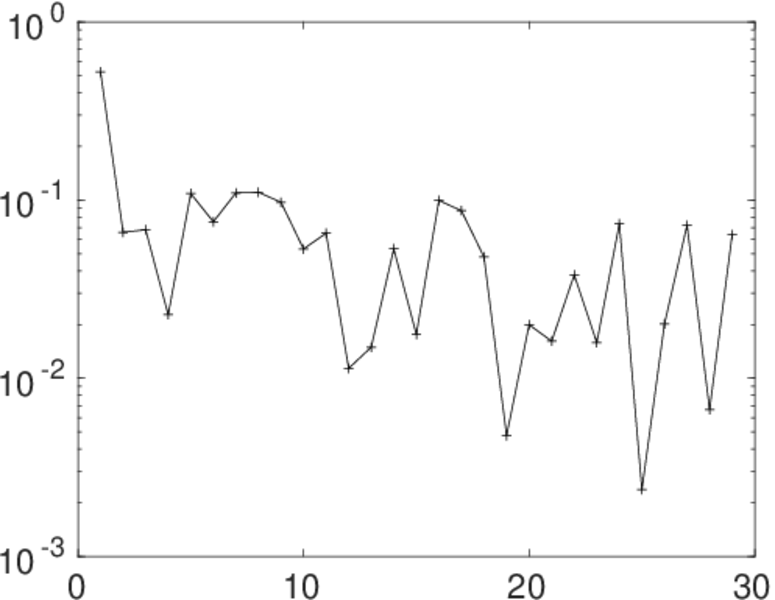
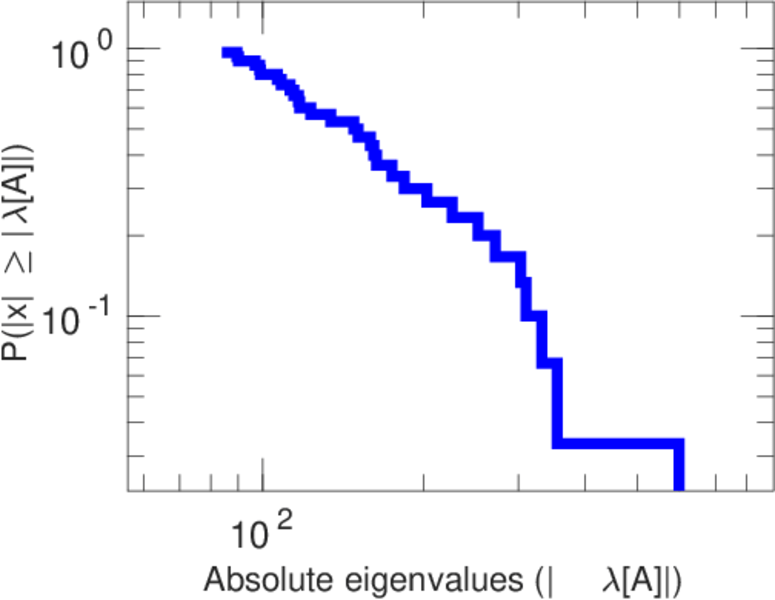
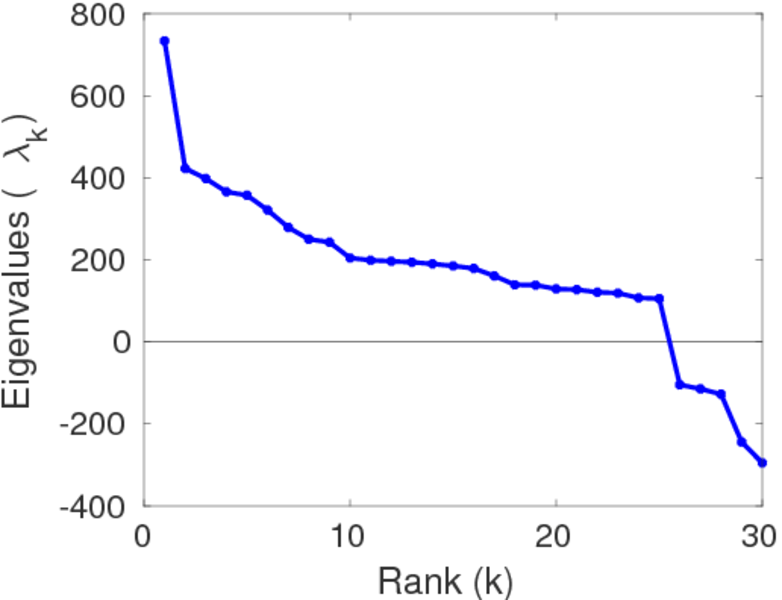
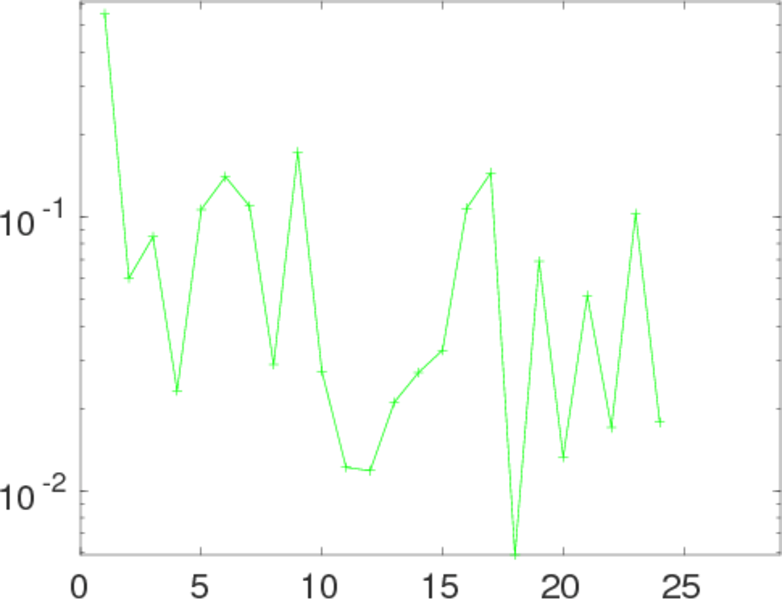
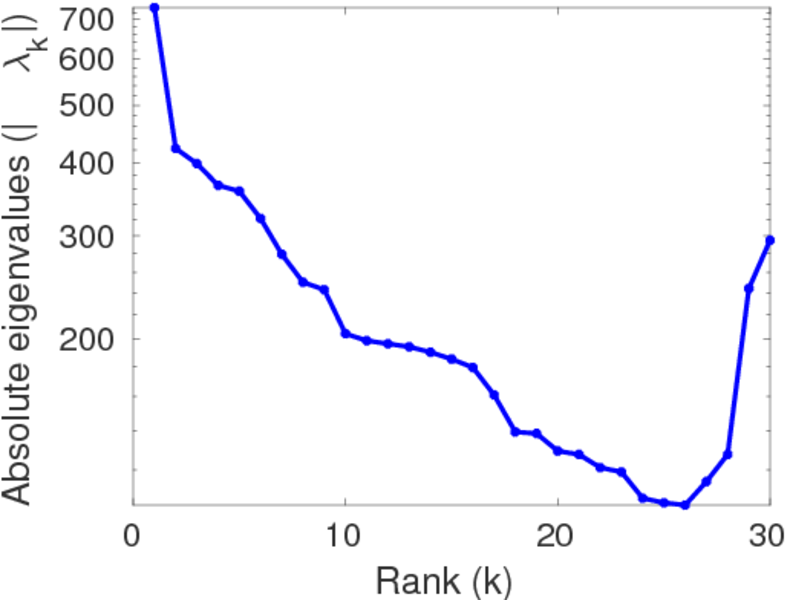
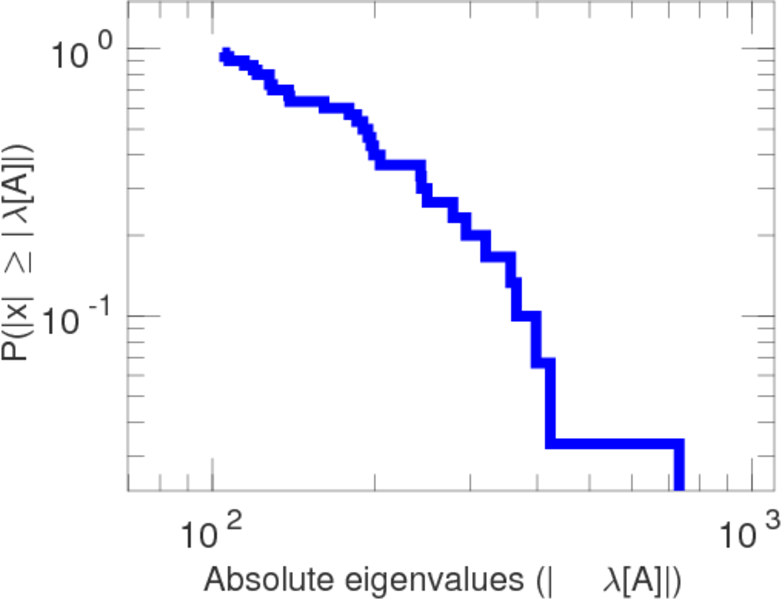
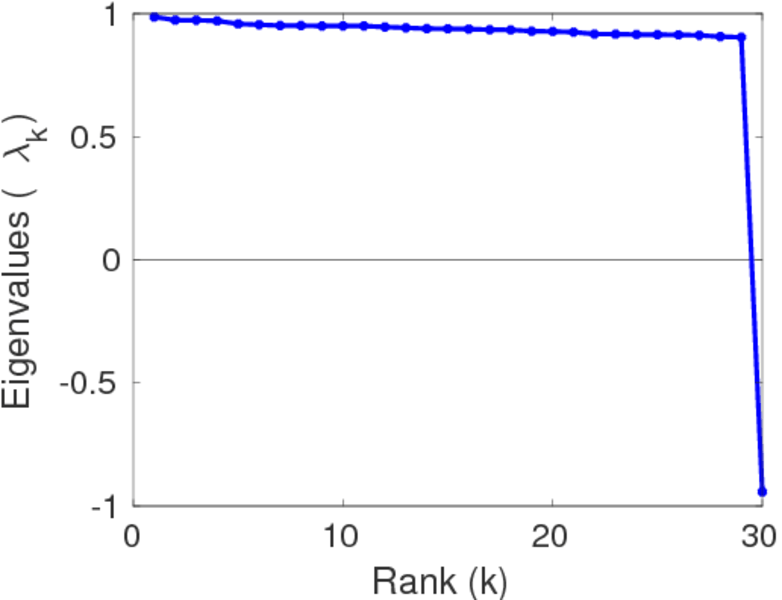
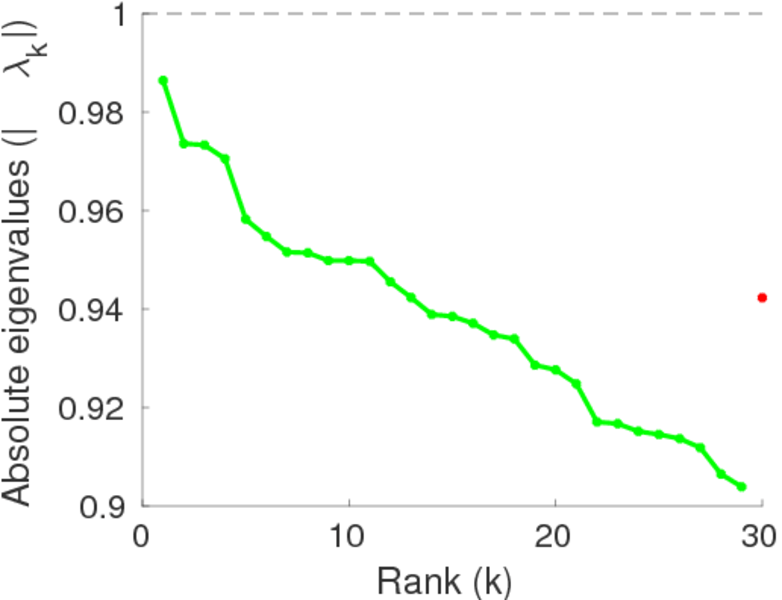
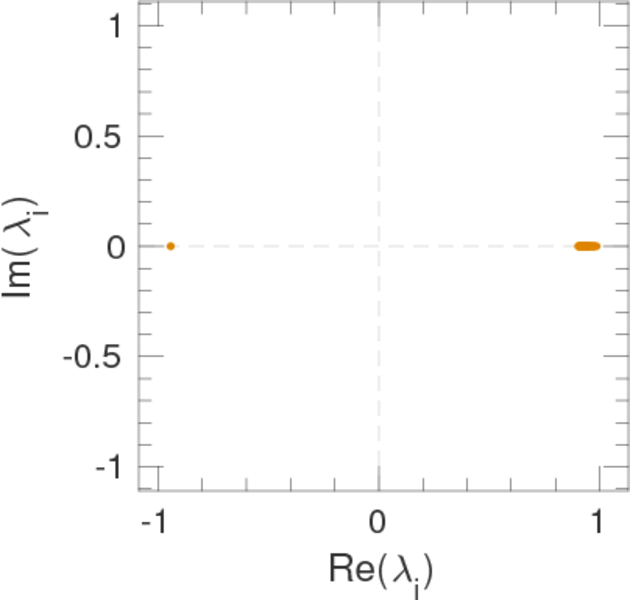
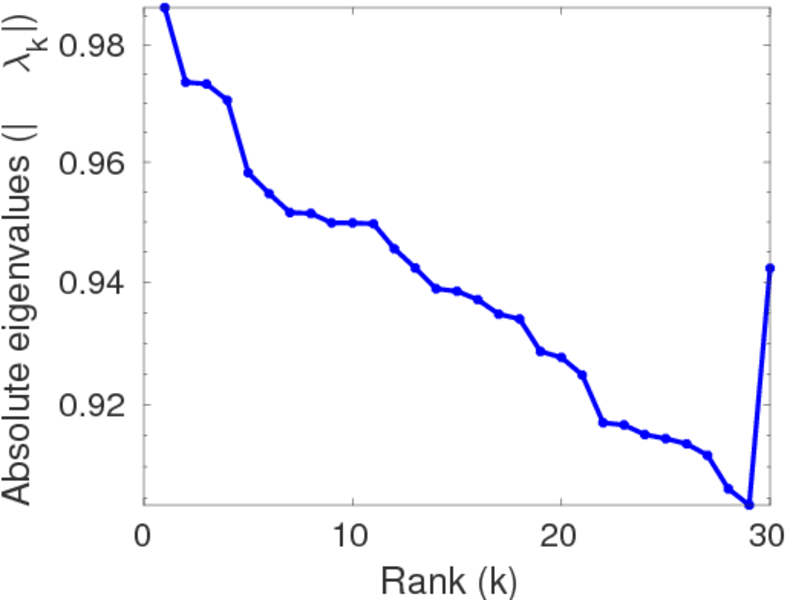
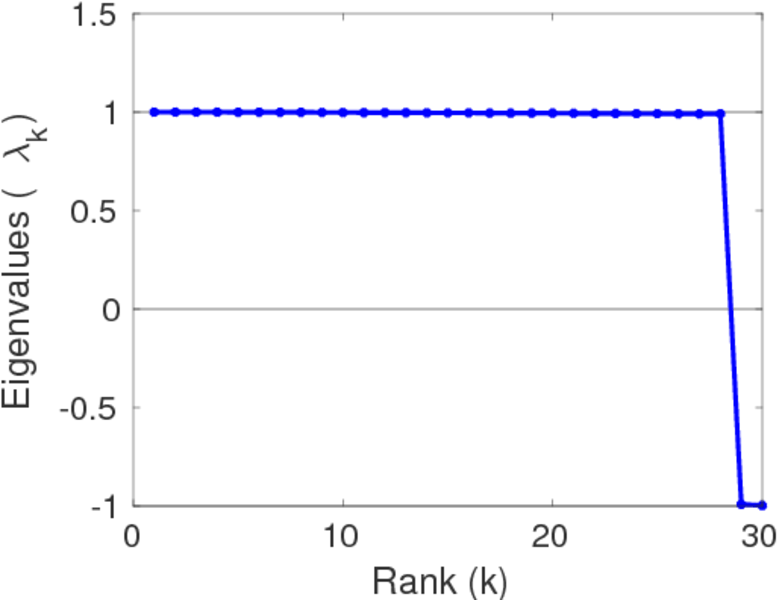
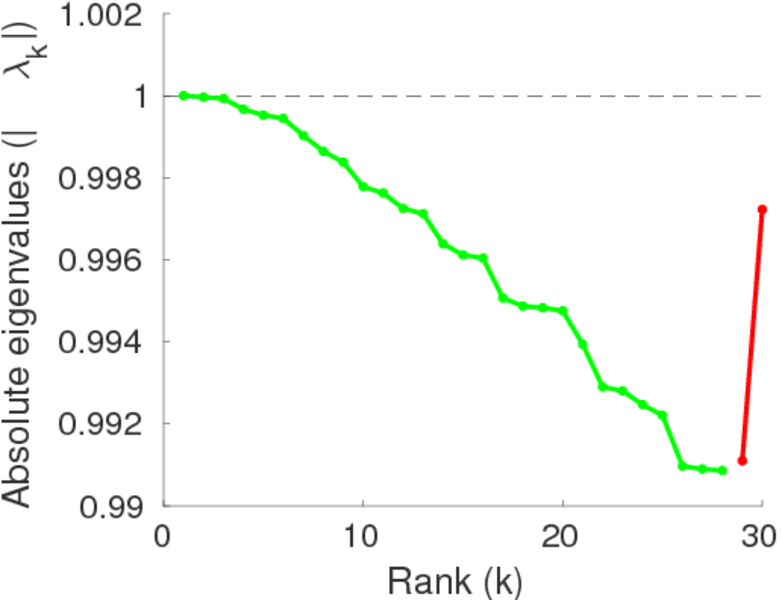
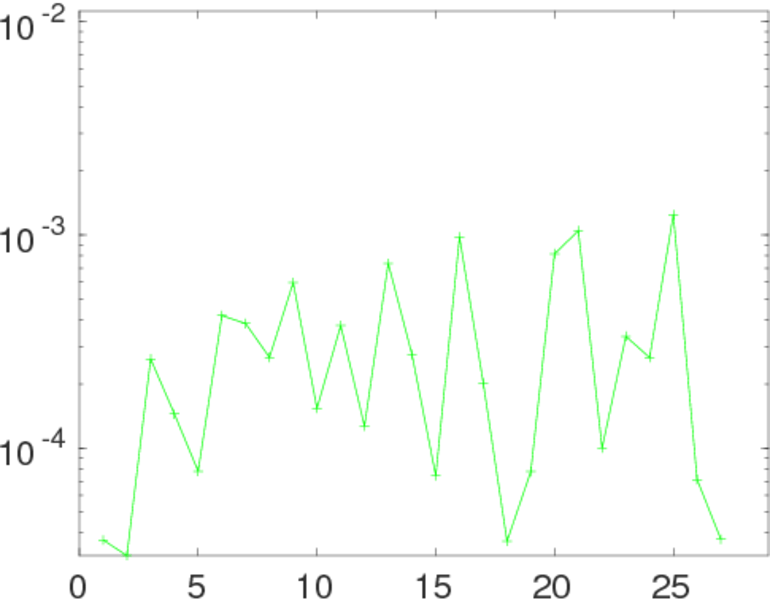
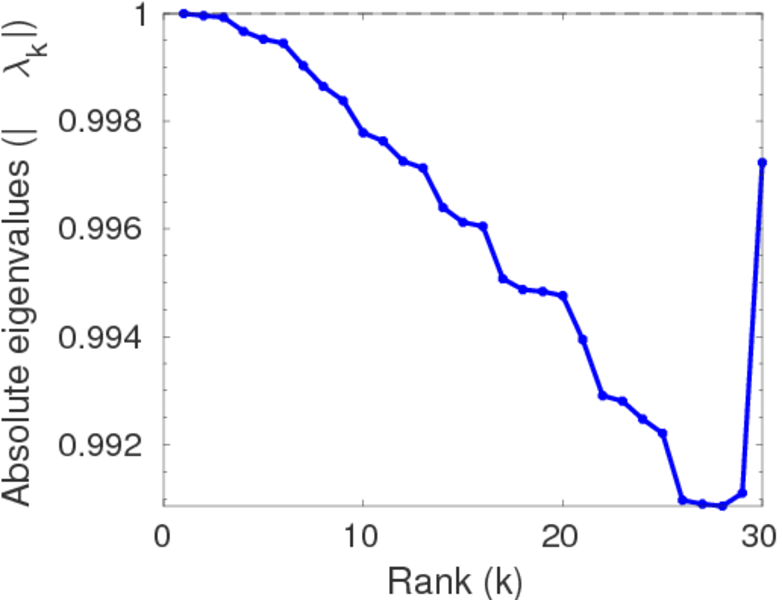
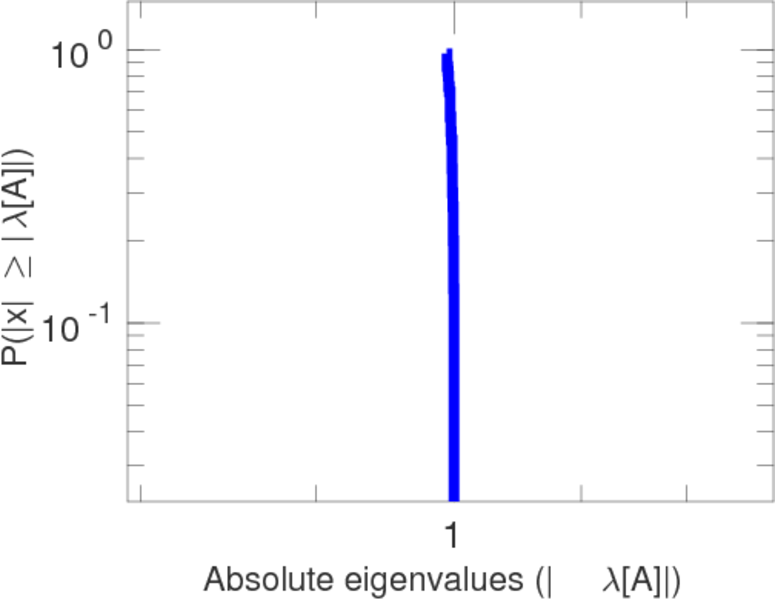
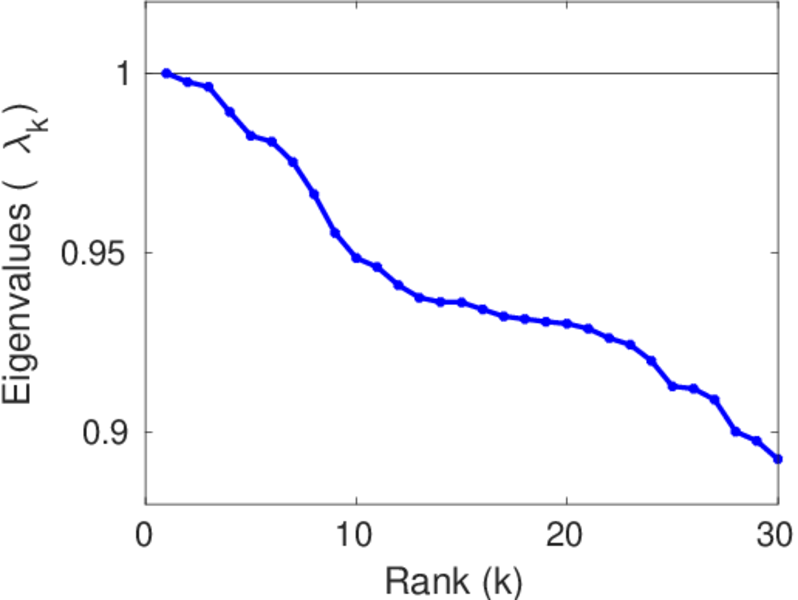
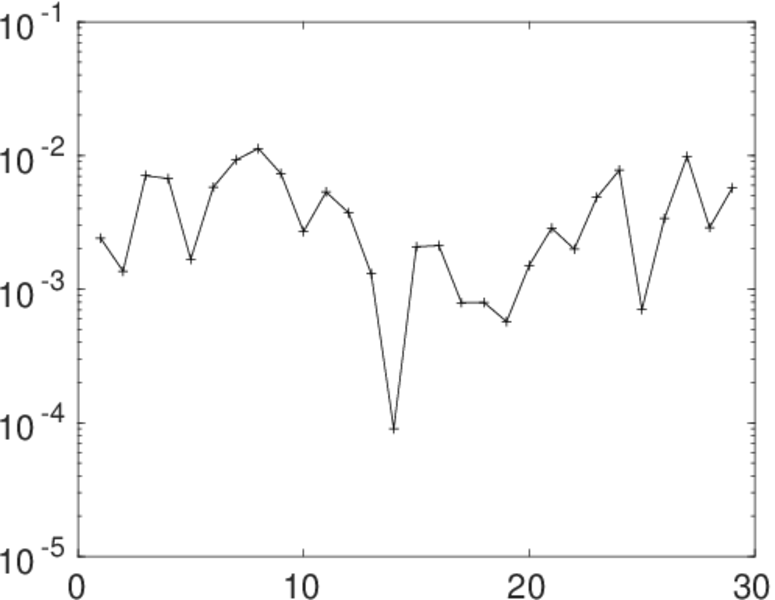
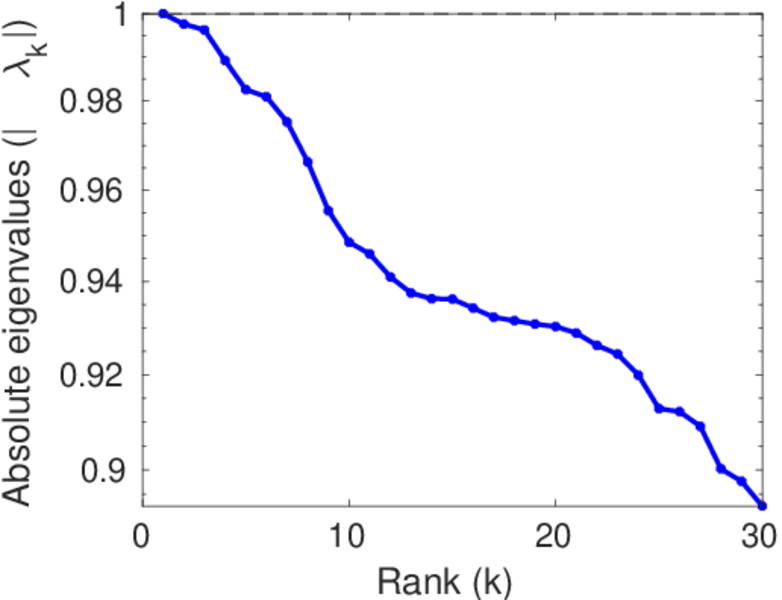
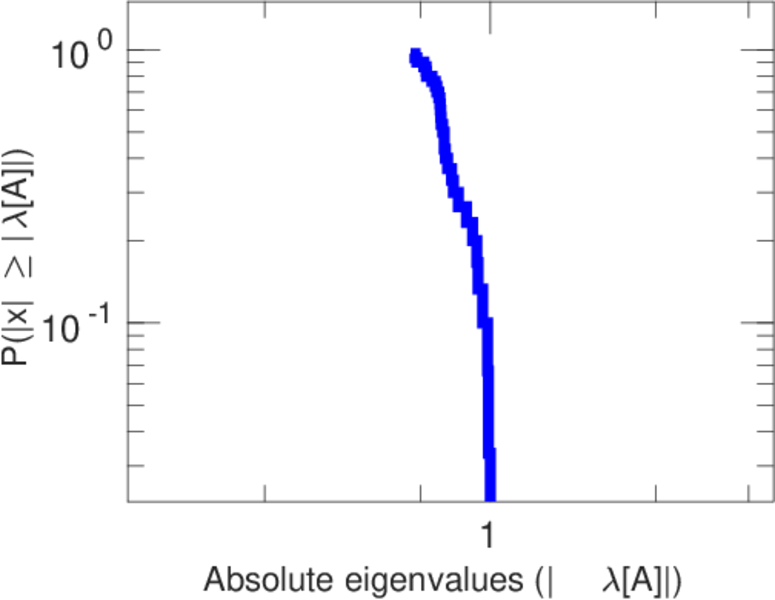
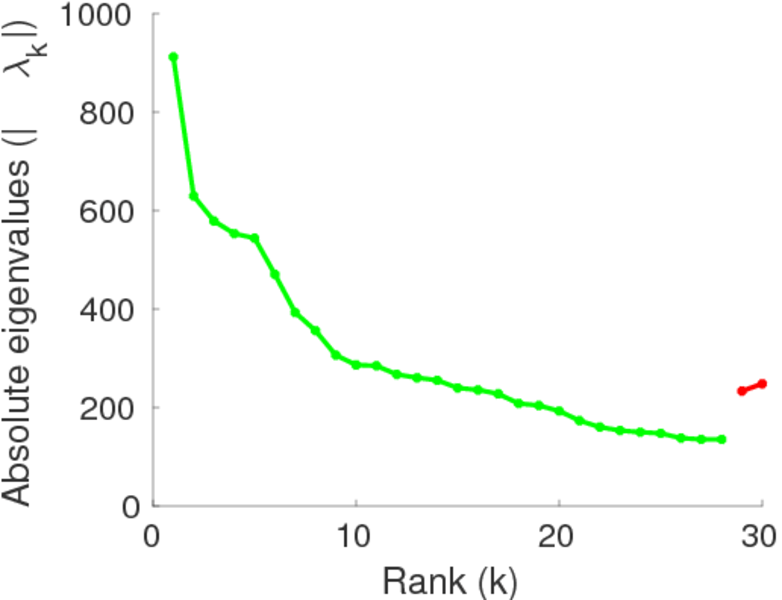
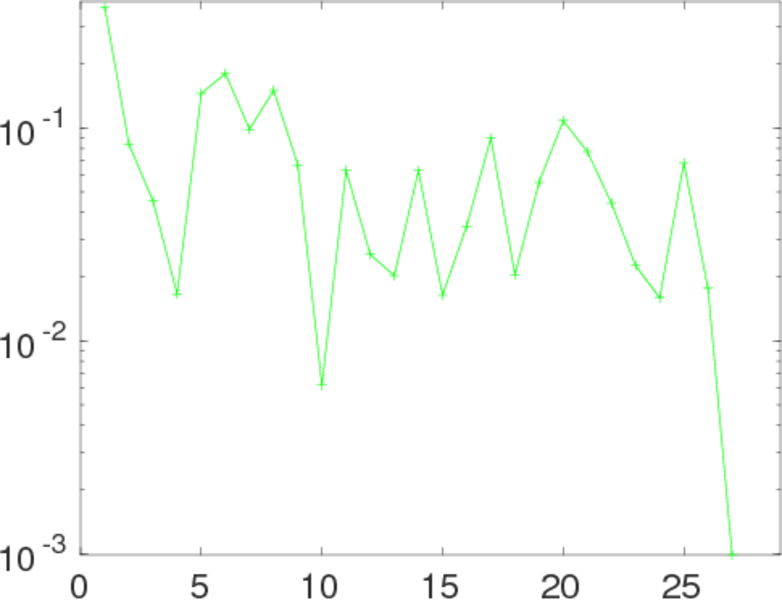
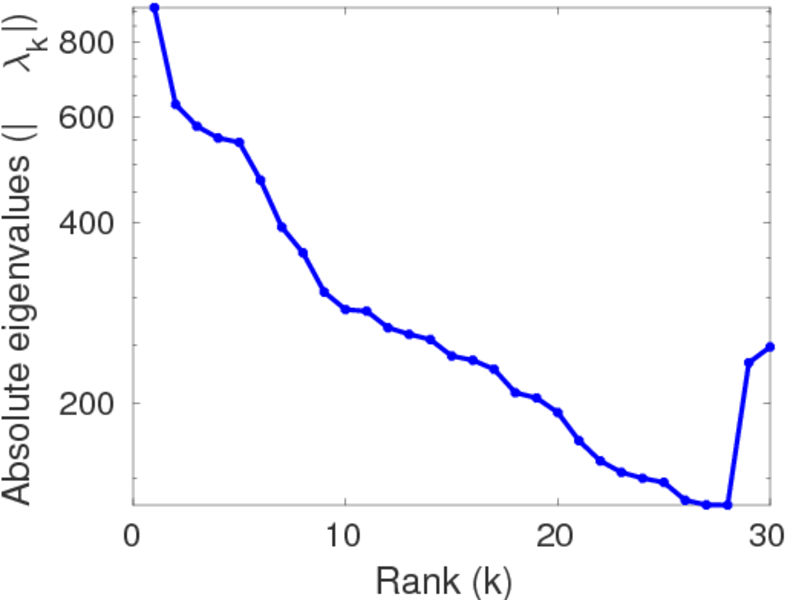
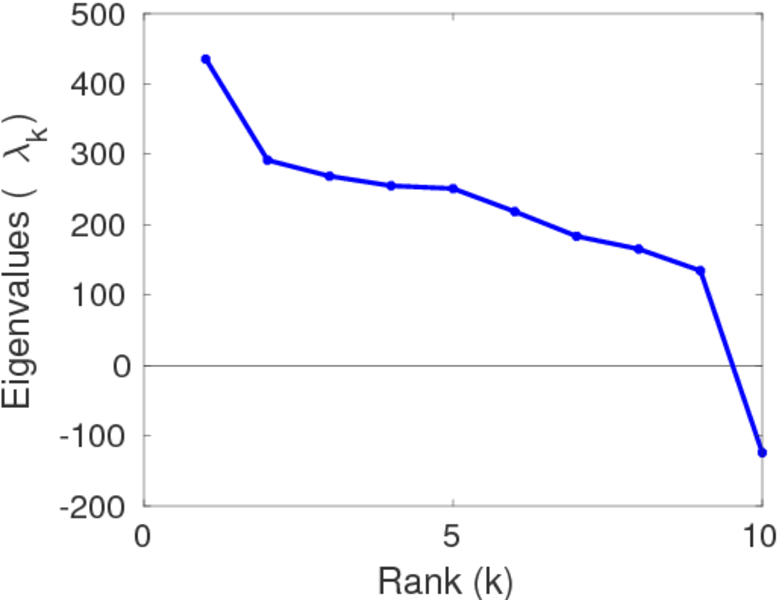
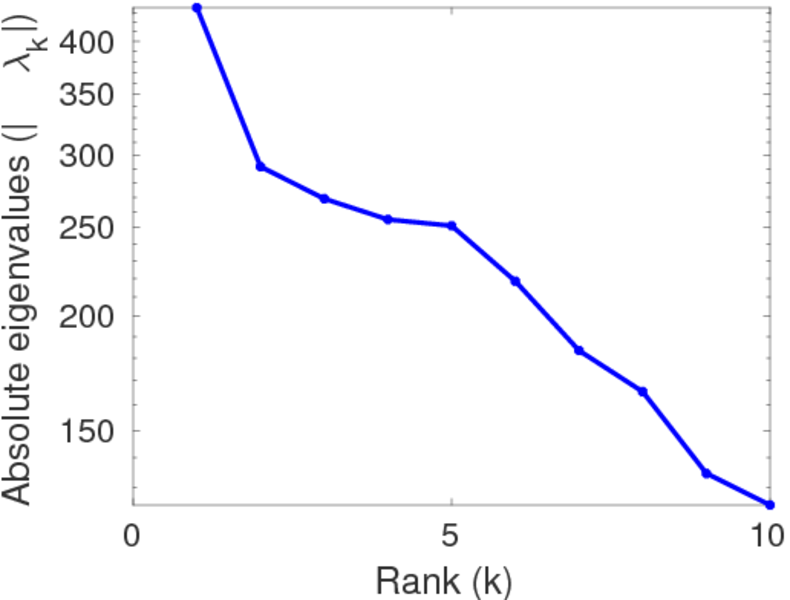
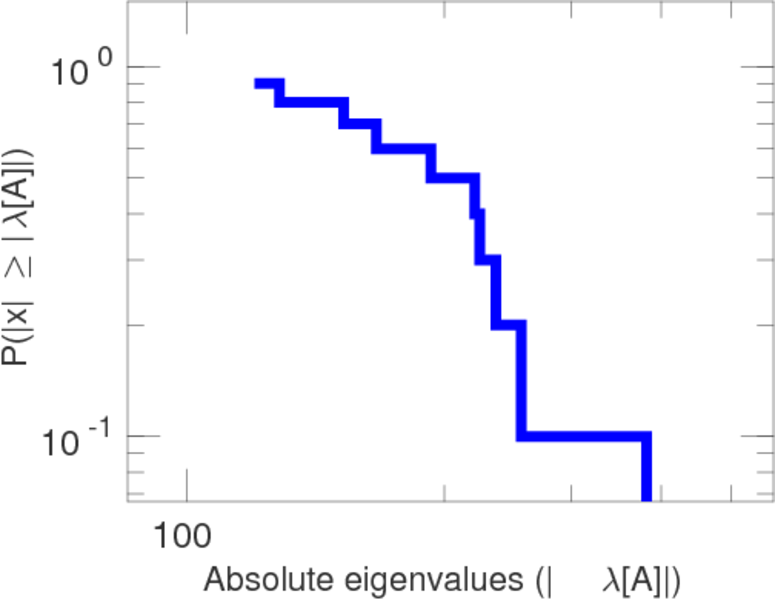
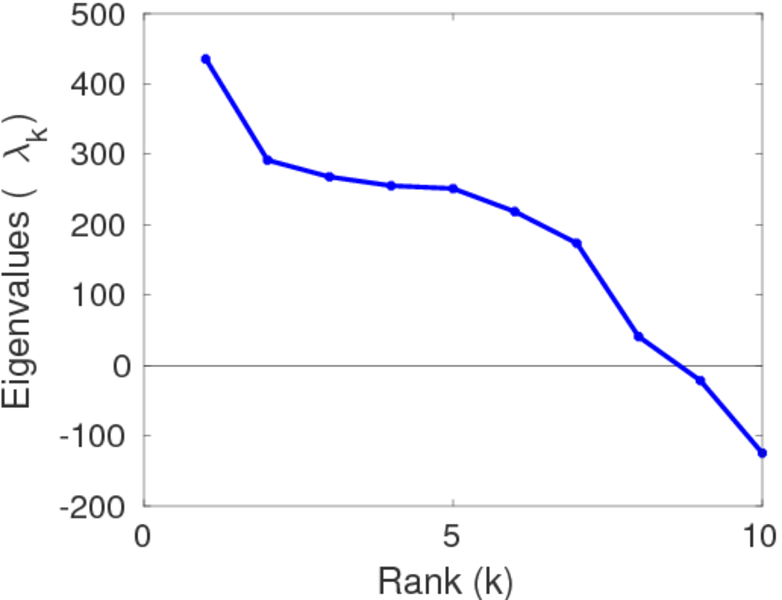
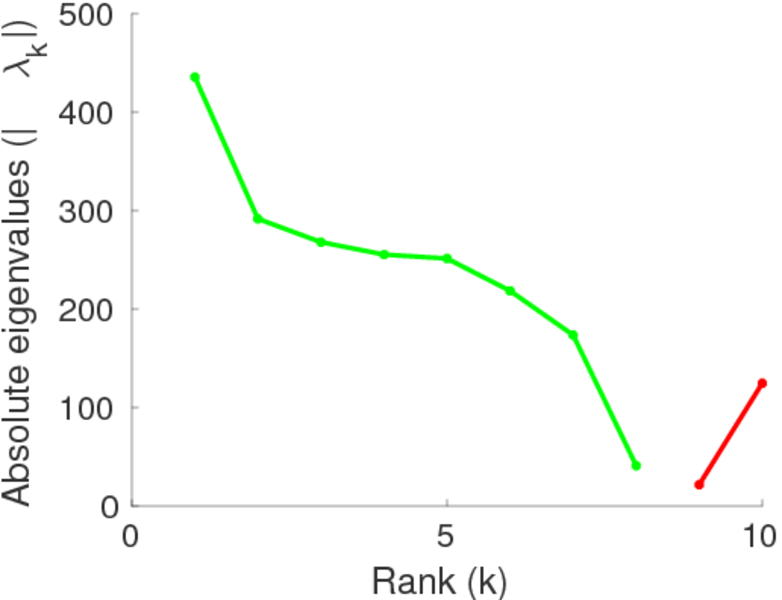
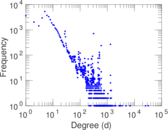
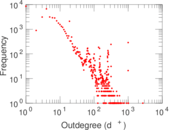
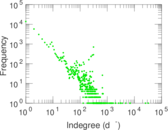
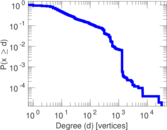
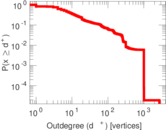
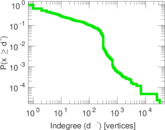
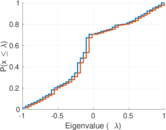
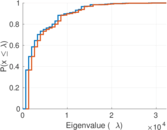
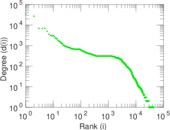
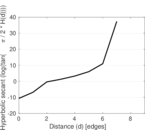
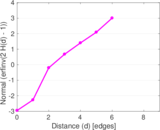
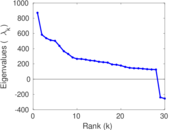
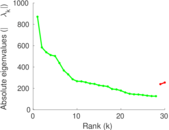
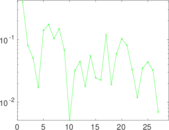
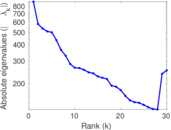
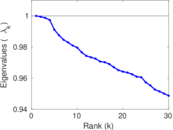
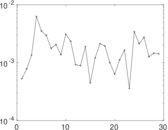
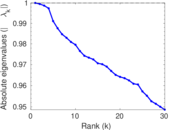
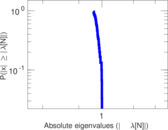
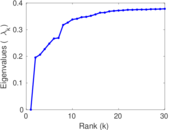
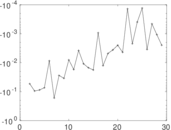
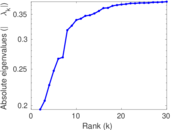
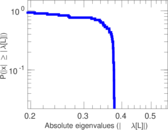
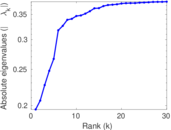
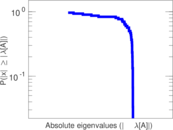
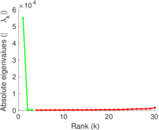
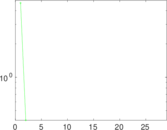
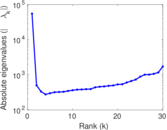
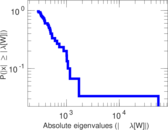
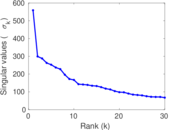
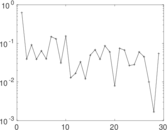
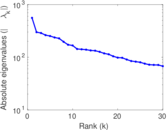
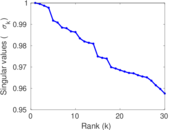
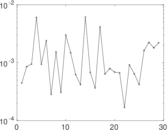
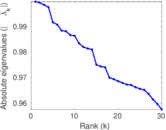
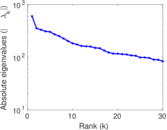
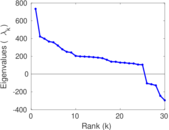
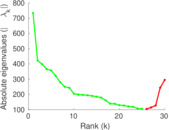
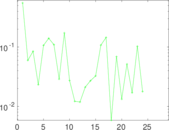
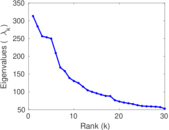
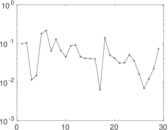
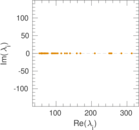
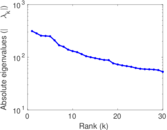
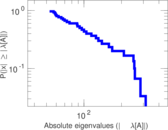
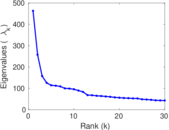
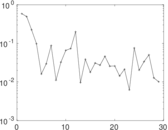
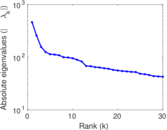
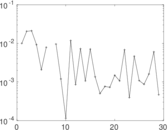
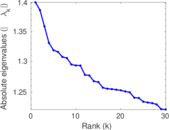
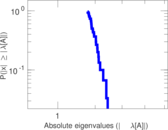
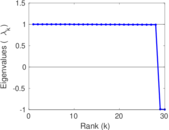
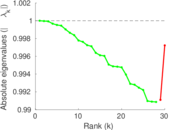
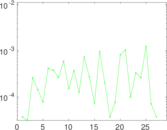
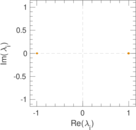
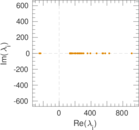
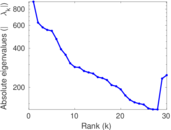
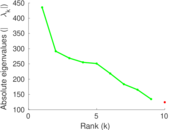
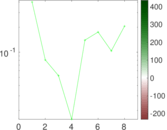
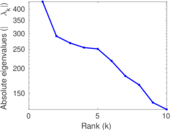
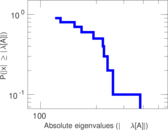
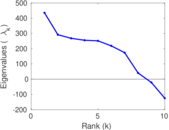
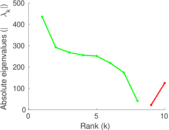
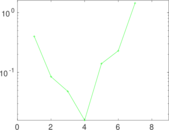
Plots


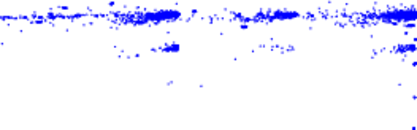
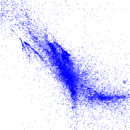


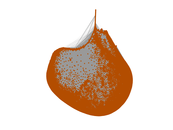


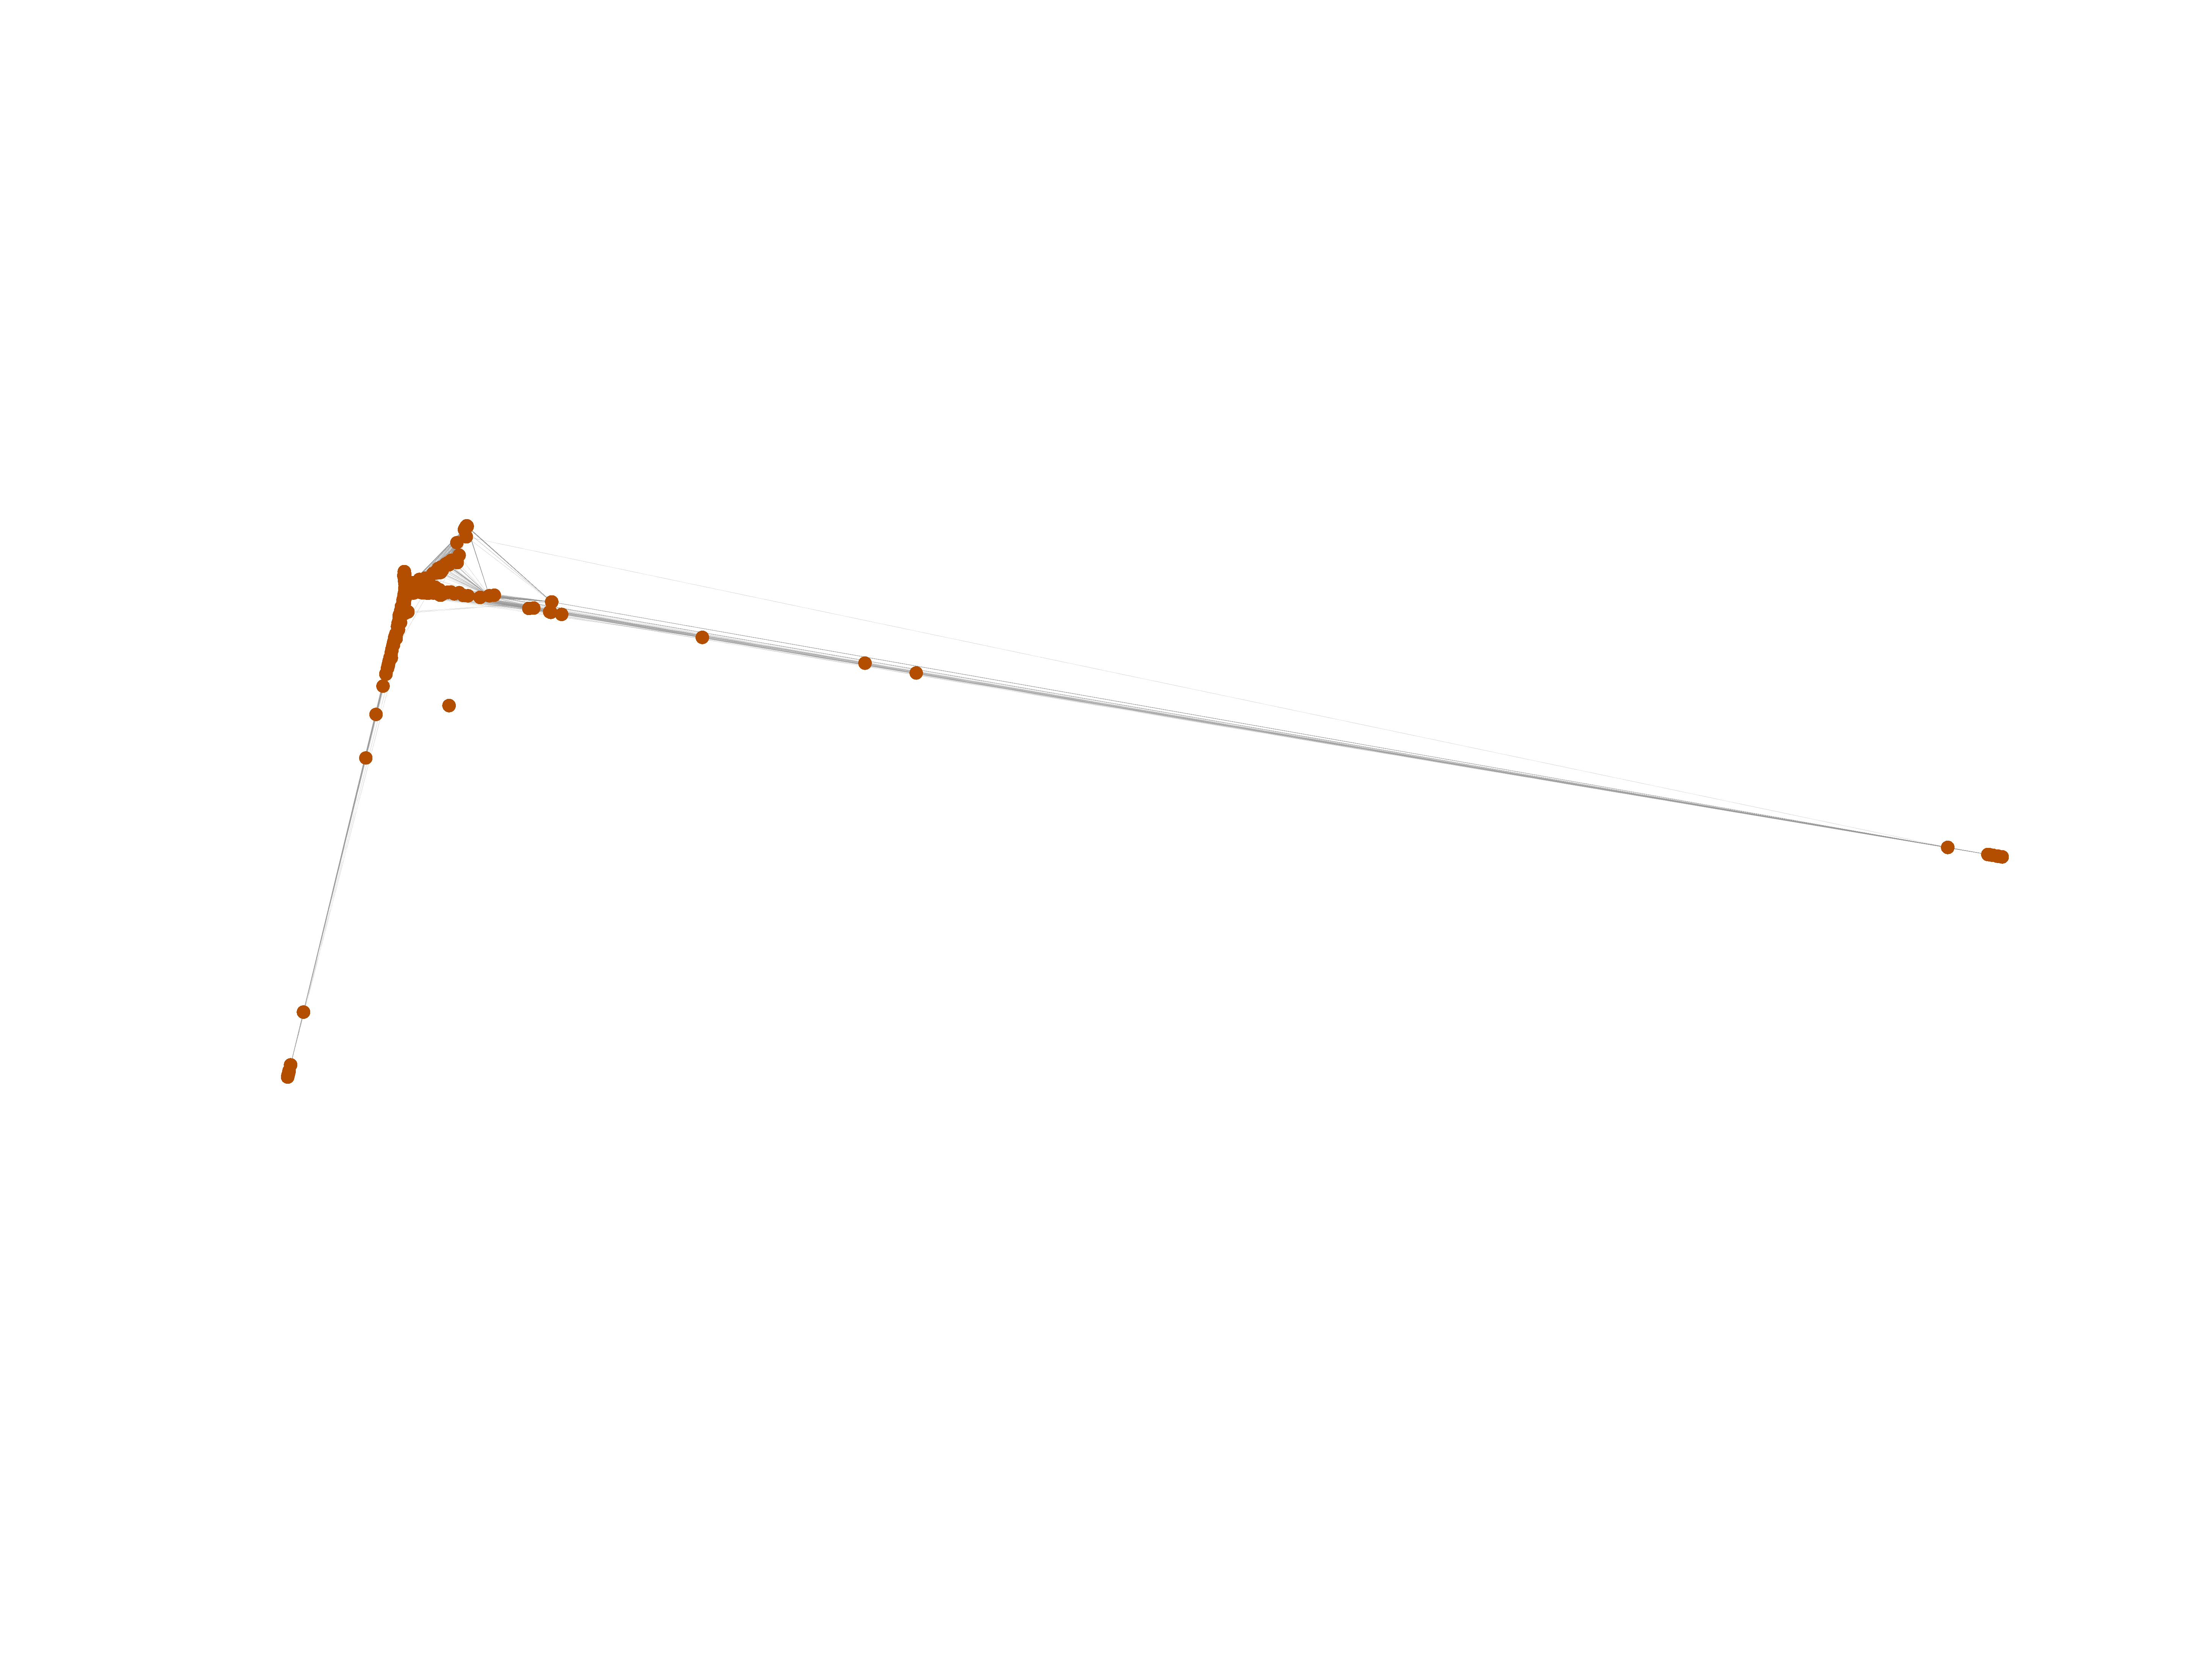
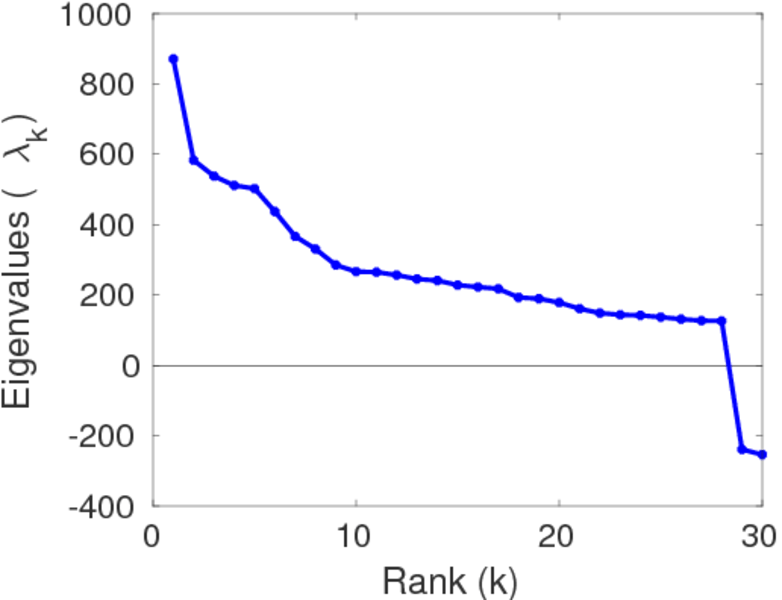
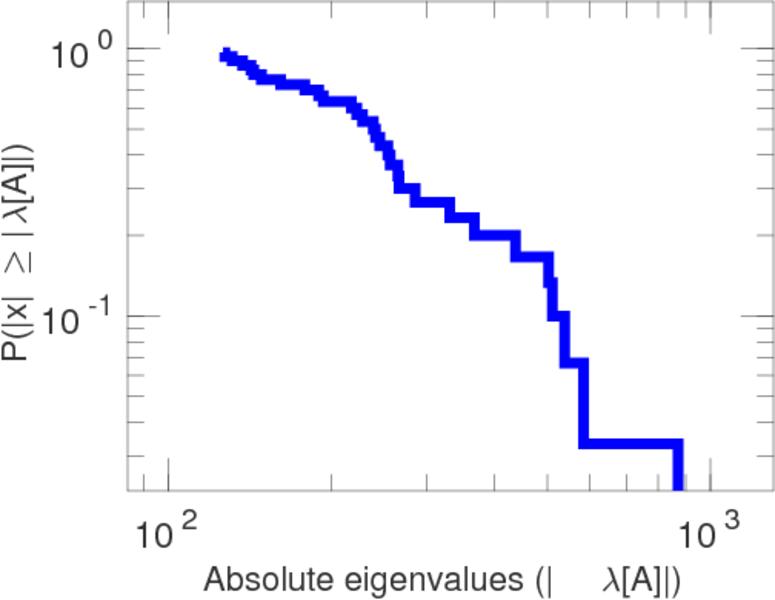
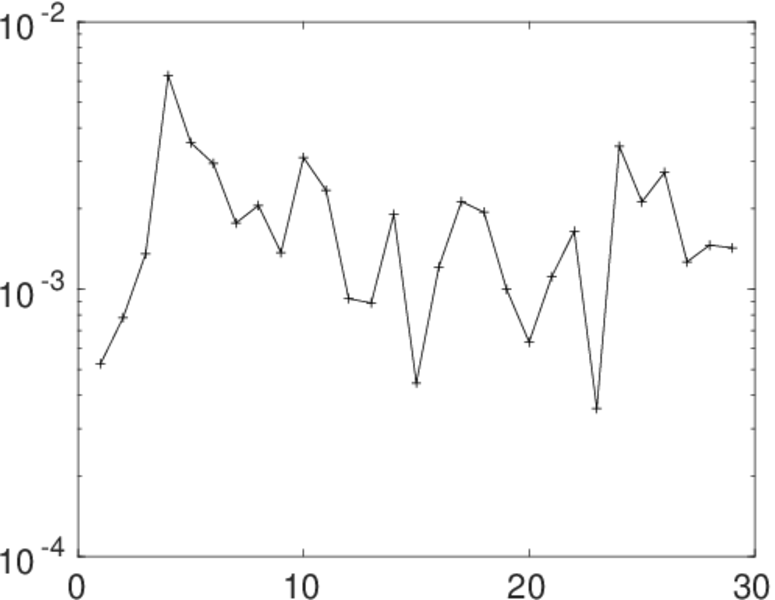
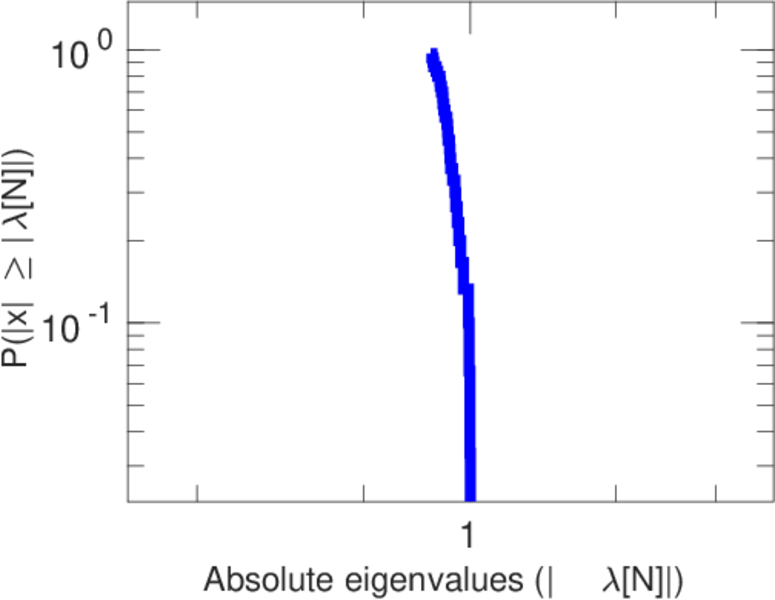
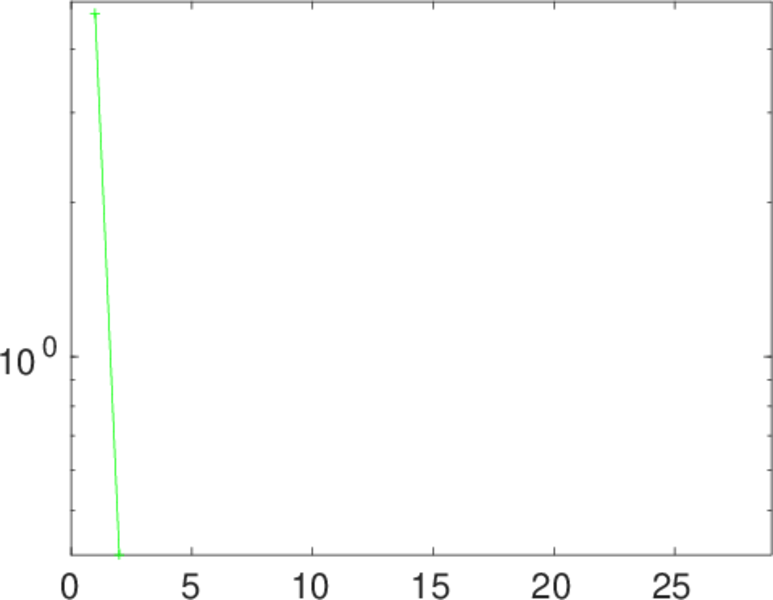
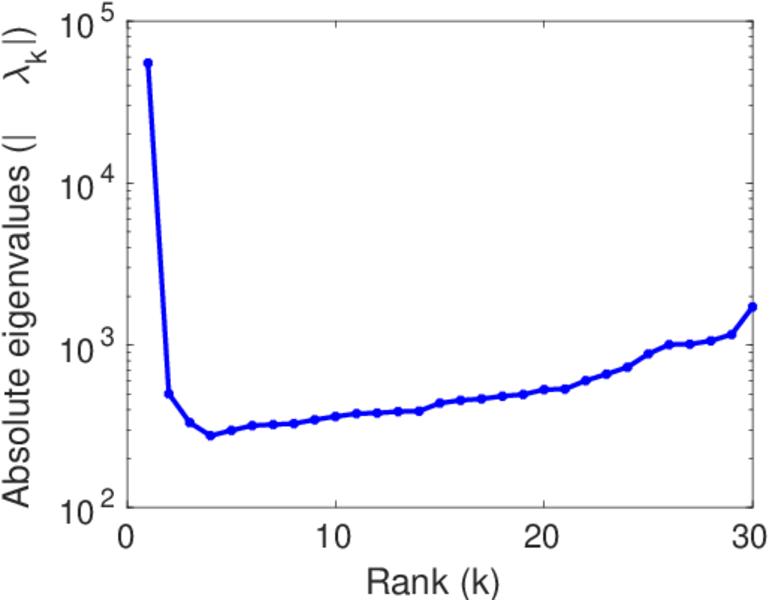
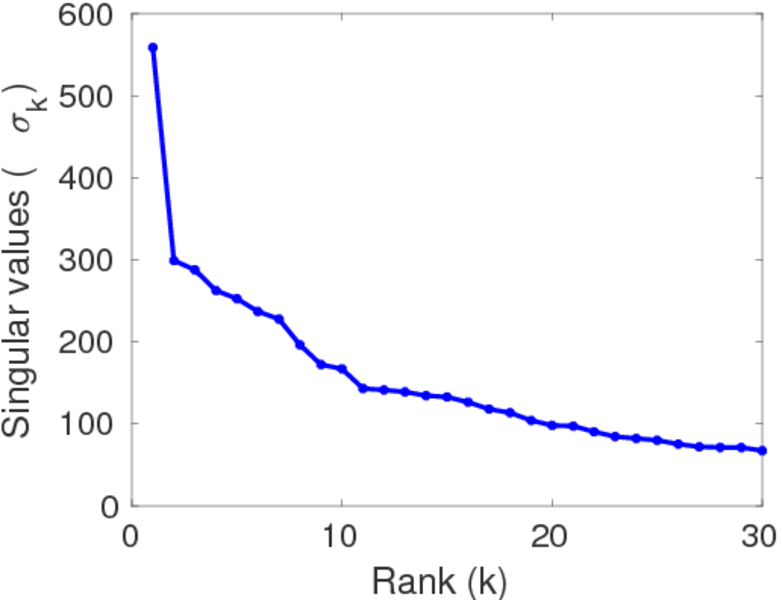
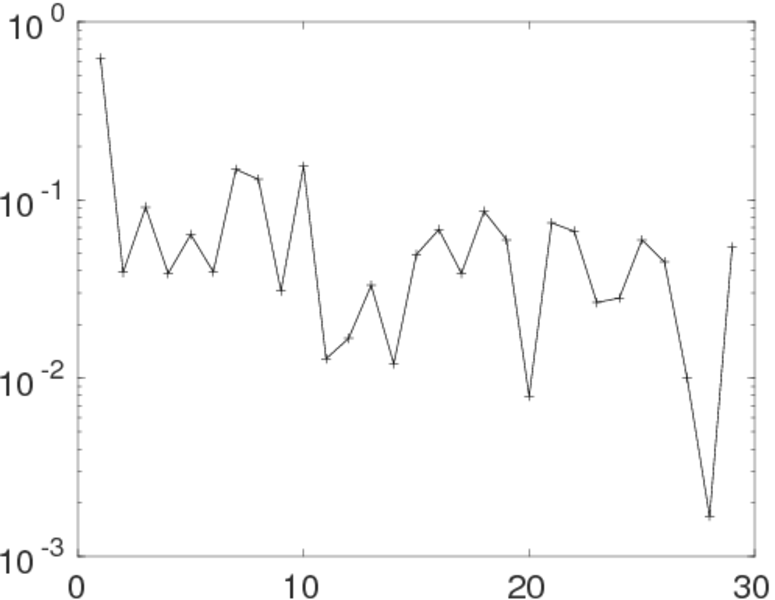
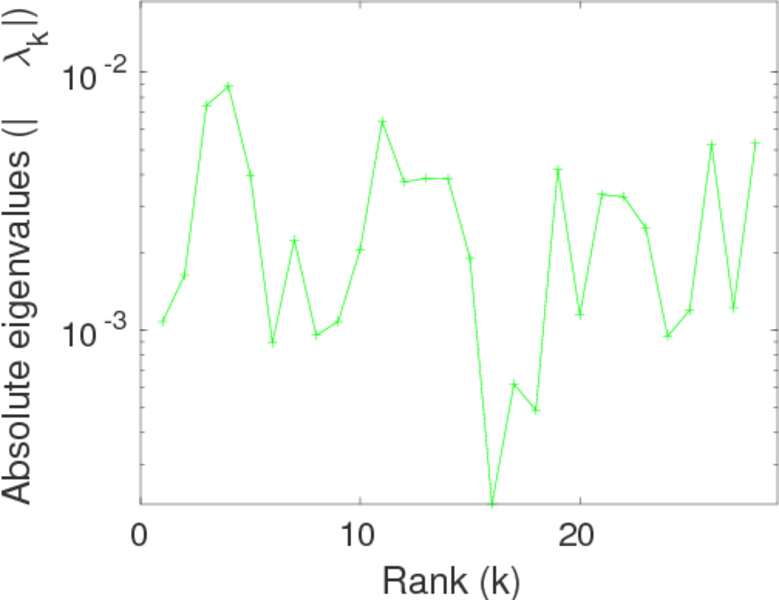
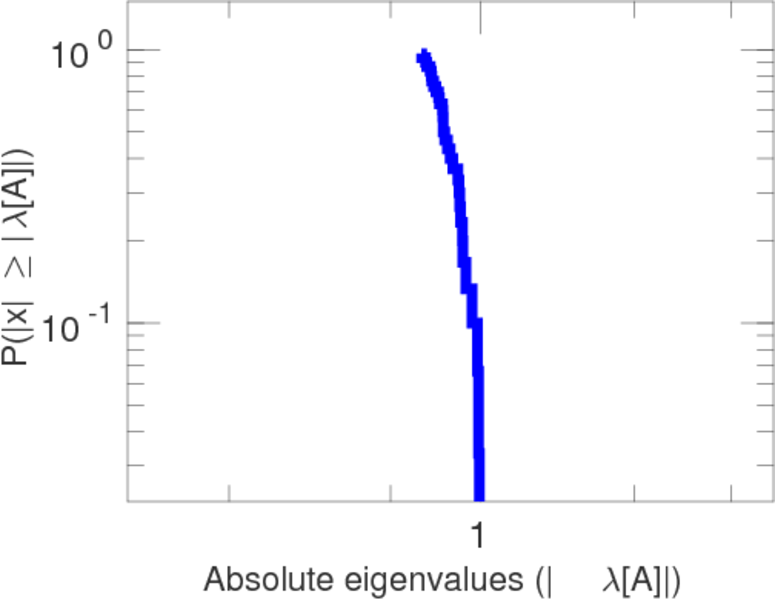
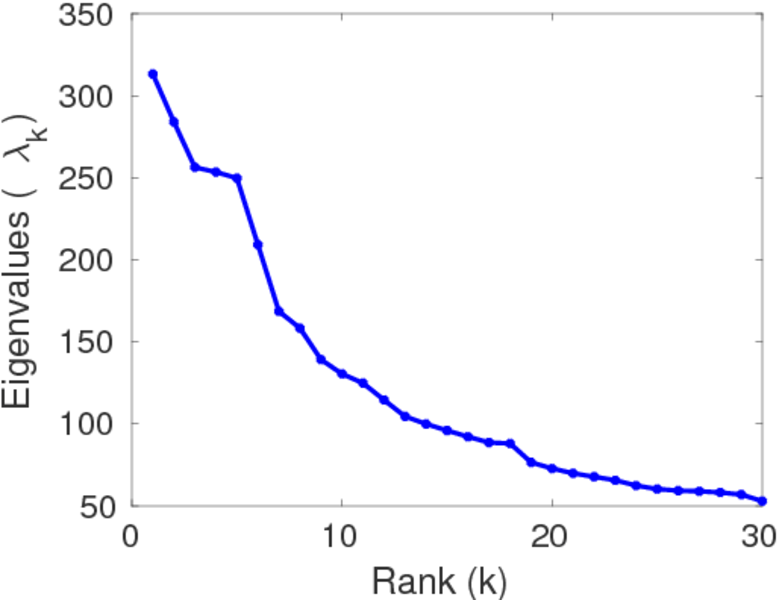
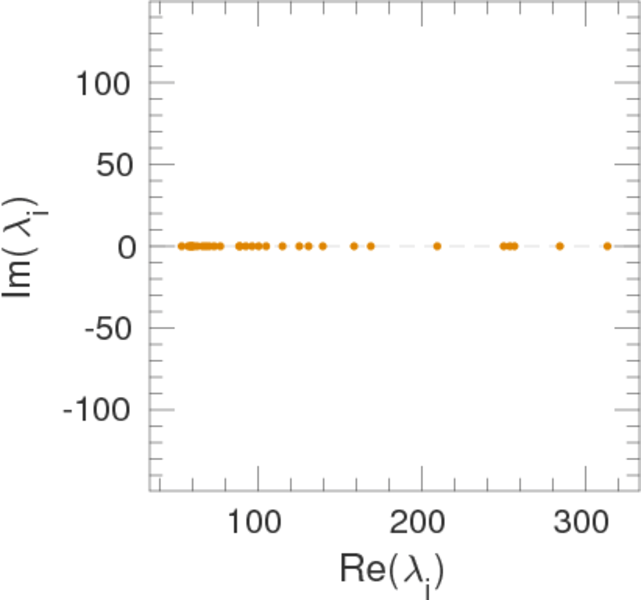
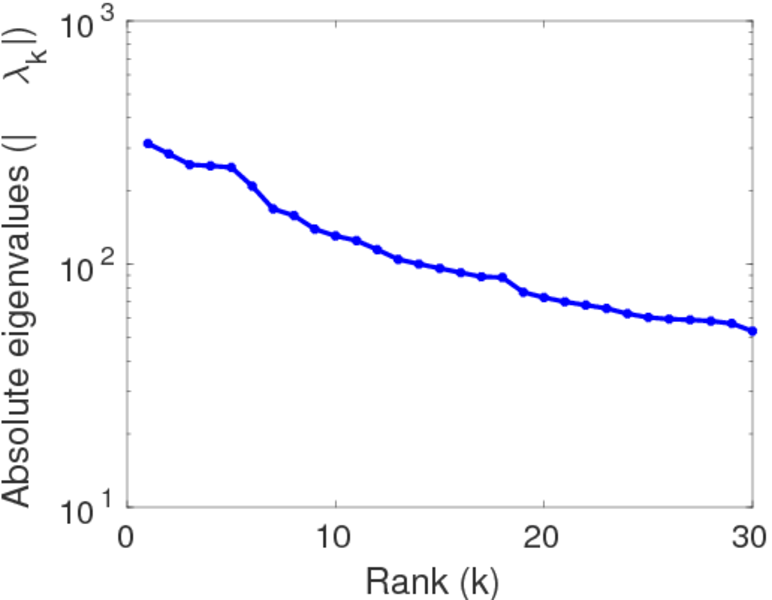
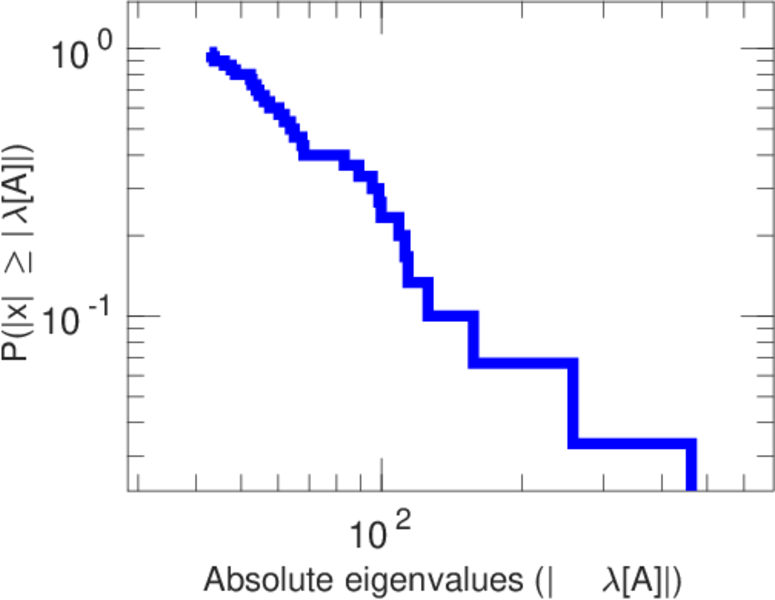
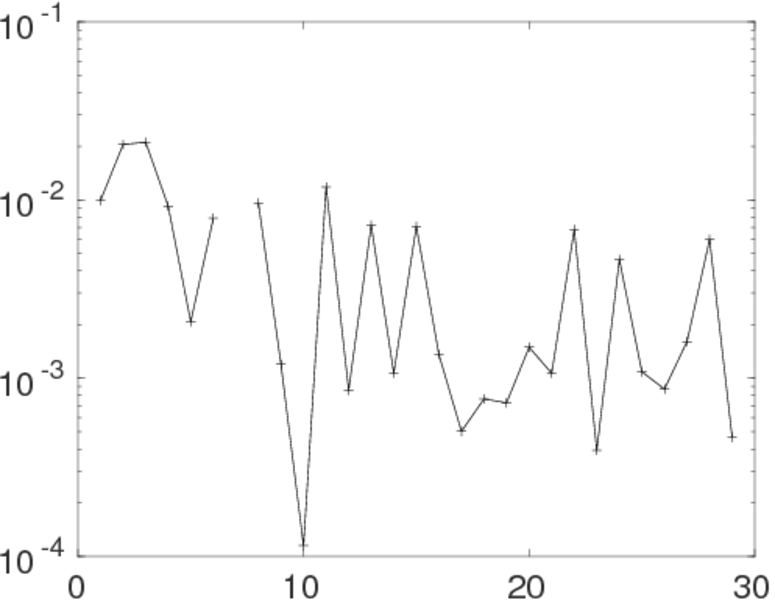
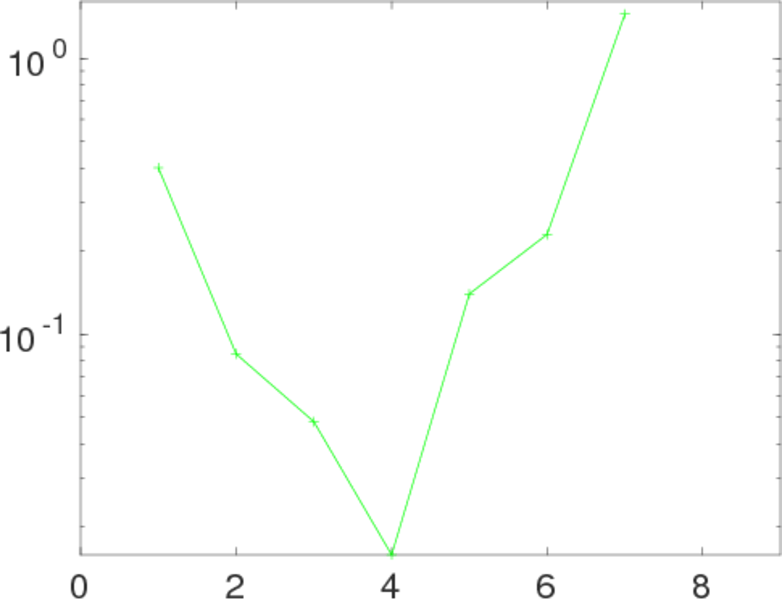
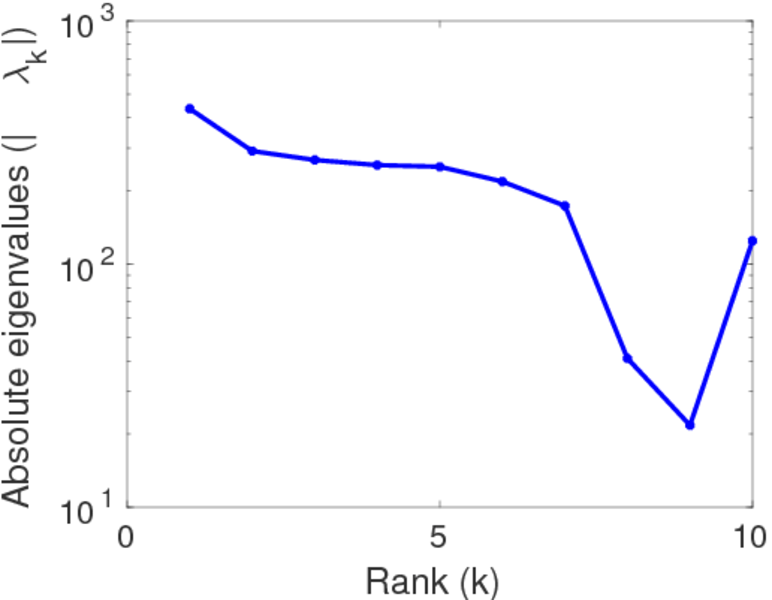
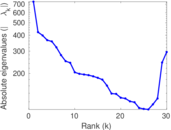
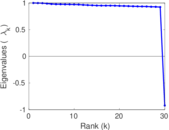
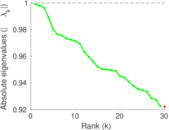
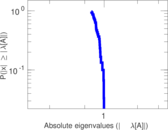
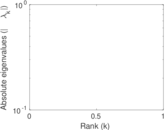
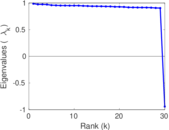
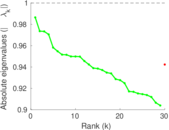
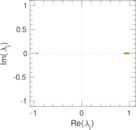
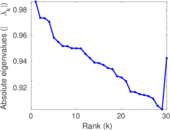
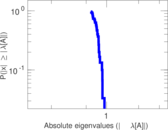
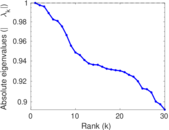
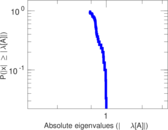
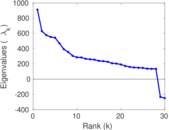
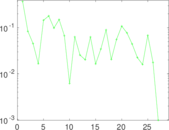
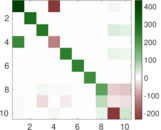
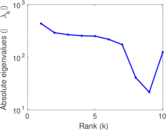
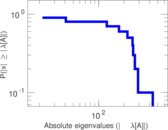
Matrix decompositions plots


Downloads
References
|
[1]
|
Jérôme Kunegis.
KONECT – The Koblenz Network Collection.
In Proc. Int. Conf. on World Wide Web Companion, pages
1343–1350, 2013.
[ http ]
|
 KONECT ‣ Networks ‣
Buy Me a Coffee
KONECT ‣ Networks ‣
Buy Me a Coffee