Wikipedia links (gu)
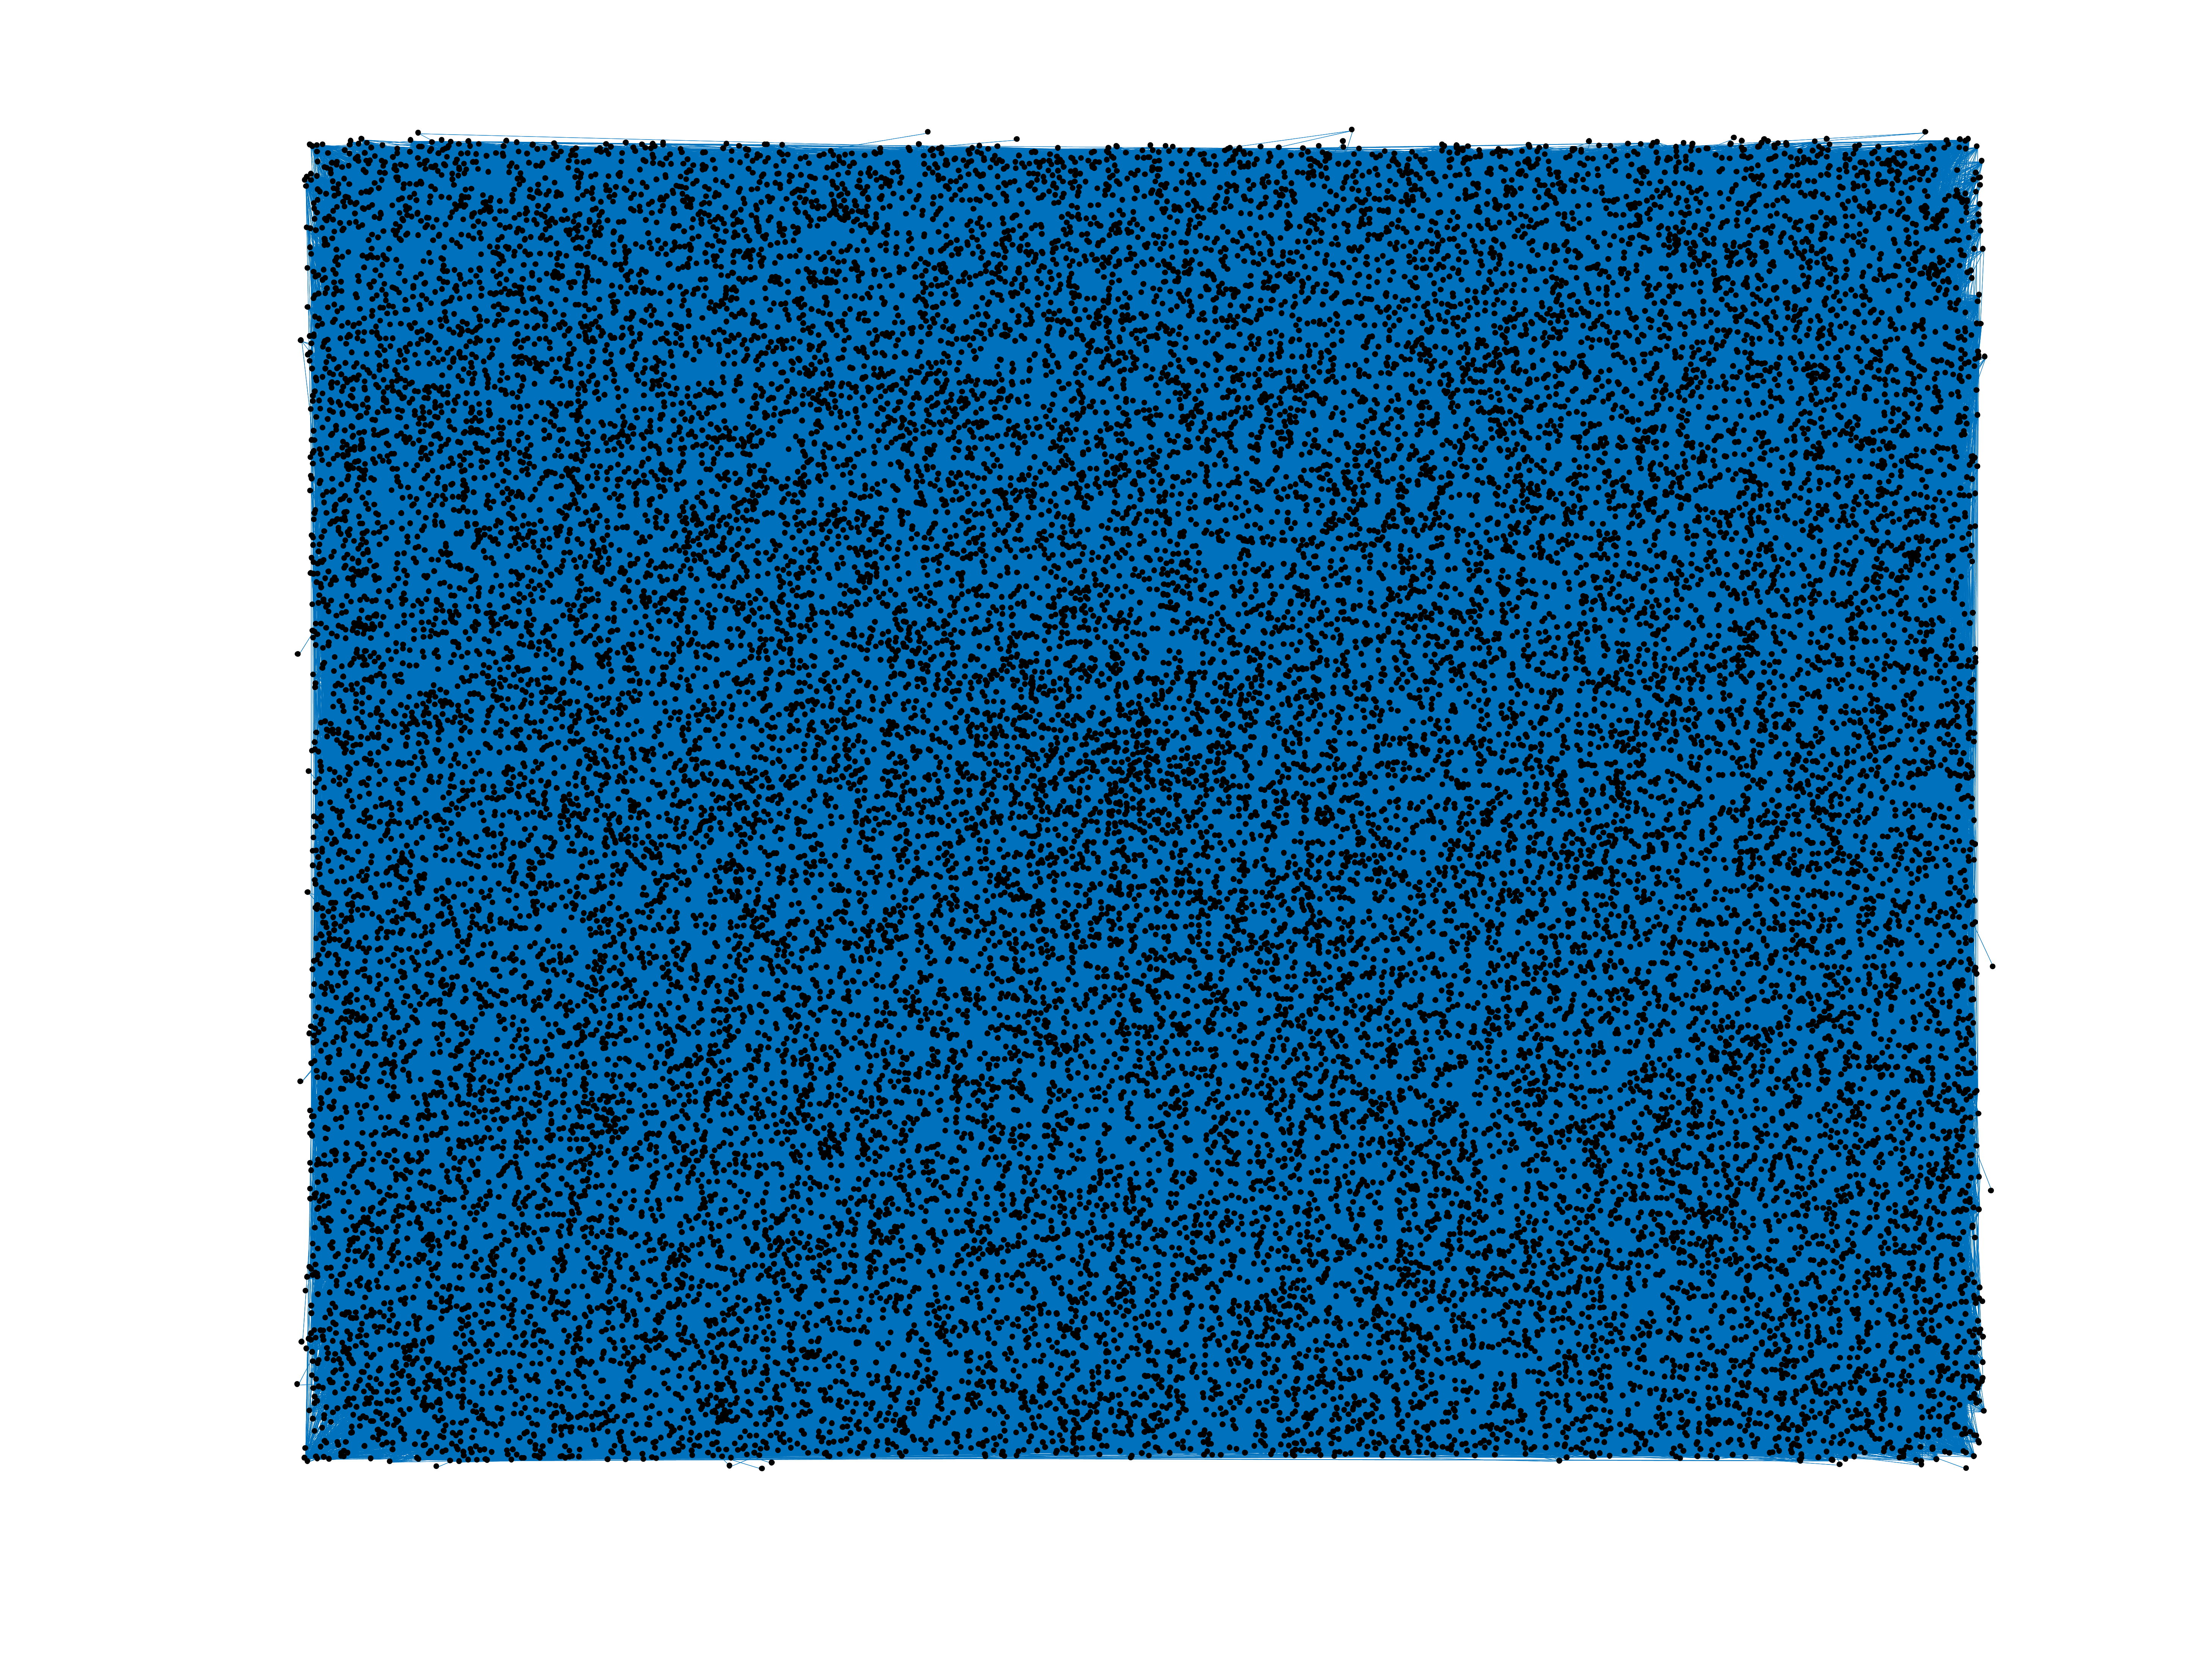
This network consists of the wikilinks of the Wikipedia in the Gujarati
language (gu). Nodes are Wikipedia articles, and directed edges are wikilinks,
i.e., hyperlinks within one wiki. In the wiki source, these are indicated with
[[double brackets]]. Only pages in the article namespace are included.
Metadata
Statistics
| Size | n = | 30,430
|
| Volume | m = | 1,327,439
|
| Loop count | l = | 53
|
| Wedge count | s = | 3,305,427,738
|
| Claw count | z = | 18,917,897,855,496
|
| Cross count | x = | 87,384,186,413,854,160
|
| Triangle count | t = | 33,580,708
|
| Square count | q = | 32,457,255,292
|
| 4-Tour count | T4 = | 271,983,603,176
|
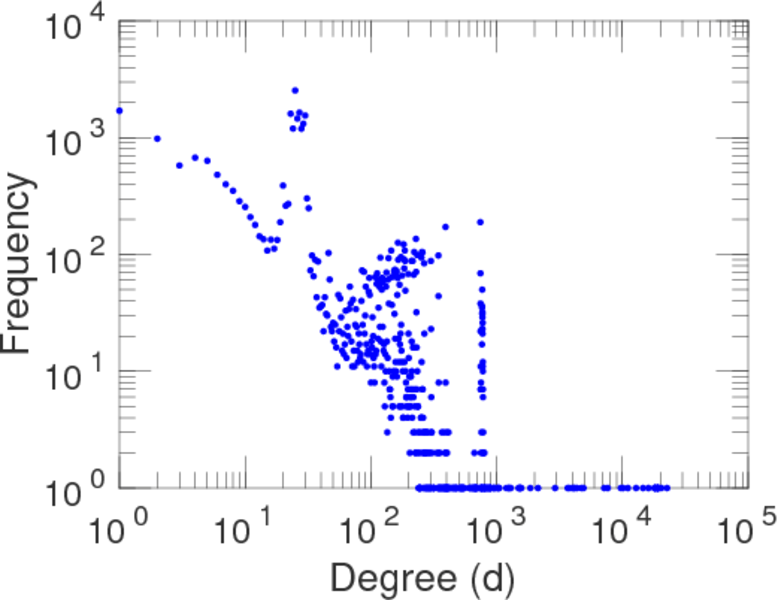
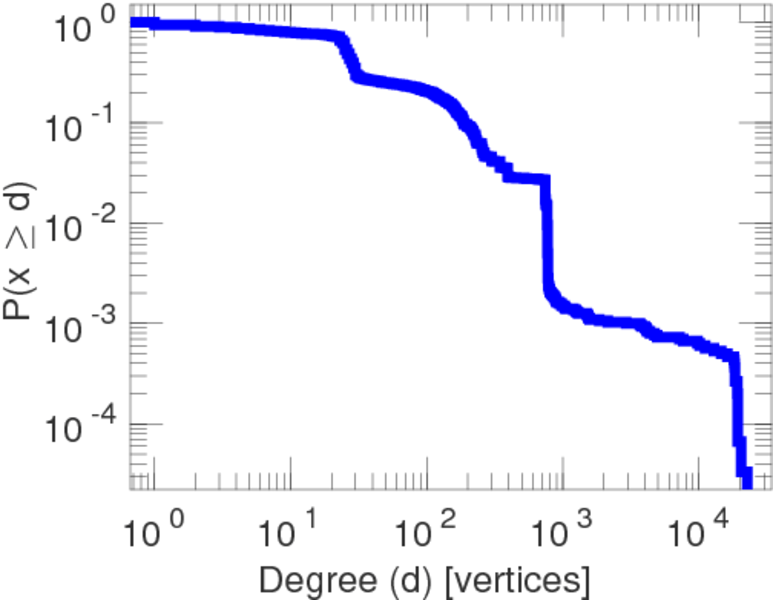
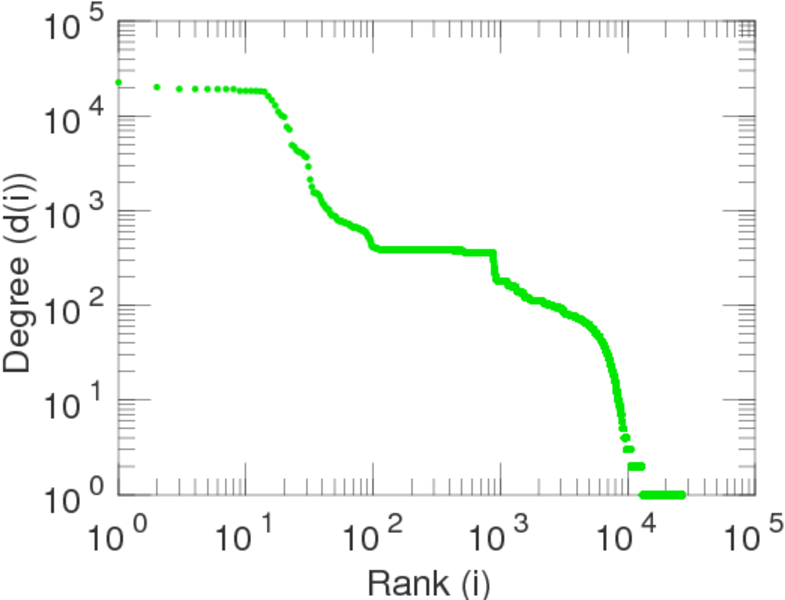
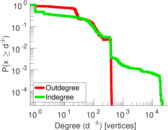
| Maximum degree | dmax = | 22,751
|
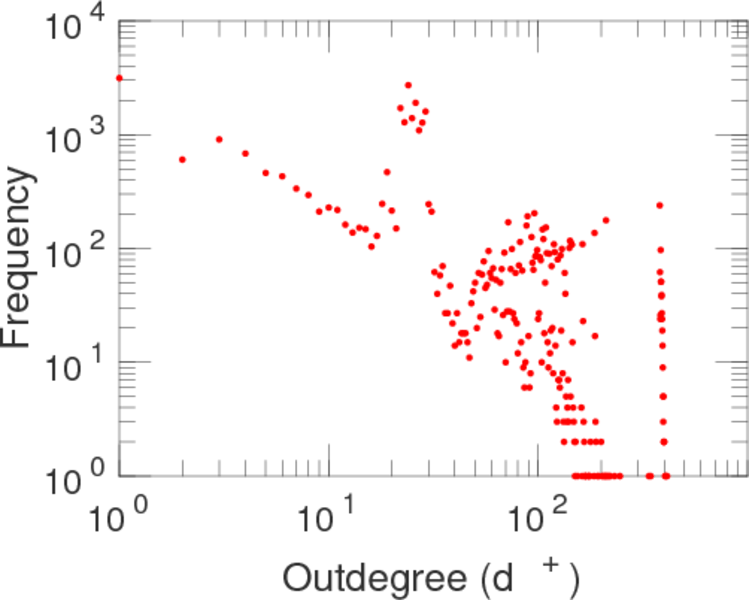
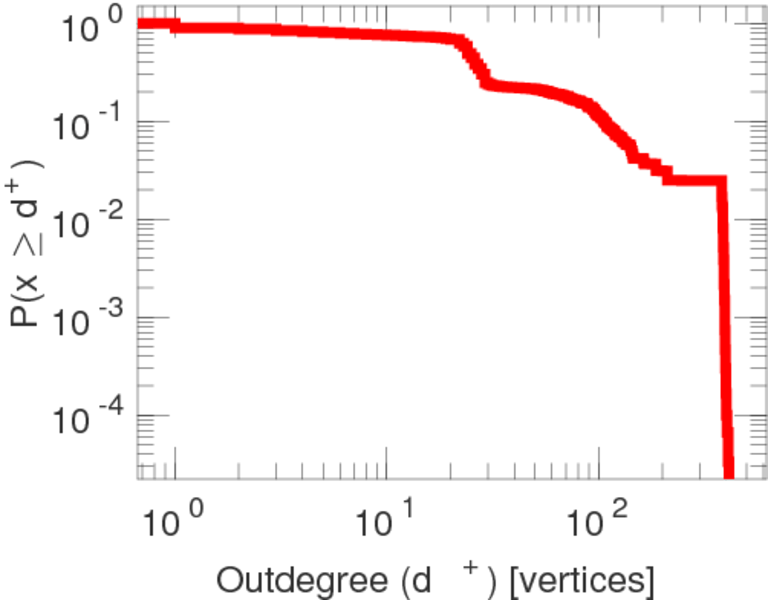
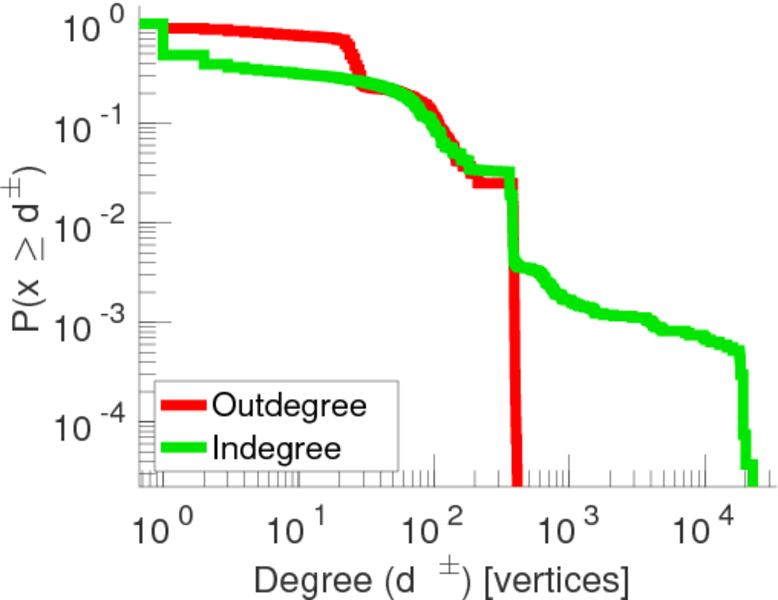
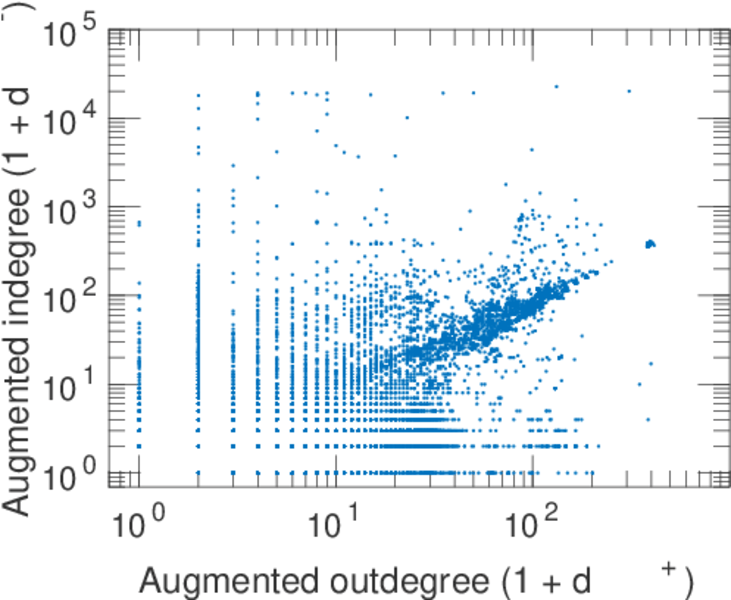
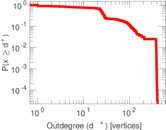
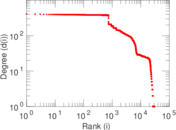
| Maximum outdegree | d+max = | 413
|
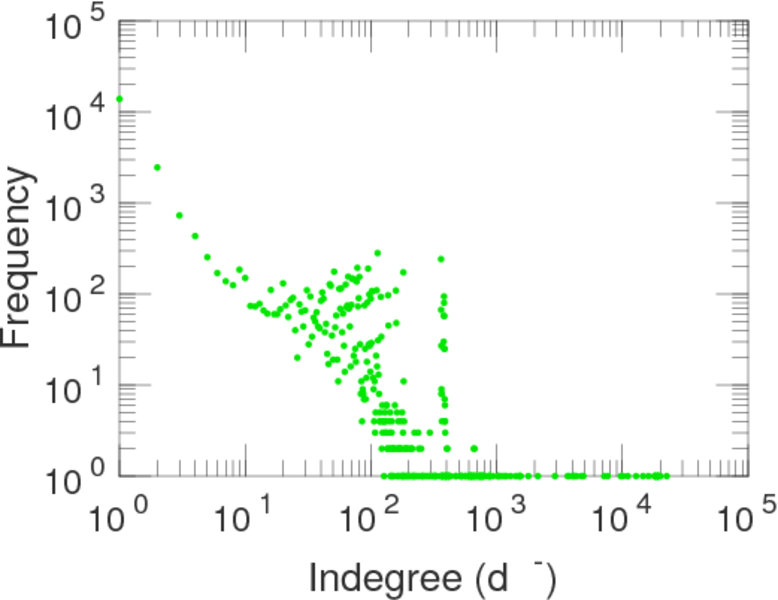
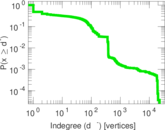
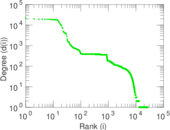
| Maximum indegree | d−max = | 22,620
|
| Average degree | d = | 87.245 4
|
| Fill | p = | 0.001 433 54
|
| Size of LCC | N = | 30,407
|
| Size of LSCC | Ns = | 26,127
|
| Relative size of LSCC | Nrs = | 0.858 593
|
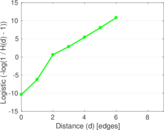
| Diameter | δ = | 9
|
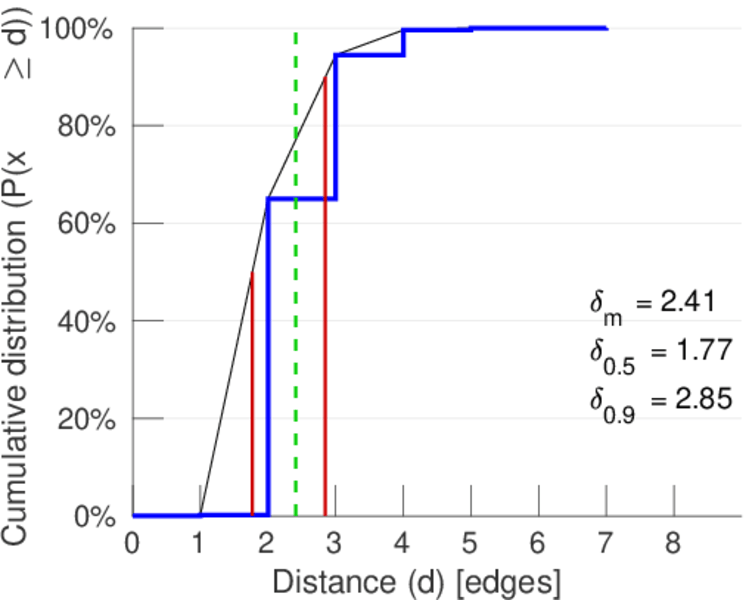
| 50-Percentile effective diameter | δ0.5 = | 1.768 84
|
| 90-Percentile effective diameter | δ0.9 = | 2.848 58
|
| Median distance | δM = | 2
|
| Mean distance | δm = | 2.408 28
|
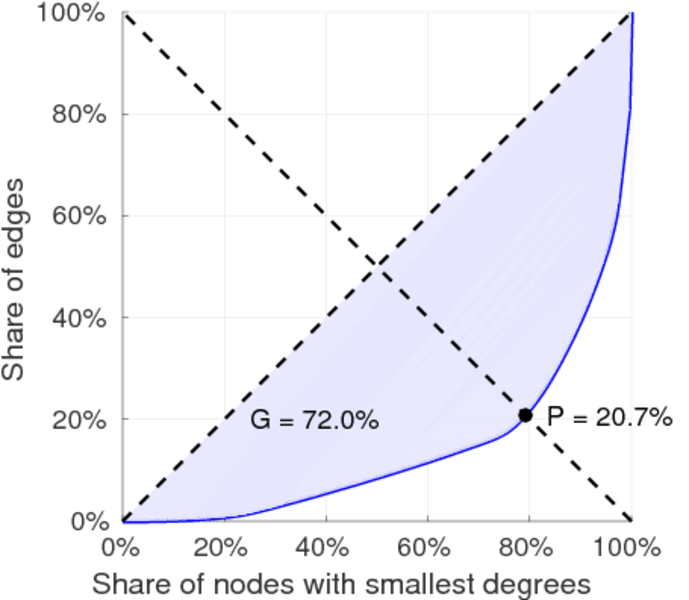
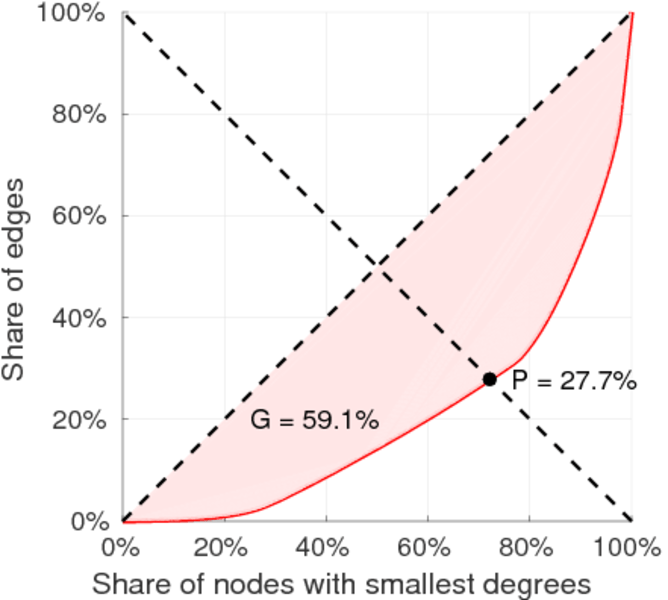
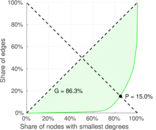
| Gini coefficient | G = | 0.721 475
|
| Balanced inequality ratio | P = | 0.206 689
|
| Outdegree balanced inequality ratio | P+ = | 0.274 522
|
| Indegree balanced inequality ratio | P− = | 0.157 588
|
| Relative edge distribution entropy | Her = | 0.863 187
|
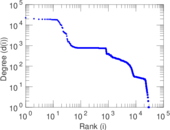
| Power law exponent | γ = | 1.321 79
|
| Tail power law exponent | γt = | 2.121 00
|
| Degree assortativity | ρ = | −0.254 064
|
| Degree assortativity p-value | pρ = | 0.000 00
|
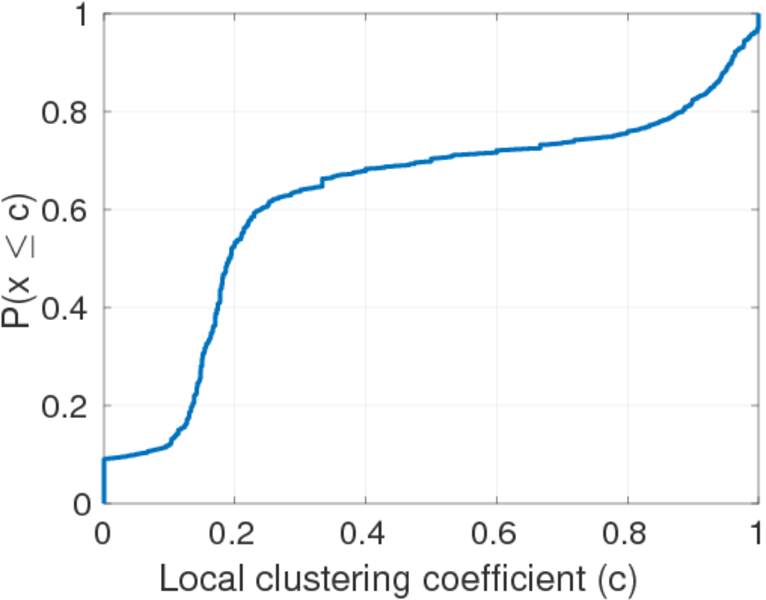
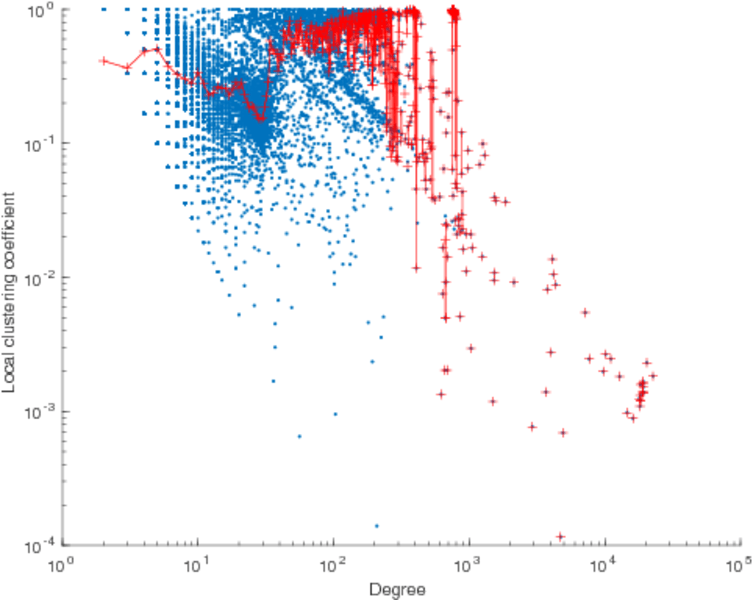
| Clustering coefficient | c = | 0.030 477 8
|
| Directed clustering coefficient | c± = | 0.885 205
|
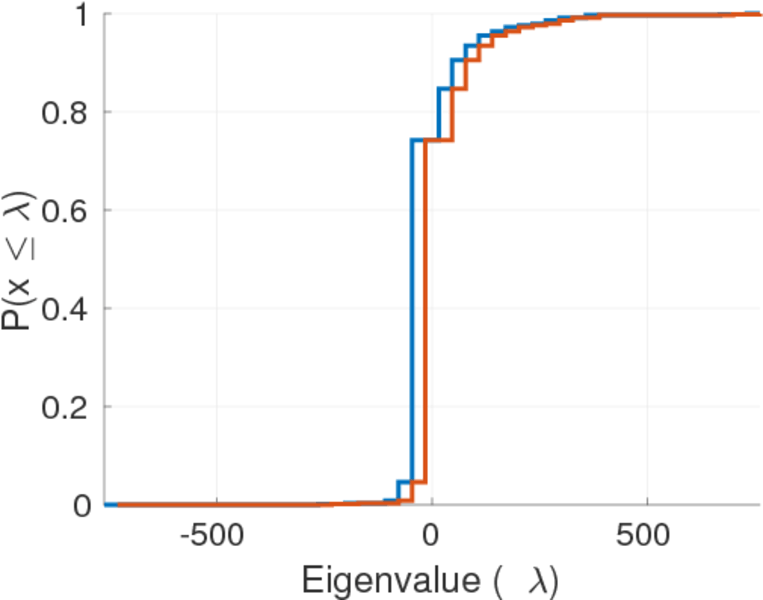
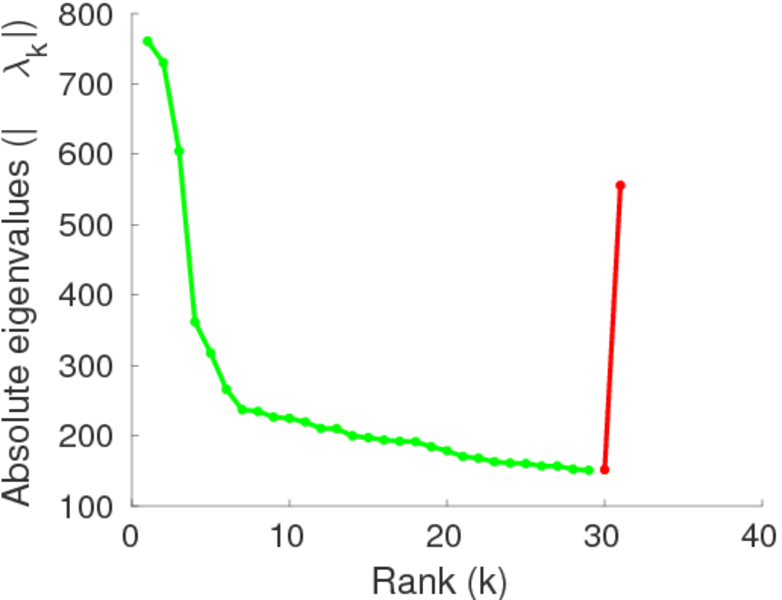
| Spectral norm | α = | 760.939
|
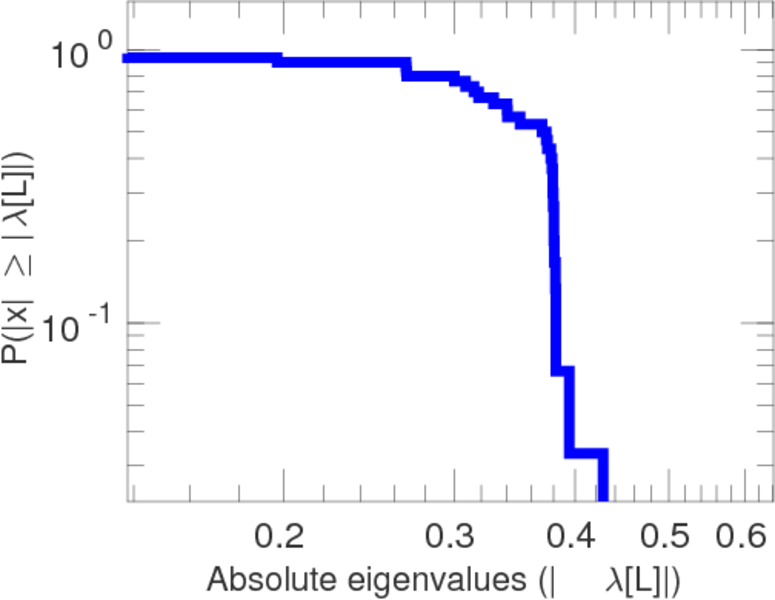
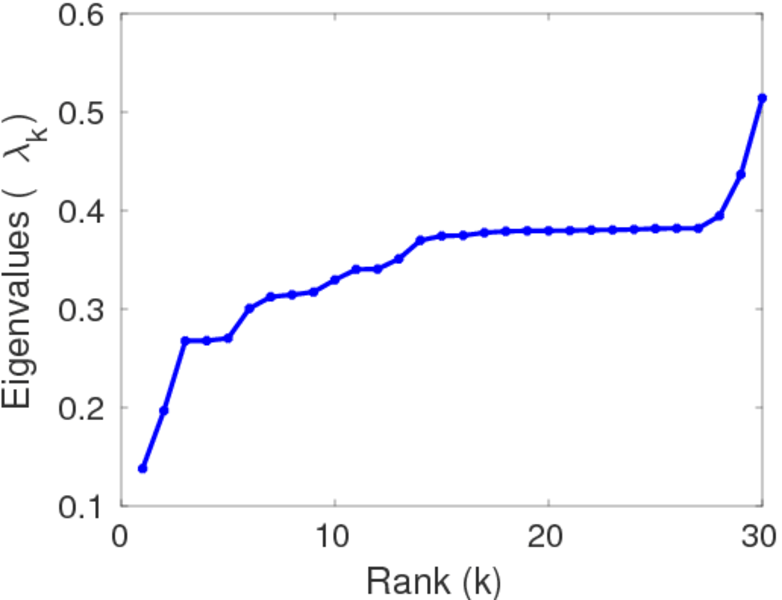
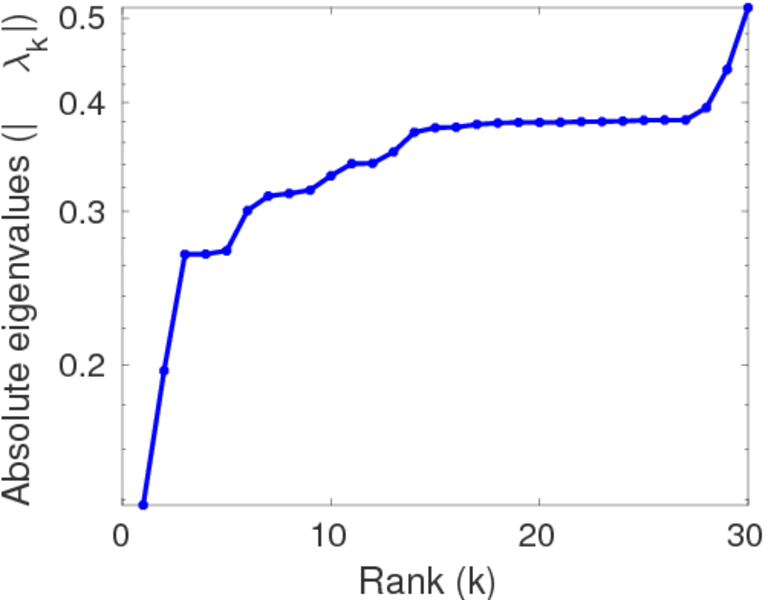
| Algebraic connectivity | a = | 0.137 993
|
| Reciprocity | y = | 0.570 365
|
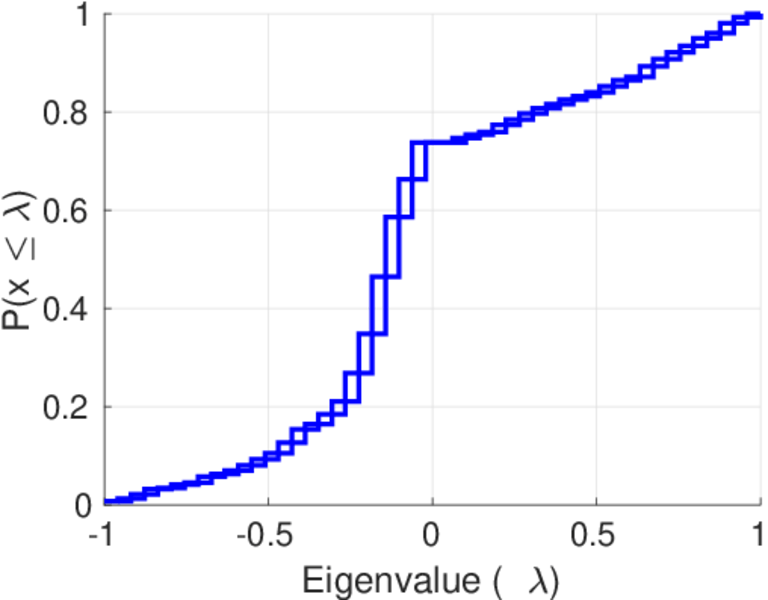
| Non-bipartivity | bA = | 0.270 755
|
| Spectral bipartite frustration | bK = | 0.000 552 832
|
| Controllability | C = | 16,336
|
| Relative controllability | Cr = | 0.536 839
|
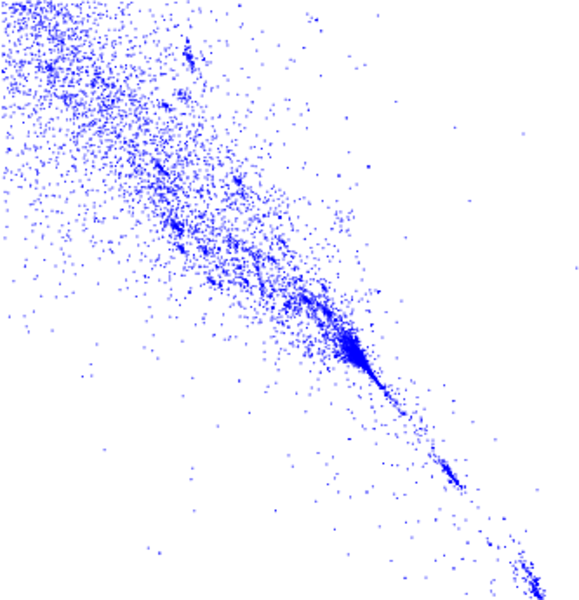
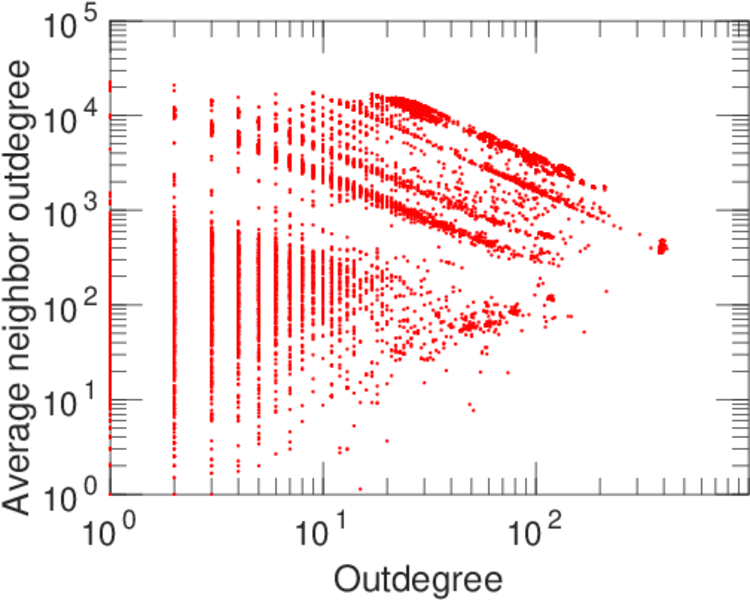
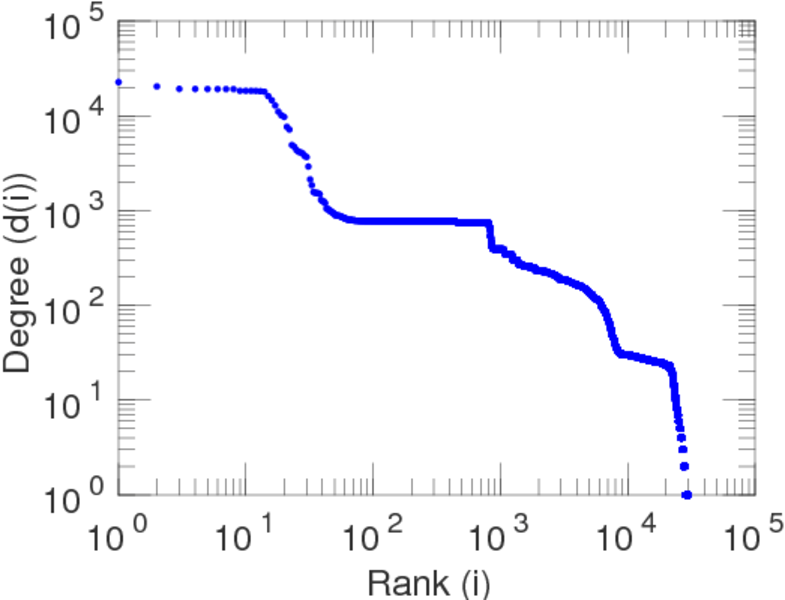
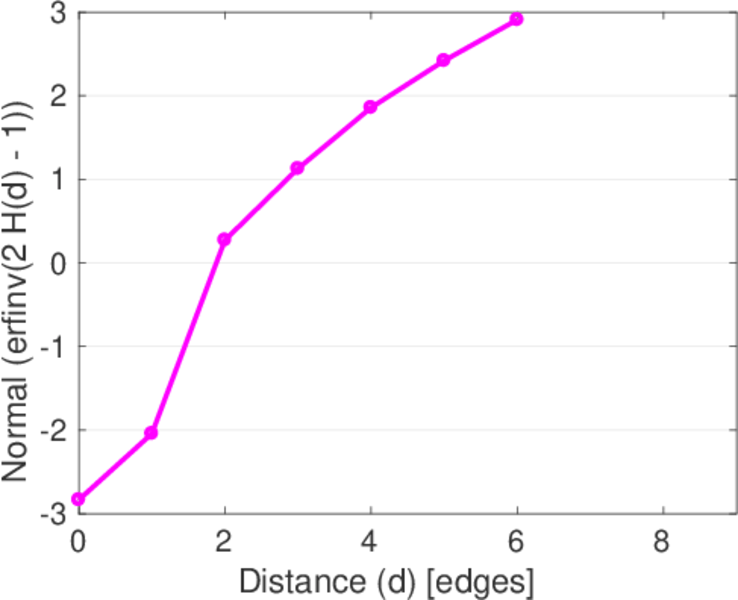
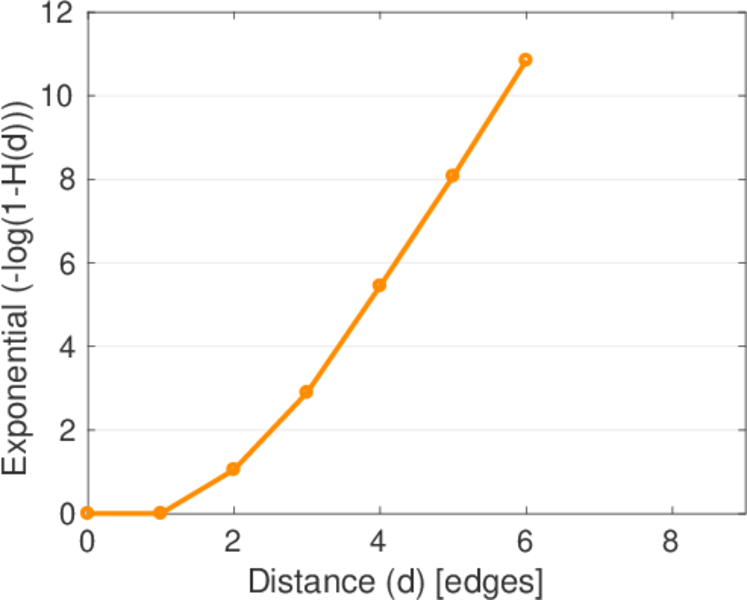
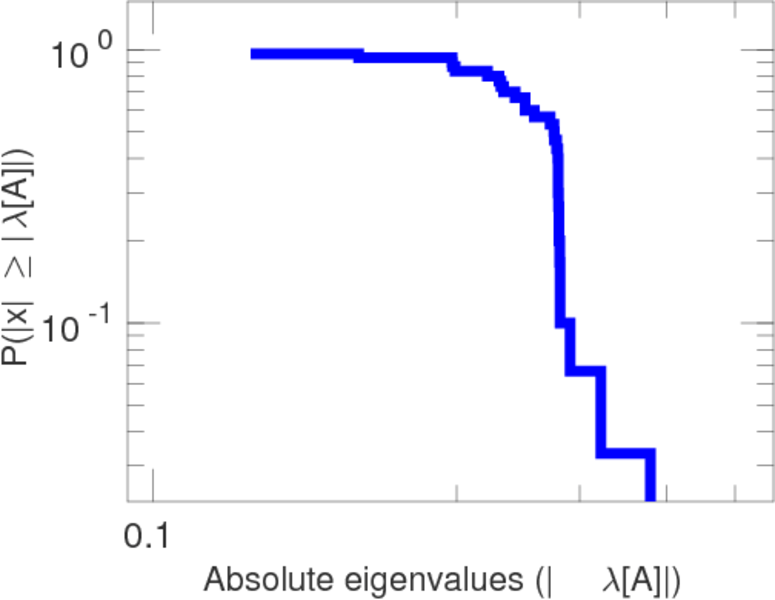
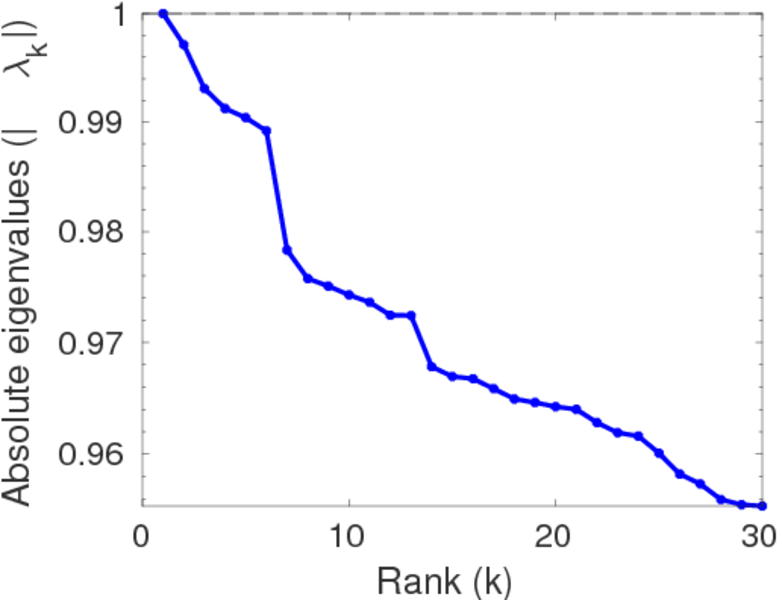
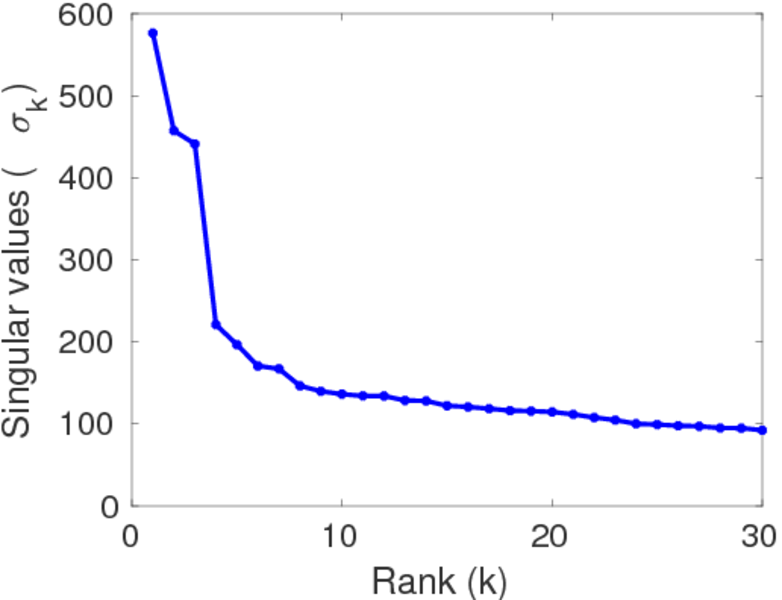
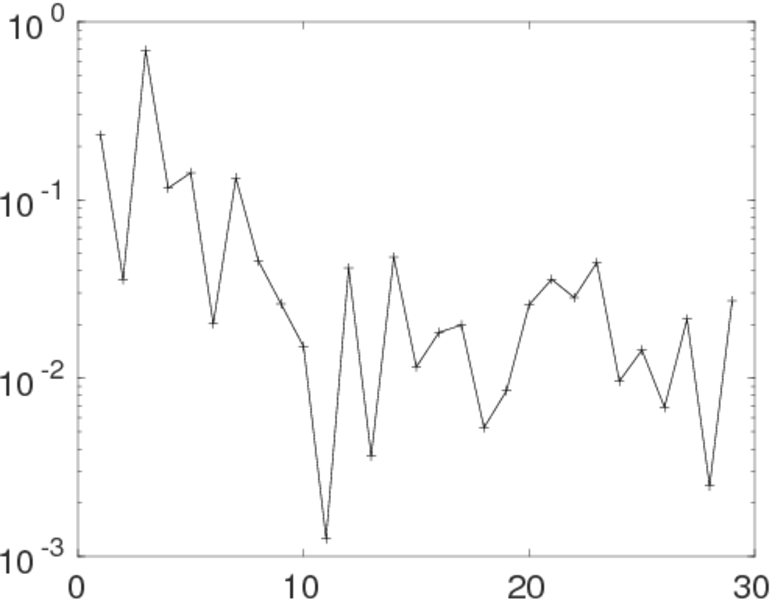
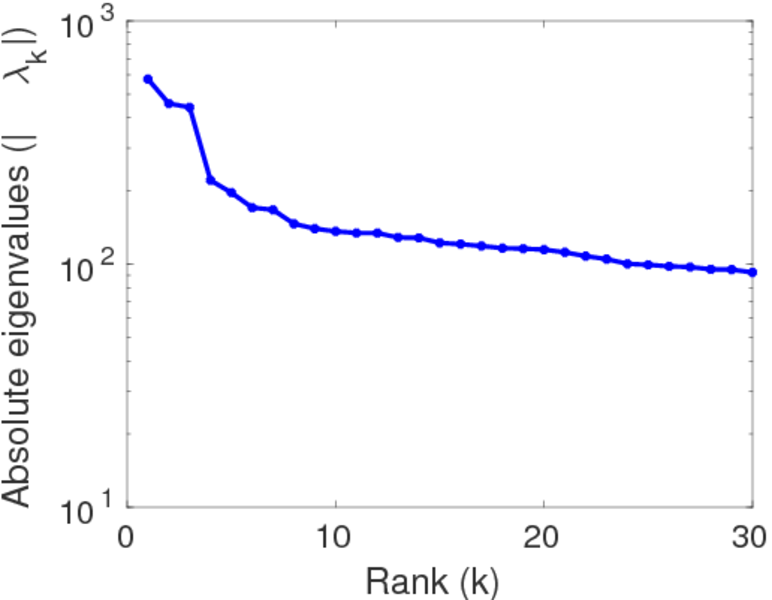
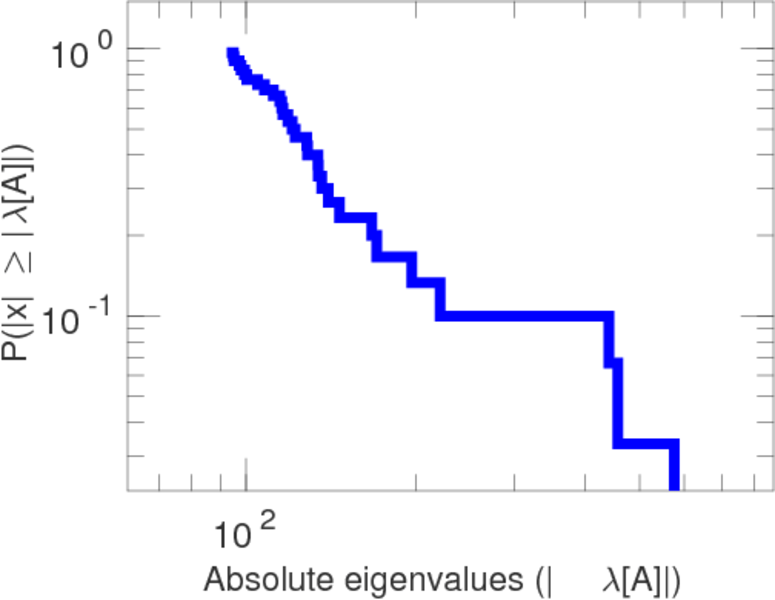
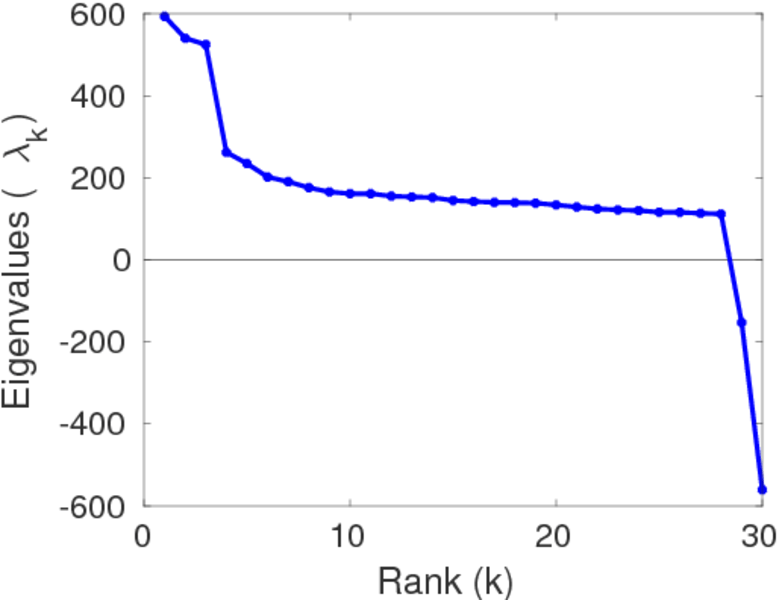
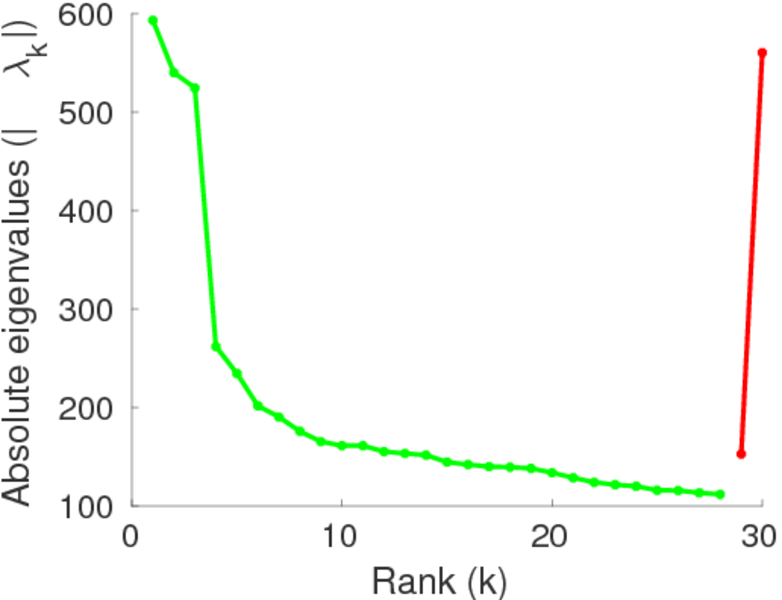
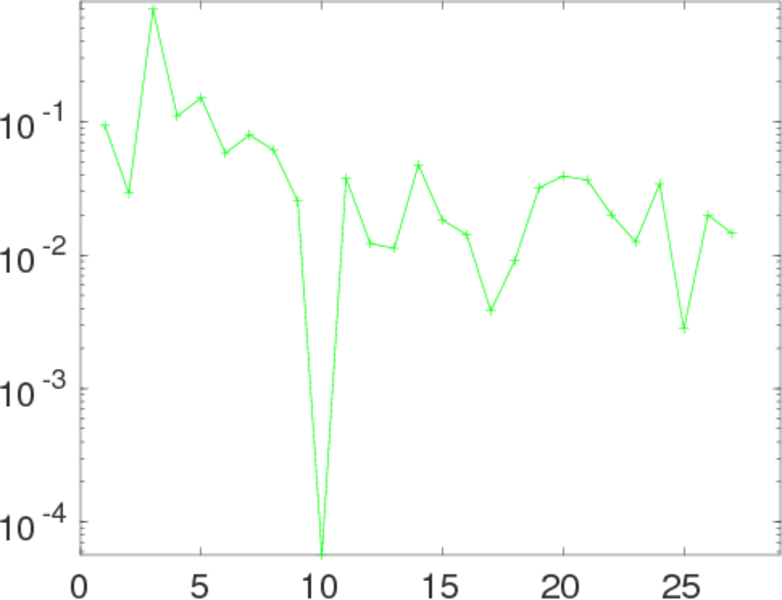
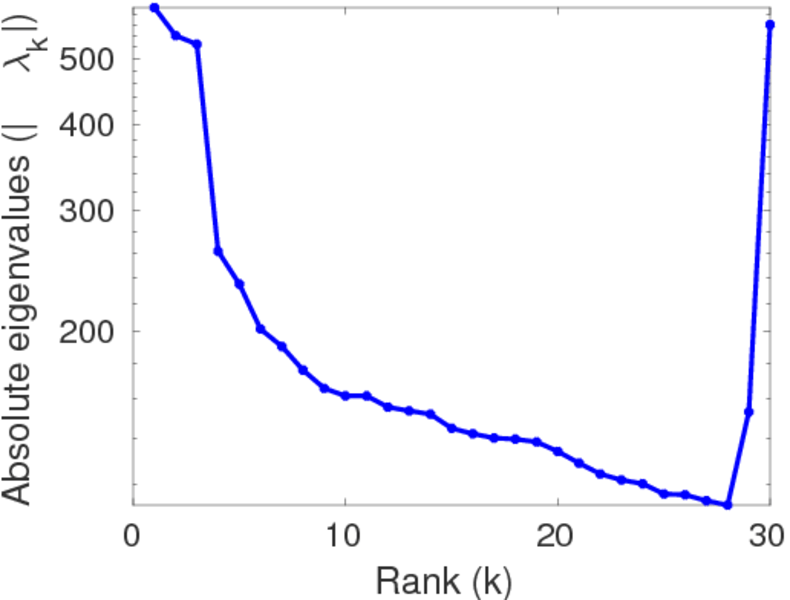
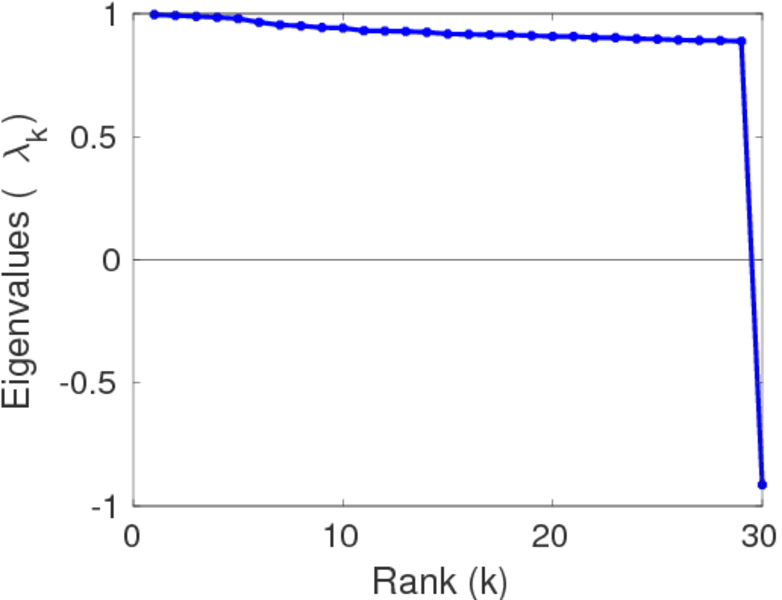
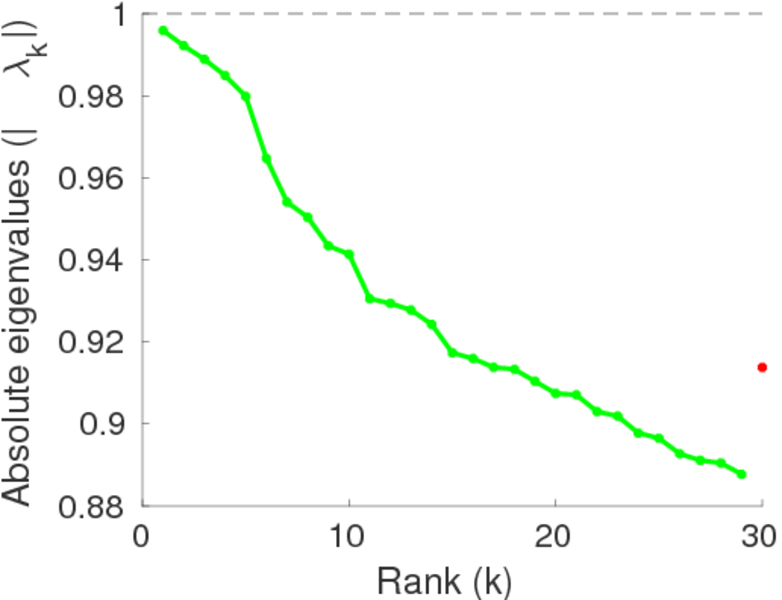
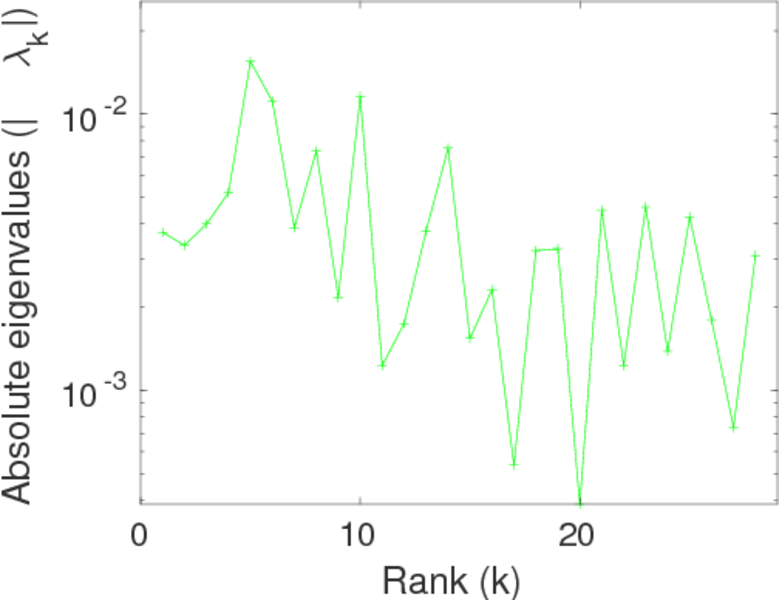
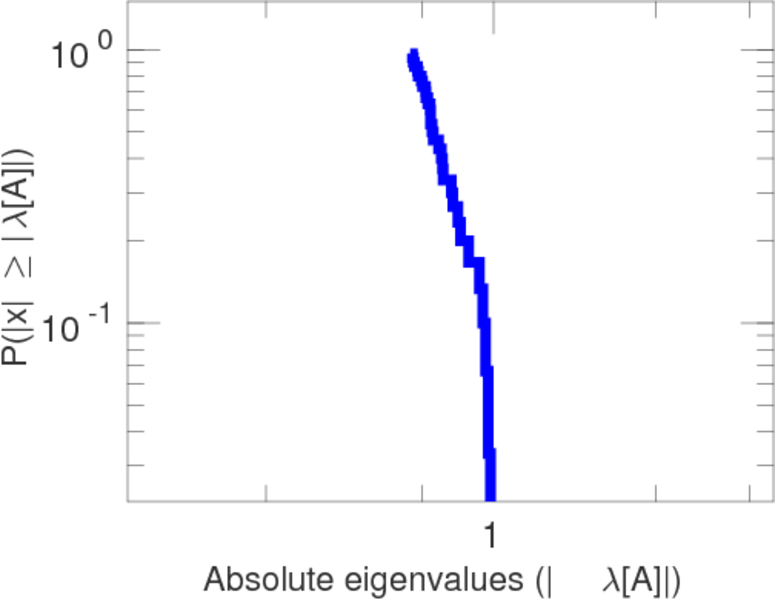
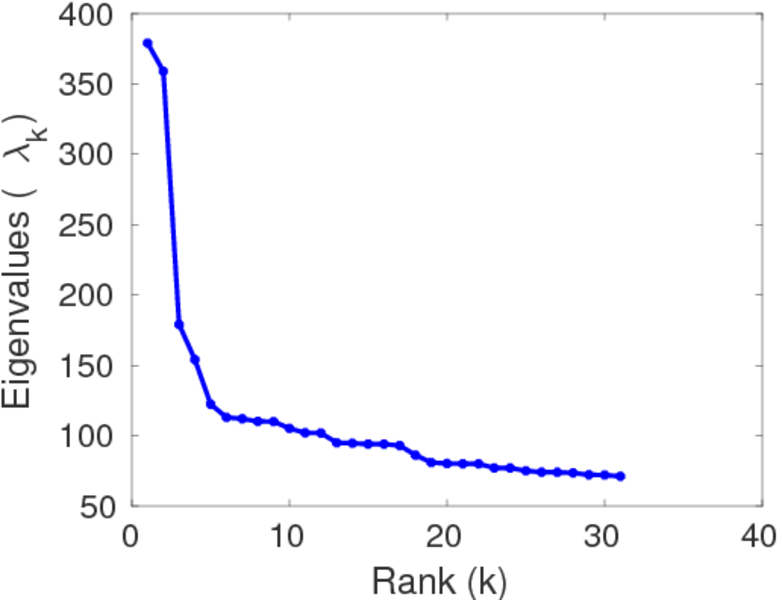
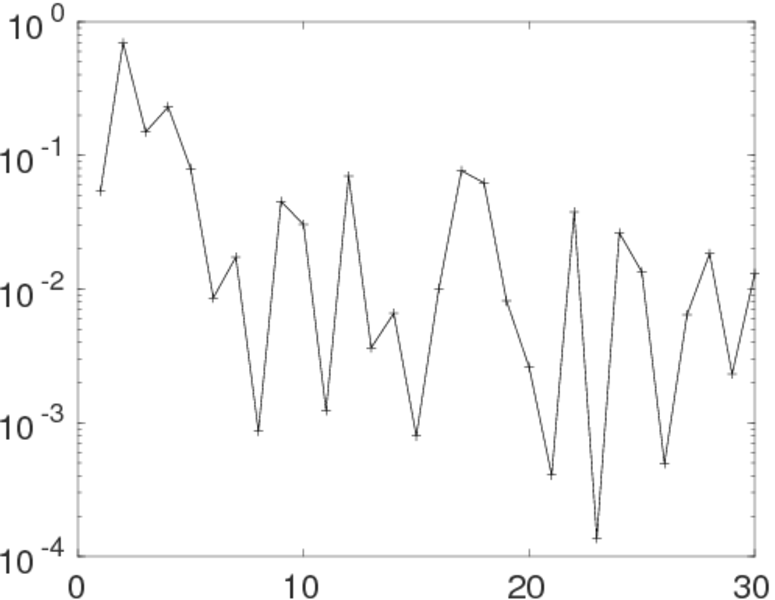
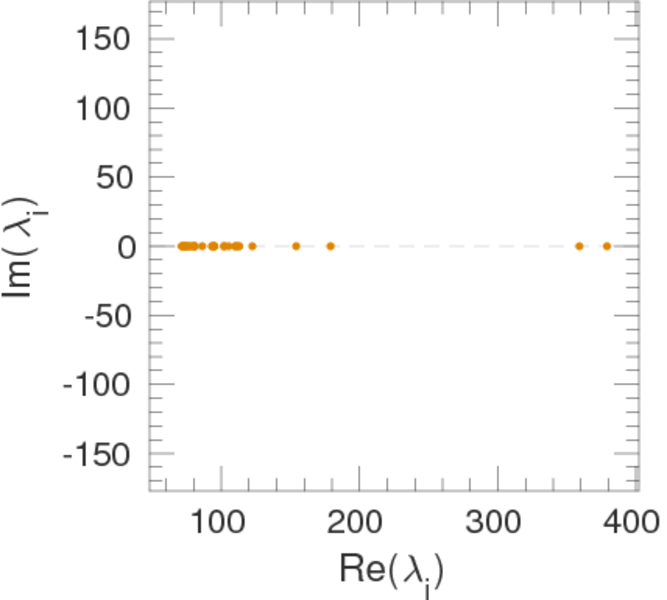
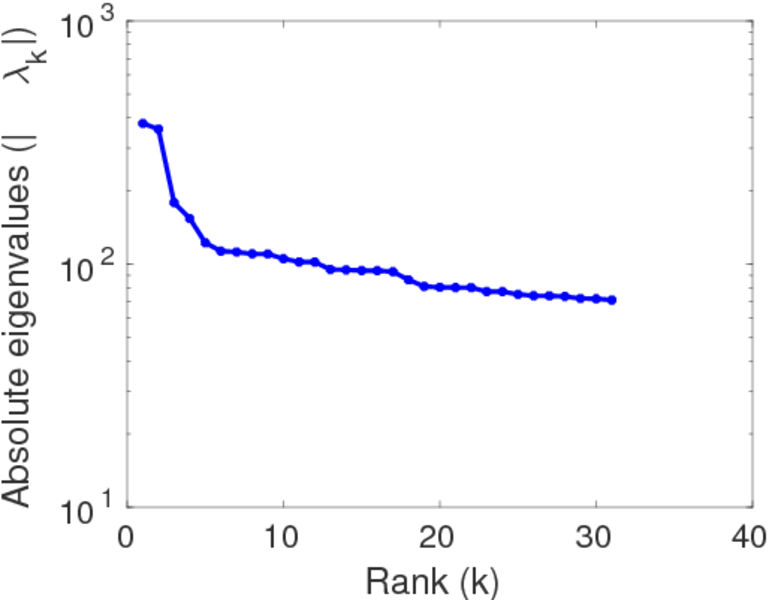
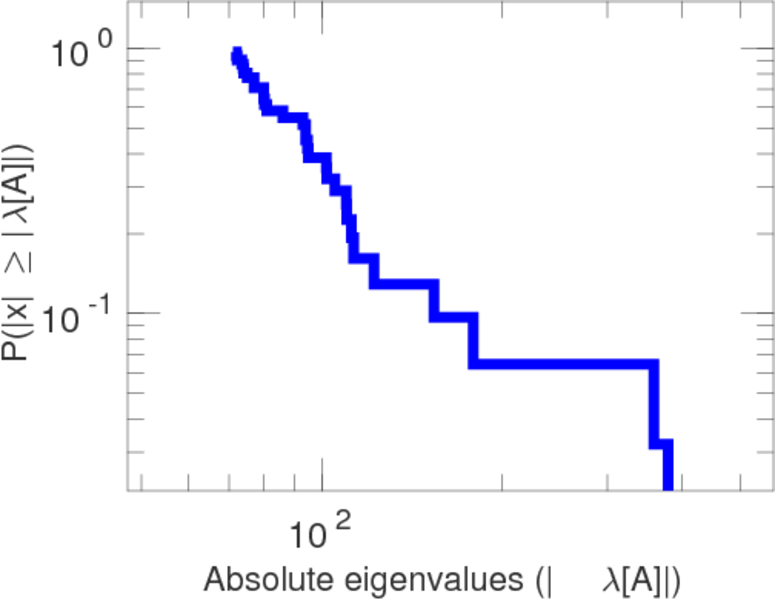
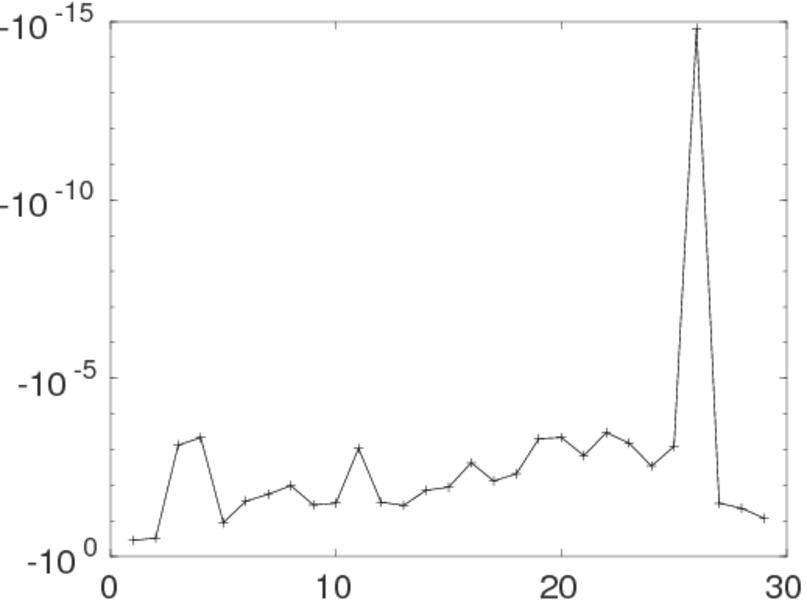
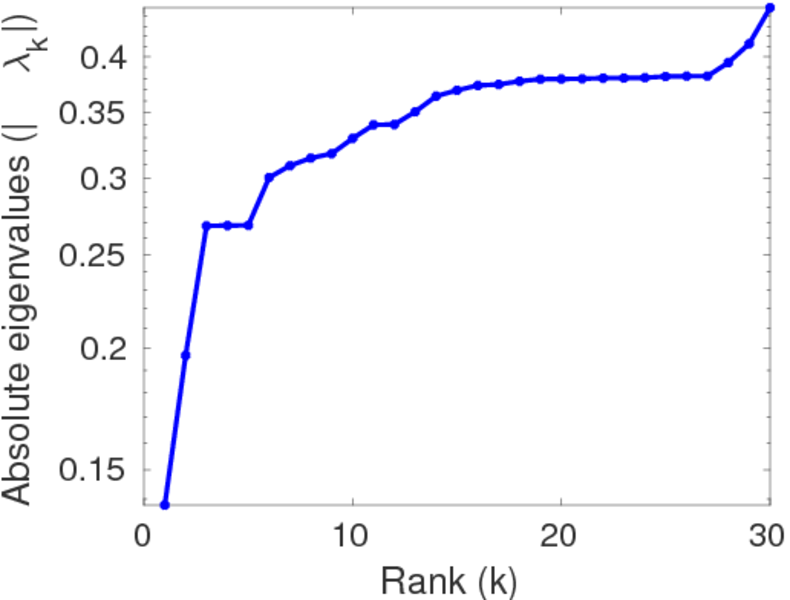
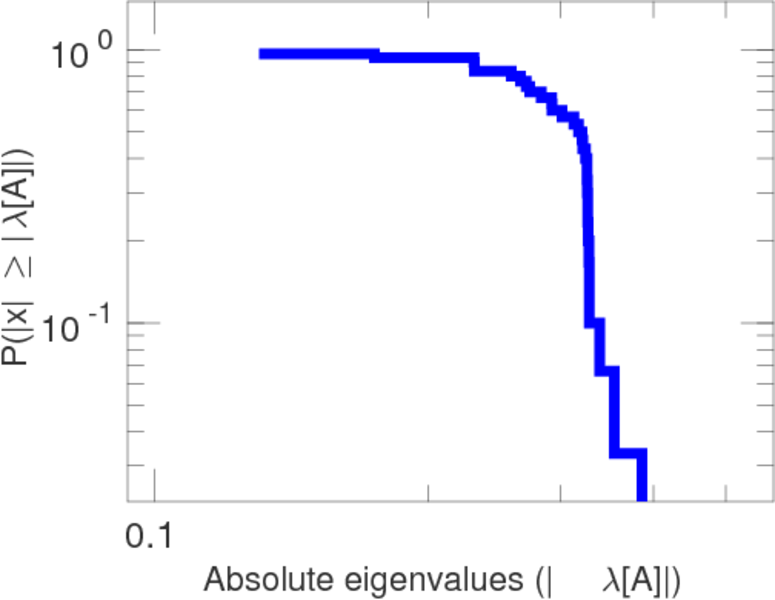
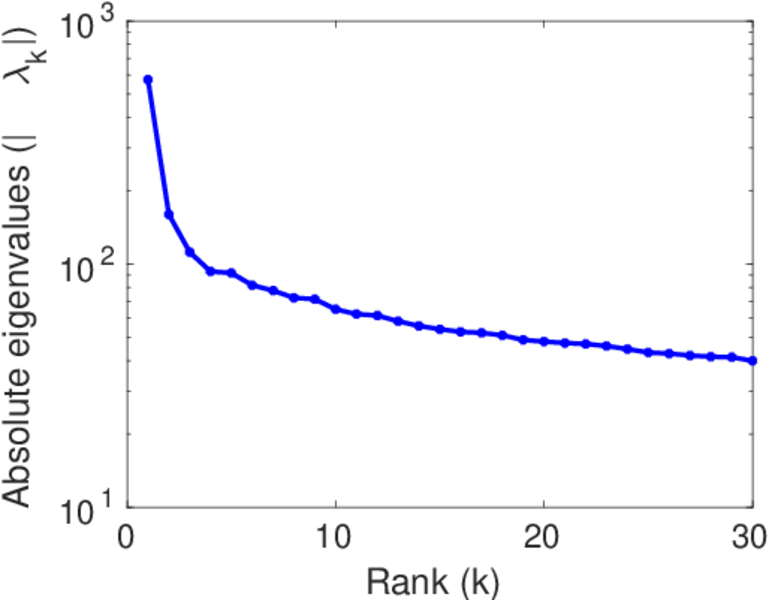
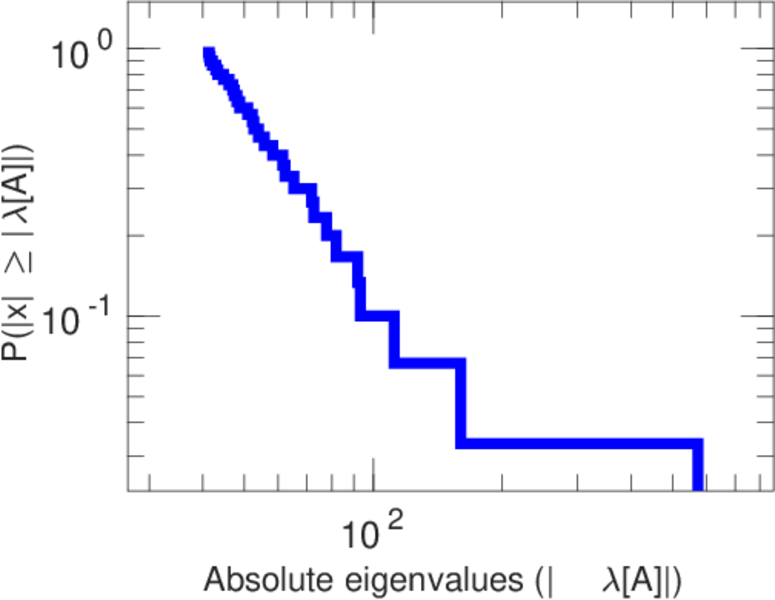
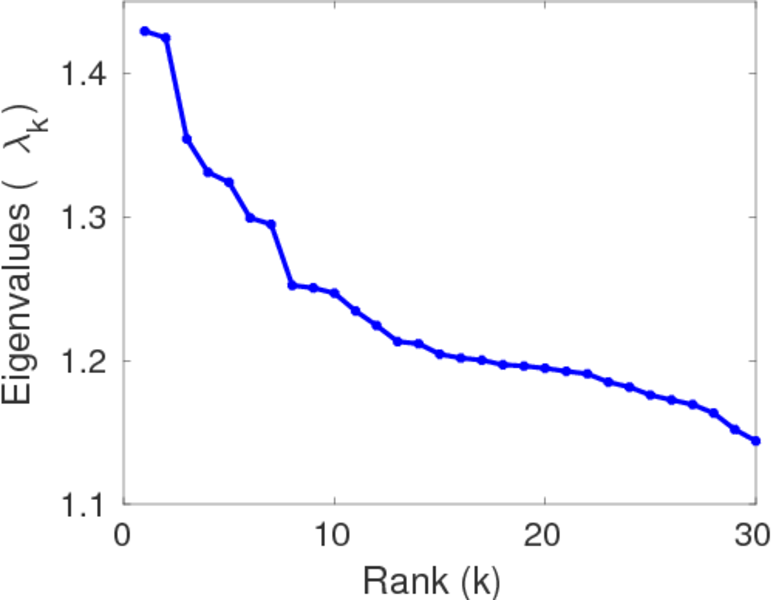
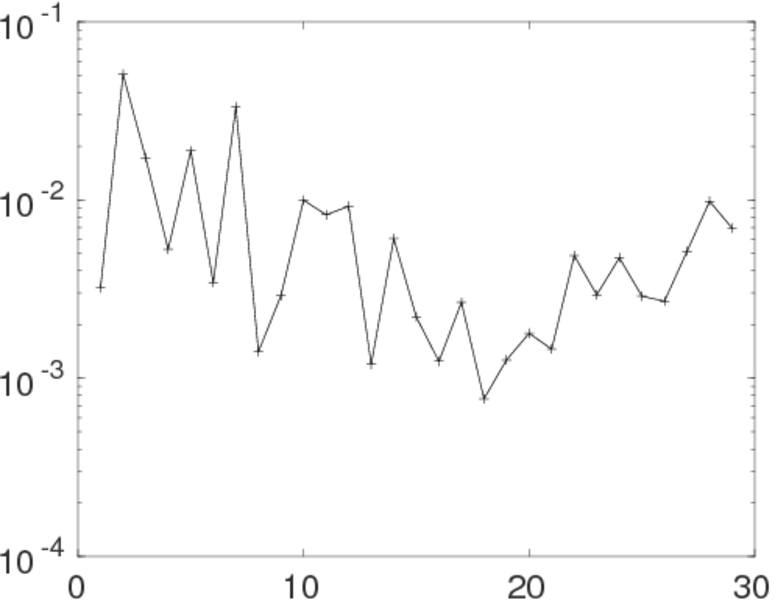
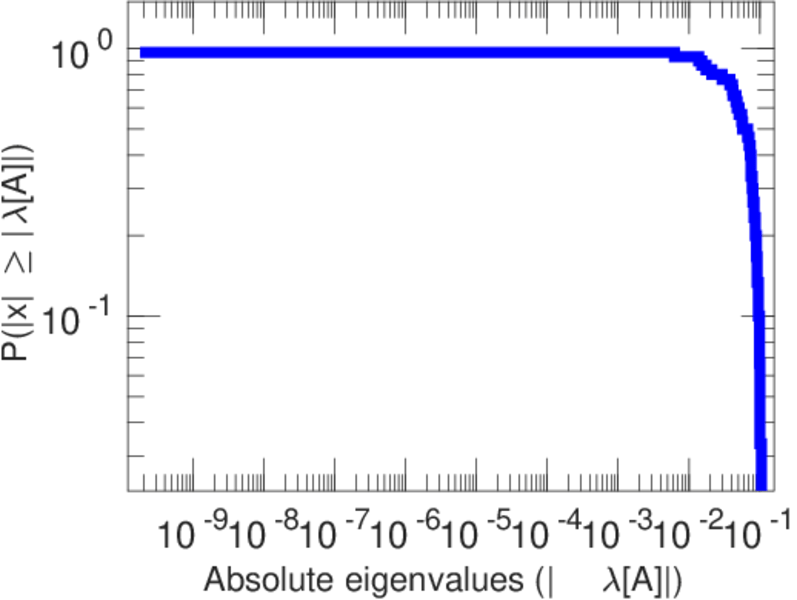
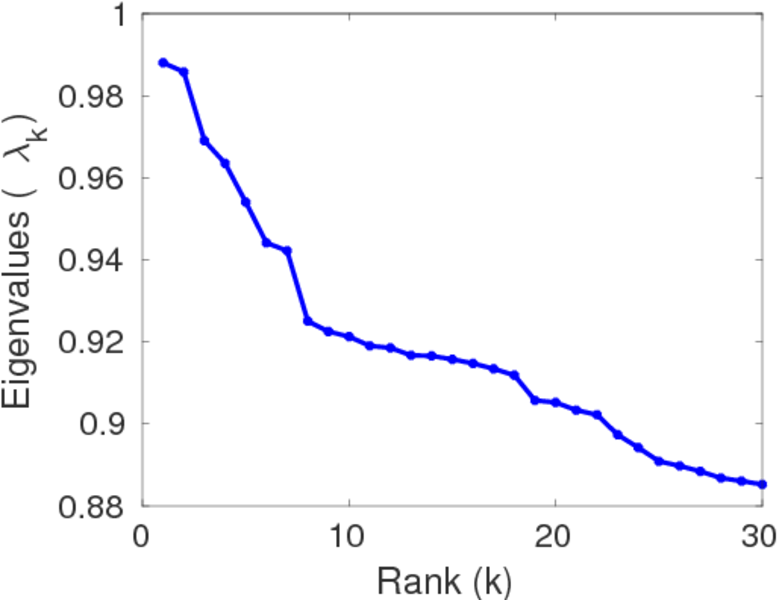
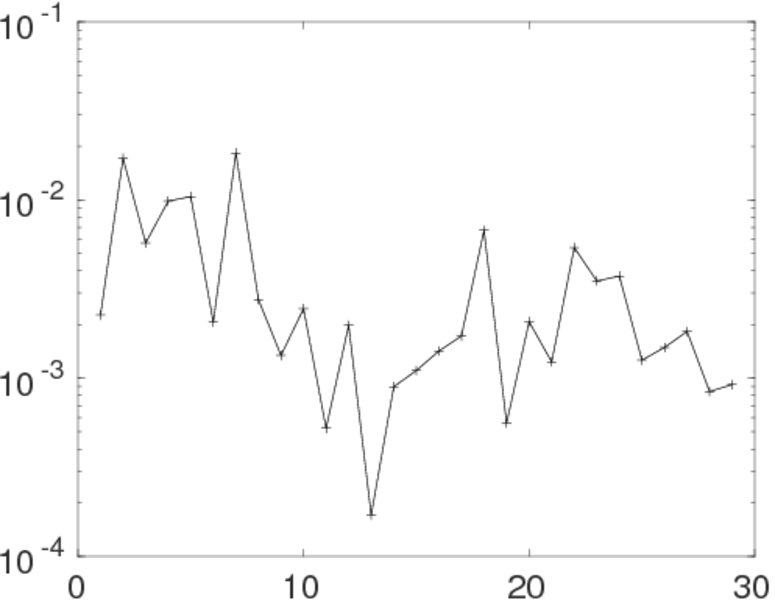
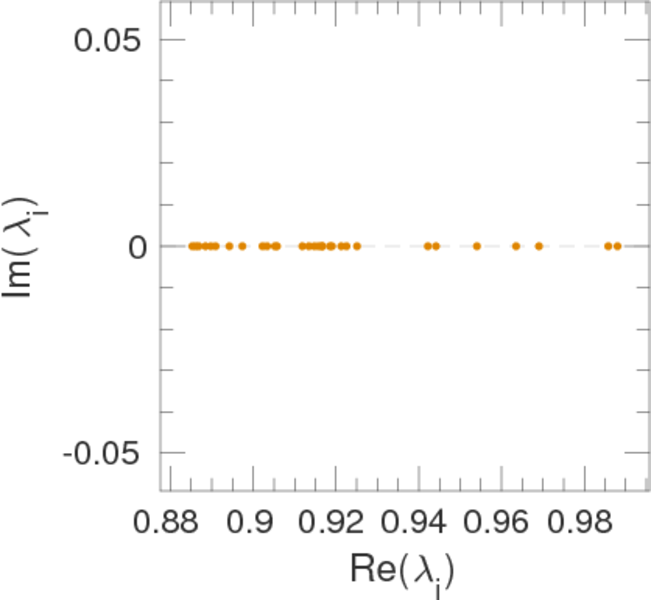
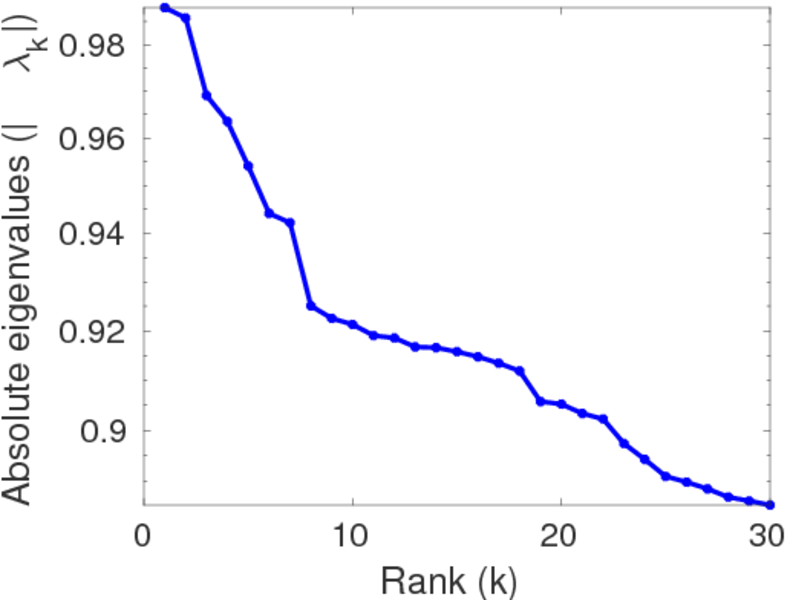
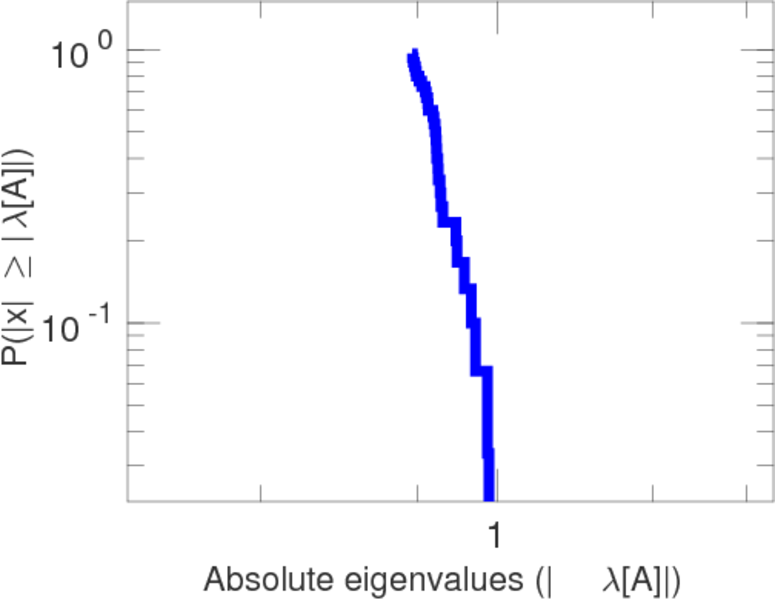
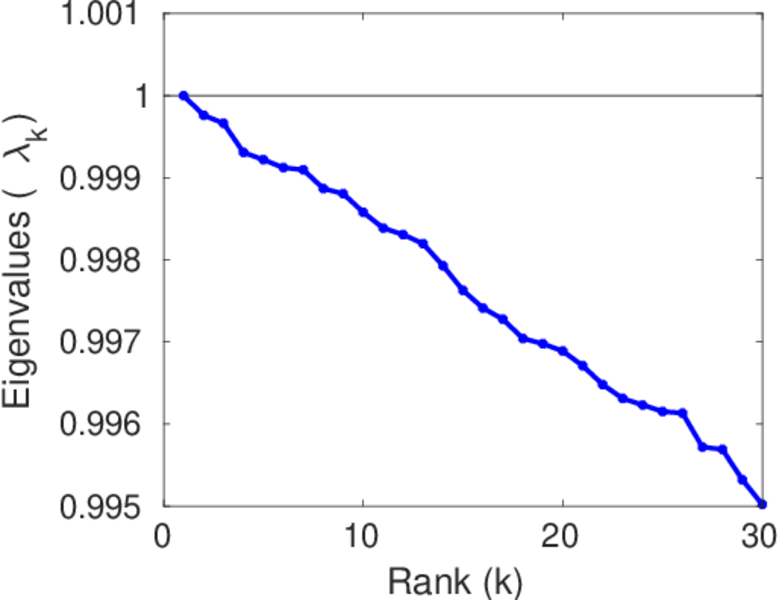
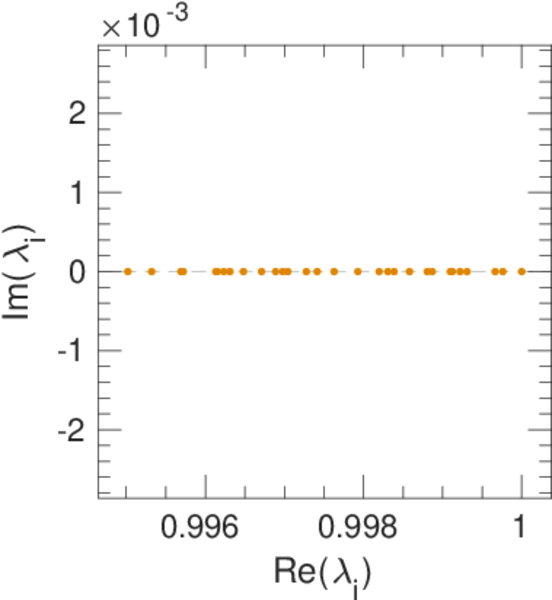
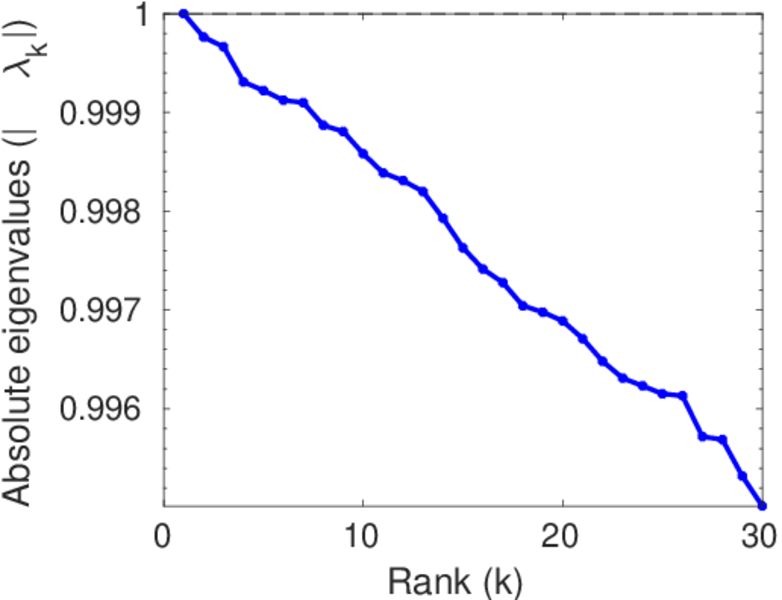
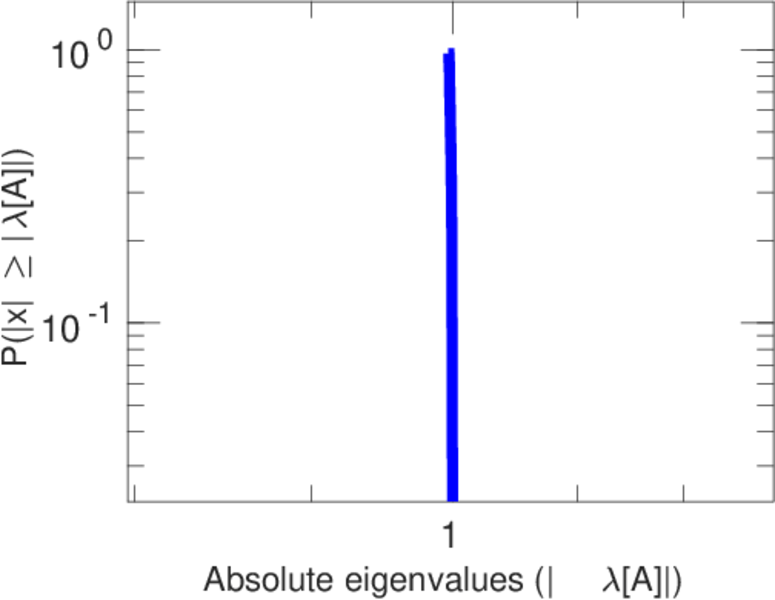
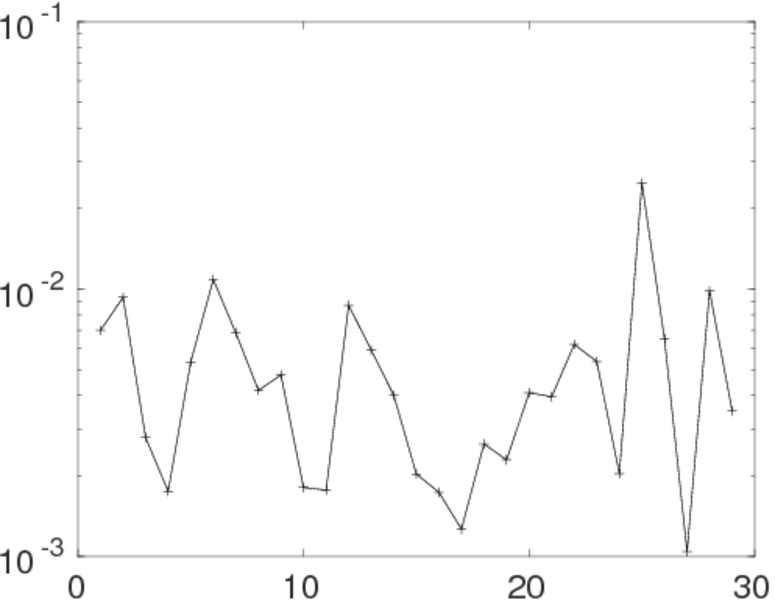
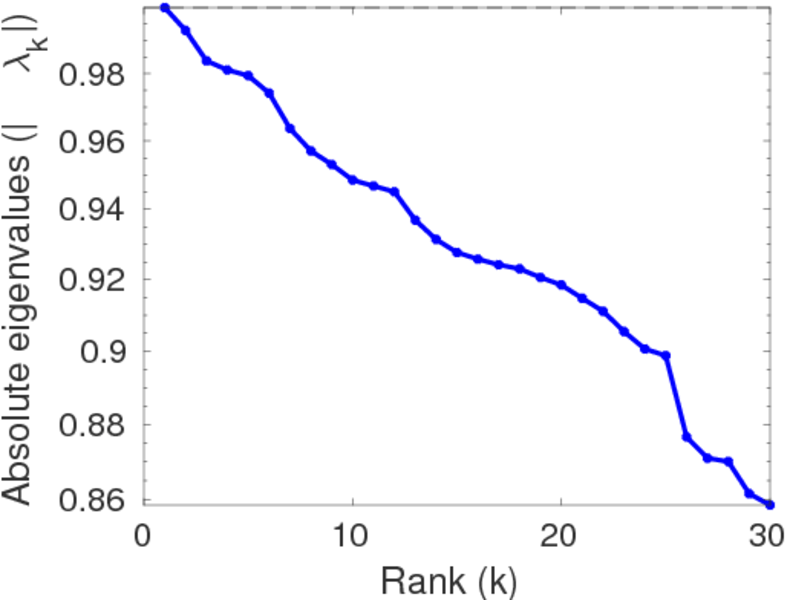
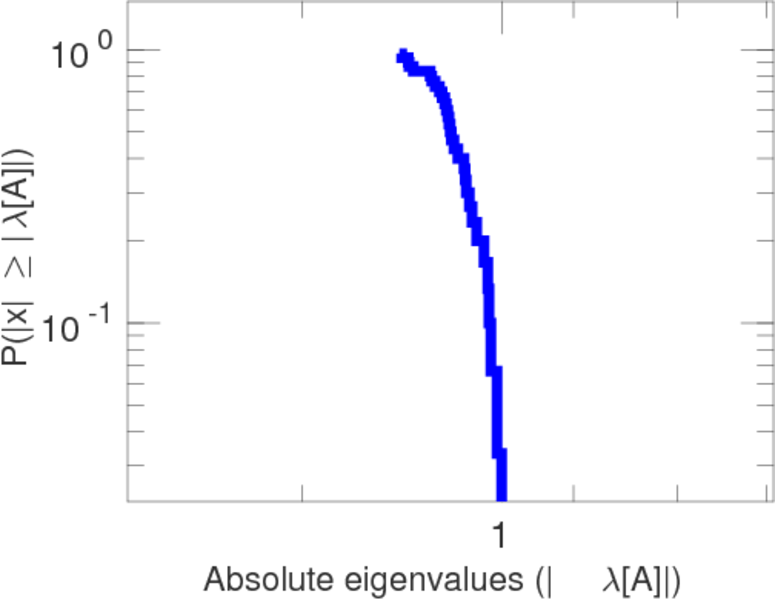
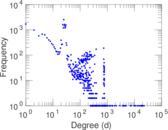
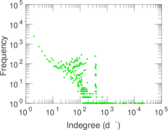
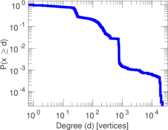
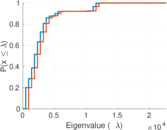
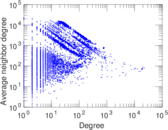
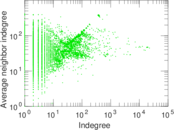
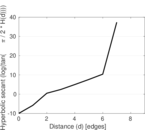
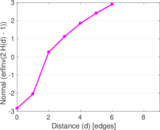
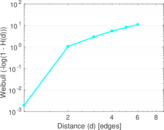
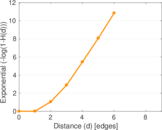
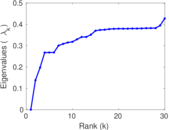
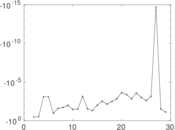
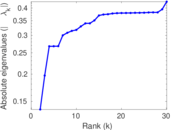
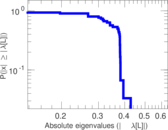
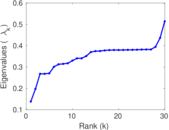
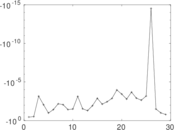
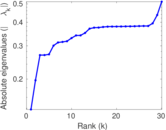
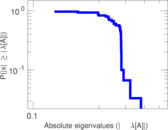
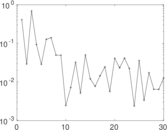
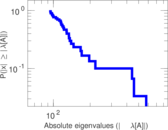
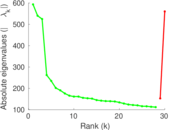
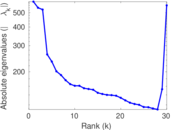
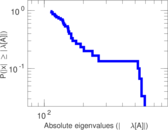
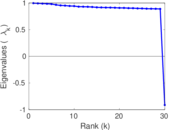
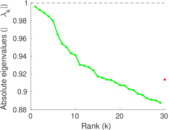
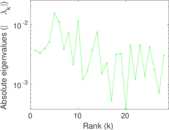
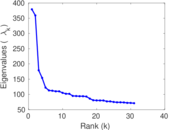
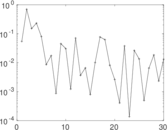
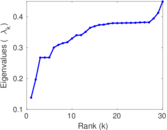
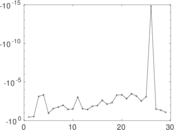
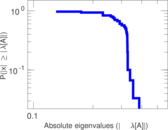
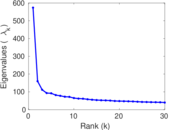
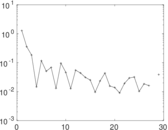
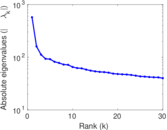
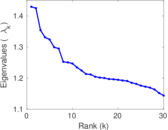
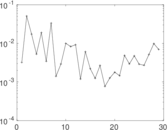
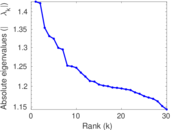
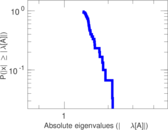
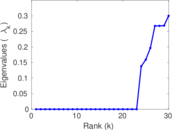
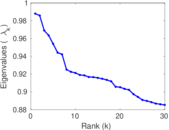
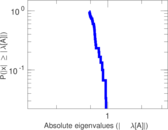
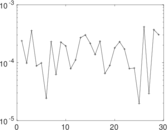
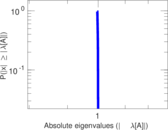
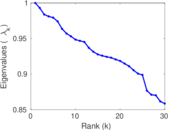
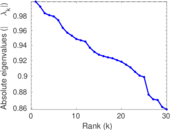
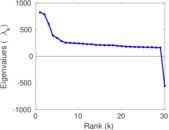
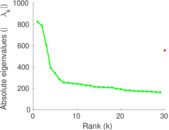
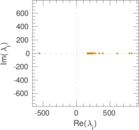
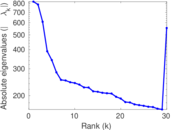
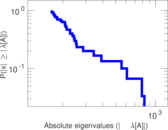
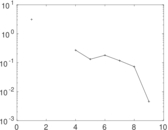
Plots


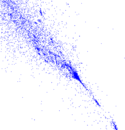


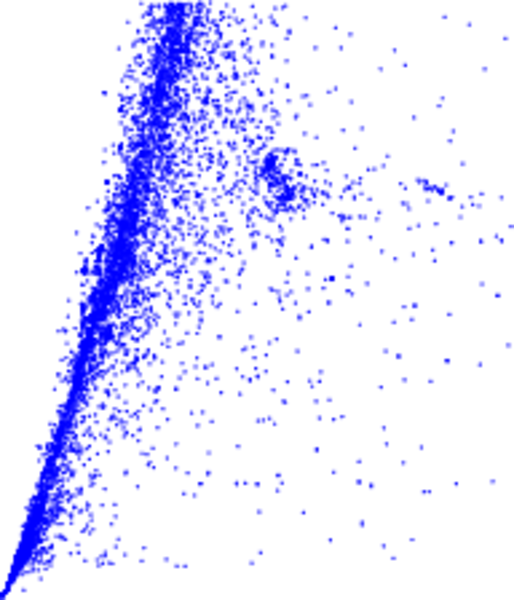
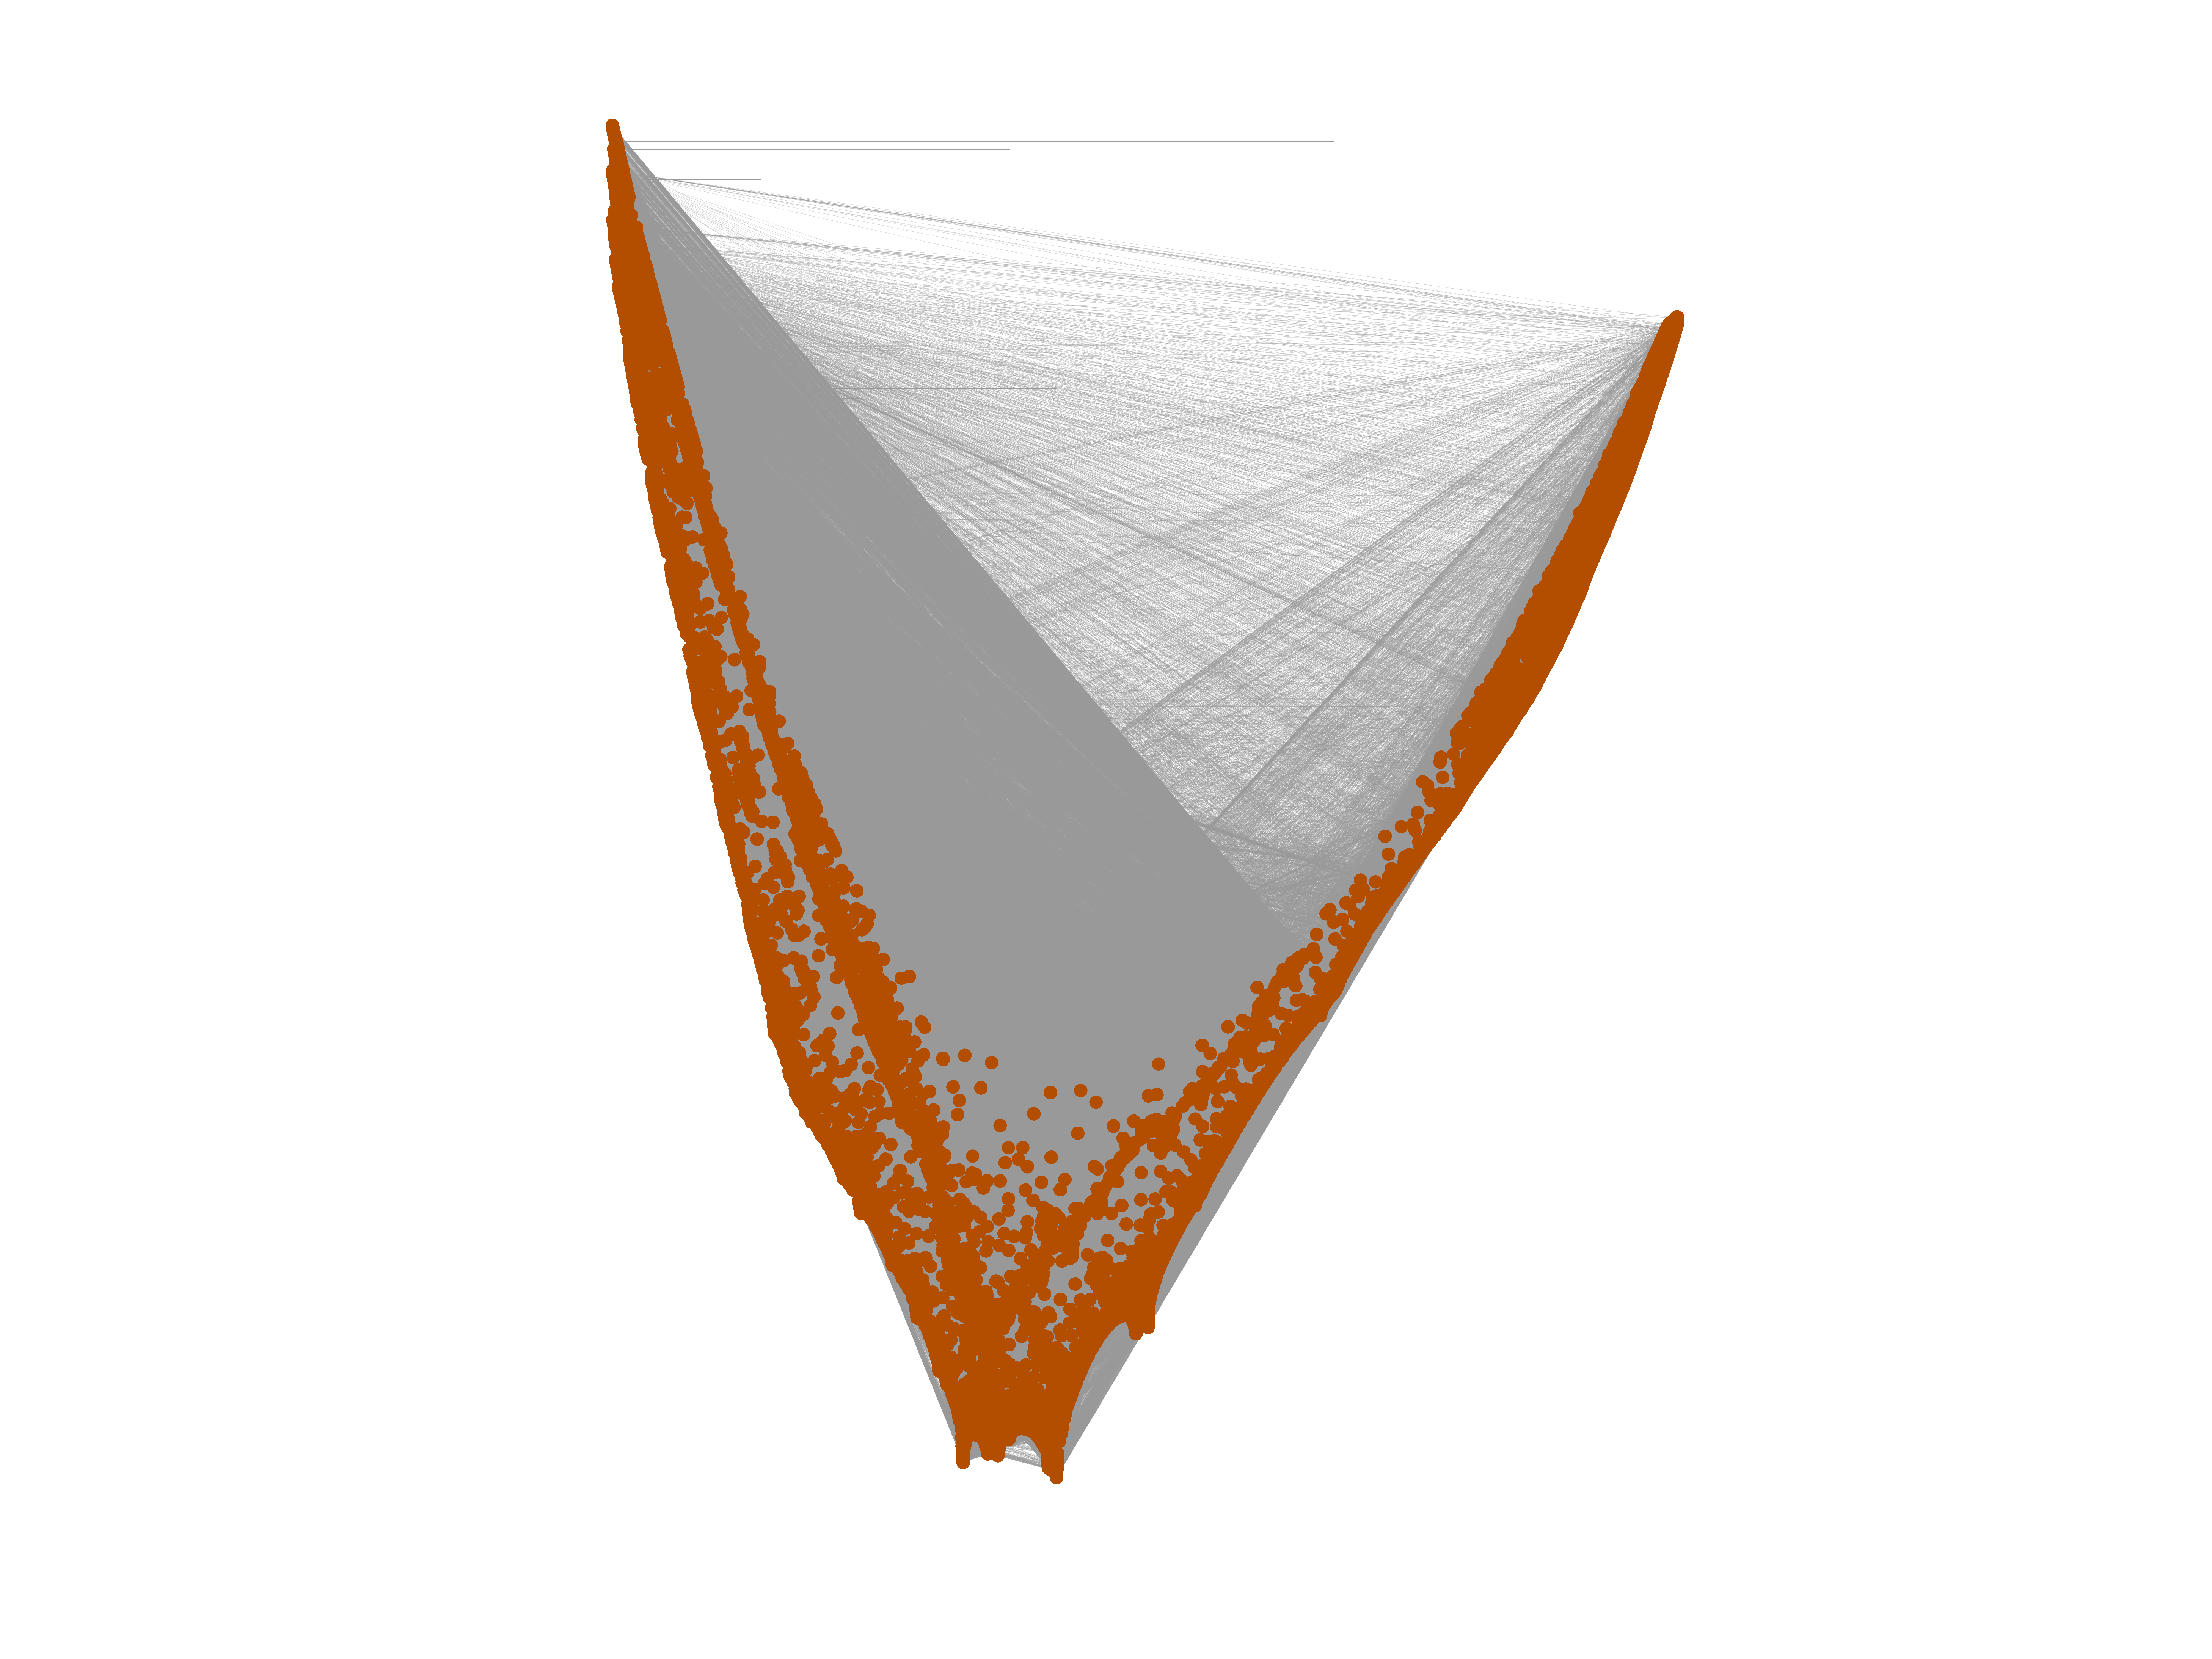
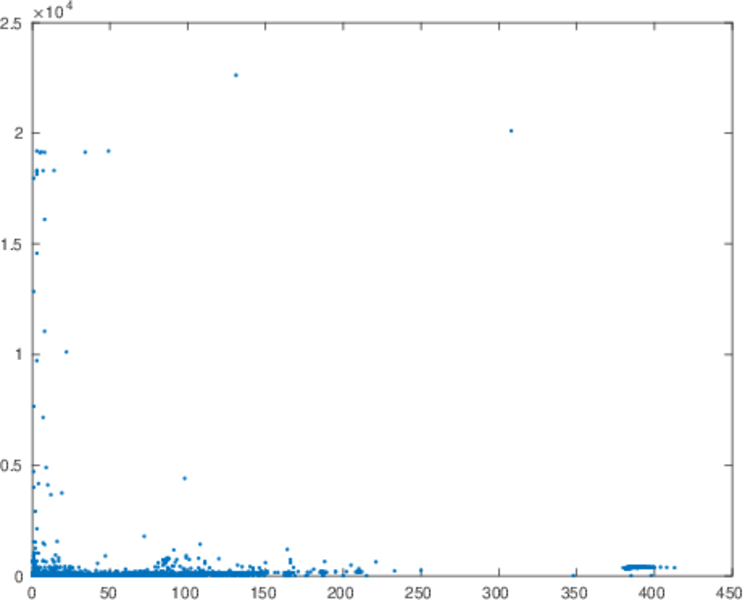
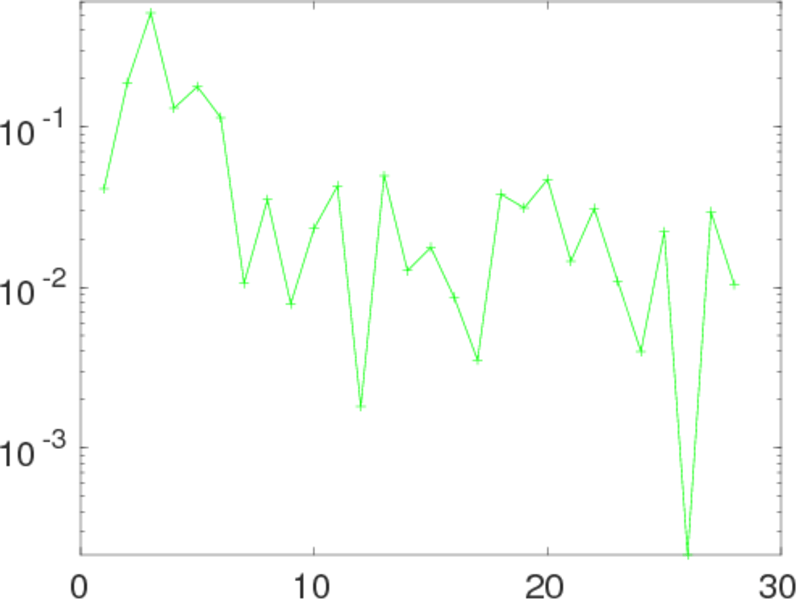
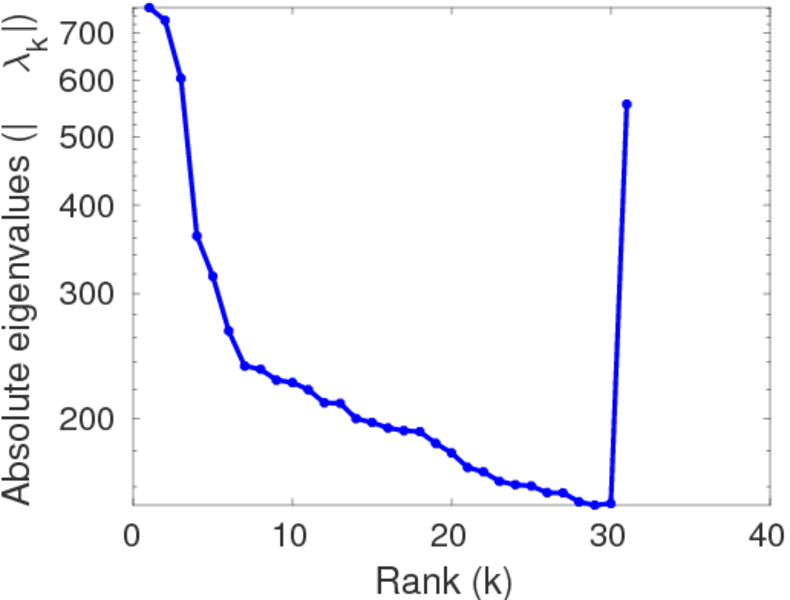
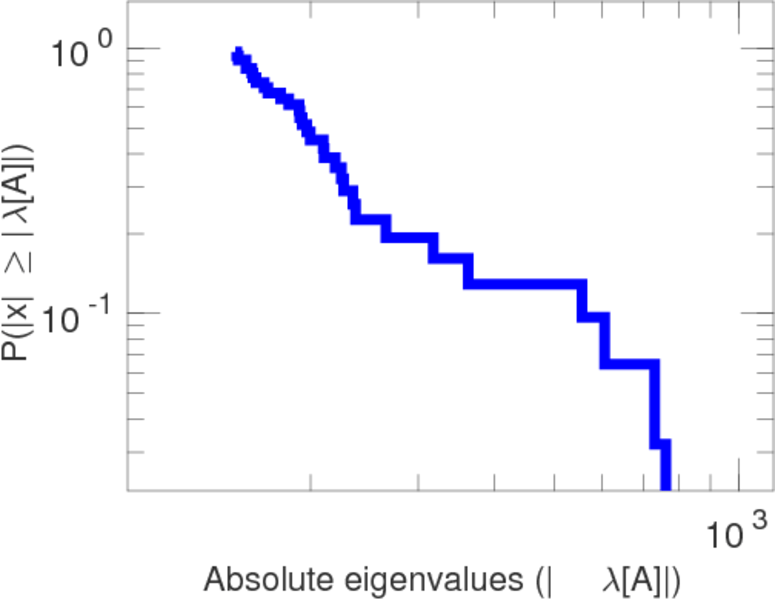
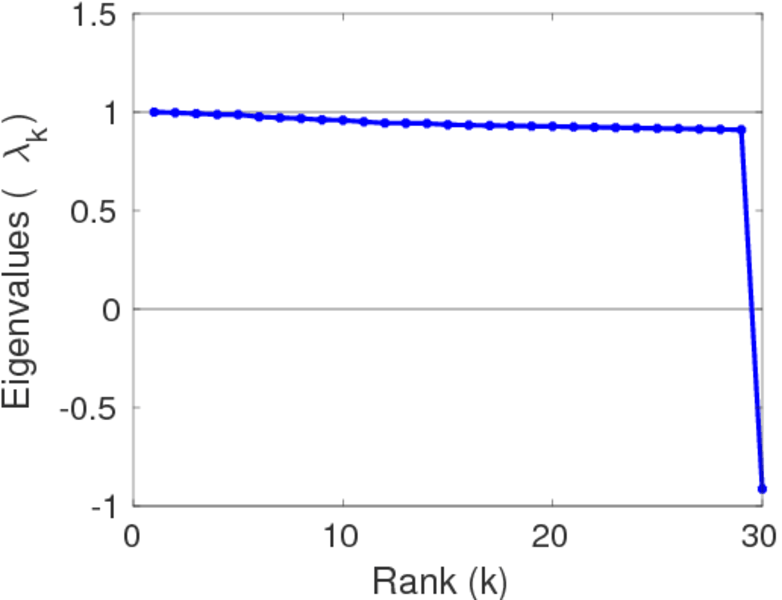
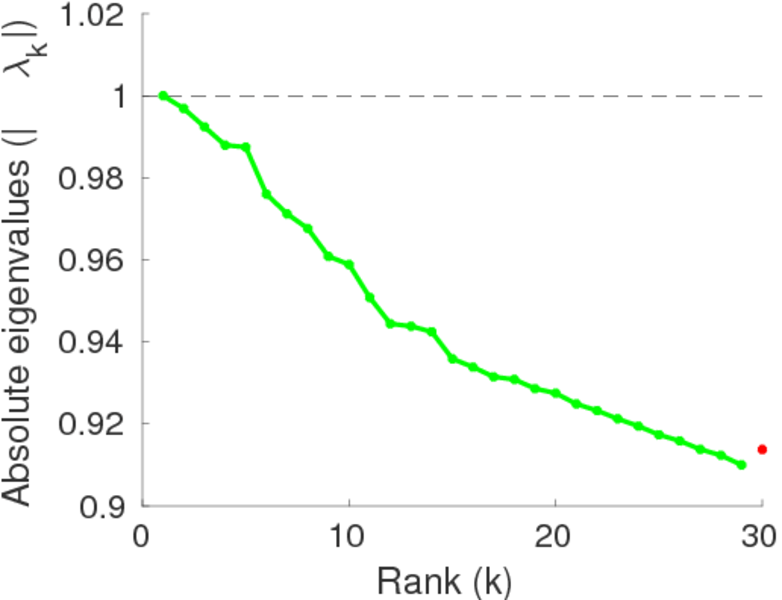
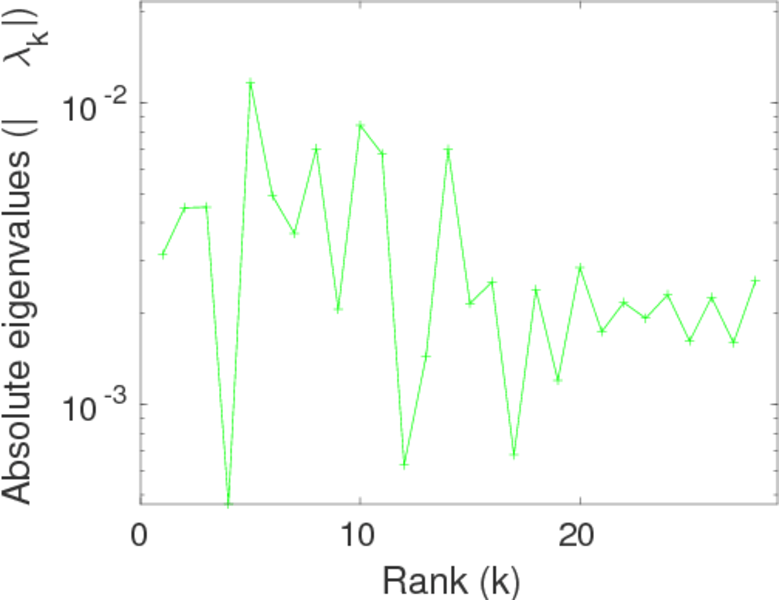
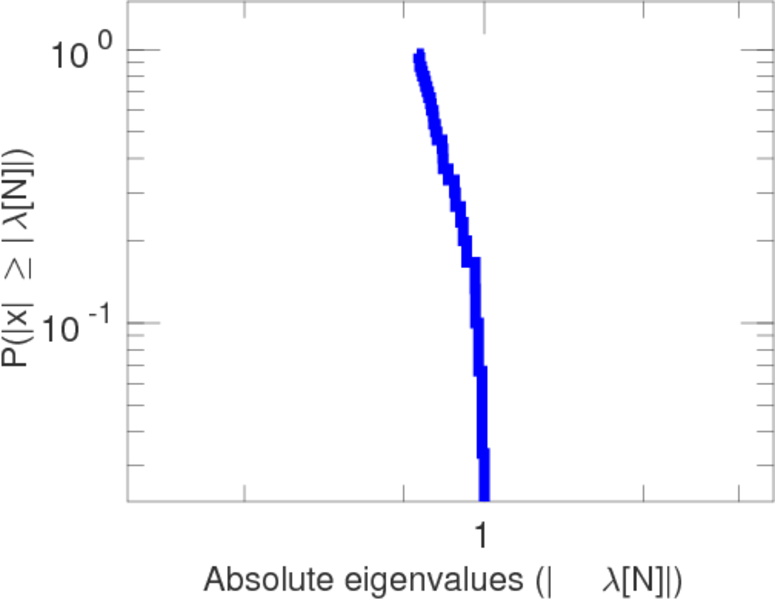
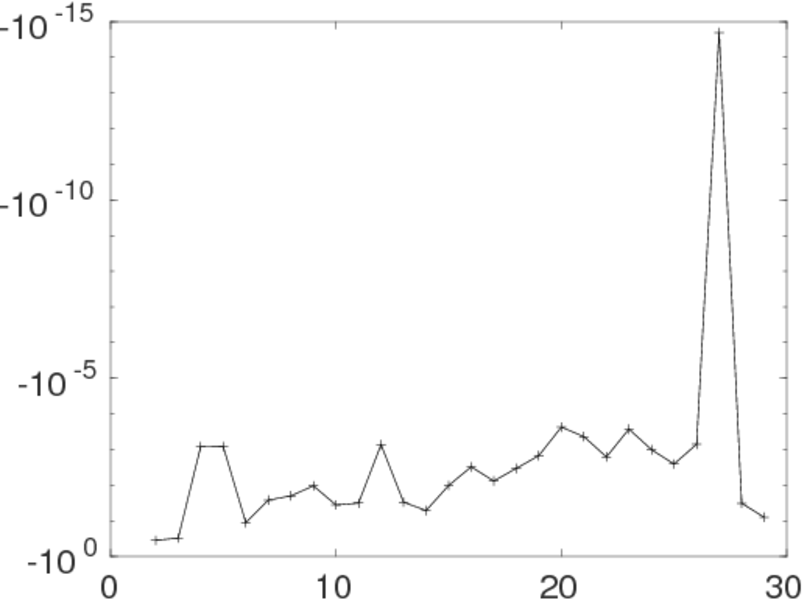
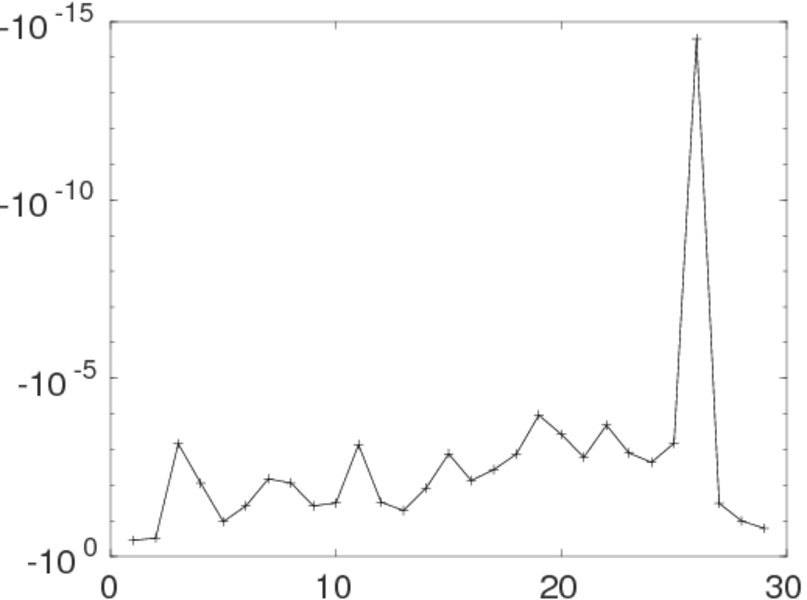
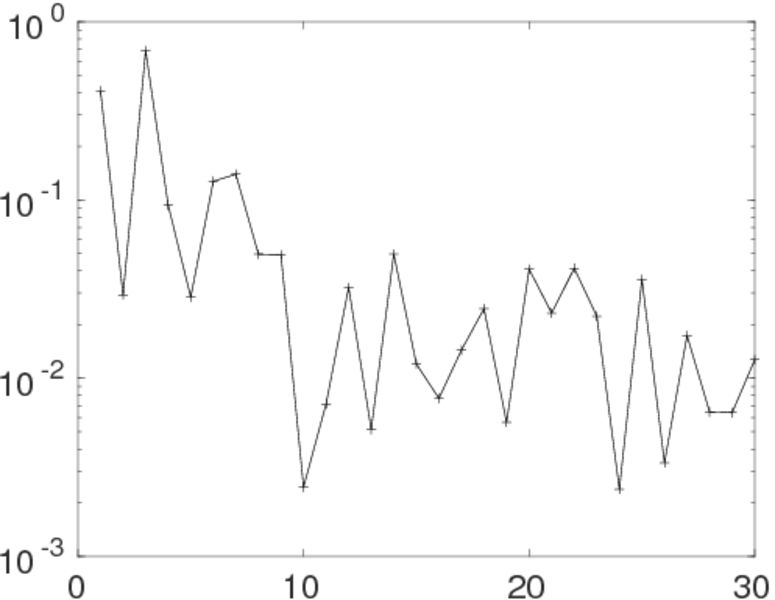
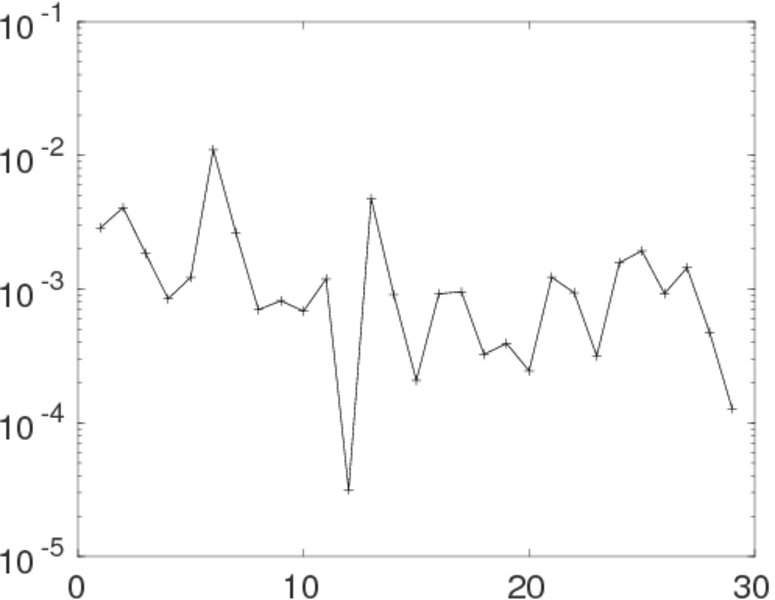
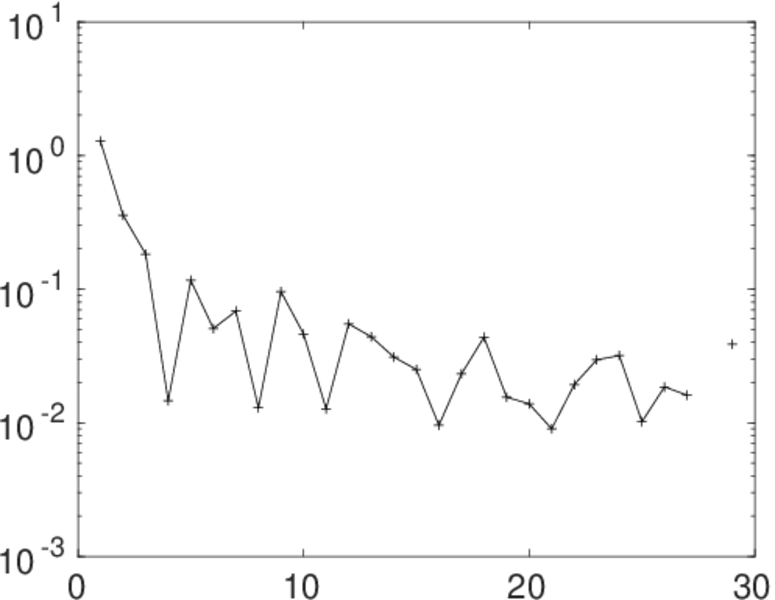
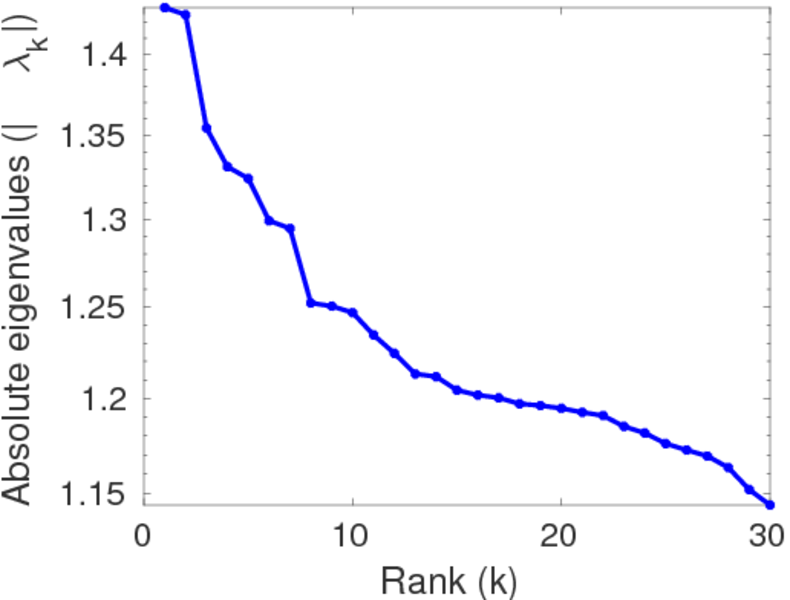
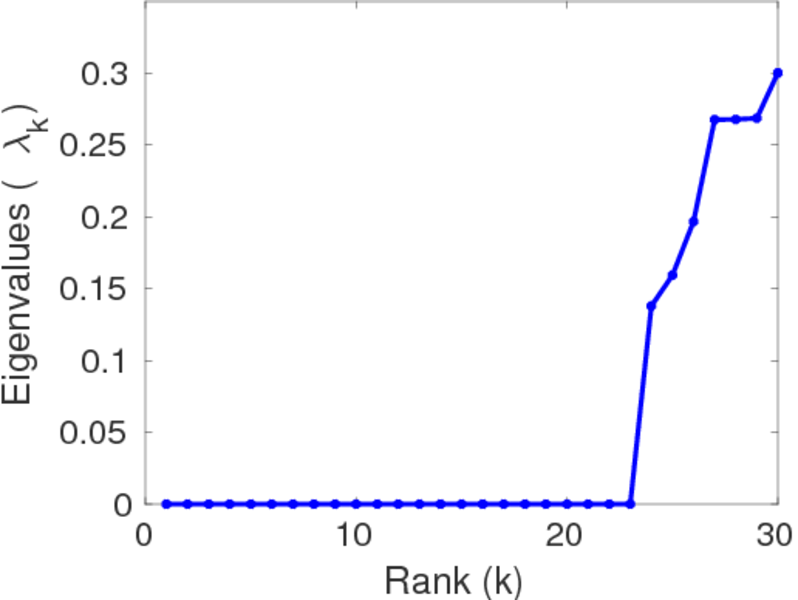
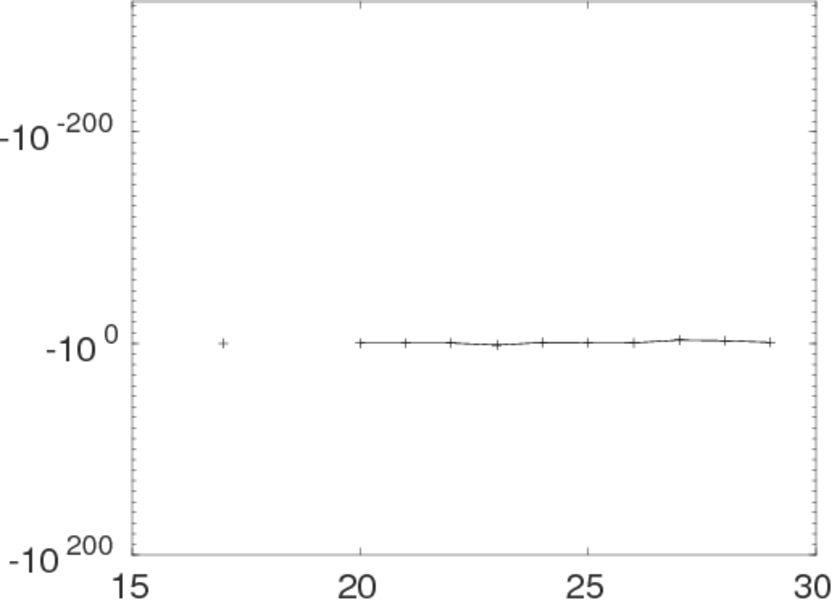
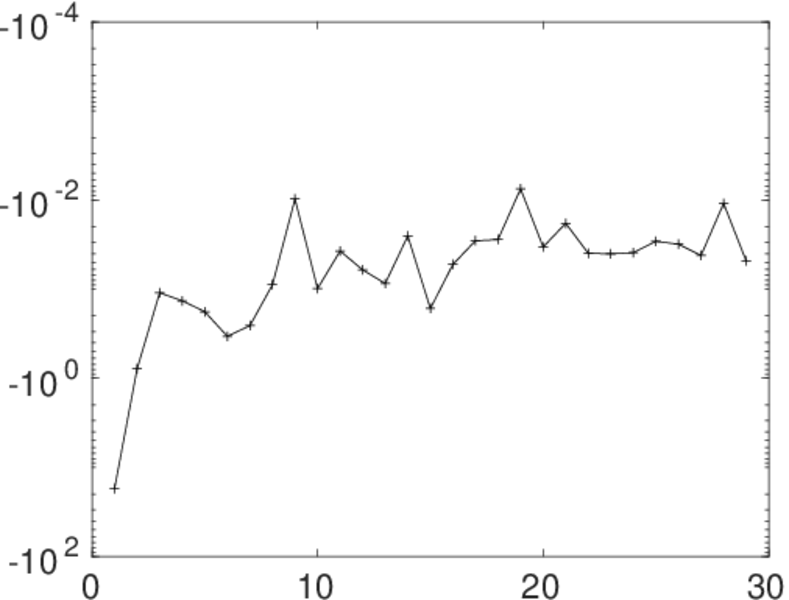
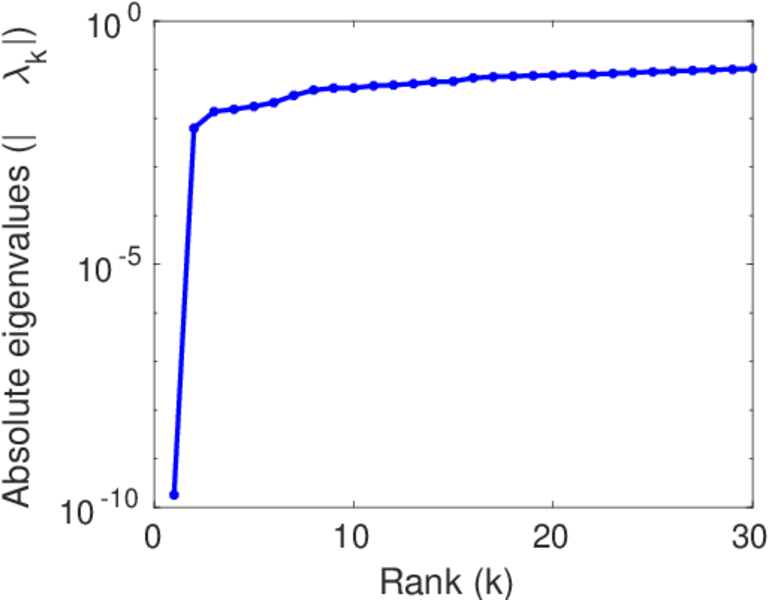
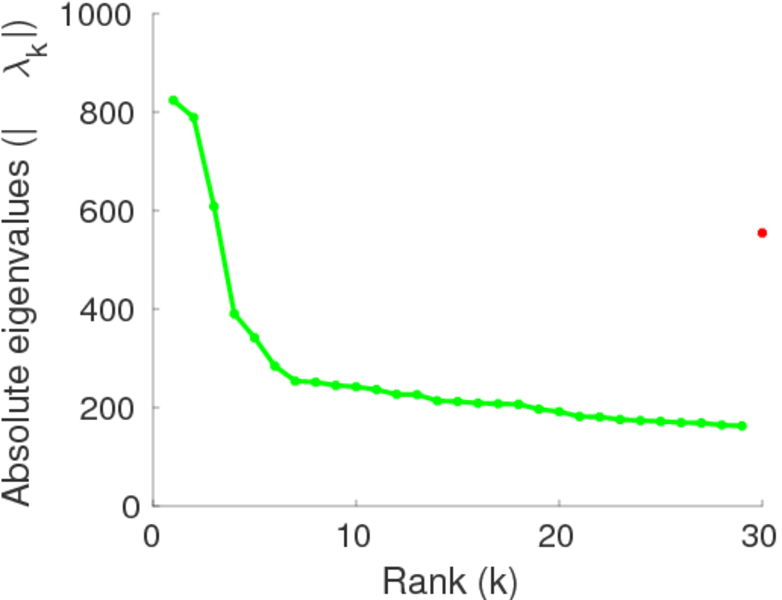
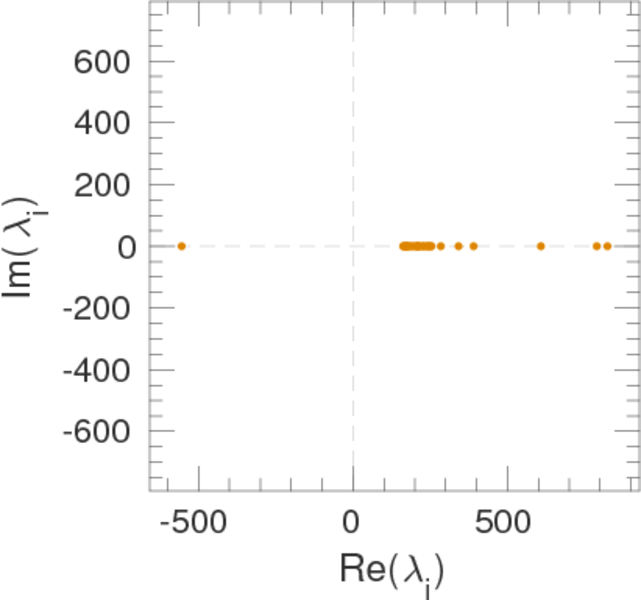
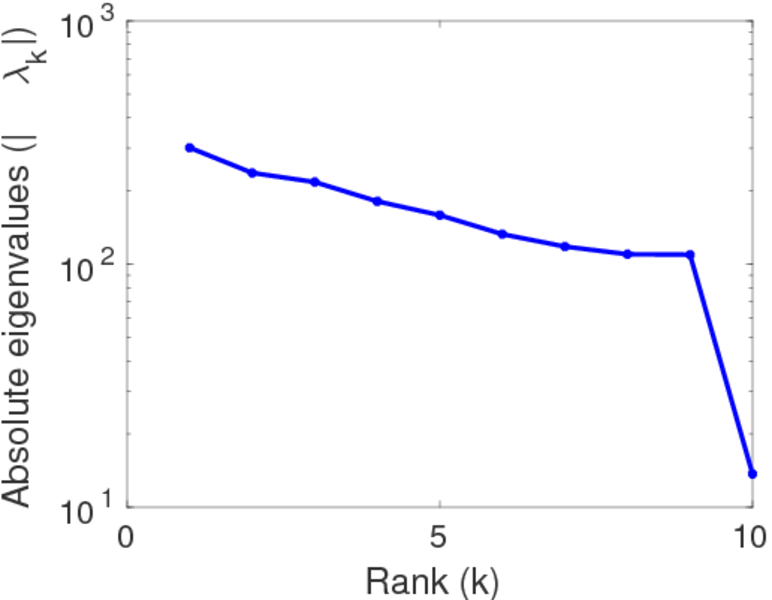
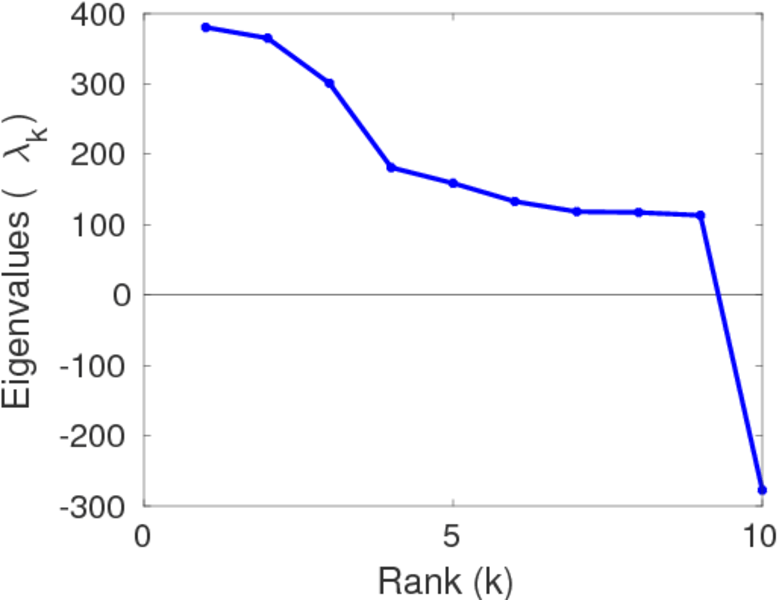
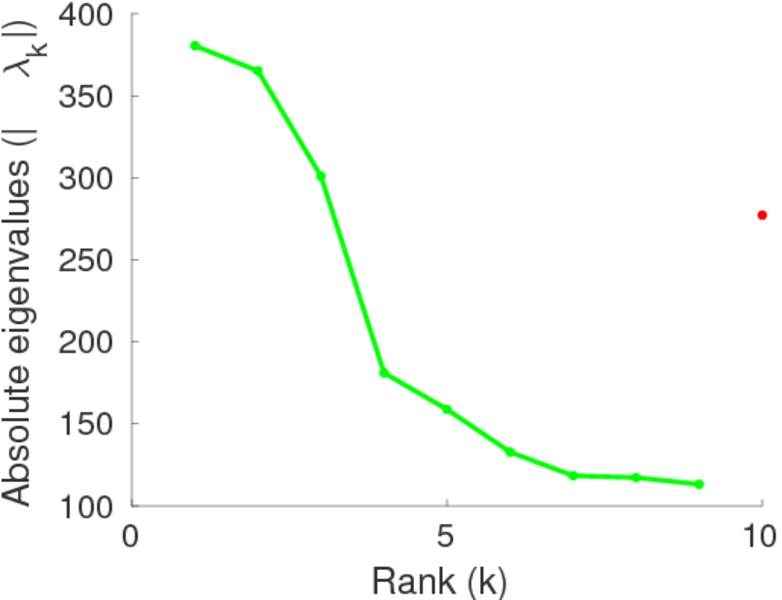
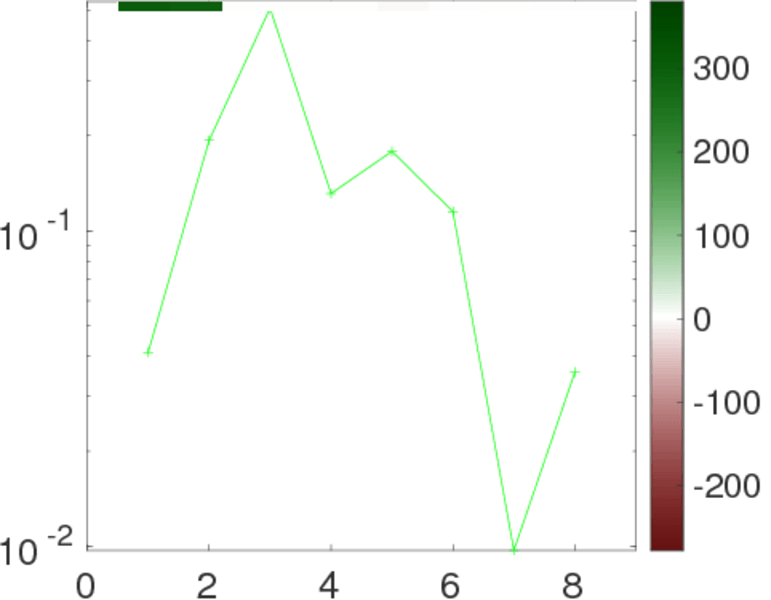
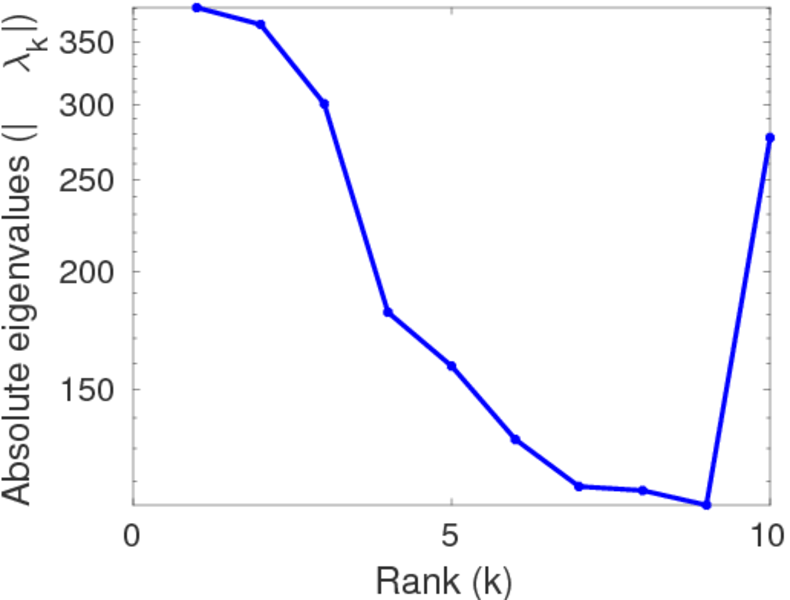
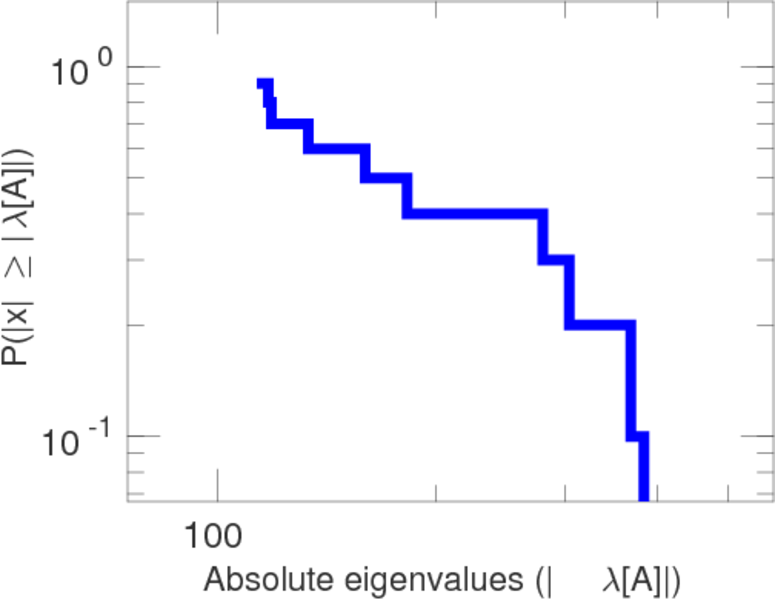
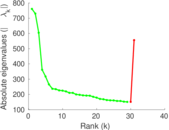
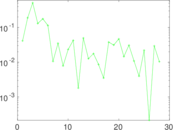
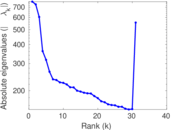
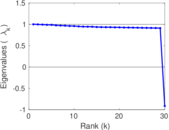
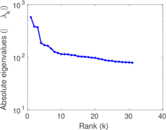
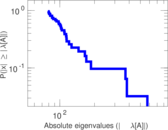
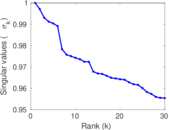
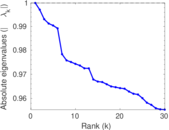
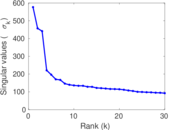
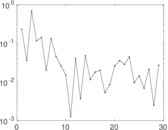
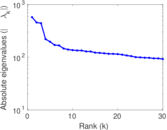
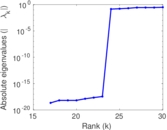
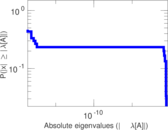
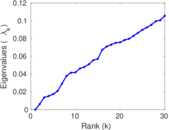
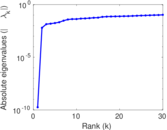
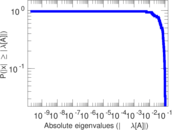
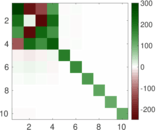
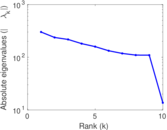
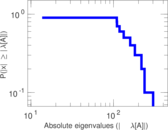
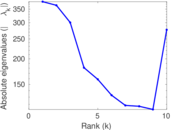
Matrix decompositions plots


Downloads
References
|
[1]
|
Jérôme Kunegis.
KONECT – The Koblenz Network Collection.
In Proc. Int. Conf. on World Wide Web Companion, pages
1343–1350, 2013.
[ http ]
|
 KONECT ‣ Networks ‣
Buy Me a Coffee
KONECT ‣ Networks ‣
Buy Me a Coffee