Wikipedia links (ilo)
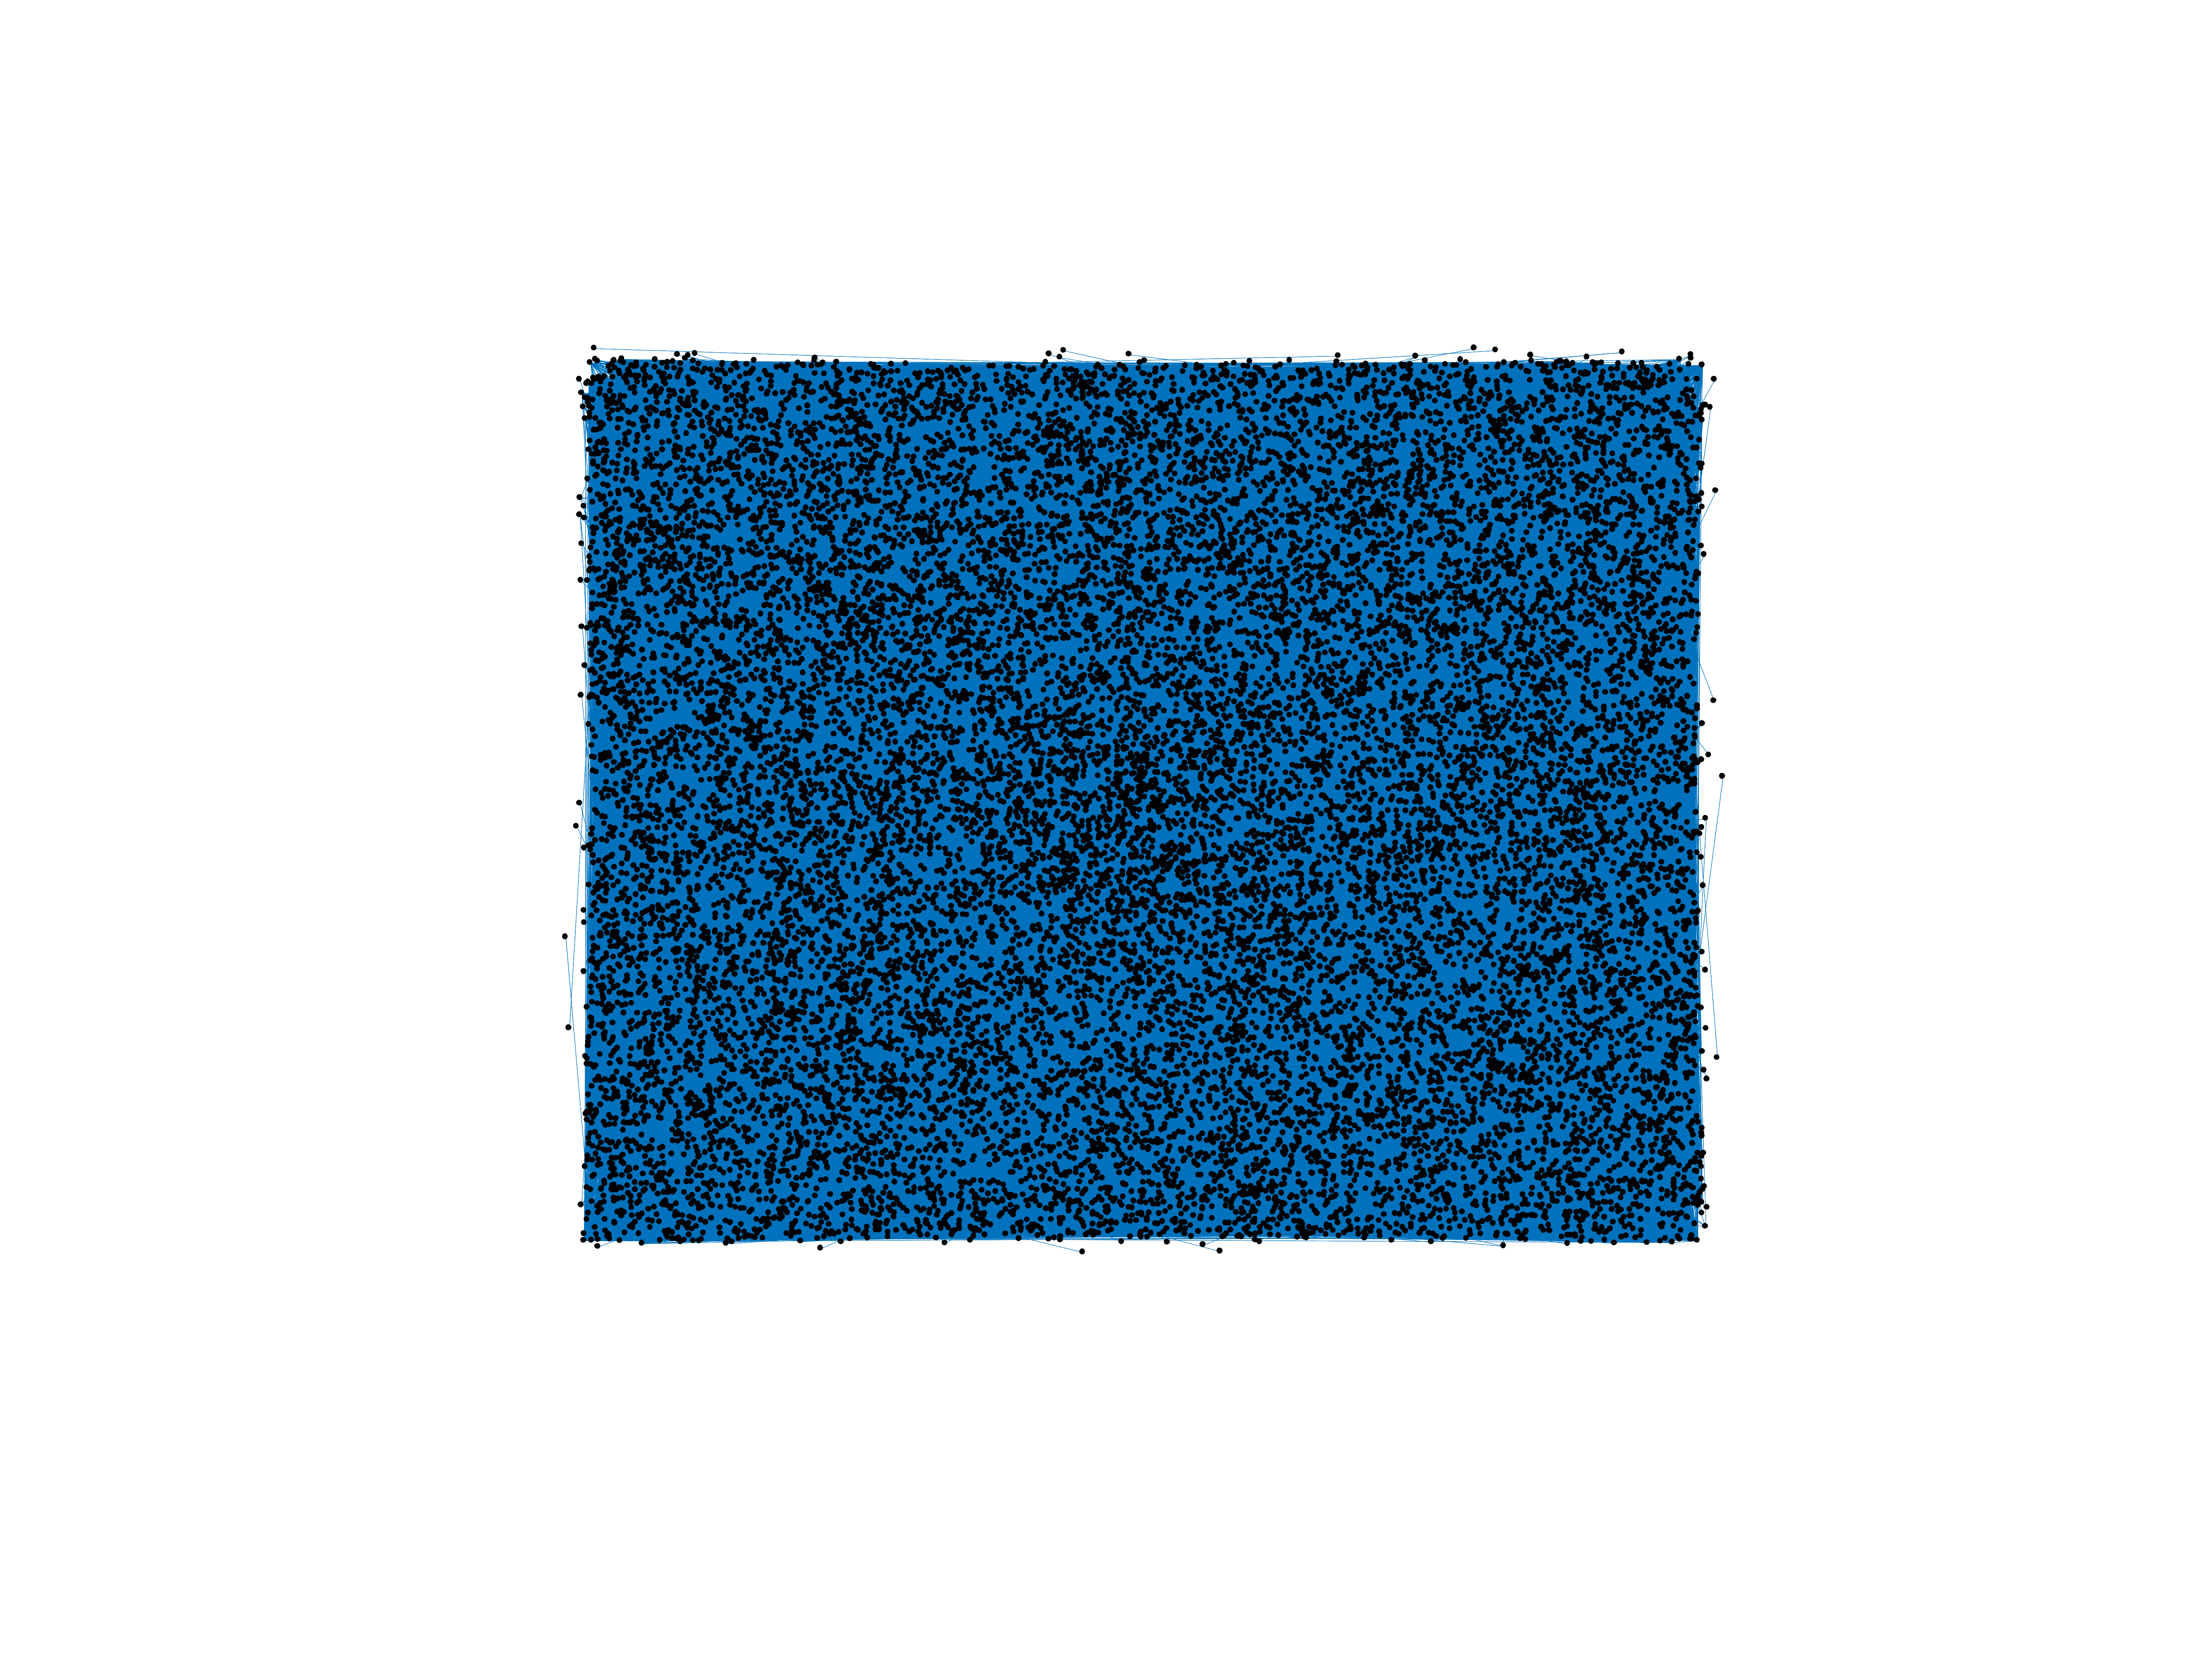
This network consists of the wikilinks of the Wikipedia in the Iloko language
(ilo). Nodes are Wikipedia articles, and directed edges are wikilinks, i.e.,
hyperlinks within one wiki. In the wiki source, these are indicated with
[[double brackets]]. Only pages in the article namespace are included.
Metadata
Statistics
| Size | n = | 20,485
|
| Volume | m = | 1,244,270
|
| Loop count | l = | 67
|
| Wedge count | s = | 378,657,426
|
| Cross count | x = | 95,690,149,889,447
|
| Triangle count | t = | 79,548,474
|
| Square count | q = | 30,647,846,164
|
| 4-Tour count | T4 = | 245,736,571,578
|
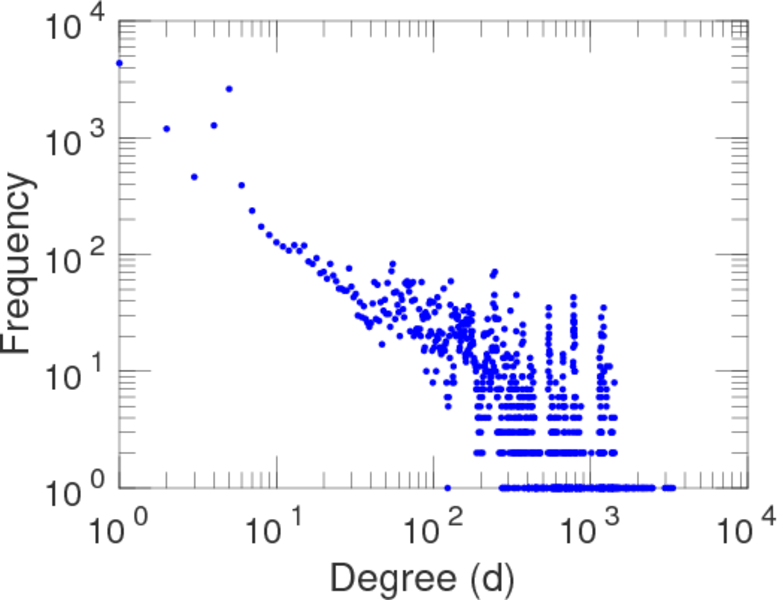
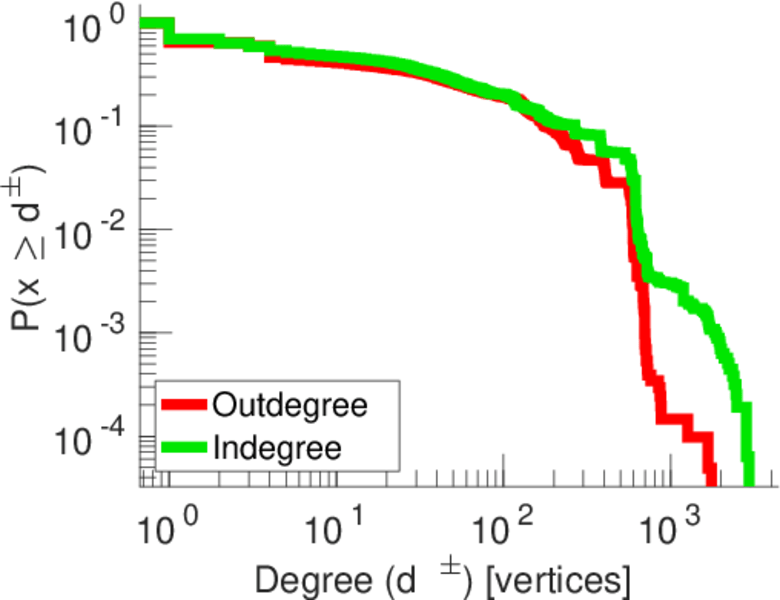
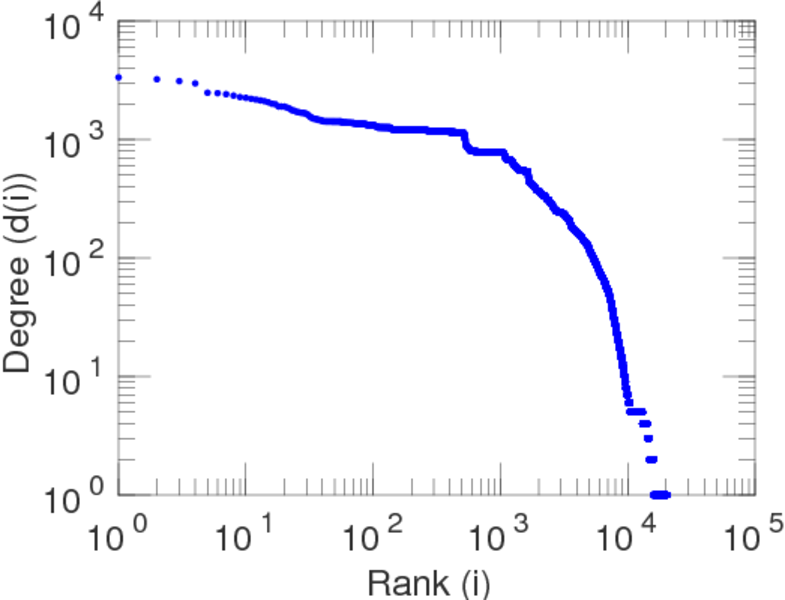
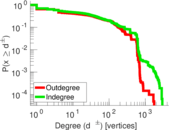
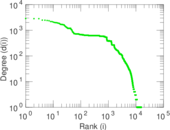
| Maximum degree | dmax = | 3,345
|
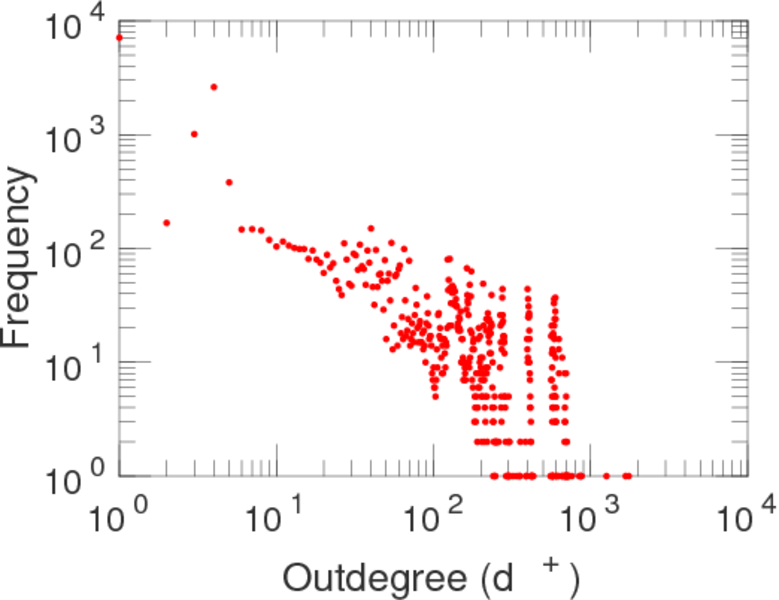
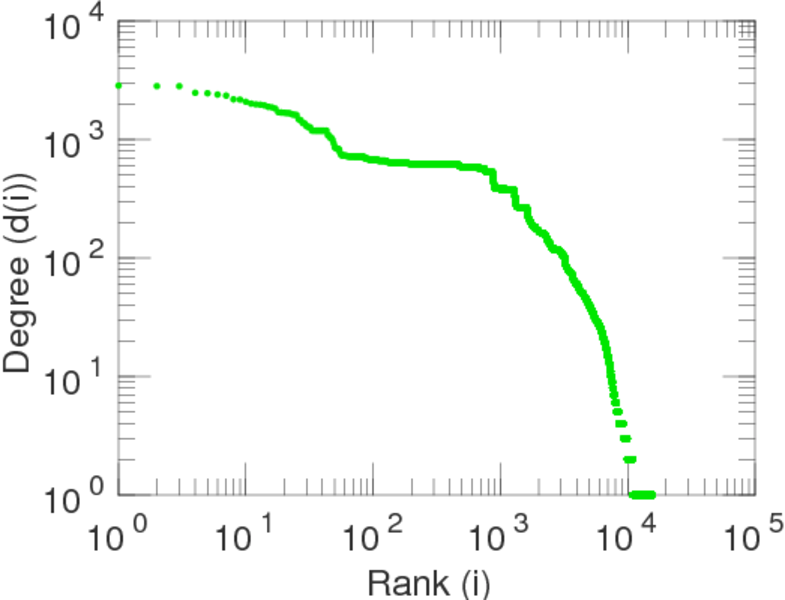
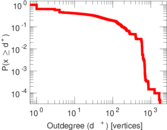
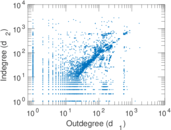
| Maximum outdegree | d+max = | 1,751
|
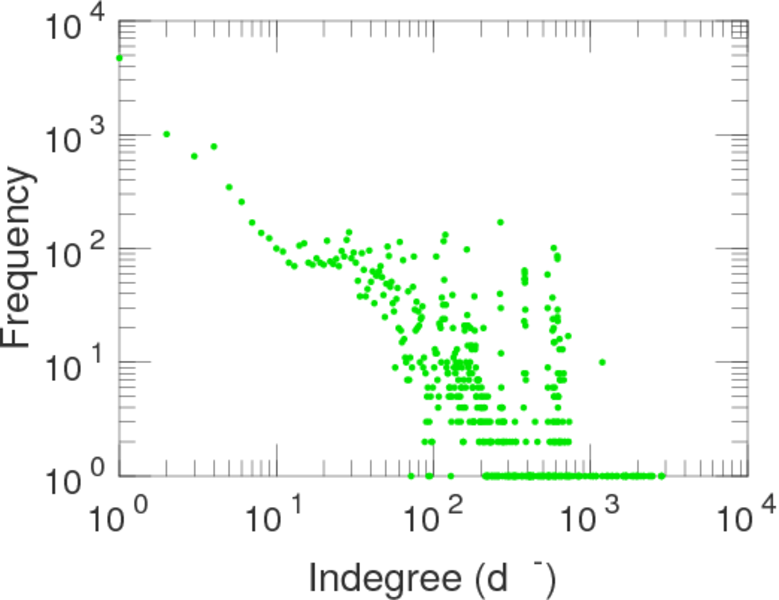
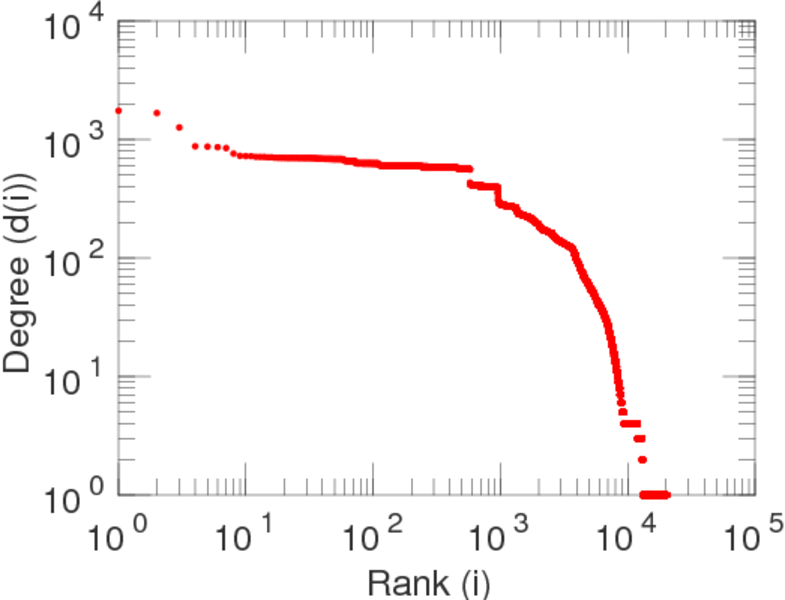
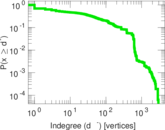
| Maximum indegree | d−max = | 2,936
|
| Average degree | d = | 121.481
|
| Fill | p = | 0.002 965 12
|
| Size of LCC | N = | 20,458
|
| Size of LSCC | Ns = | 14,529
|
| Relative size of LSCC | Nrs = | 0.709 251
|
| Diameter | δ = | 9
|
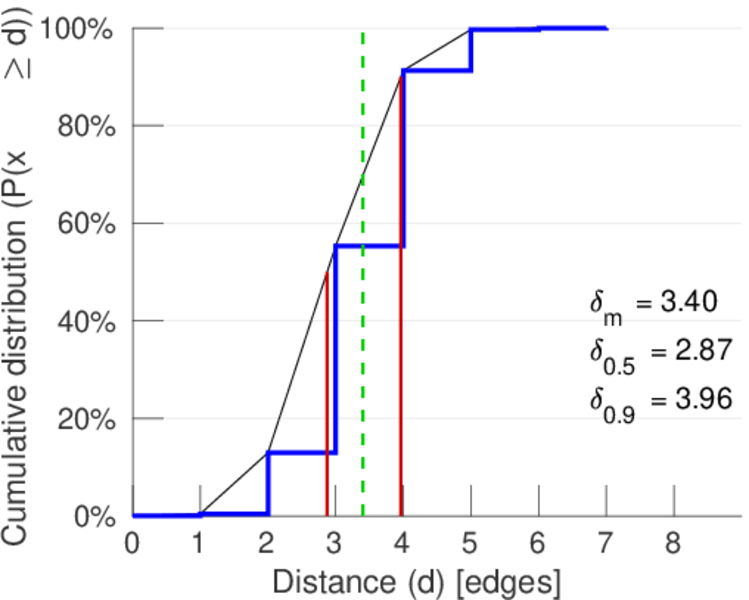
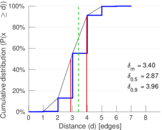
| 50-Percentile effective diameter | δ0.5 = | 2.874 36
|
| 90-Percentile effective diameter | δ0.9 = | 3.963 77
|
| Median distance | δM = | 3
|
| Mean distance | δm = | 3.403 07
|
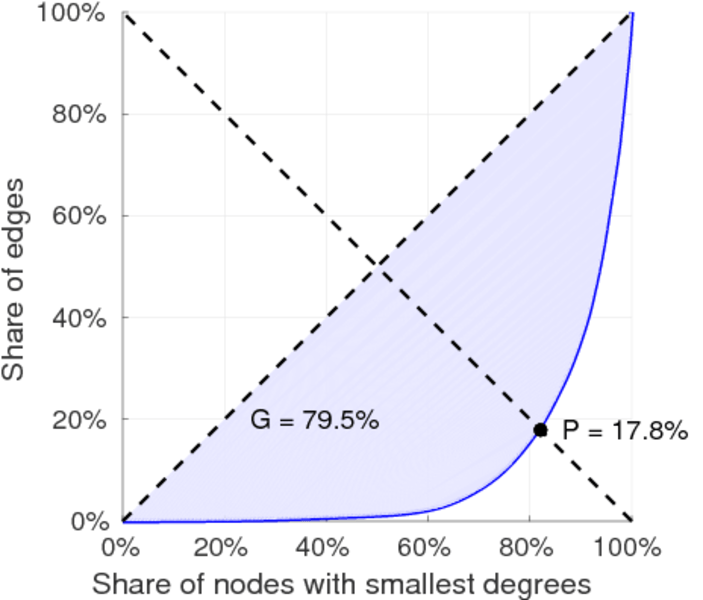
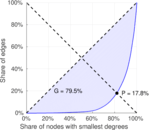
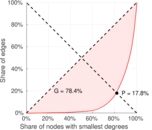
| Balanced inequality ratio | P = | 0.177 388
|
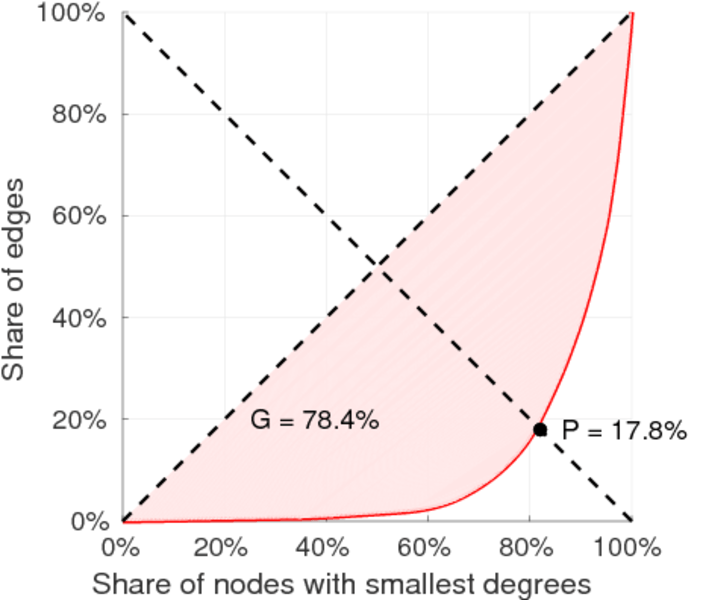
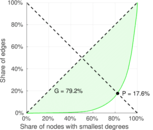
| Outdegree balanced inequality ratio | P+ = | 0.177 988
|
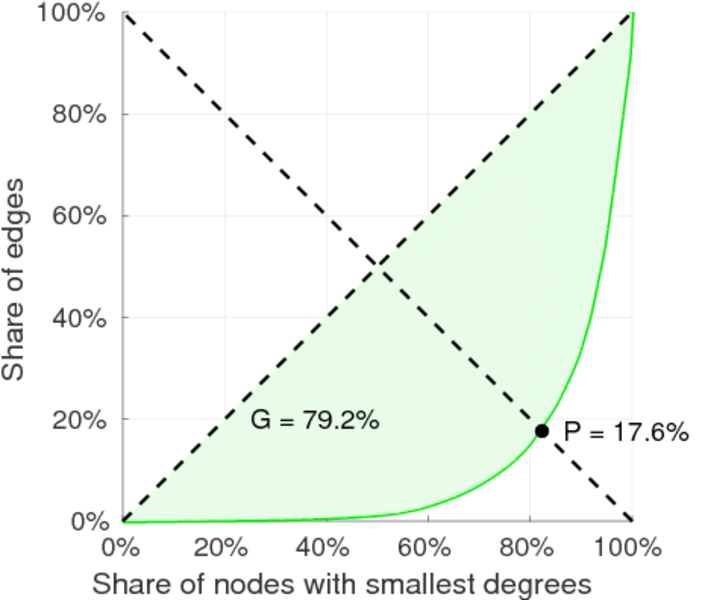
| Indegree balanced inequality ratio | P− = | 0.174 743
|
| Power law exponent | γ = | 1.394 43
|
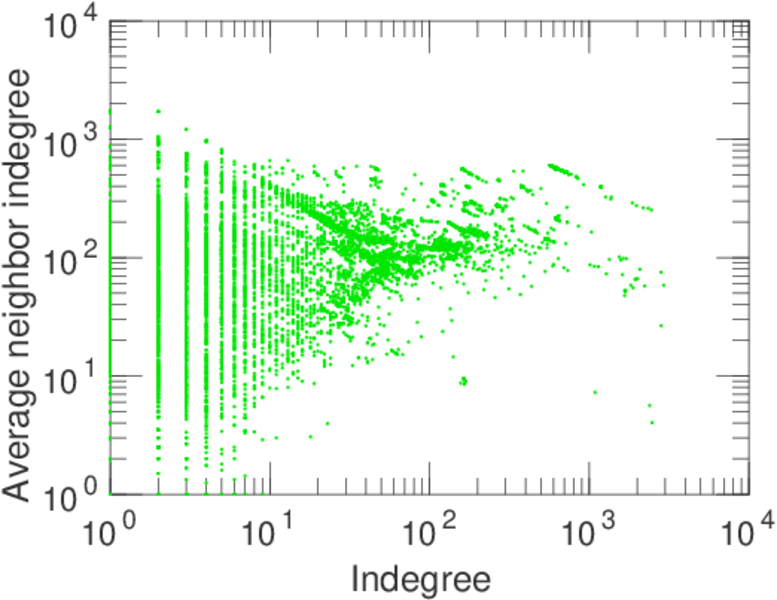
| Degree assortativity | ρ = | −0.025 089 8
|
| Degree assortativity p-value | pρ = | 1.007 21 × 10−231
|
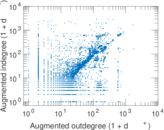
| In/outdegree correlation | ρ± = | +0.837 701
|
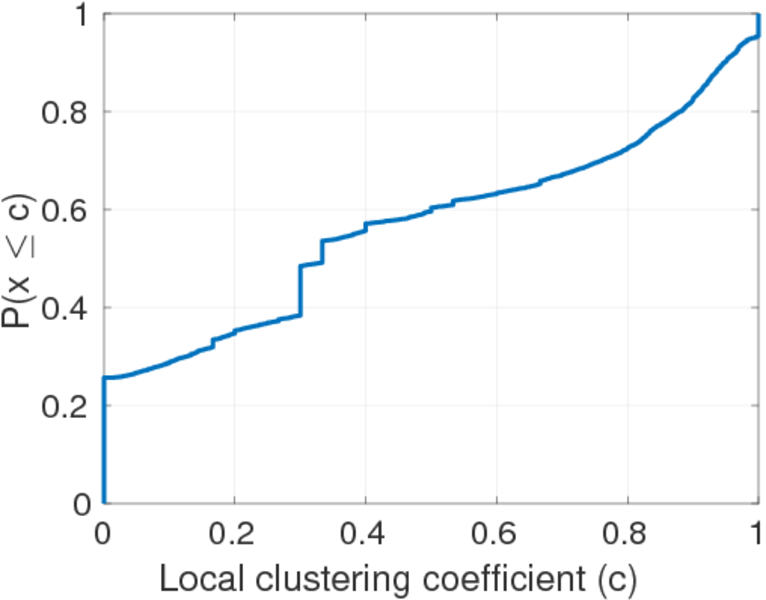
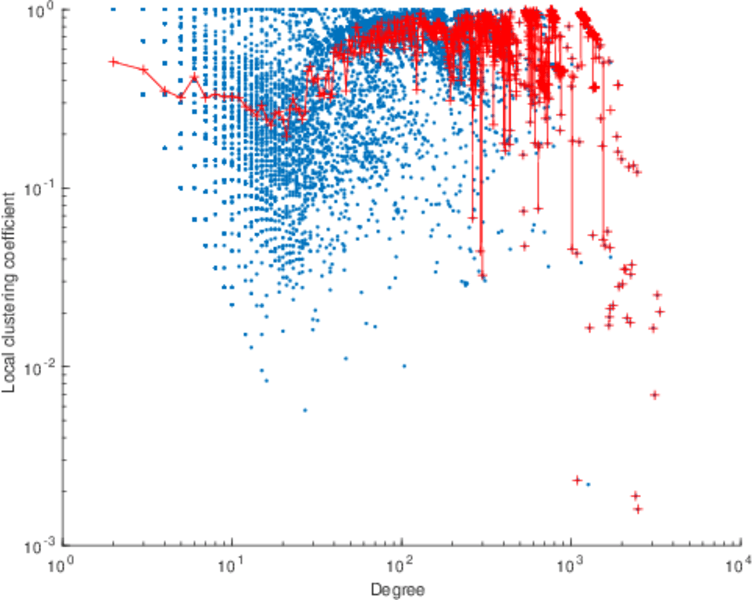
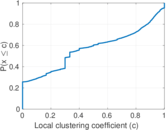
| Clustering coefficient | c = | 0.630 241
|
| Directed clustering coefficient | c± = | 0.860 762
|
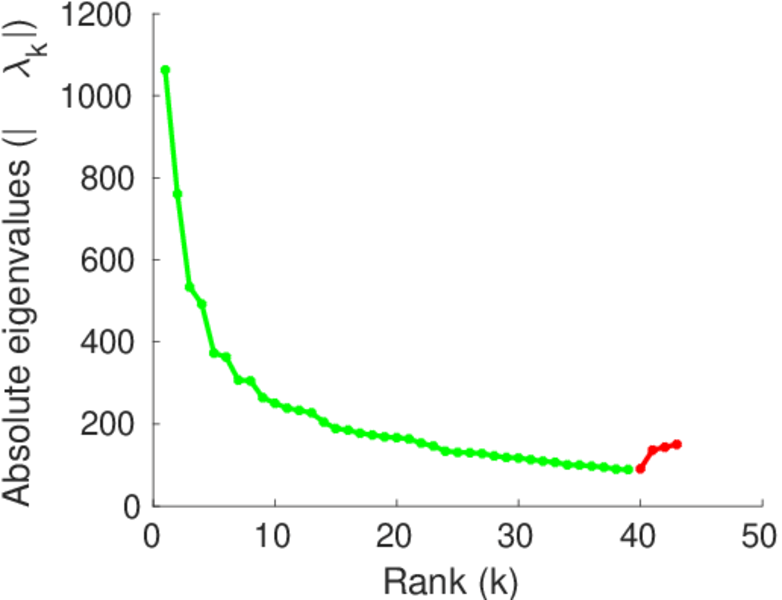
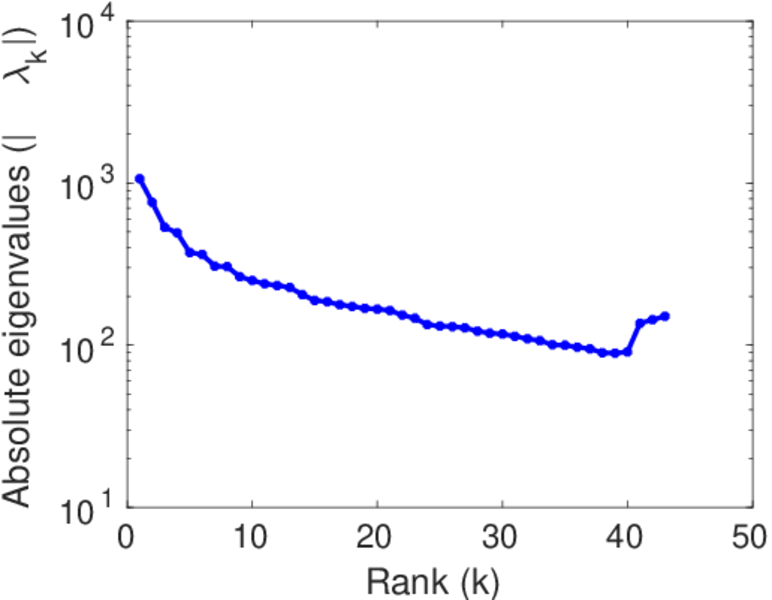
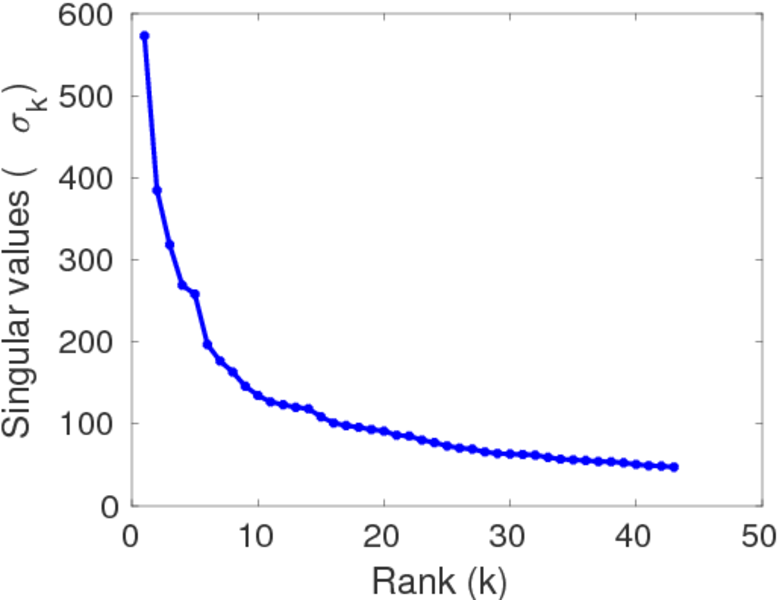
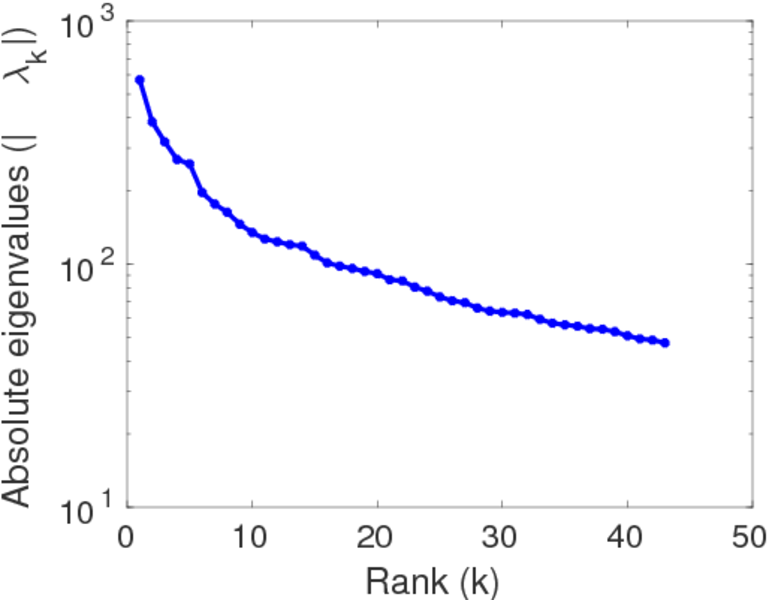
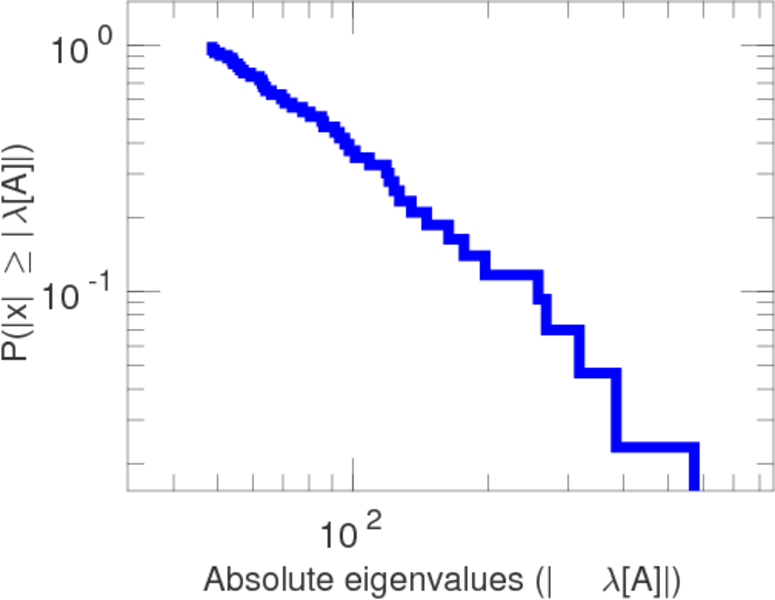
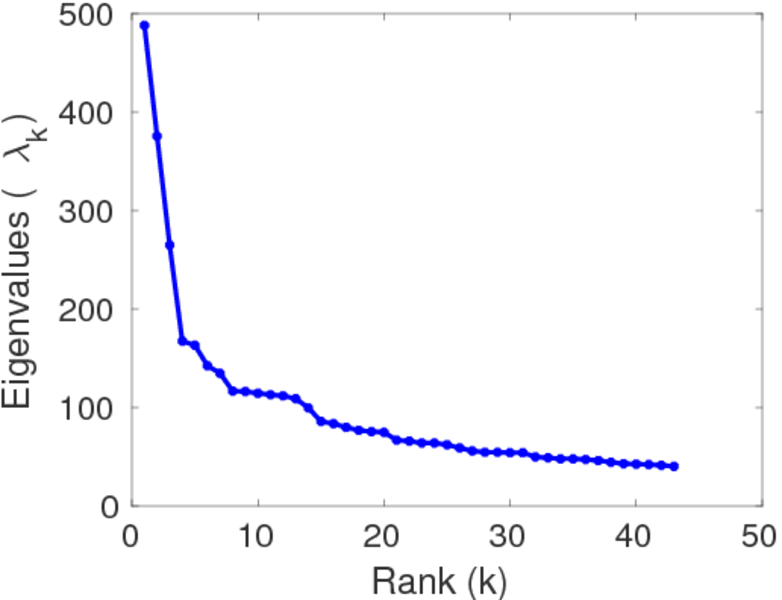
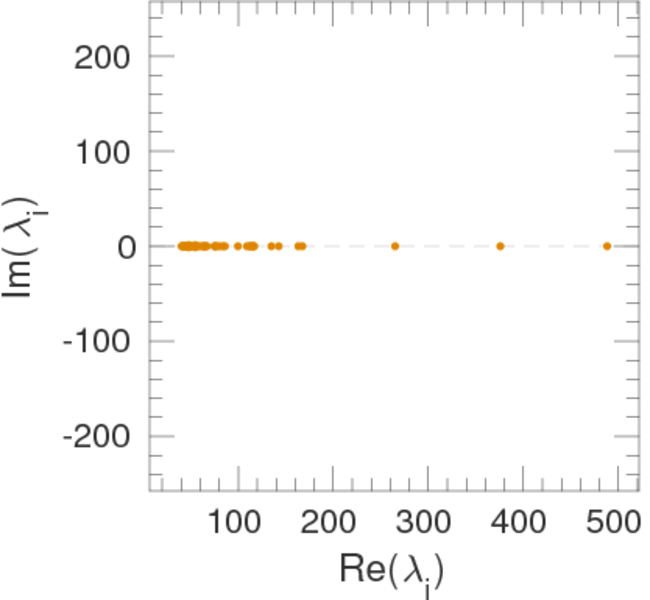
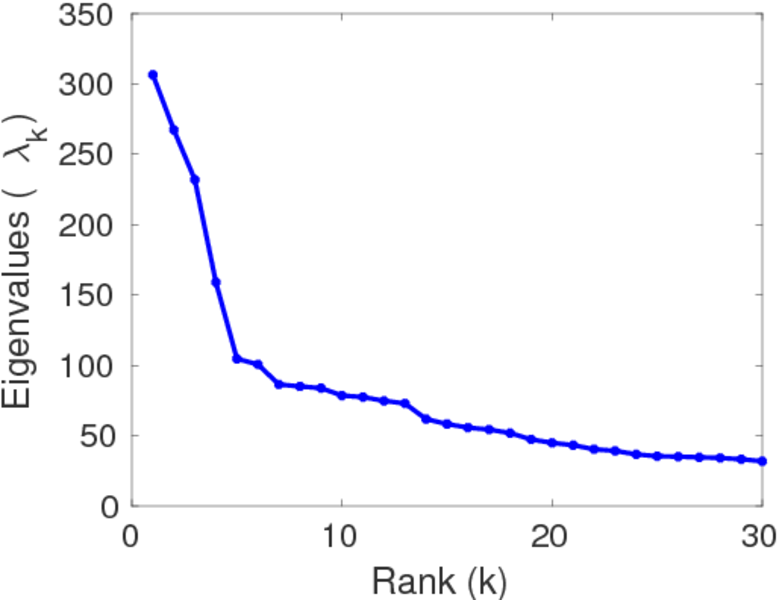
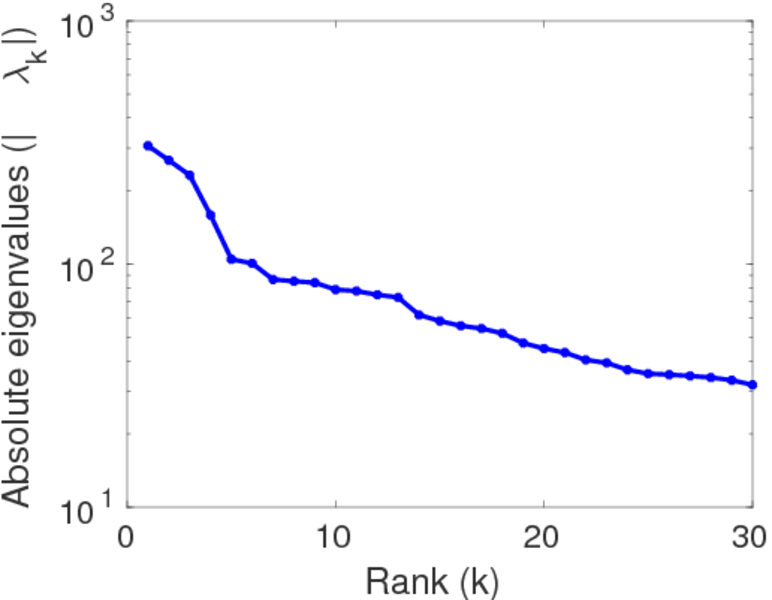
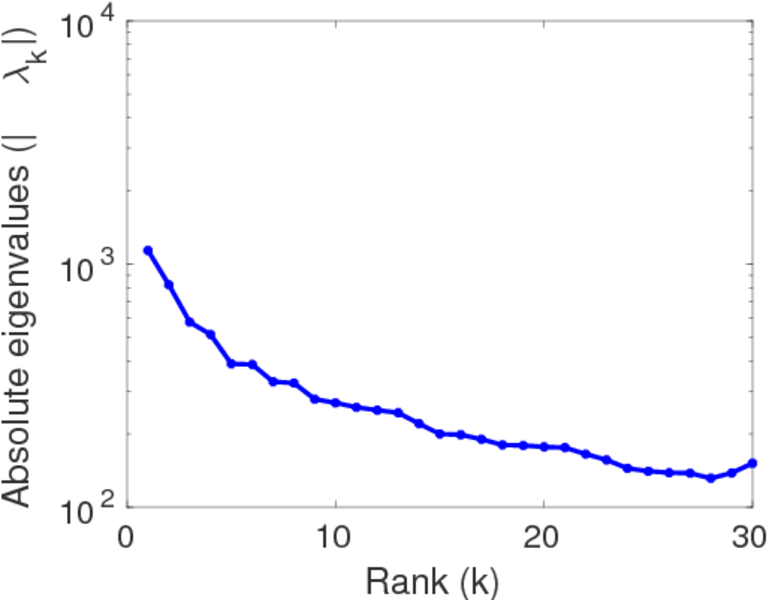
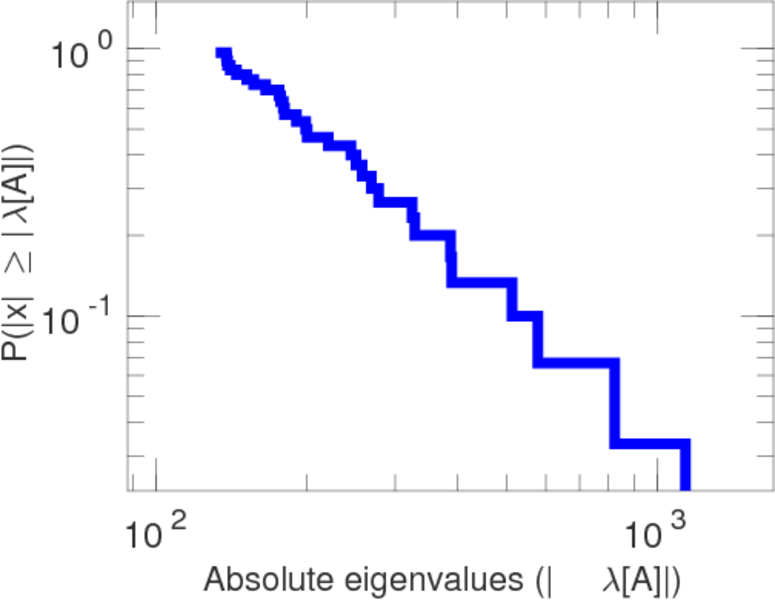
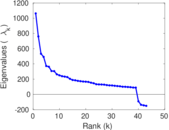
| Spectral norm | α = | 1,062.60
|
| Cyclic eigenvalue | π = | 488.063
|
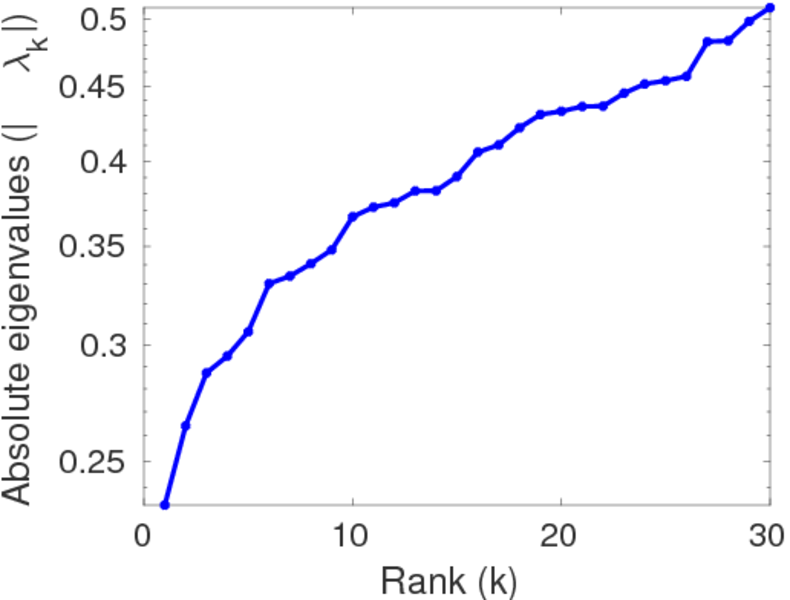
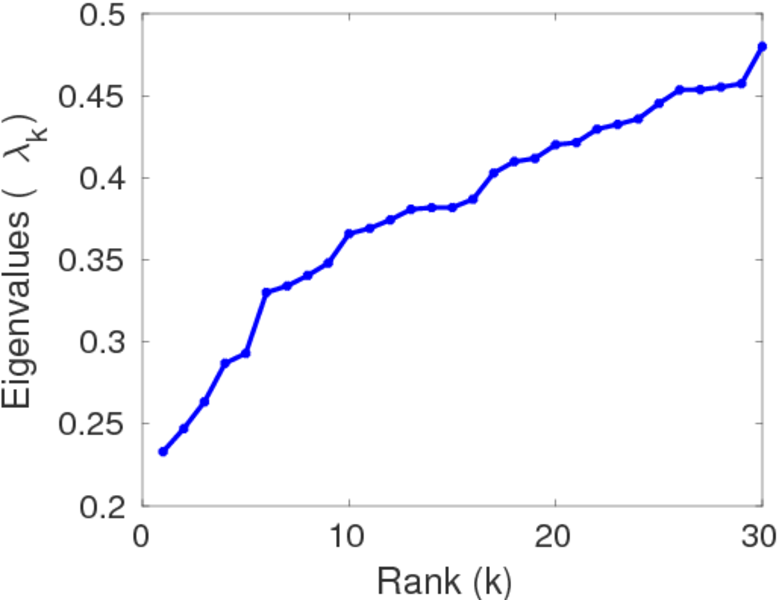
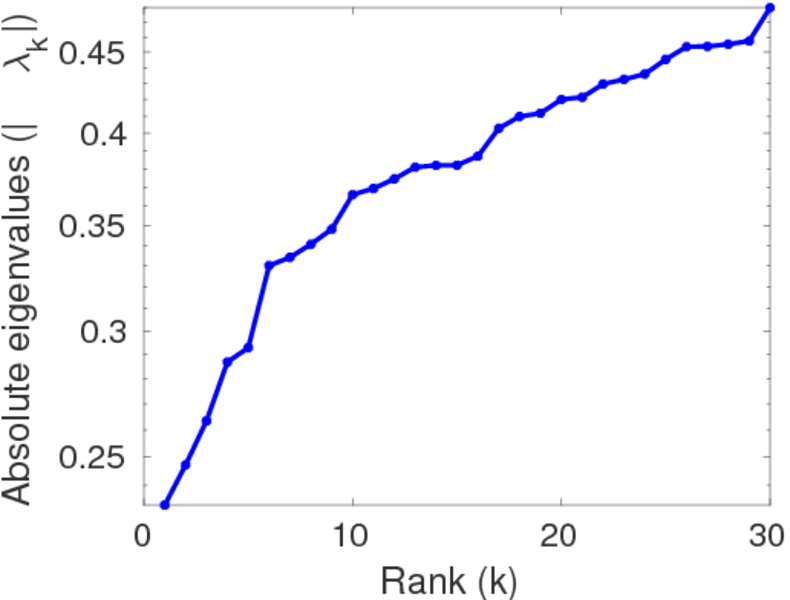
| Algebraic connectivity | a = | 0.232 791
|
| Reciprocity | y = | 0.651 702
|
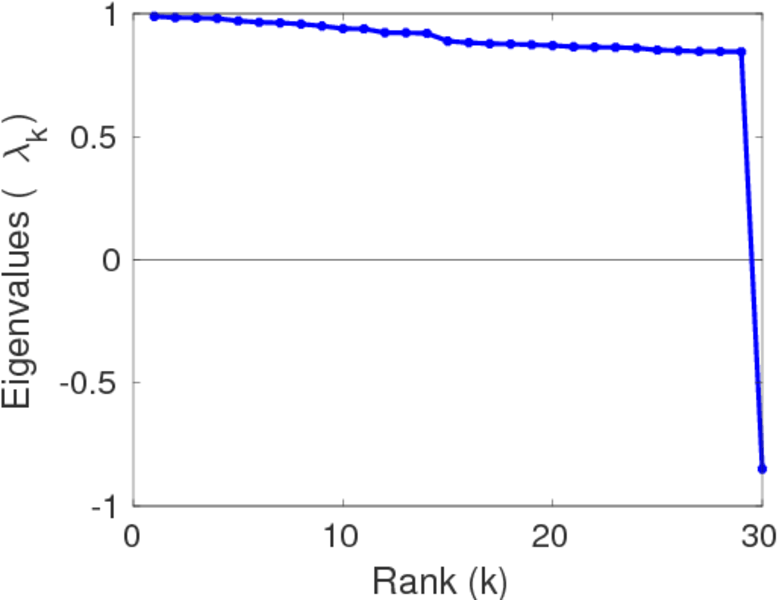
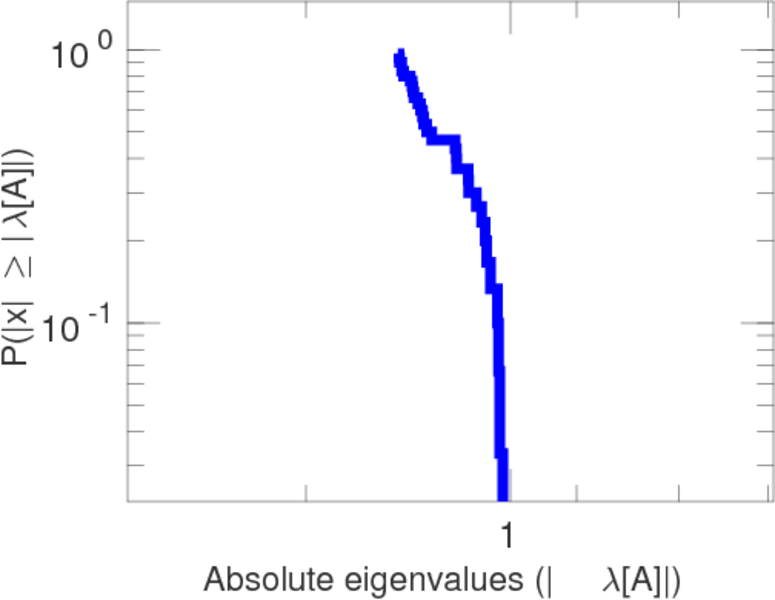
| Non-bipartivity | bA = | 0.858 460
|
| Normalized non-bipartivity | bN = | 0.147 132
|
| Spectral bipartite frustration | bK = | 0.000 710 817
|
| Controllability | C = | 8,967
|
| Relative controllability | Cr = | 0.437 735
|
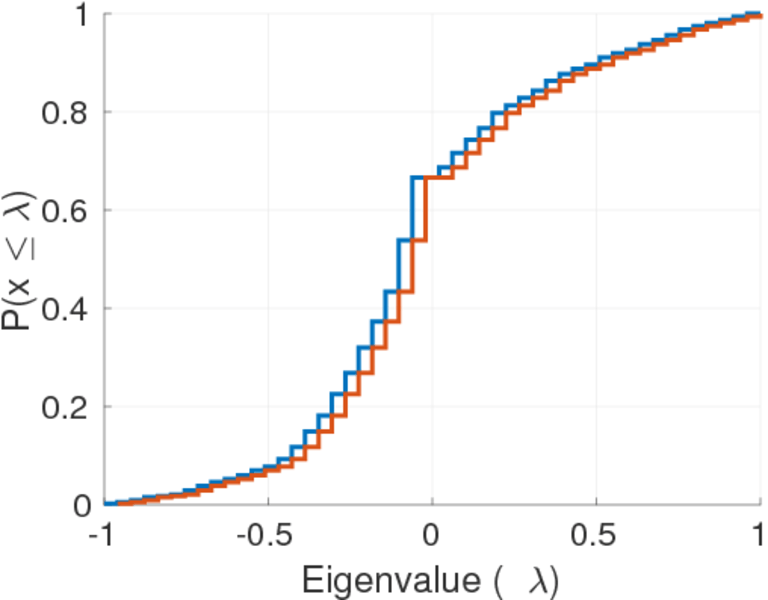
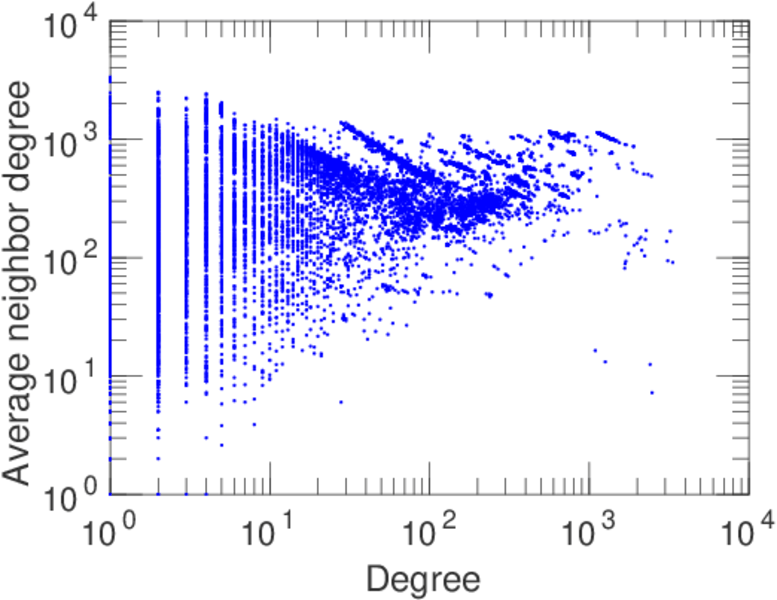
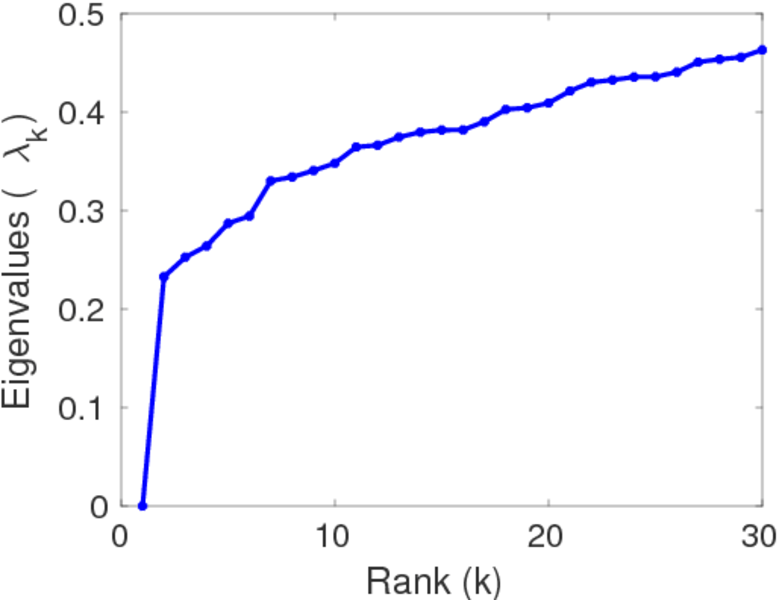
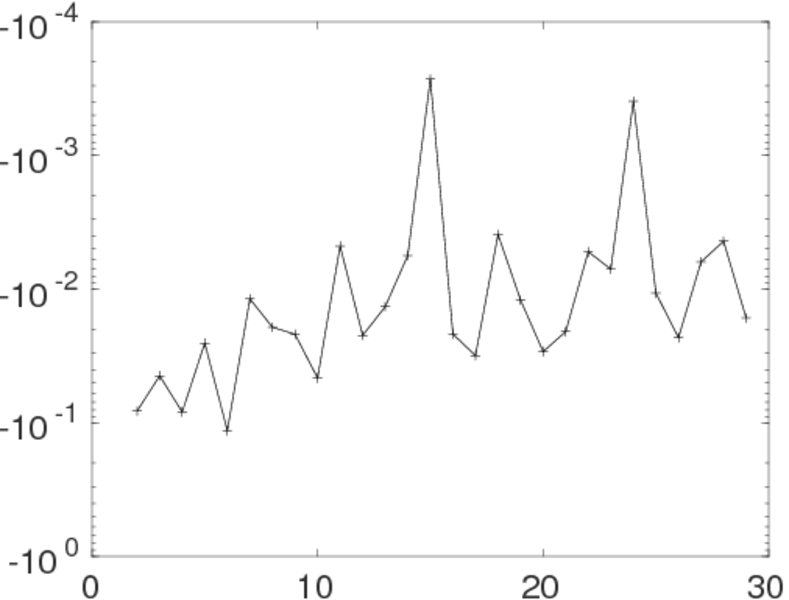
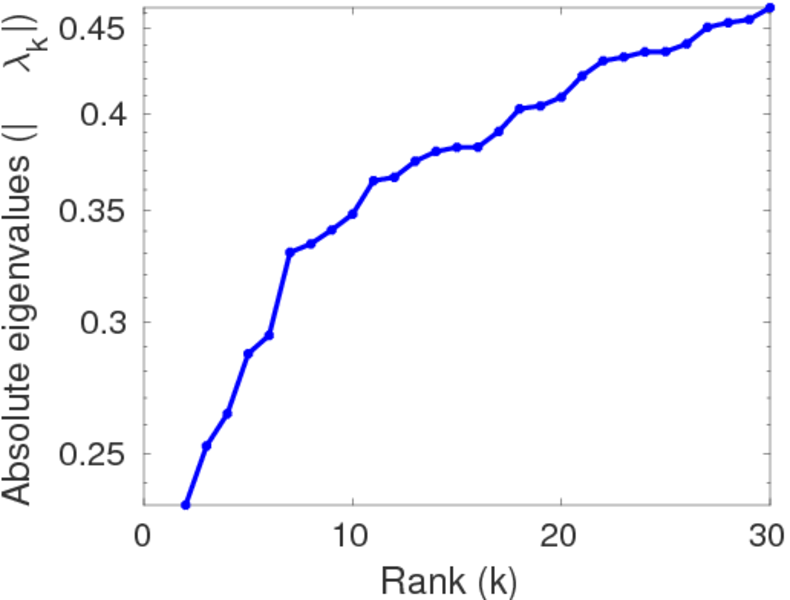
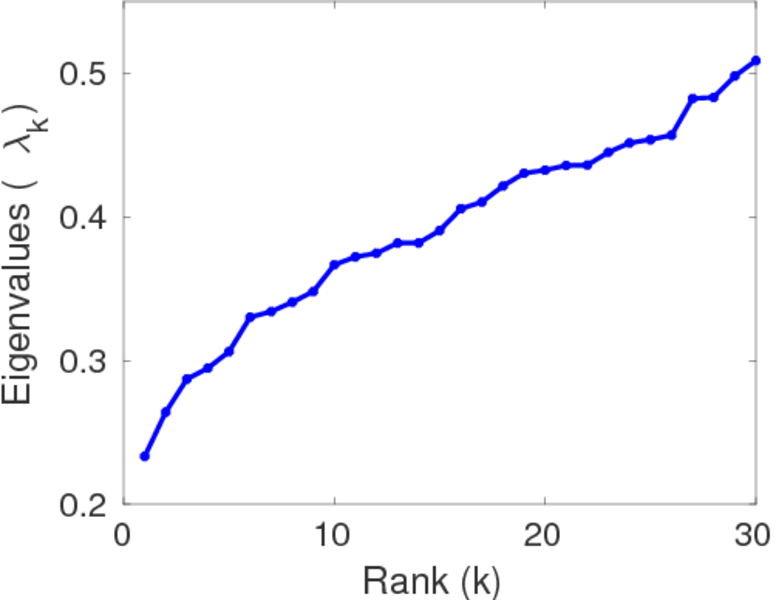
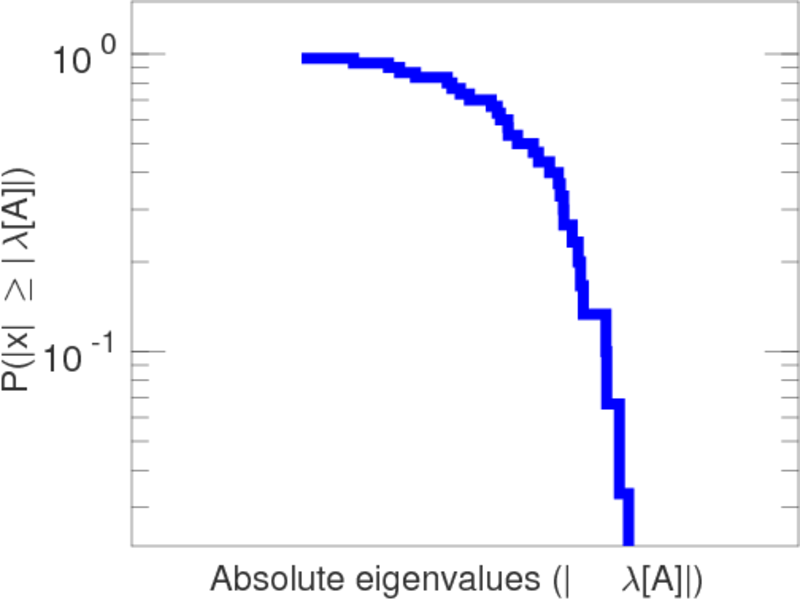
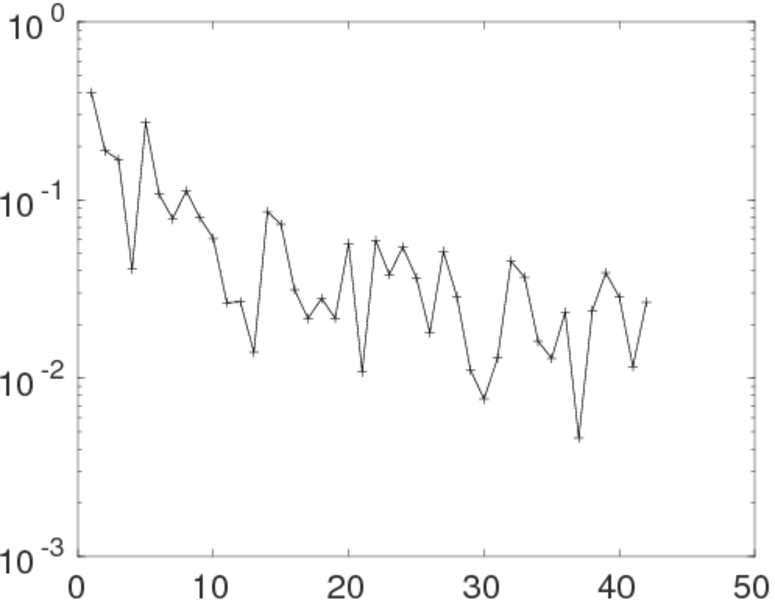
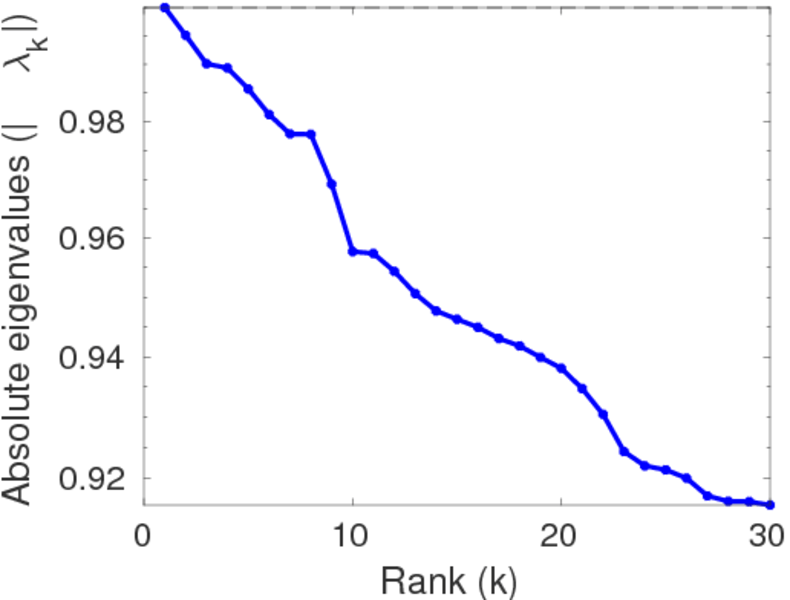
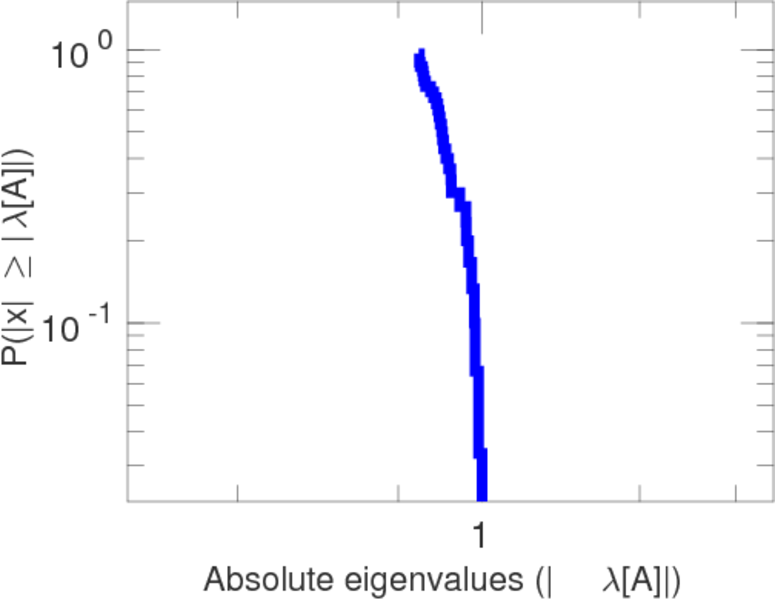
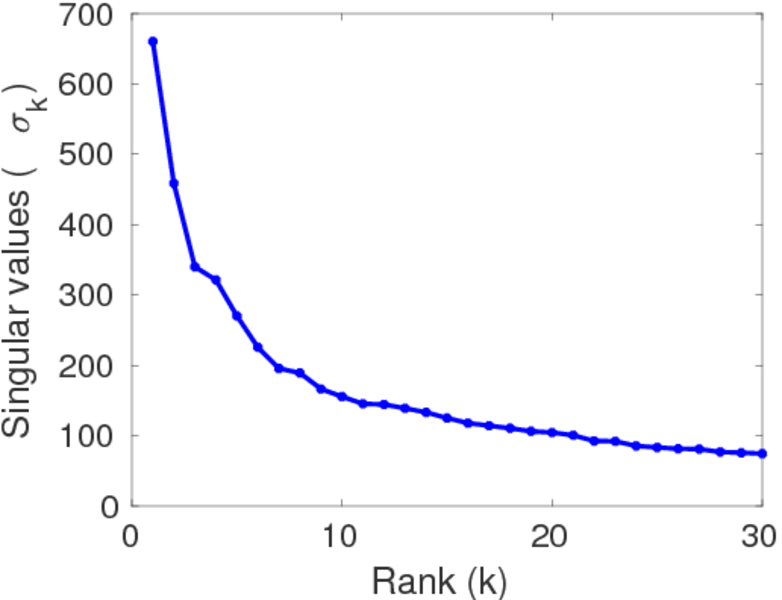
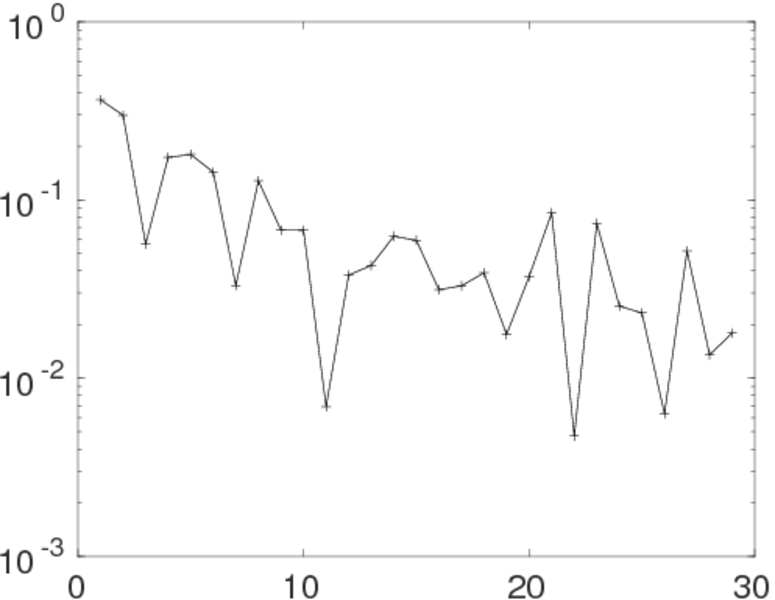
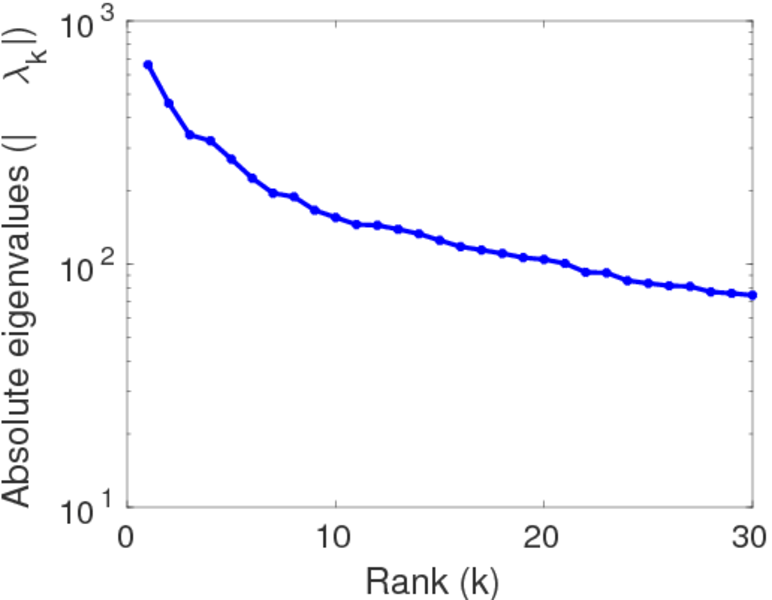
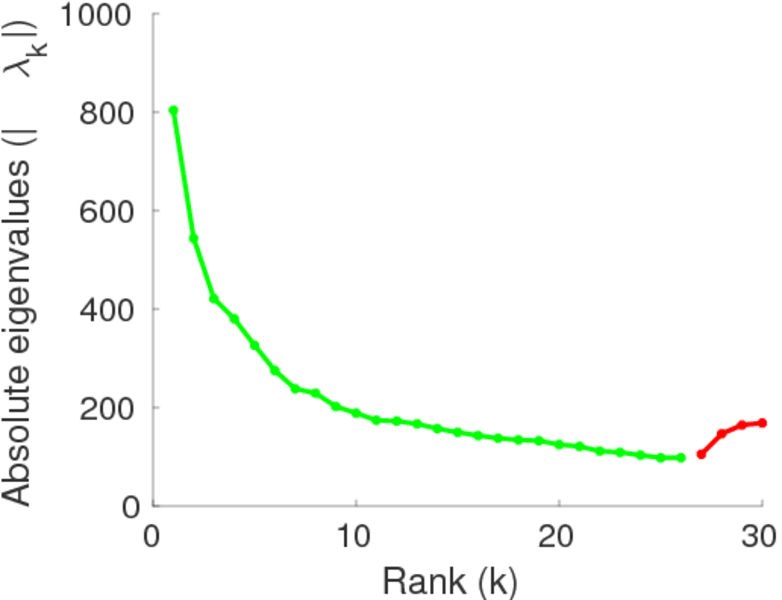
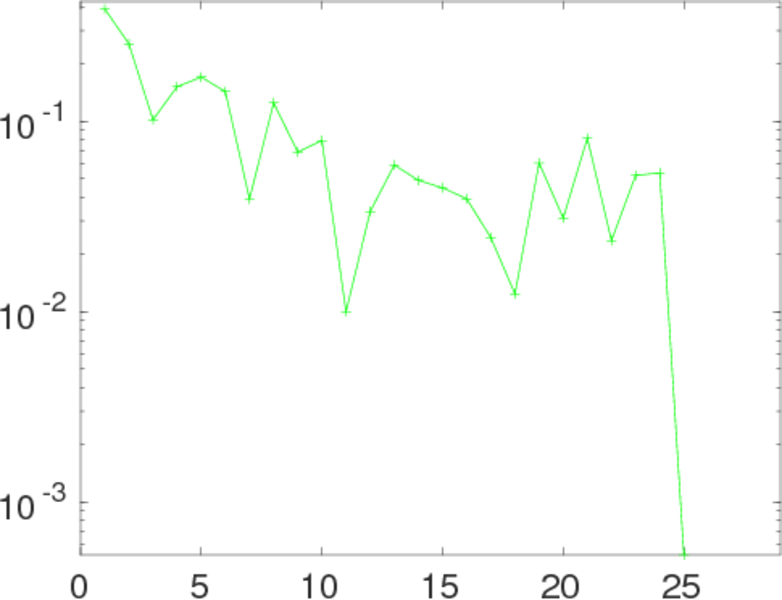
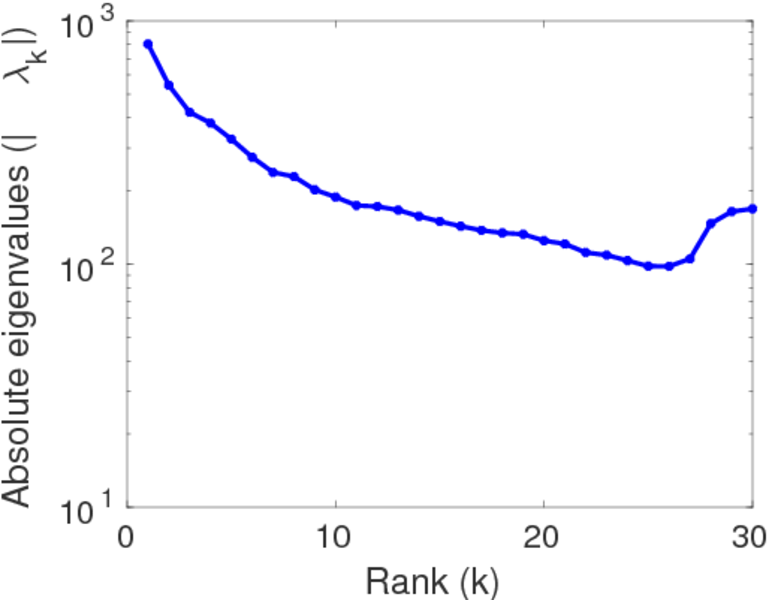
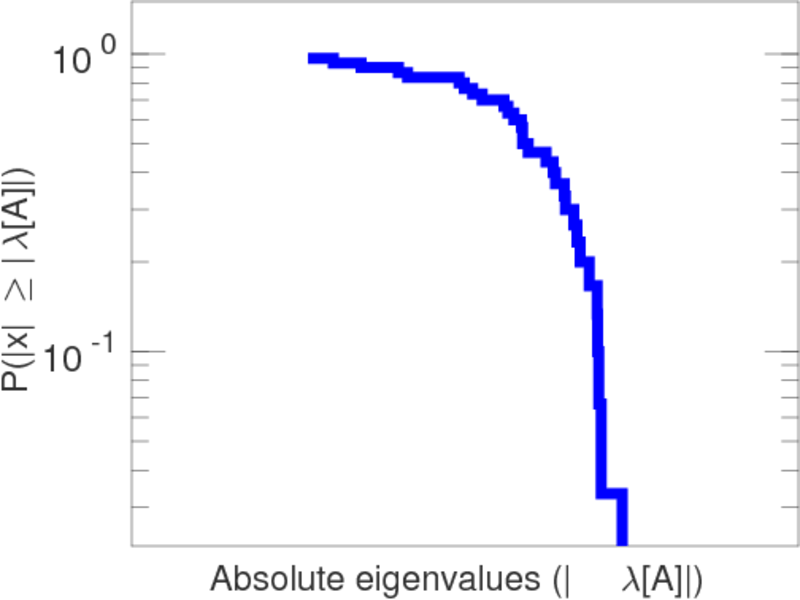
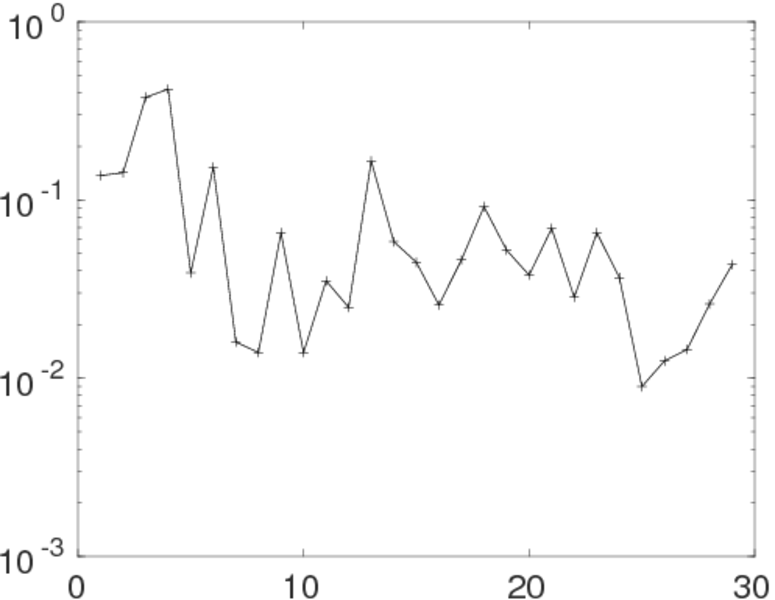
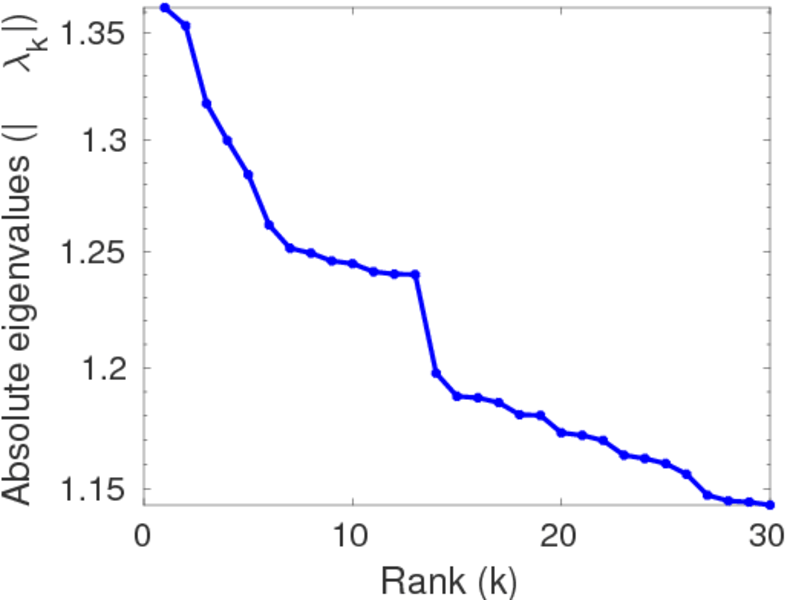
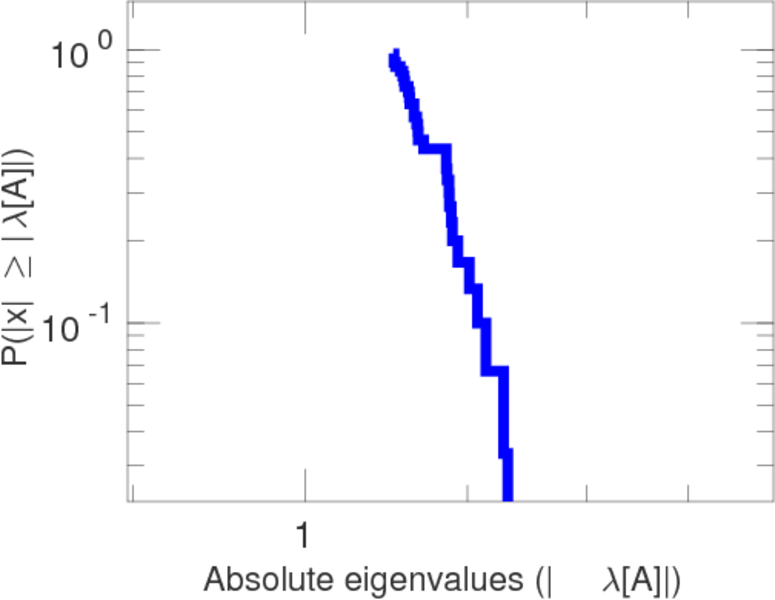
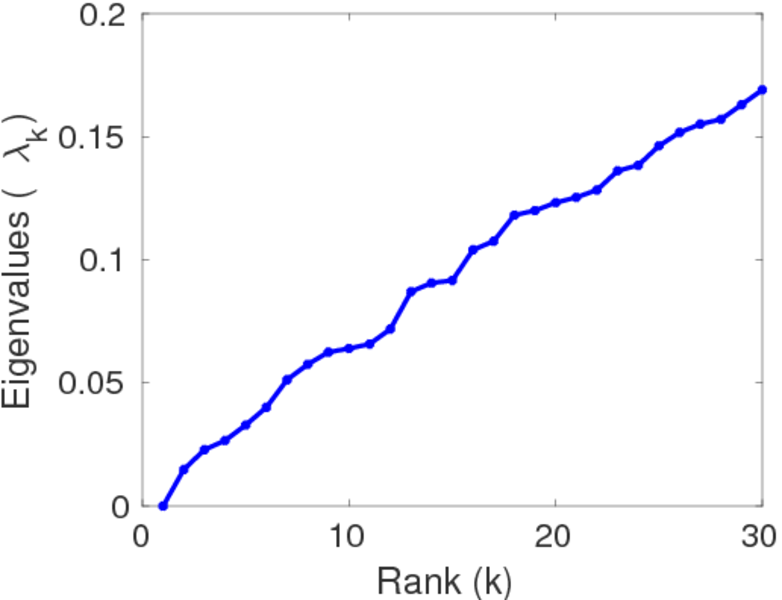
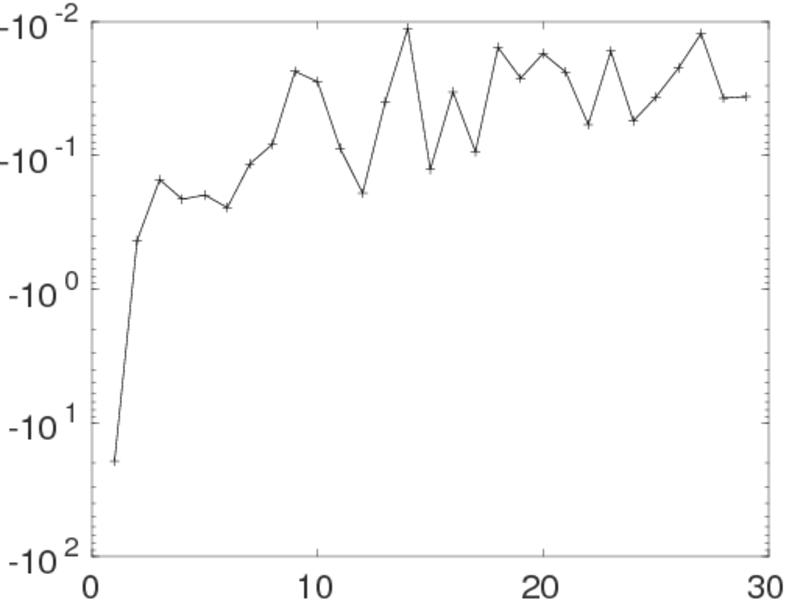
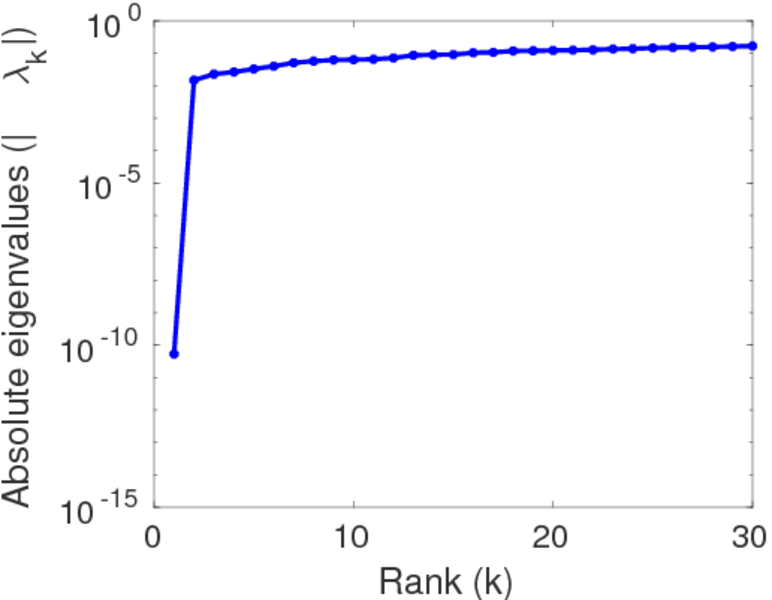
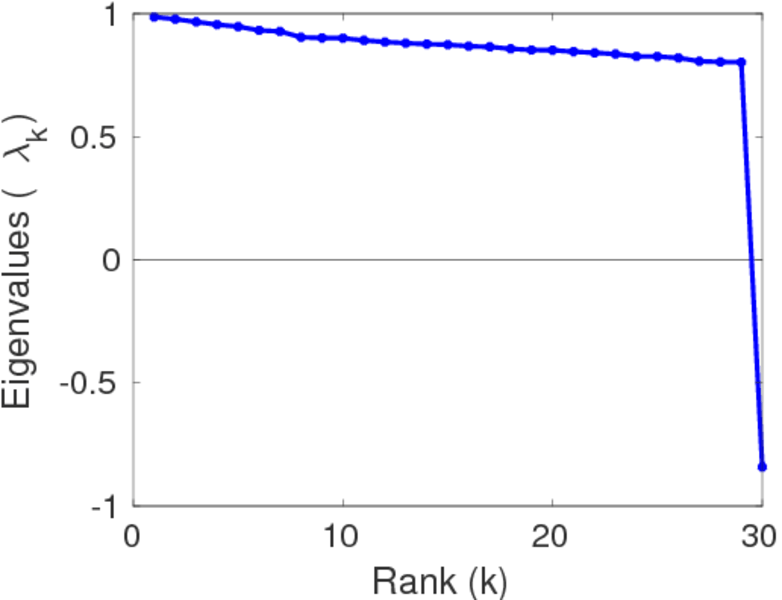
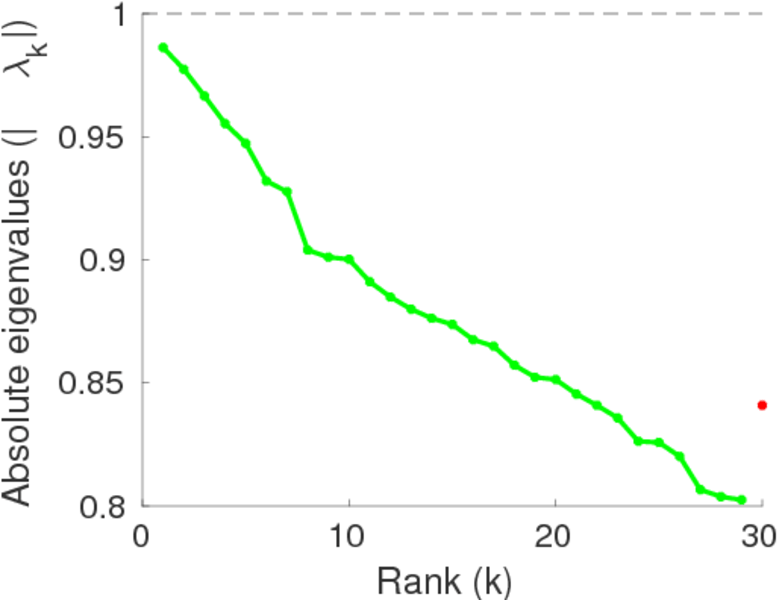
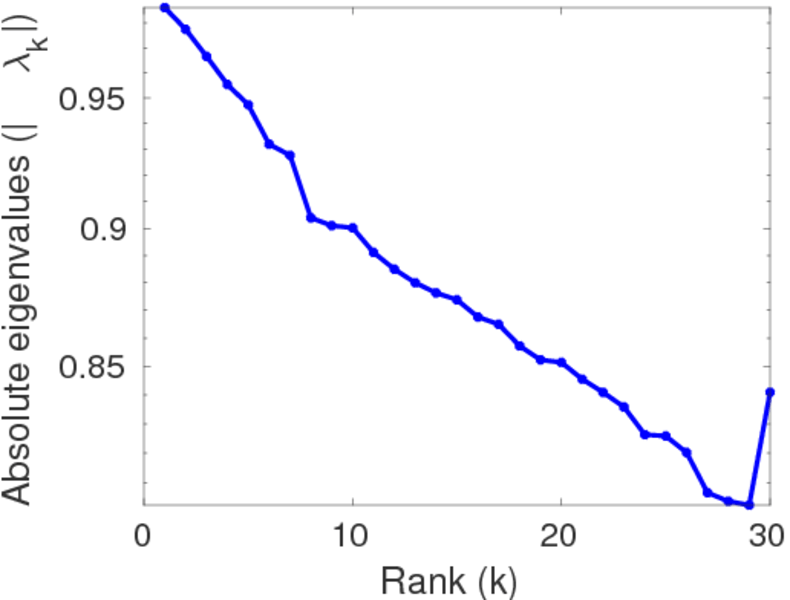
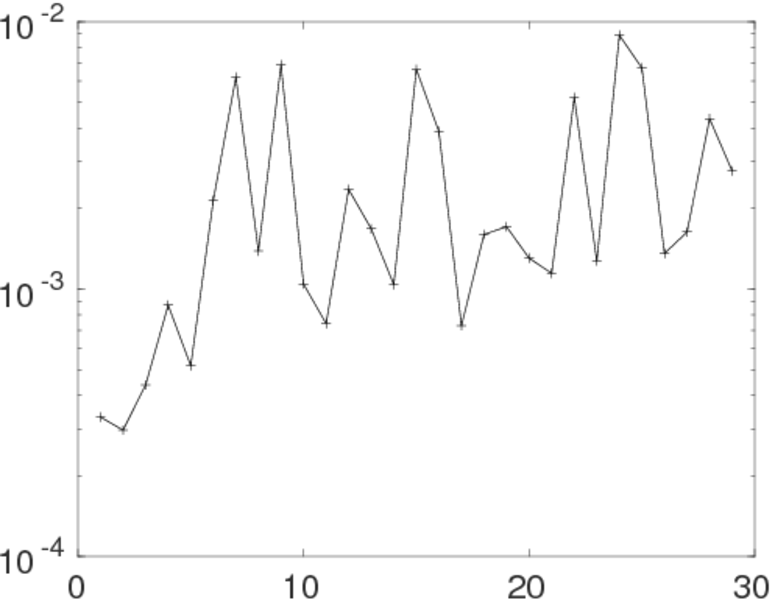
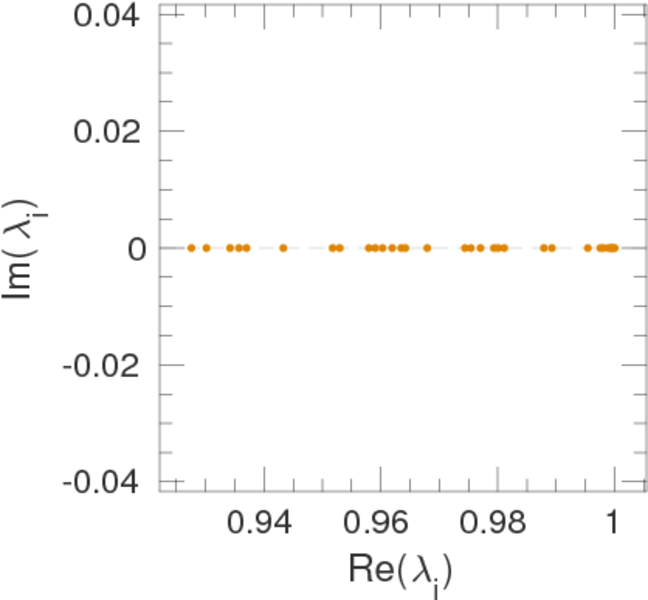
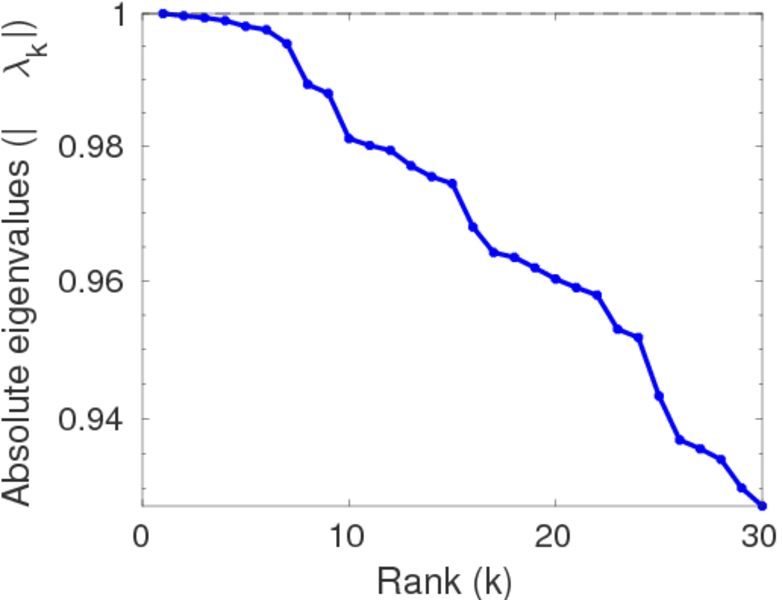
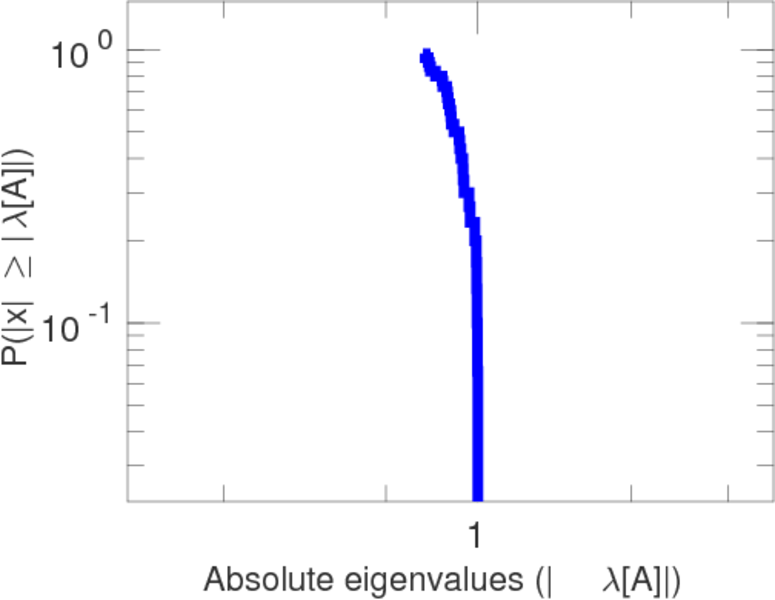
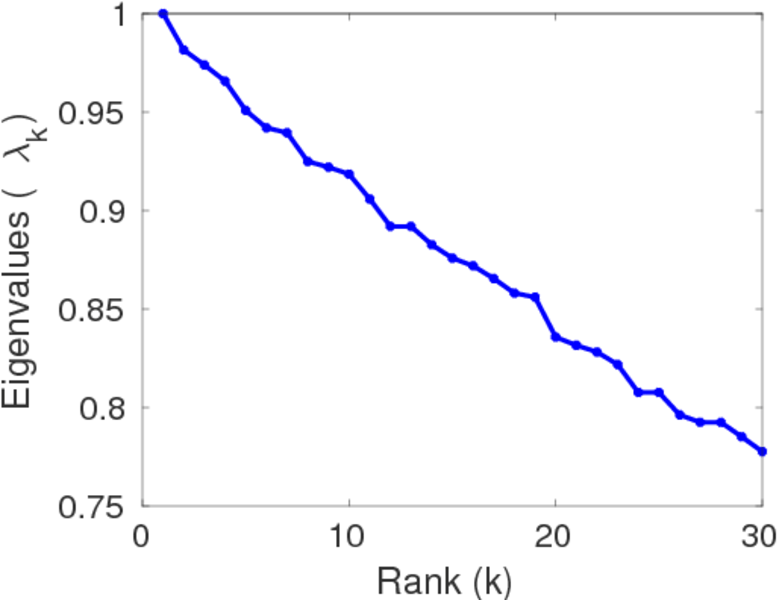
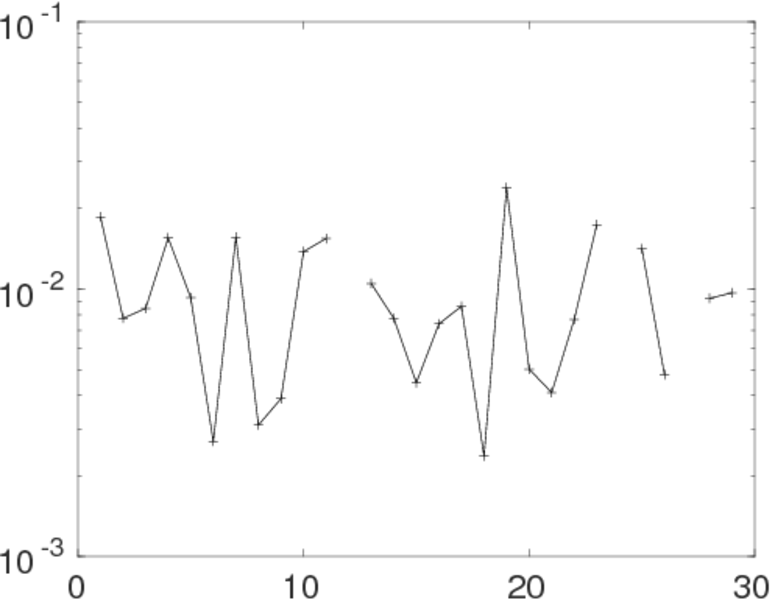
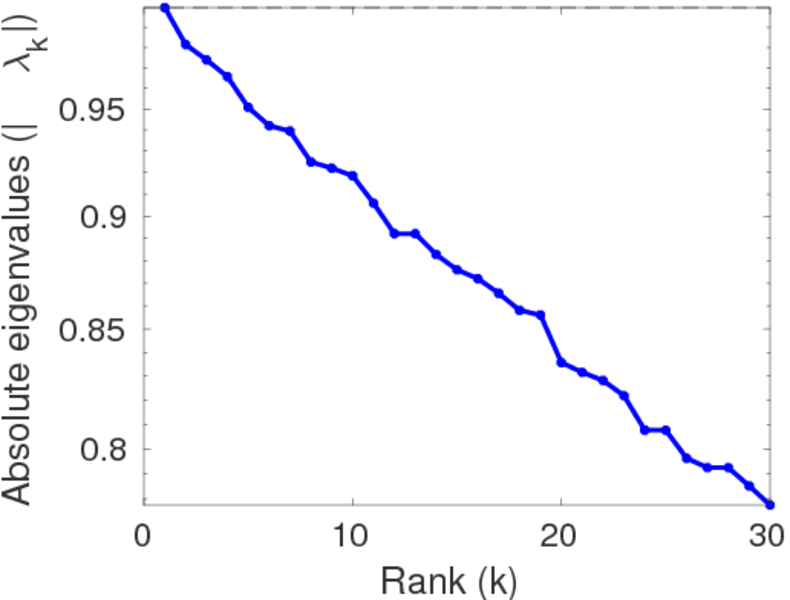
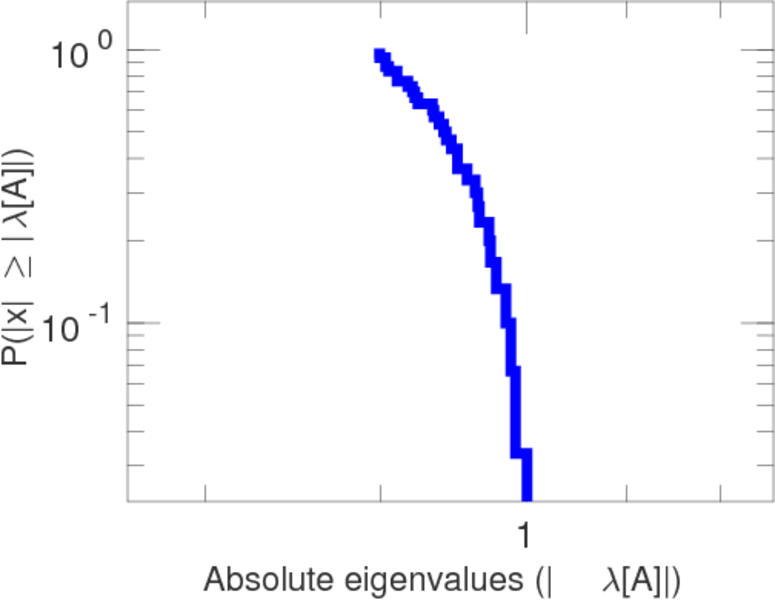
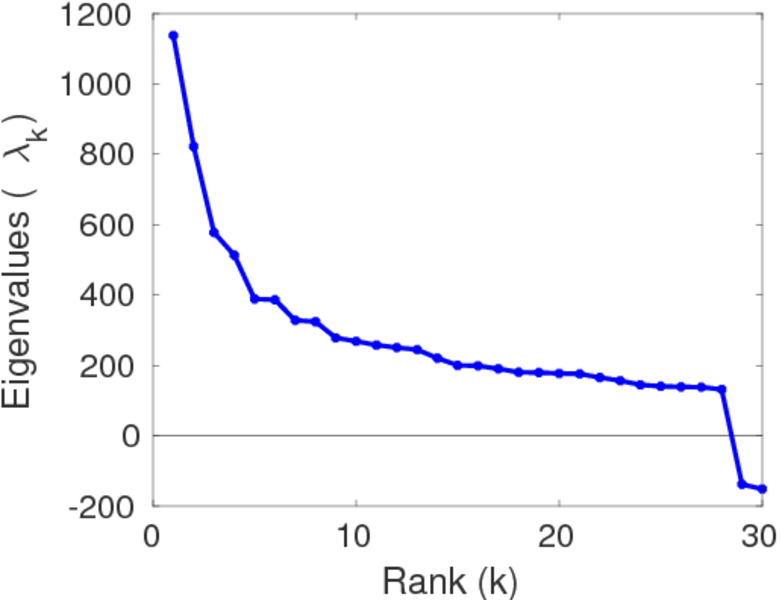
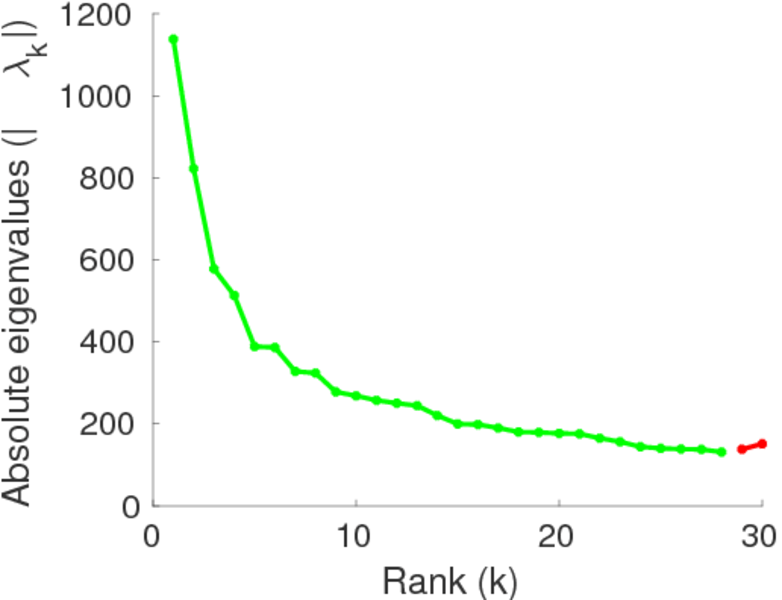
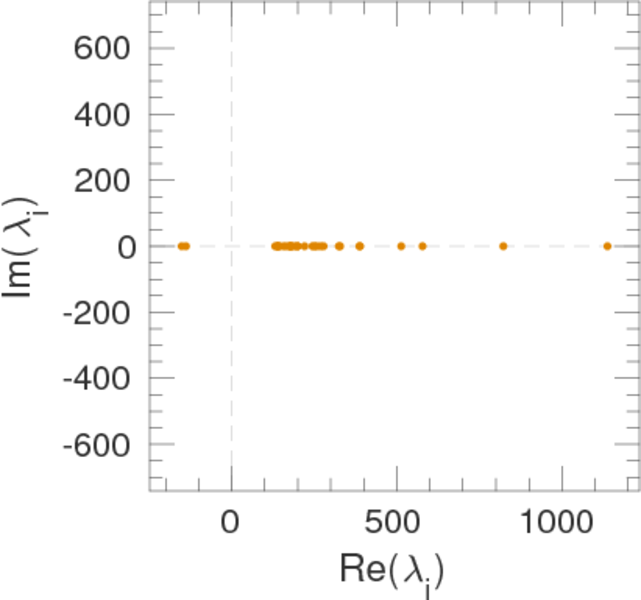
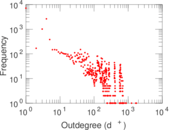
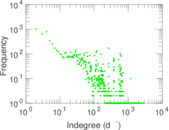
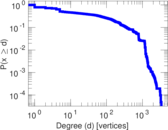
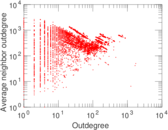
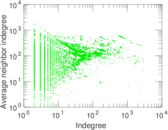
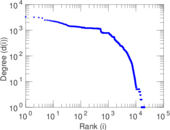
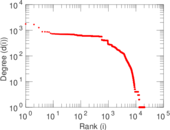
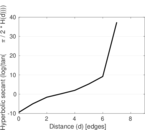
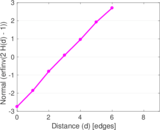
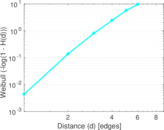
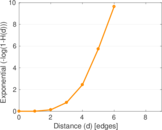
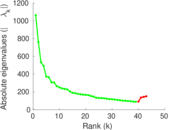
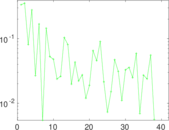
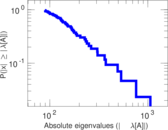
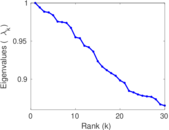
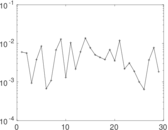
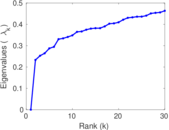
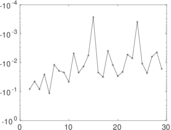
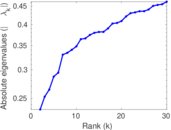
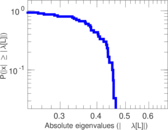
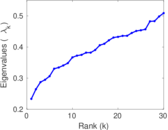
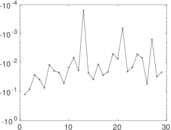
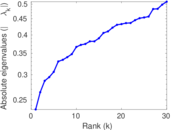
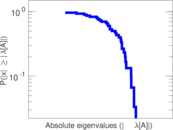
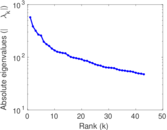
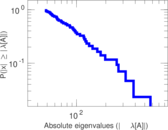
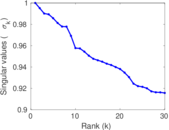
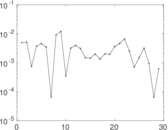
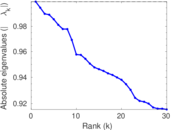
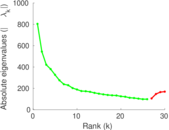
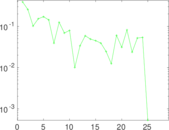
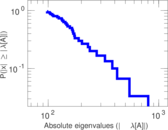
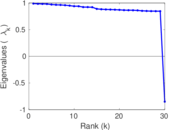
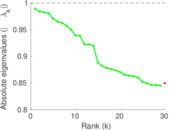
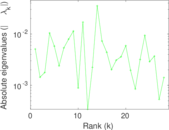
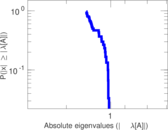
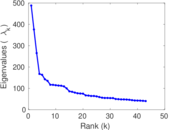
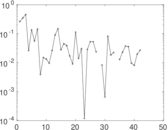
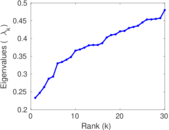
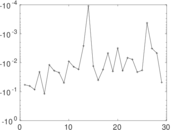
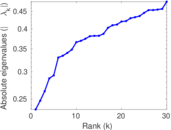
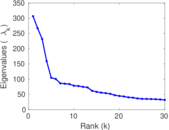
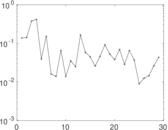
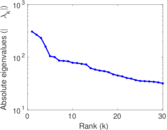
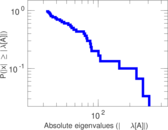
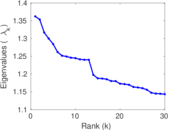
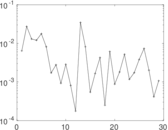
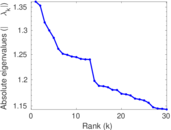
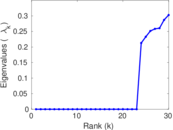
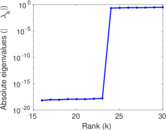
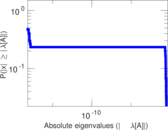
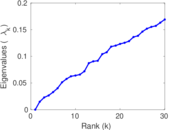
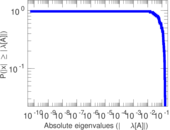
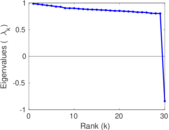
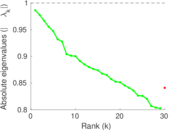
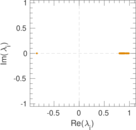
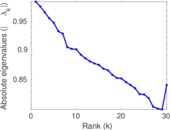
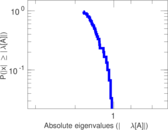
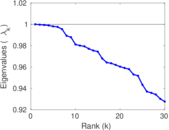
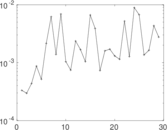
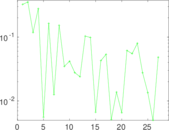
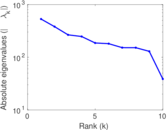
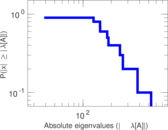
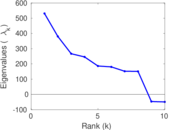
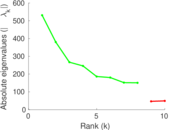
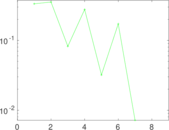
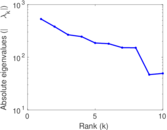
Plots

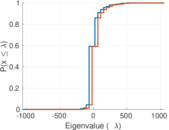
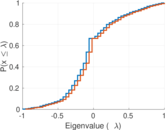
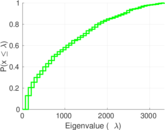
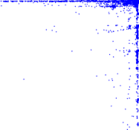
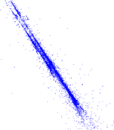
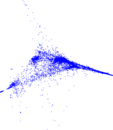

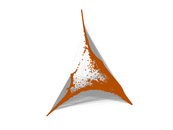
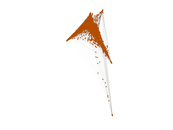


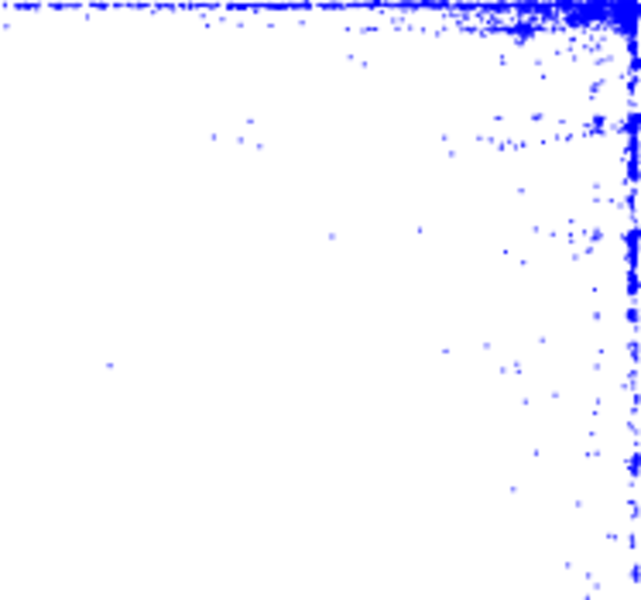
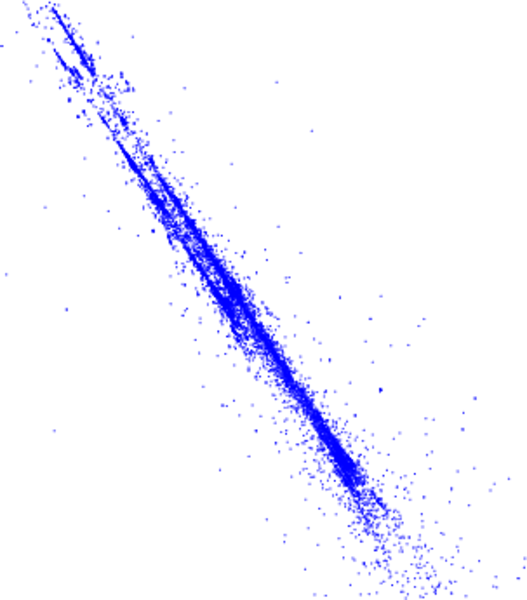
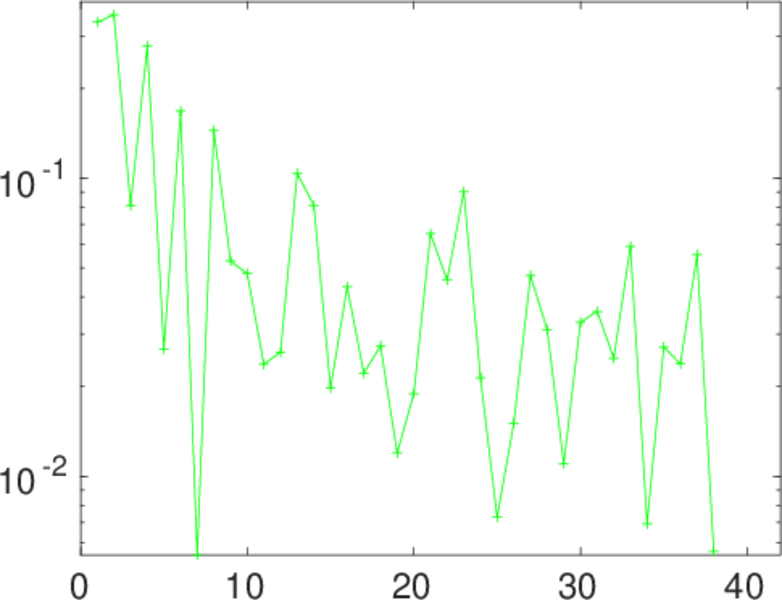
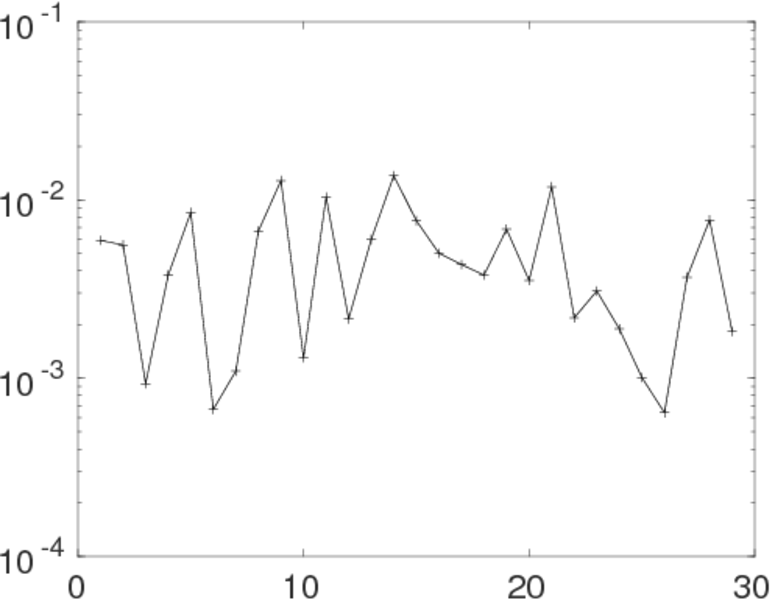
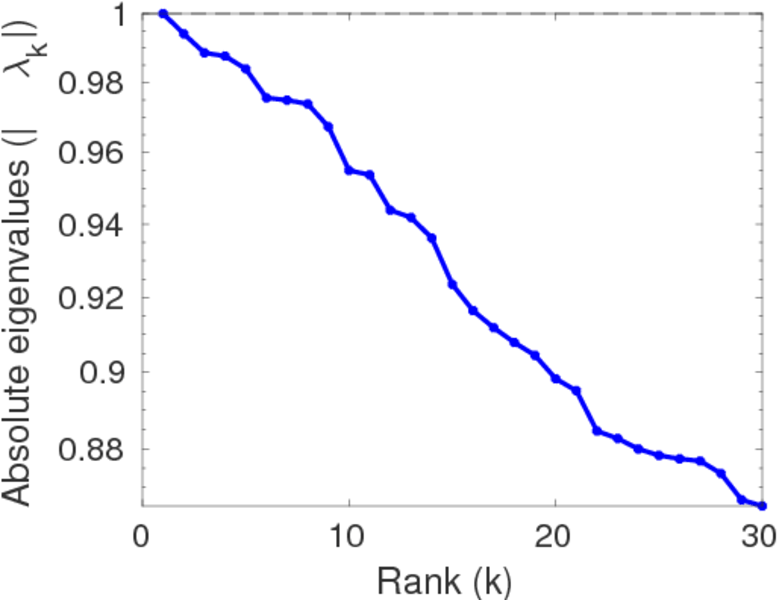
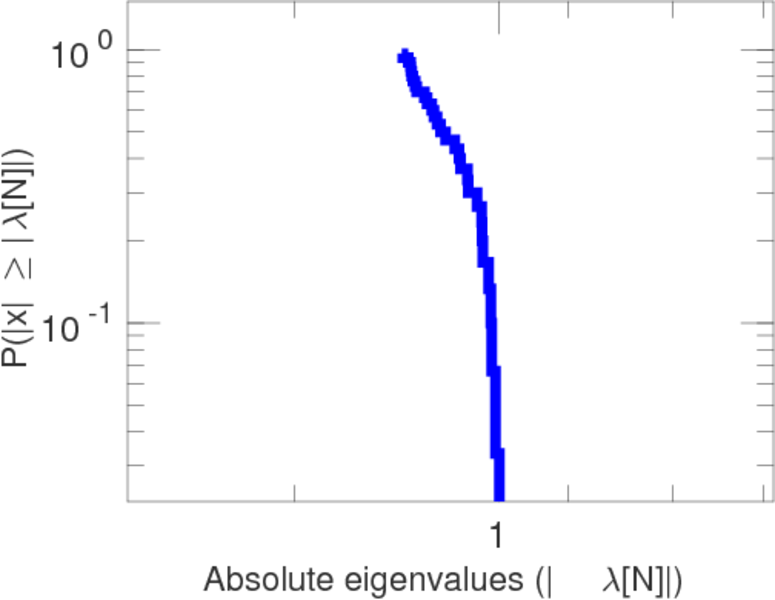
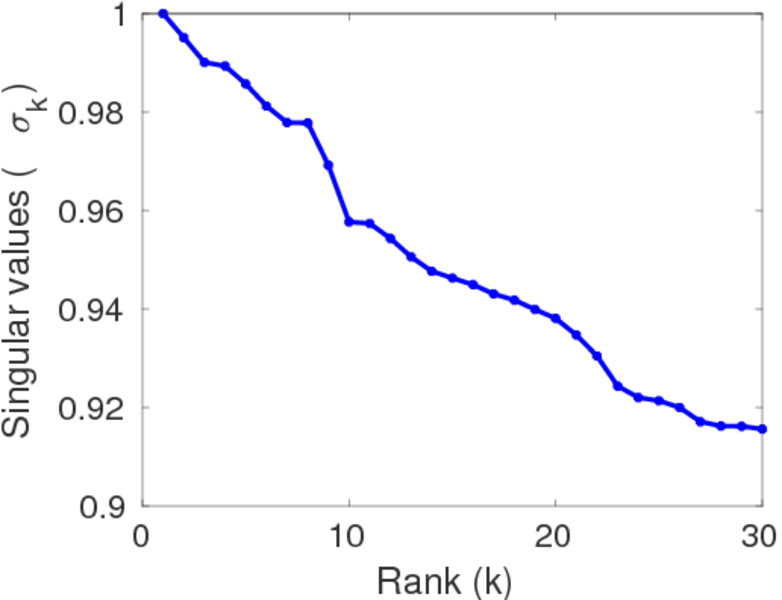
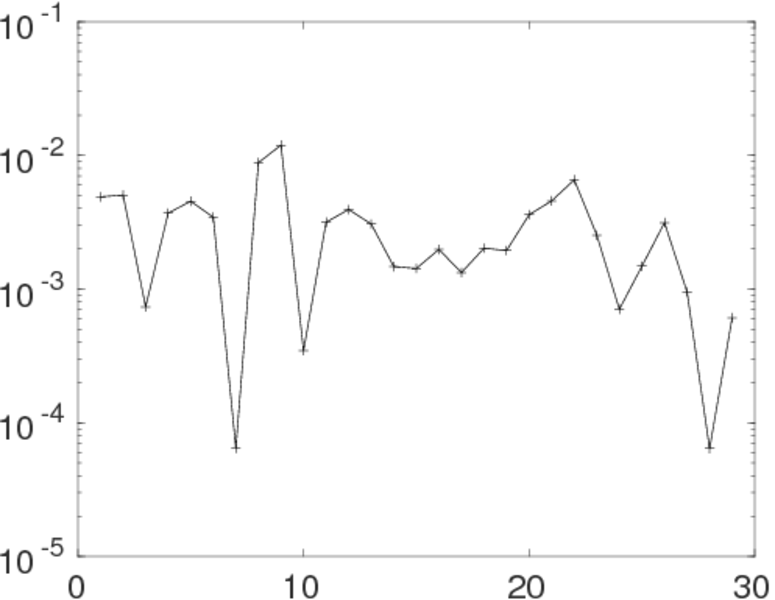
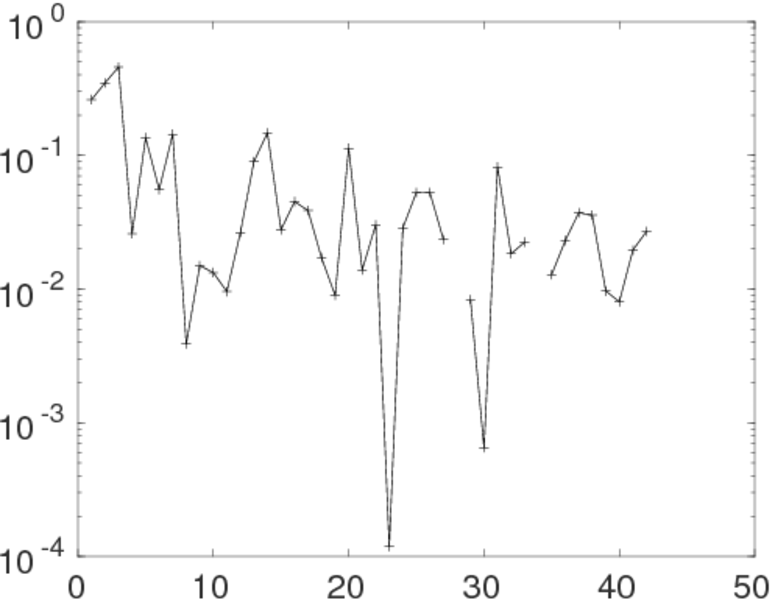
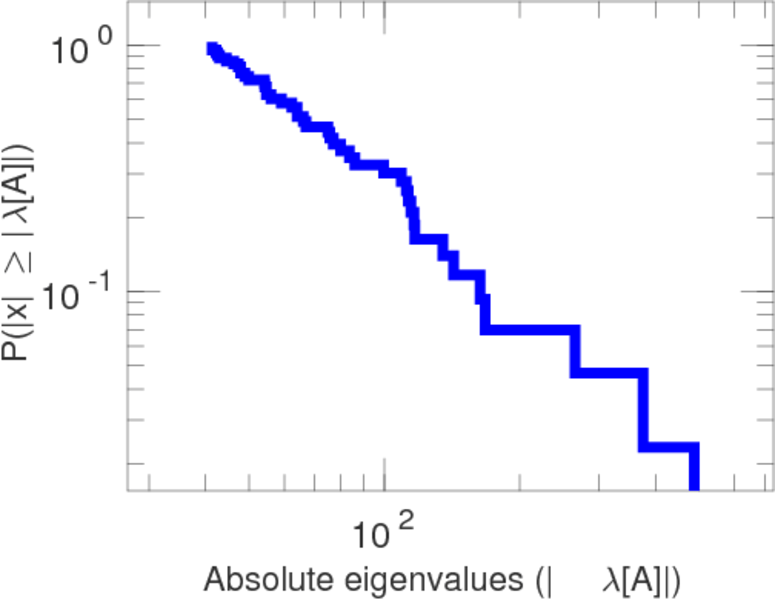
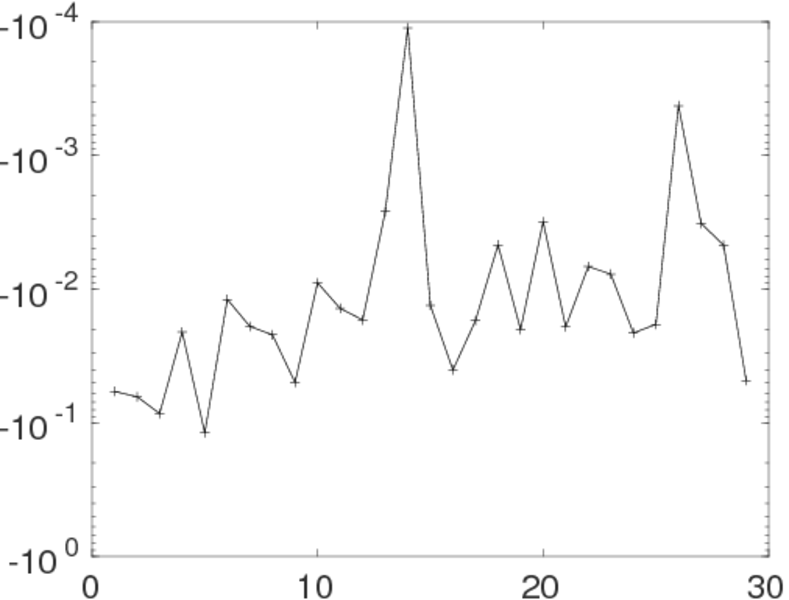
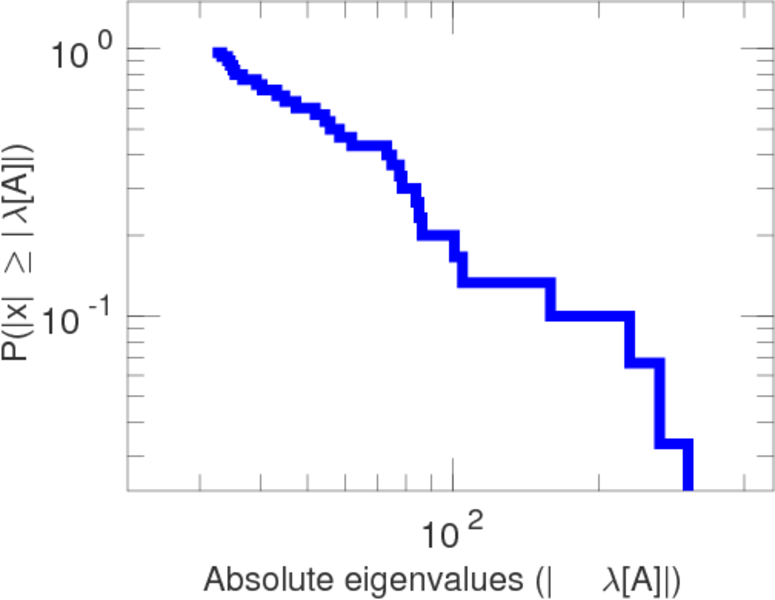
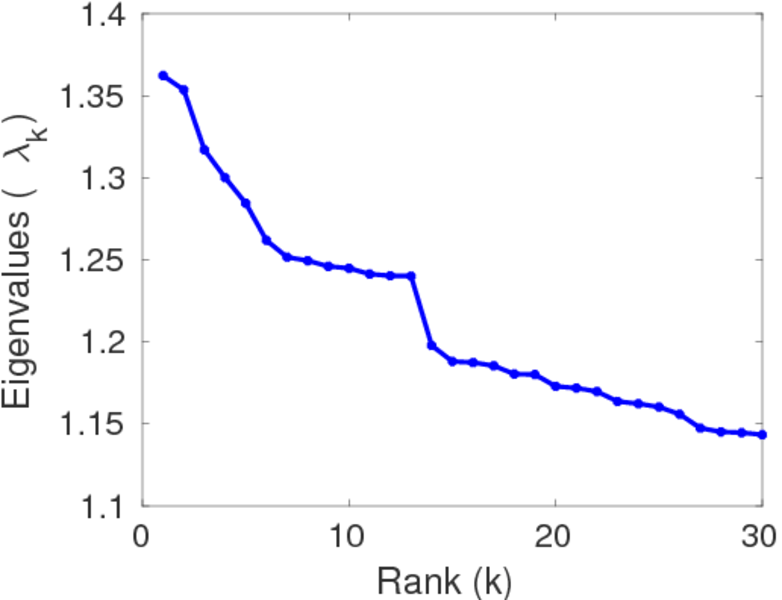
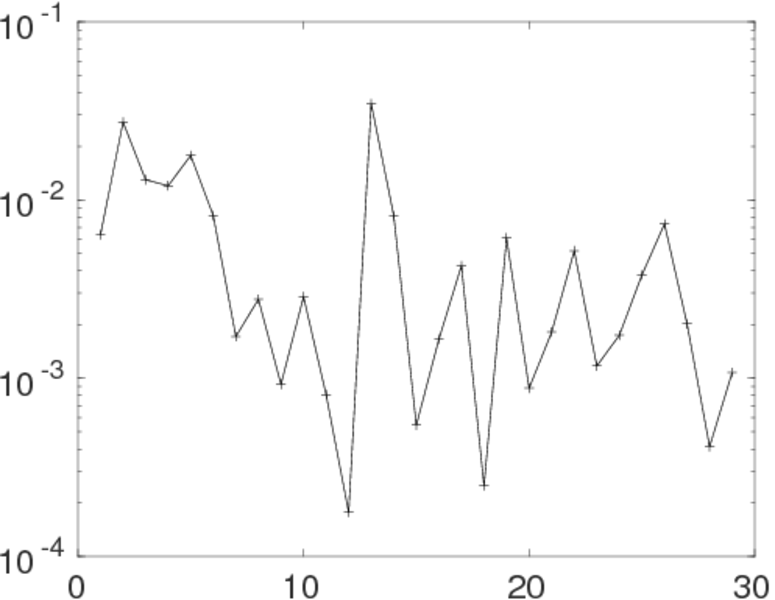
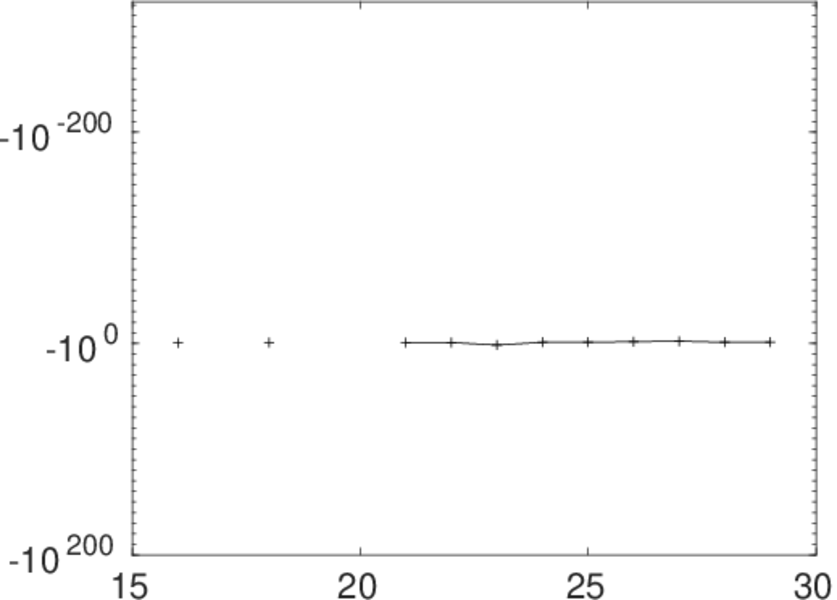
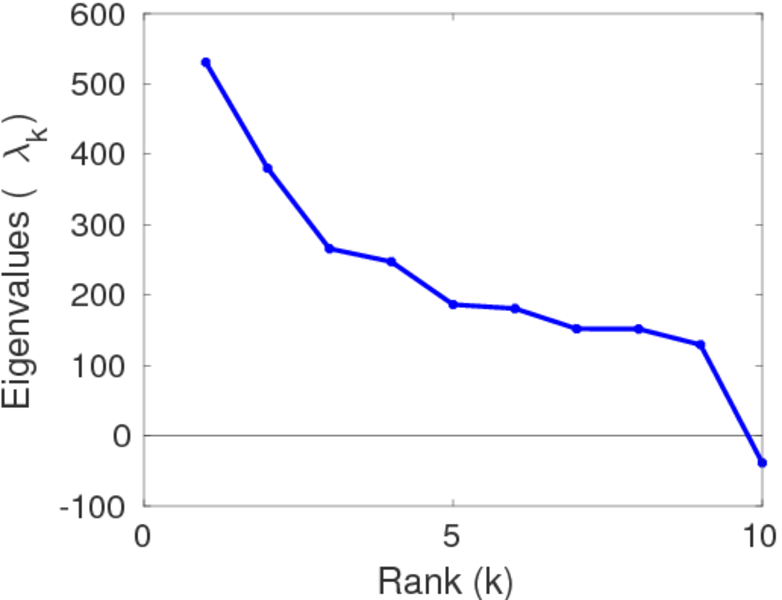
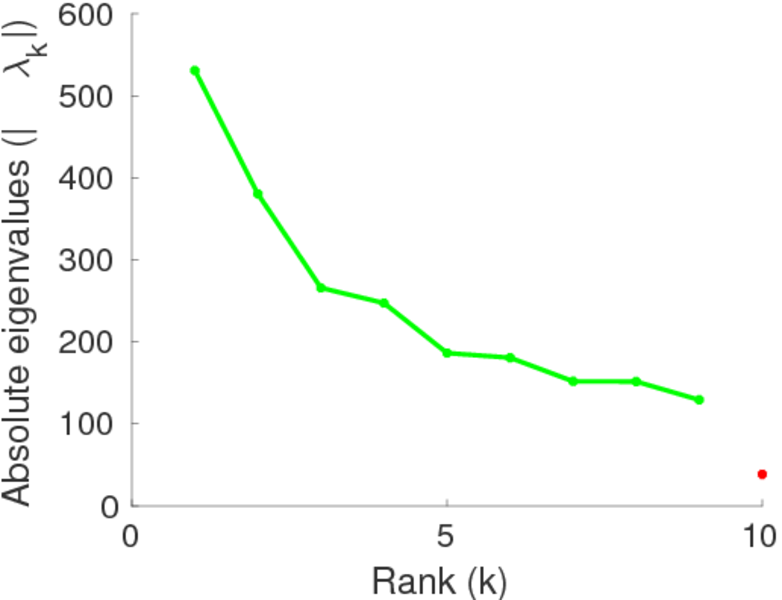
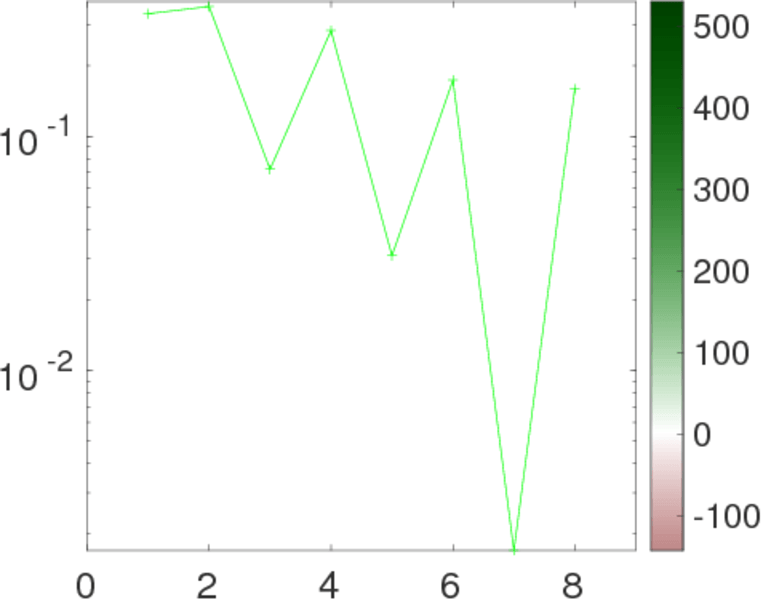
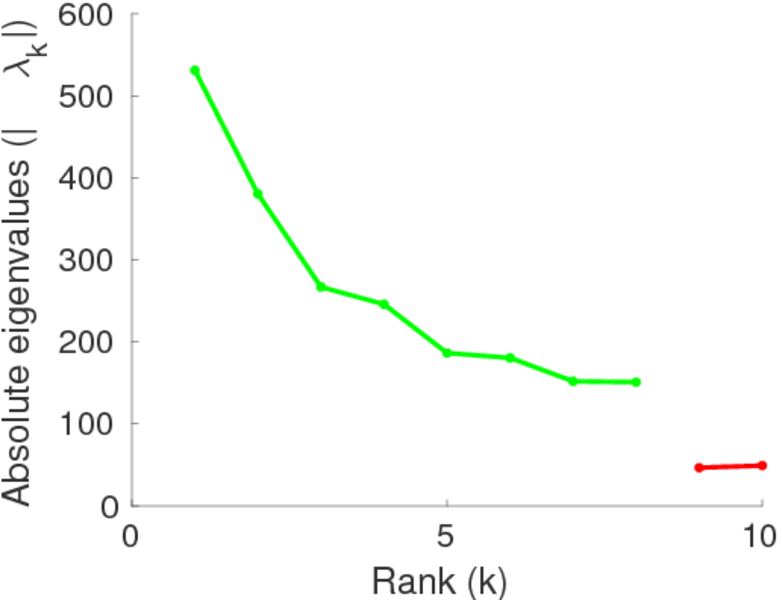
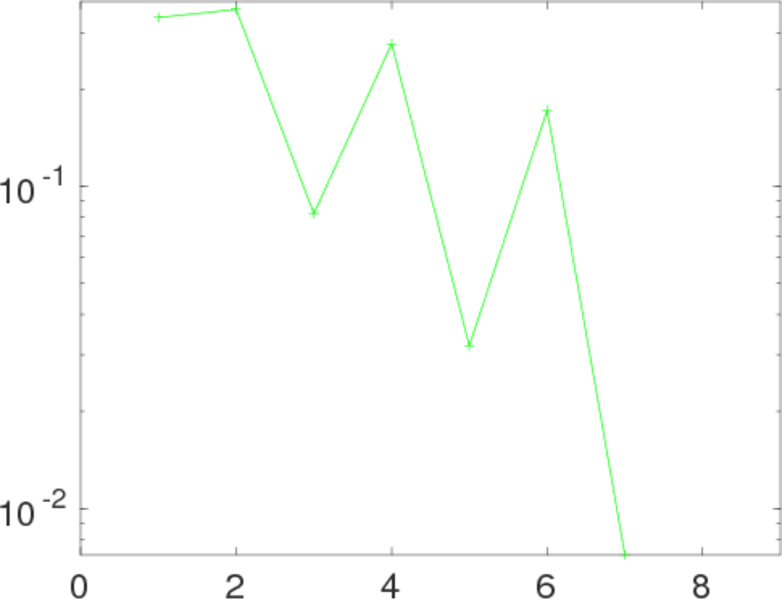
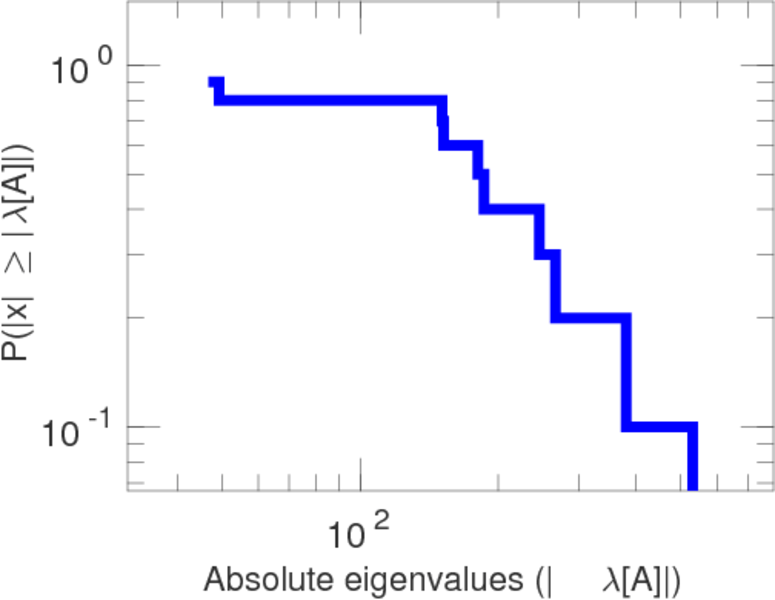
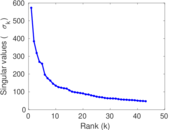
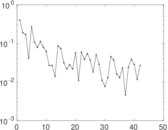
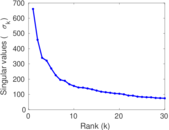
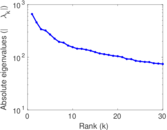
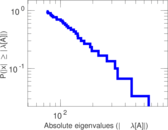
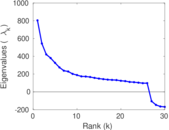
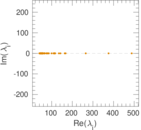
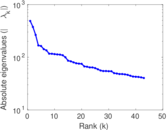
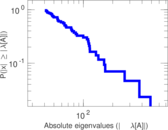
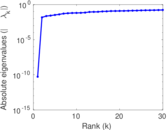
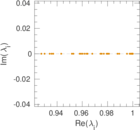
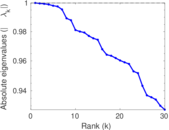
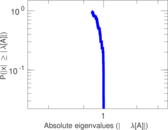
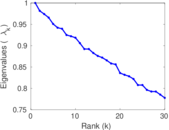
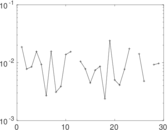
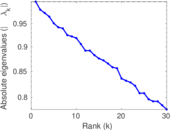
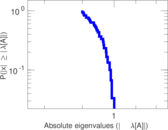
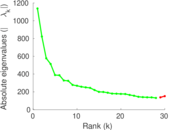
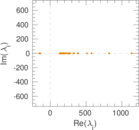
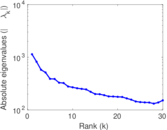
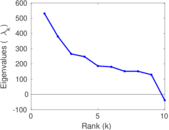
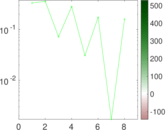
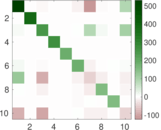
Matrix decompositions plots


Downloads
References
|
[1]
|
Jérôme Kunegis.
KONECT – The Koblenz Network Collection.
In Proc. Int. Conf. on World Wide Web Companion, pages
1343–1350, 2013.
[ http ]
|
 KONECT ‣ Networks ‣
Buy Me a Coffee
KONECT ‣ Networks ‣
Buy Me a Coffee