Wikipedia links (my)
This network consists of the wikilinks of the Wikipedia in the Burmese language
(my). Nodes are Wikipedia articles, and directed edges are wikilinks, i.e.,
hyperlinks within one wiki. In the wiki source, these are indicated with
[[double brackets]]. Only pages in the article namespace are included.
Metadata
Statistics
| Size | n = | 44,651
|
| Volume | m = | 1,201,350
|
| Loop count | l = | 53
|
| Wedge count | s = | 1,485,249,192
|
| Claw count | z = | 7,463,531,386,919
|
| Cross count | x = | 35,855,459,138,091,844
|
| Triangle count | t = | 44,466,264
|
| Square count | q = | 21,106,852,678
|
| 4-Tour count | T4 = | 174,797,565,818
|
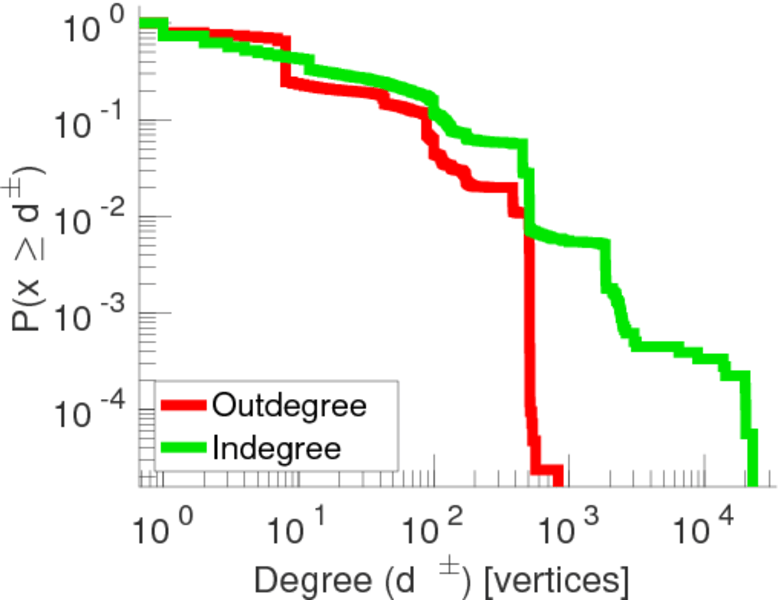
| Maximum degree | dmax = | 23,161
|
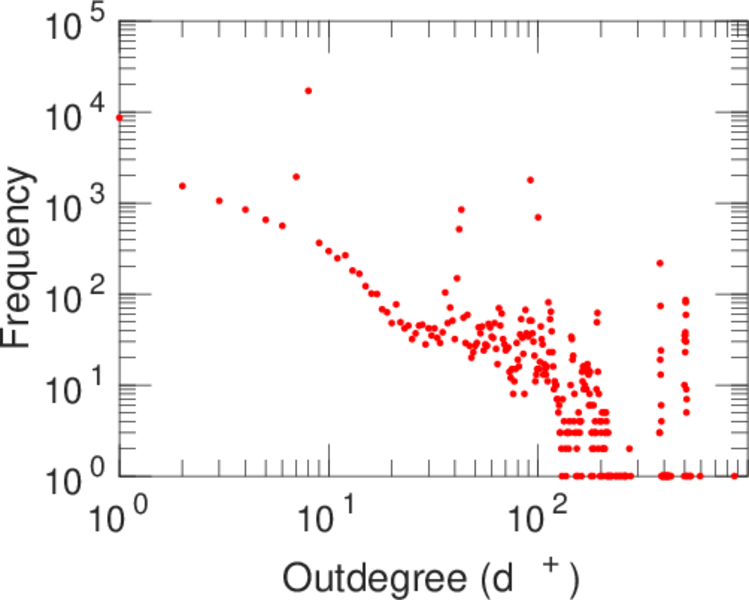
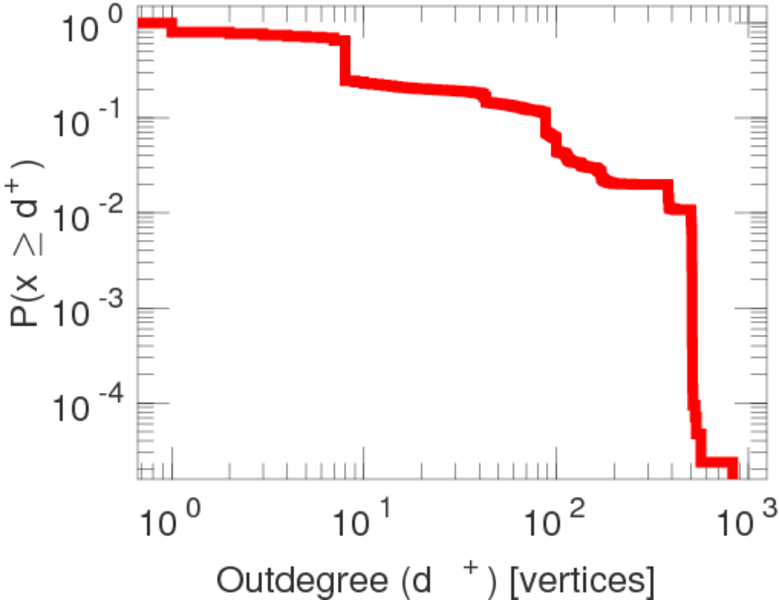
| Maximum outdegree | d+max = | 866
|
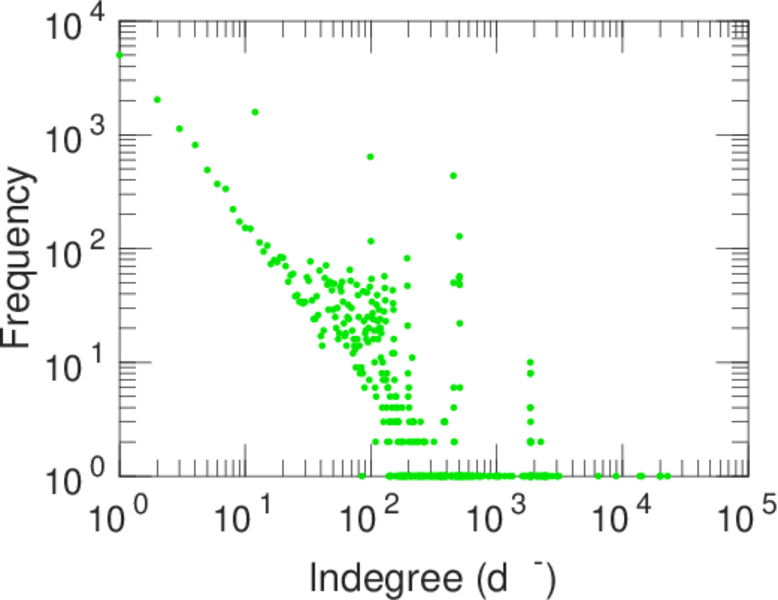
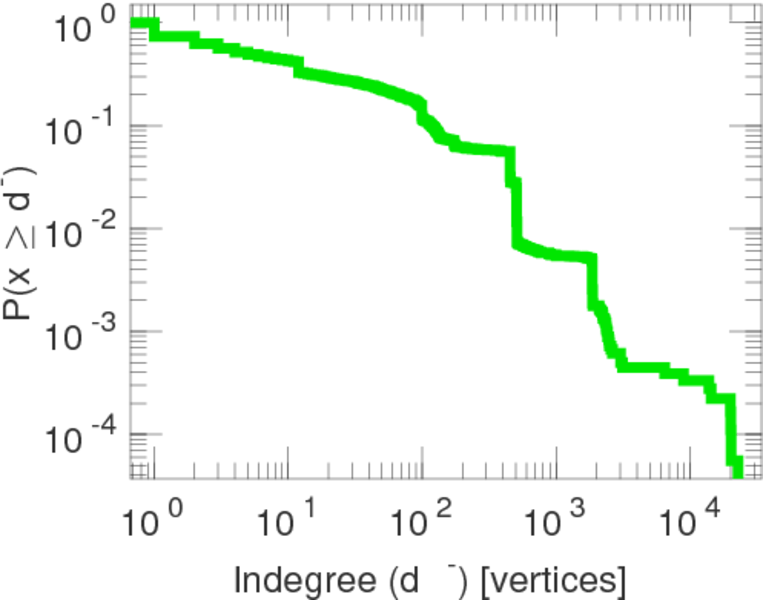
| Maximum indegree | d−max = | 22,888
|
| Average degree | d = | 53.810 7
|
| Fill | p = | 0.000 602 570
|
| Size of LCC | N = | 43,917
|
| Size of LSCC | Ns = | 14,525
|
| Relative size of LSCC | Nrs = | 0.325 301
|
| Diameter | δ = | 12
|
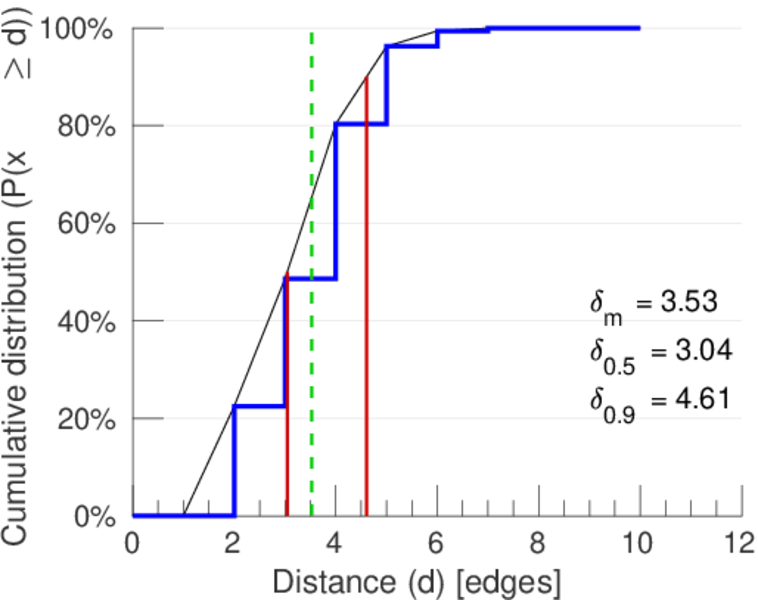
| 50-Percentile effective diameter | δ0.5 = | 3.044 50
|
| 90-Percentile effective diameter | δ0.9 = | 4.608 58
|
| Median distance | δM = | 4
|
| Mean distance | δm = | 3.529 64
|
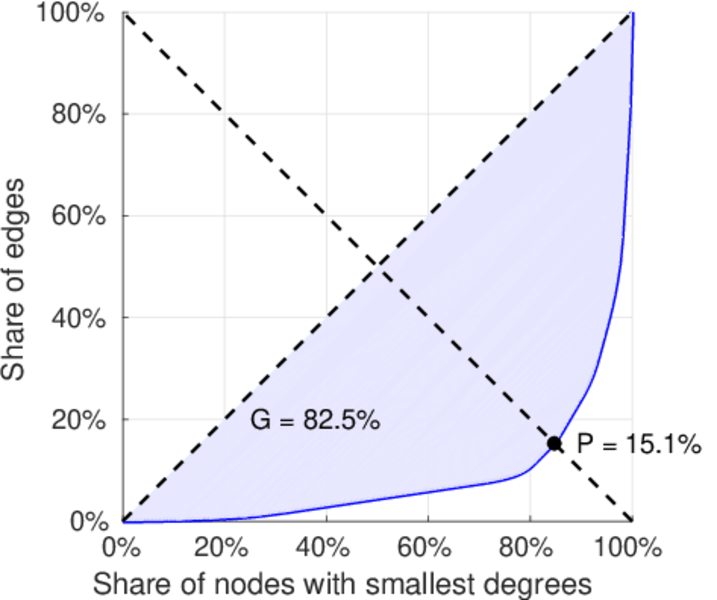
| Gini coefficient | G = | 0.825 050
|
| Balanced inequality ratio | P = | 0.151 351
|
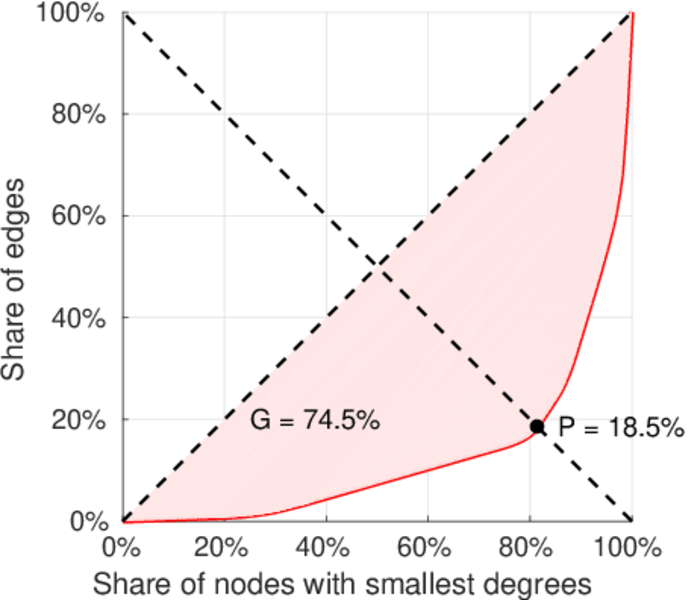
| Outdegree balanced inequality ratio | P+ = | 0.184 749
|
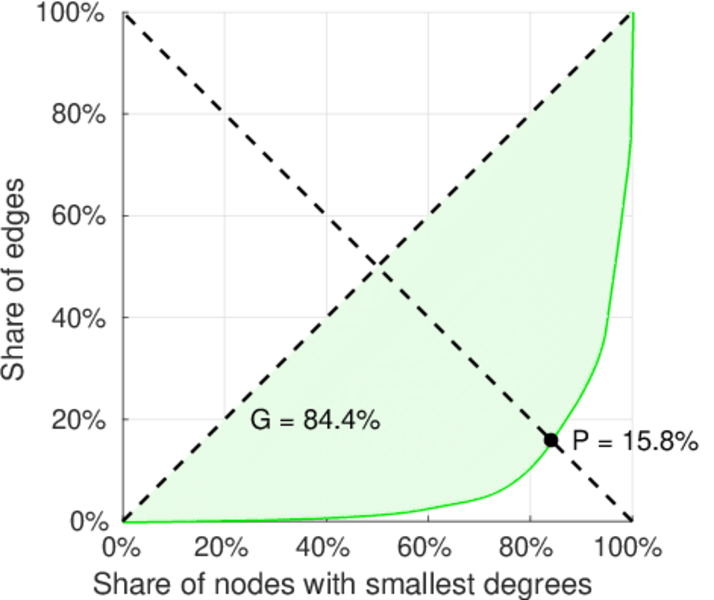
| Indegree balanced inequality ratio | P− = | 0.157 796
|
| Relative edge distribution entropy | Her = | 0.830 394
|
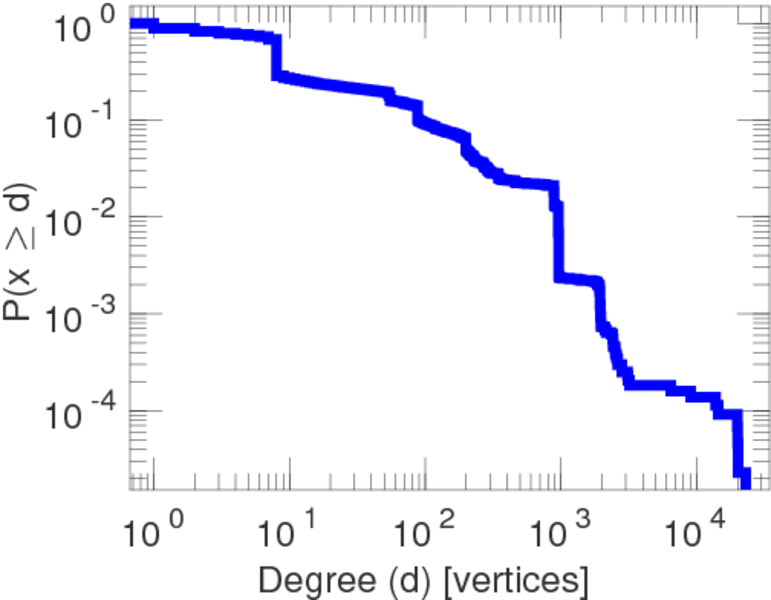
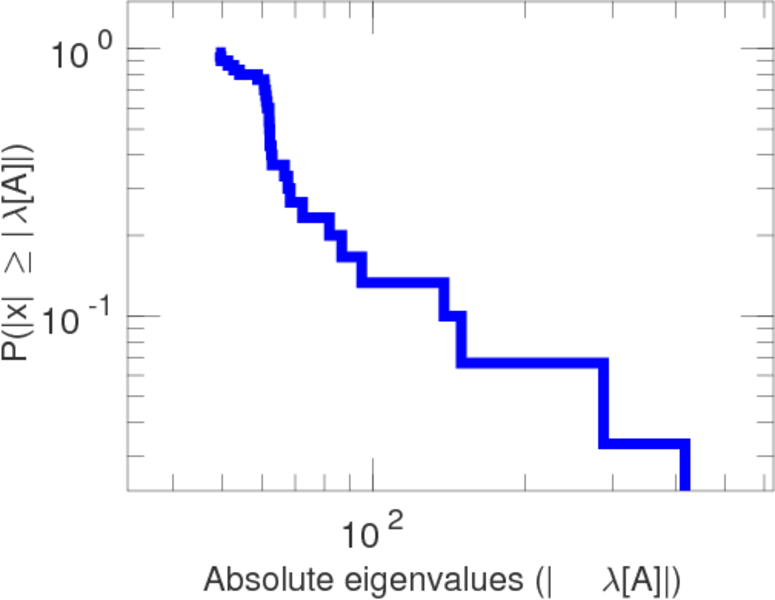
| Power law exponent | γ = | 1.447 59
|
| Tail power law exponent | γt = | 1.841 00
|
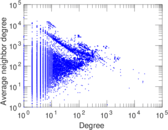
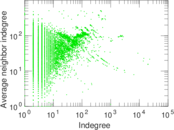
| Degree assortativity | ρ = | −0.122 277
|
| Degree assortativity p-value | pρ = | 0.000 00
|
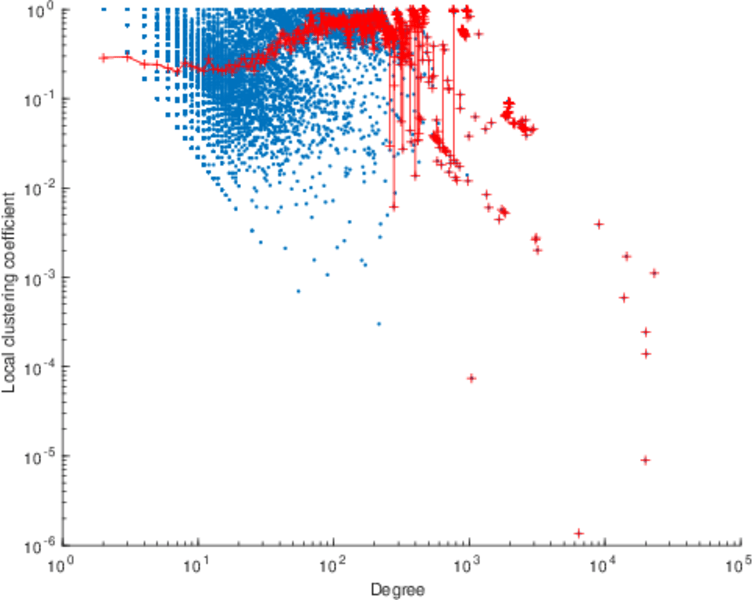
| Clustering coefficient | c = | 0.089 815 8
|
| Directed clustering coefficient | c± = | 0.825 873
|
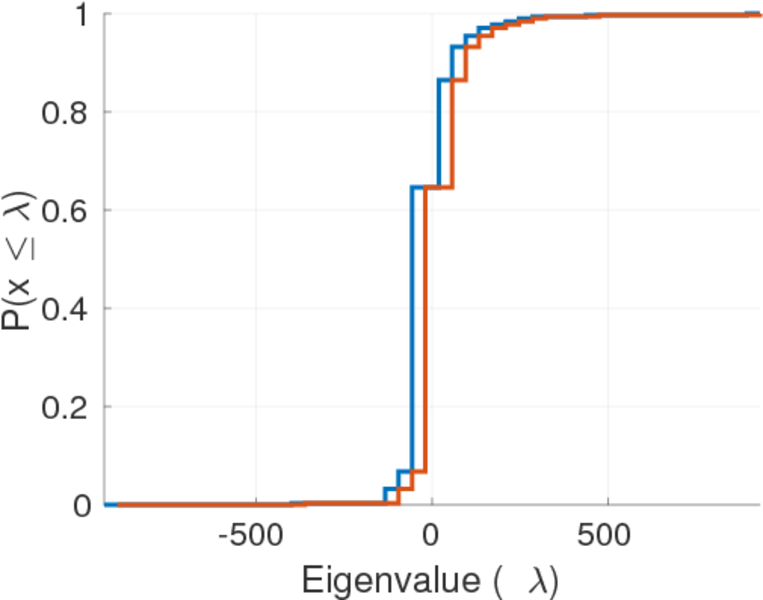
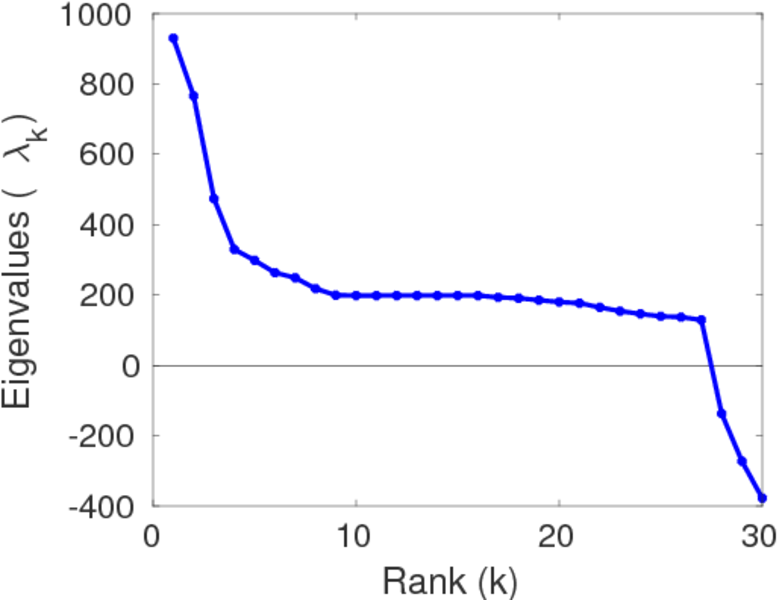
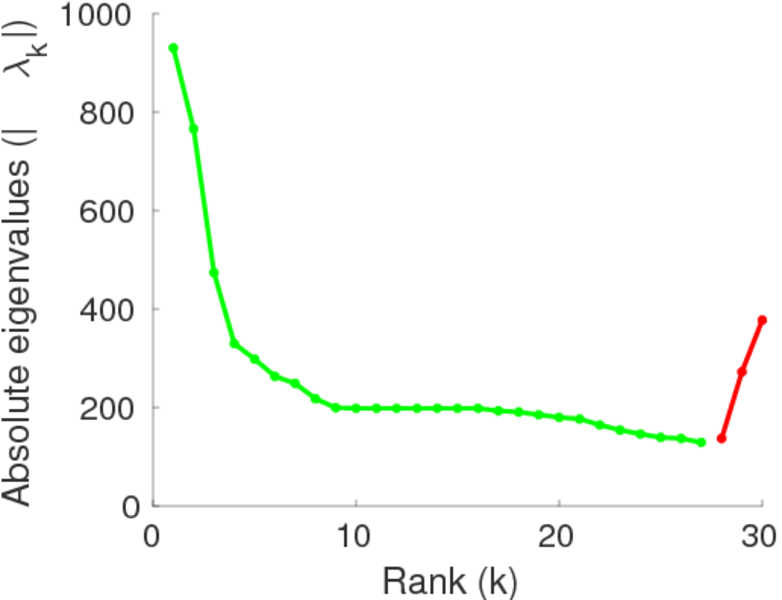
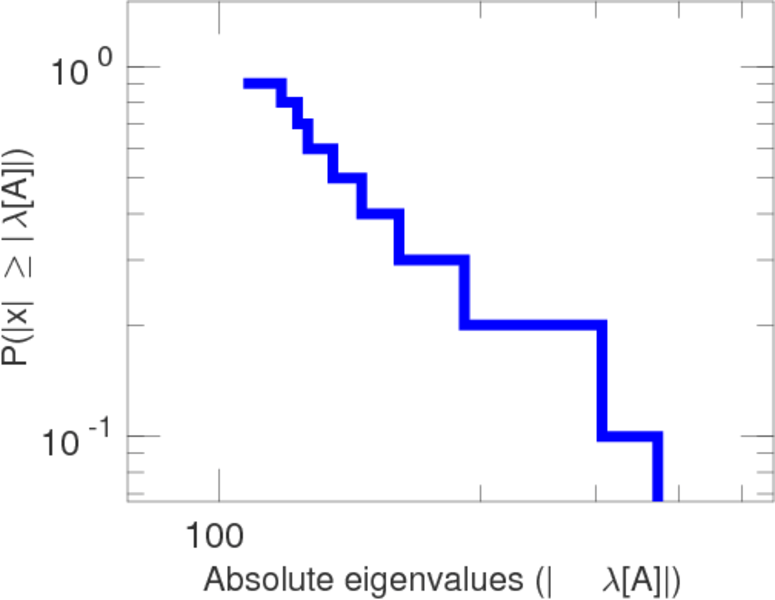
| Spectral norm | α = | 930.171
|
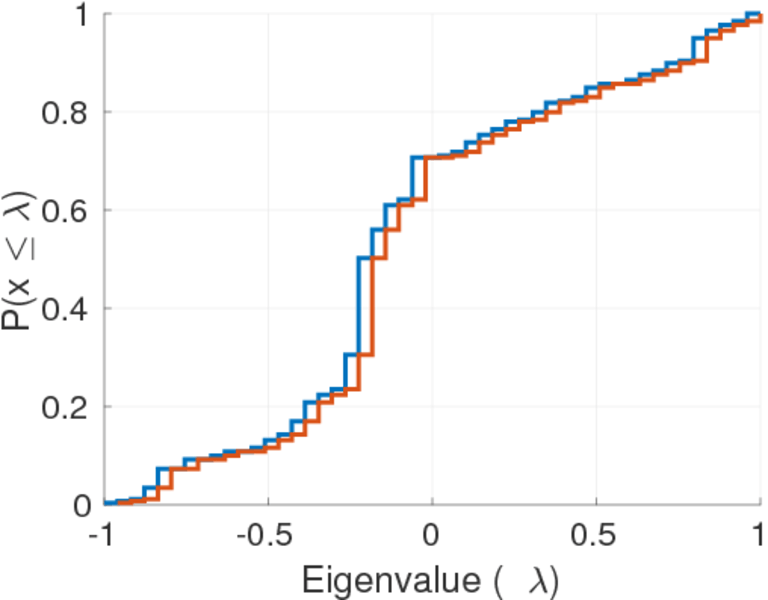
| Algebraic connectivity | a = | 0.017 050 6
|
| Reciprocity | y = | 0.545 237
|
| Non-bipartivity | bA = | 0.589 048
|
| Normalized non-bipartivity | bN = | 0.032 561 5
|
| Spectral bipartite frustration | bK = | 0.000 399 990
|
| Controllability | C = | 28,868
|
| Relative controllability | Cr = | 0.646 525
|
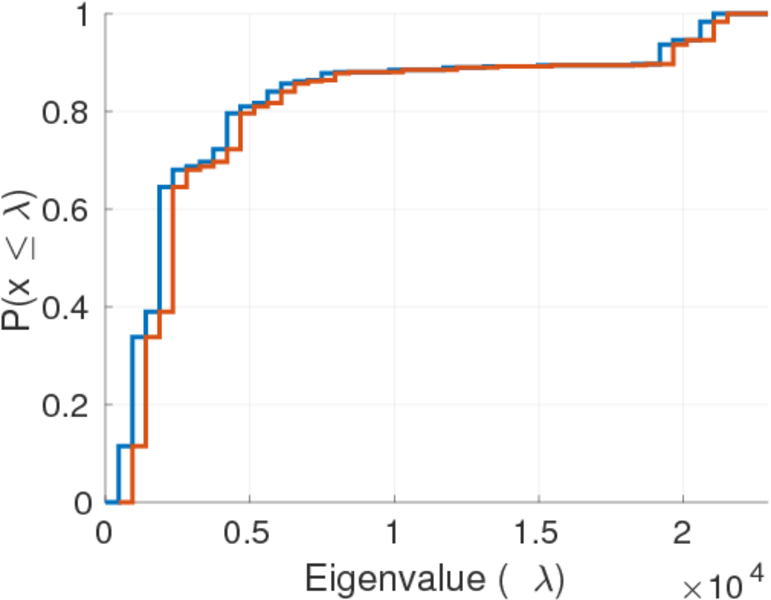
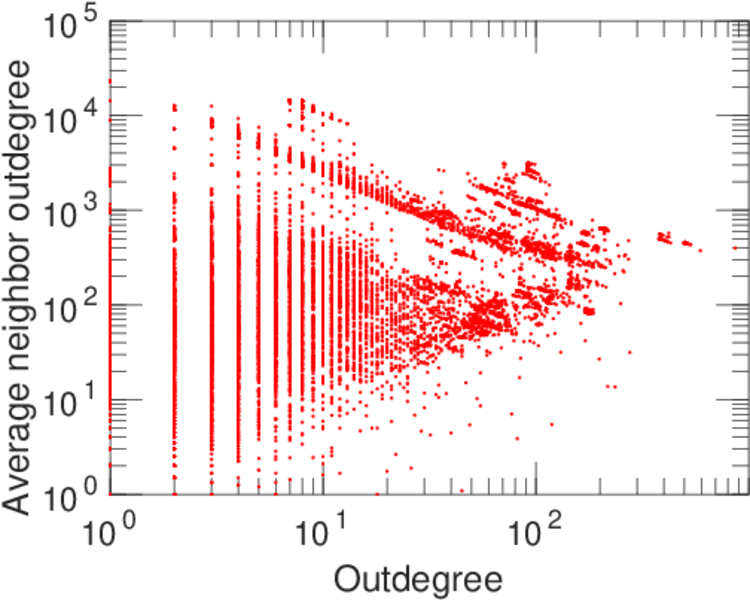
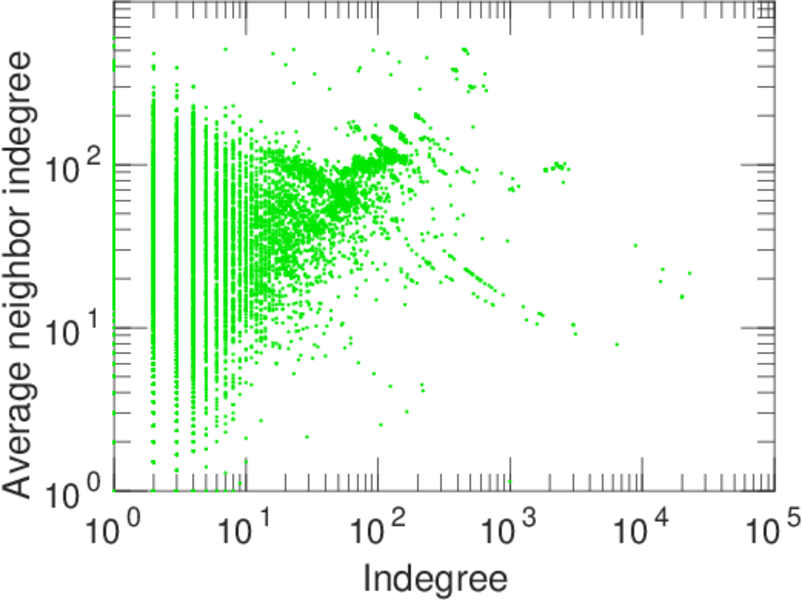
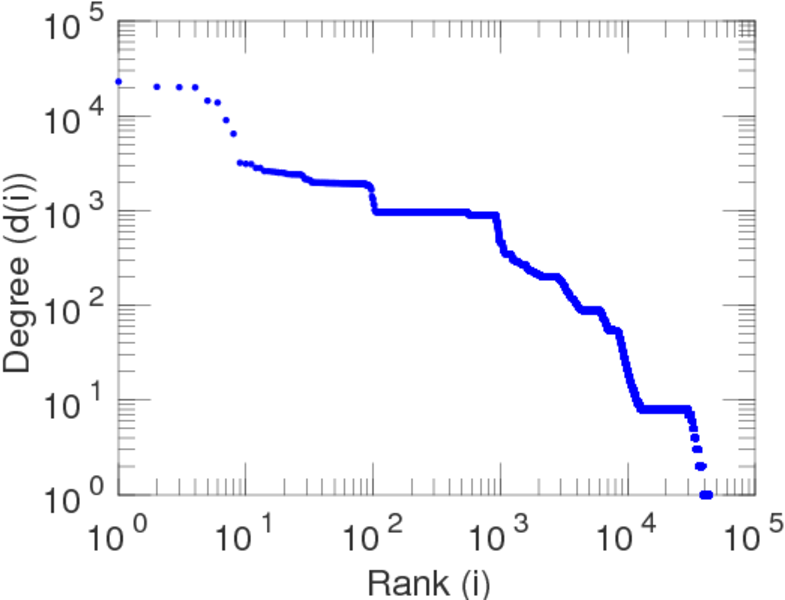
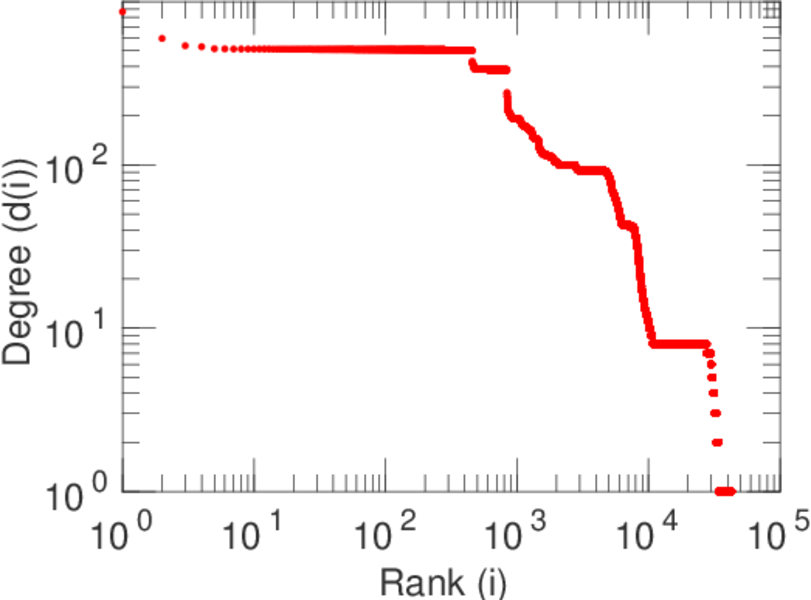
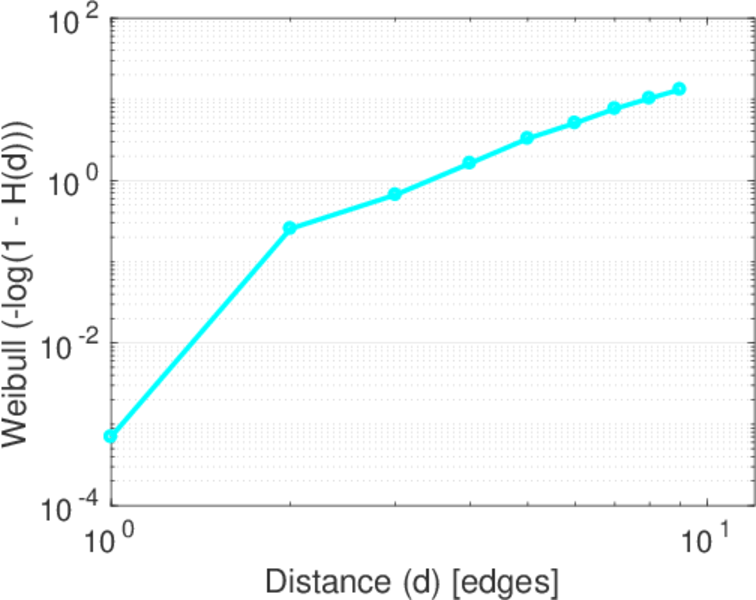
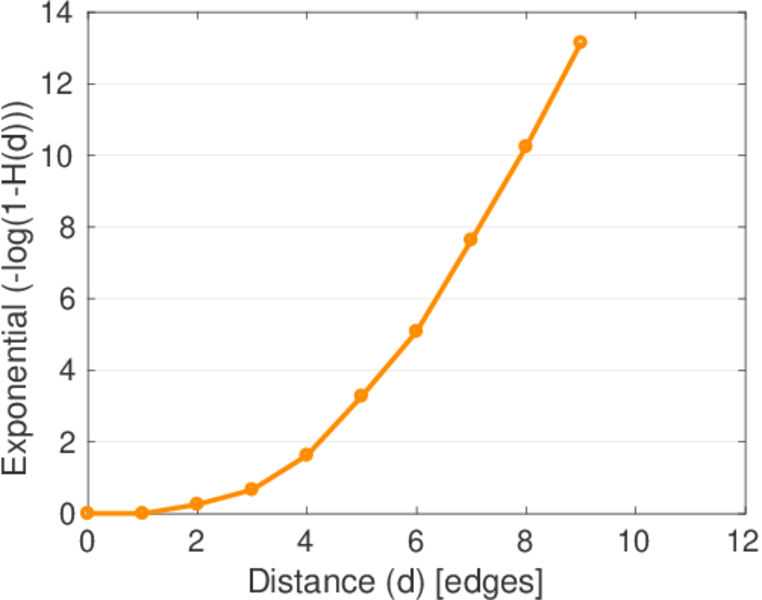
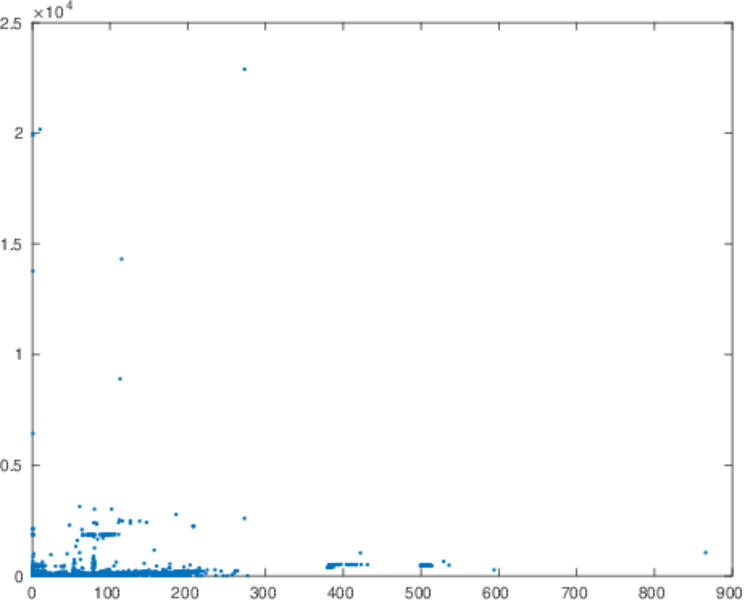
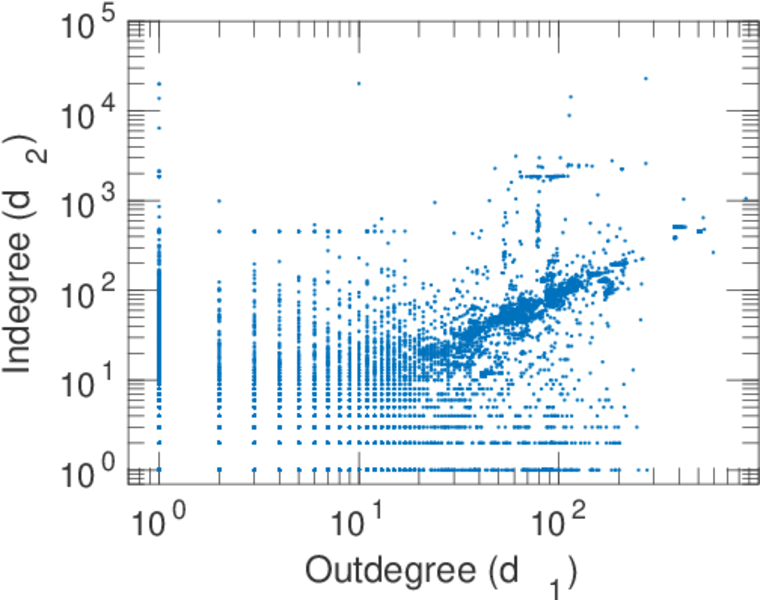
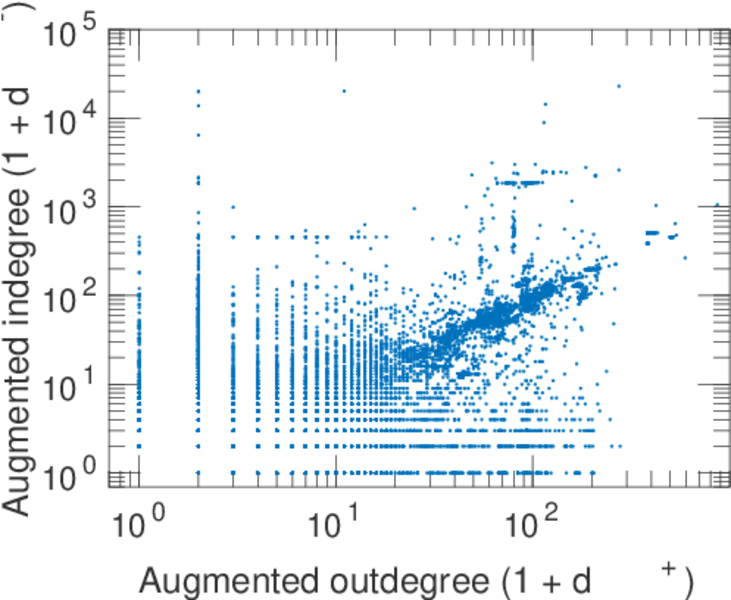
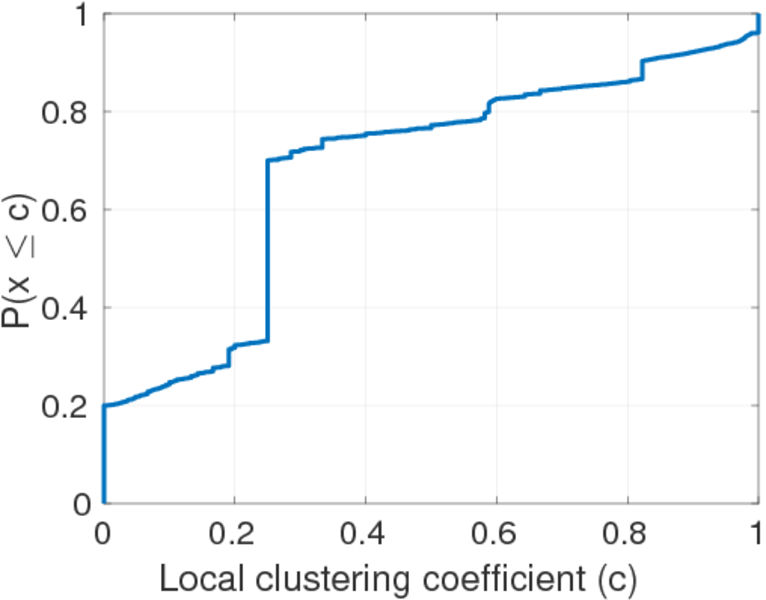
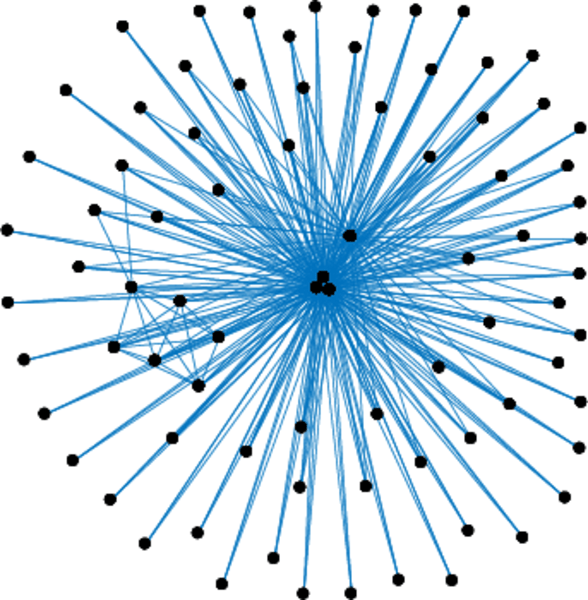
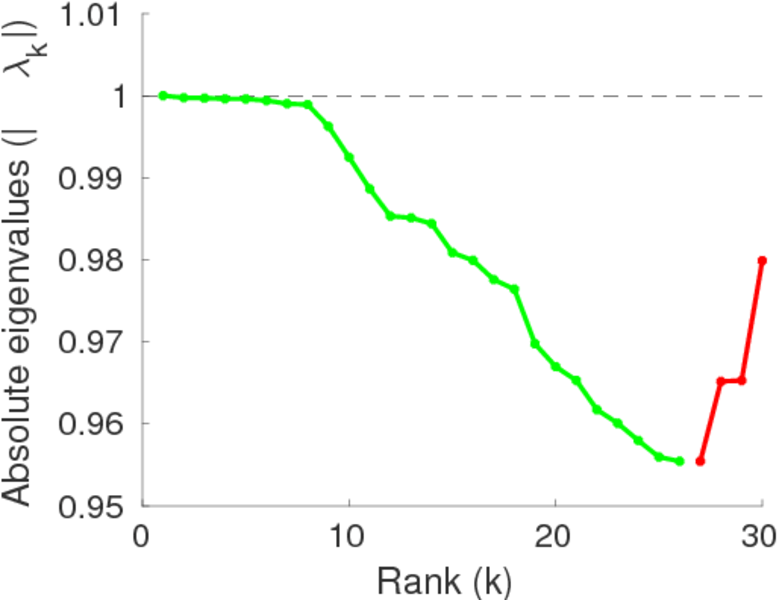
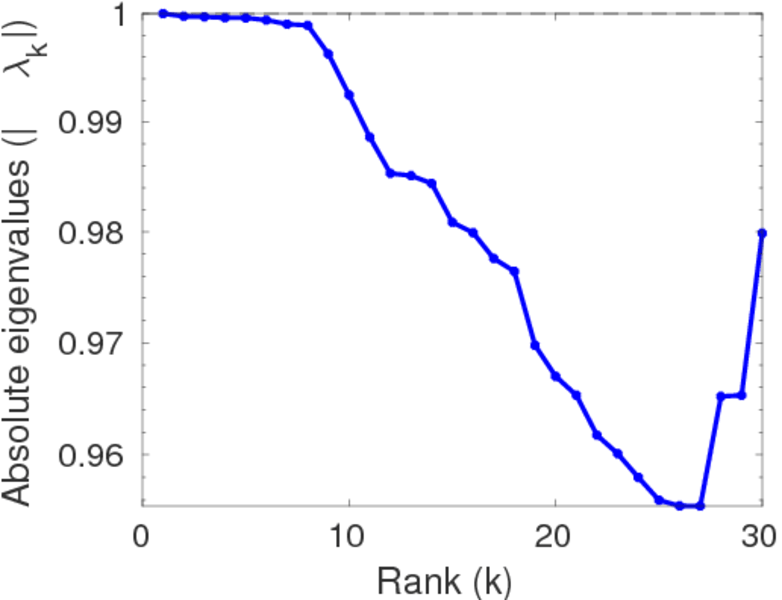
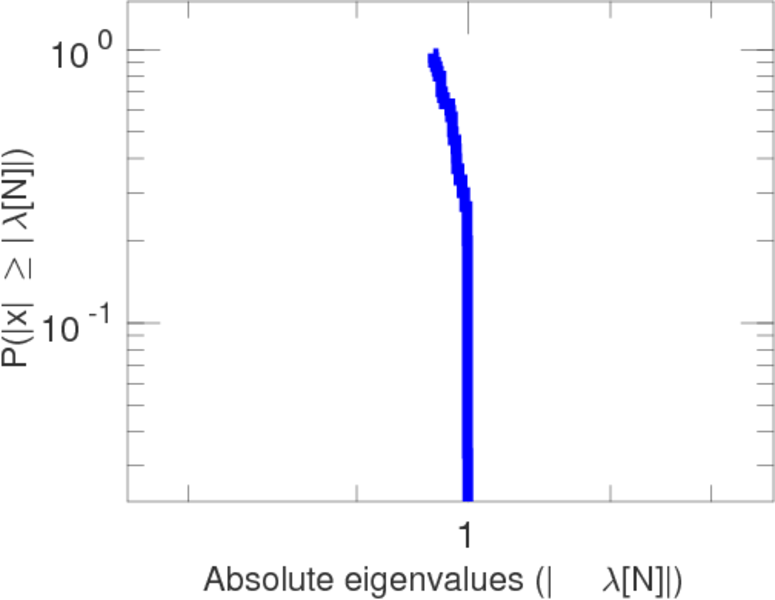
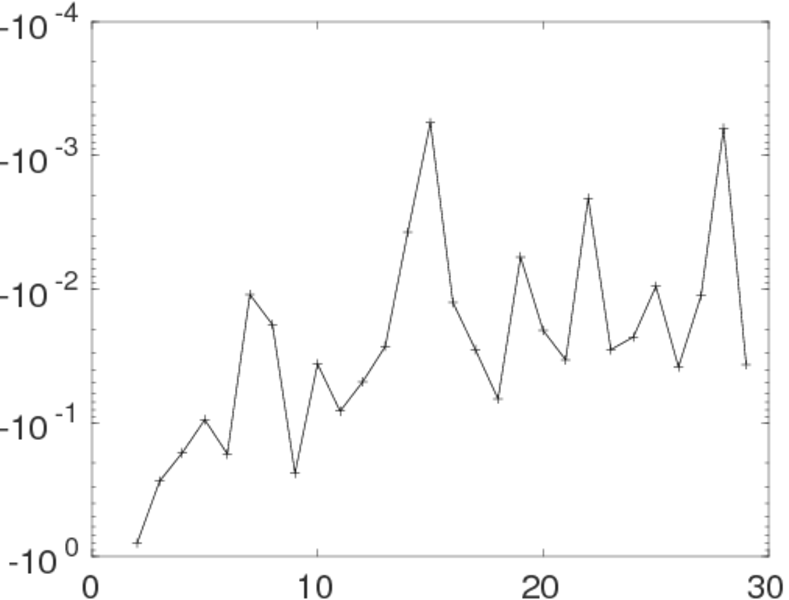
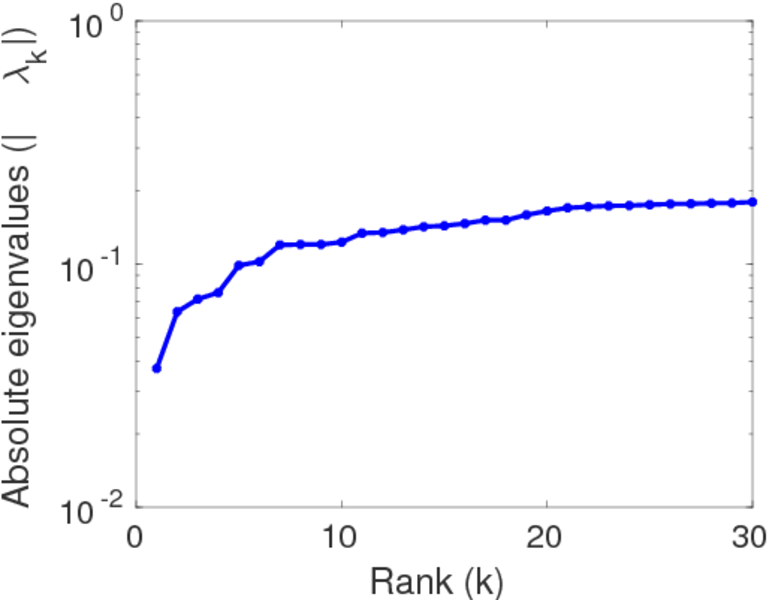
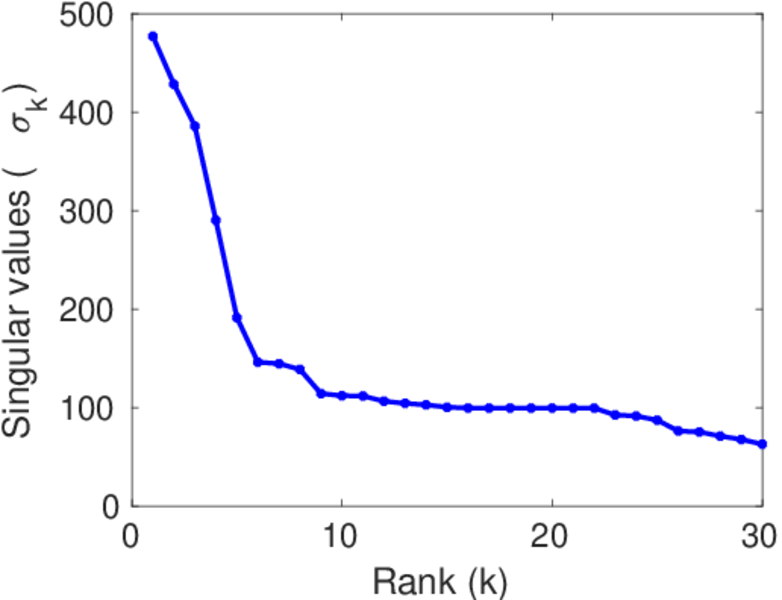
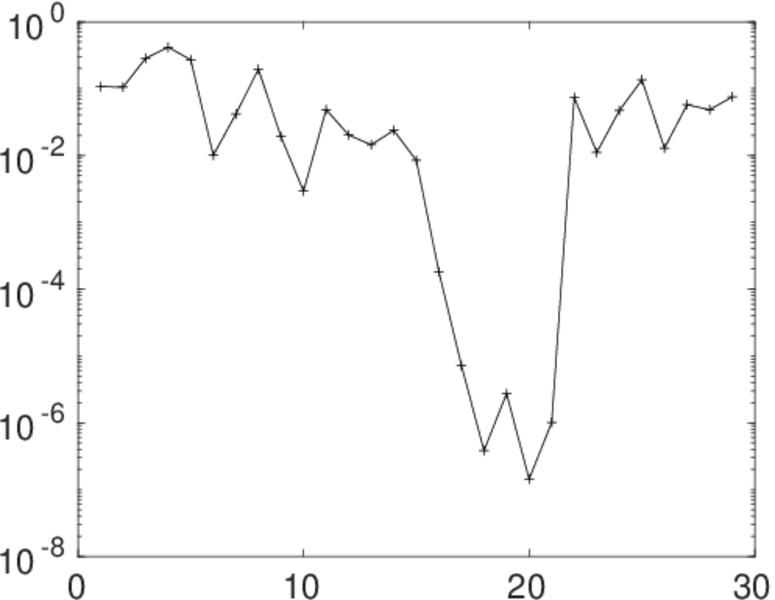
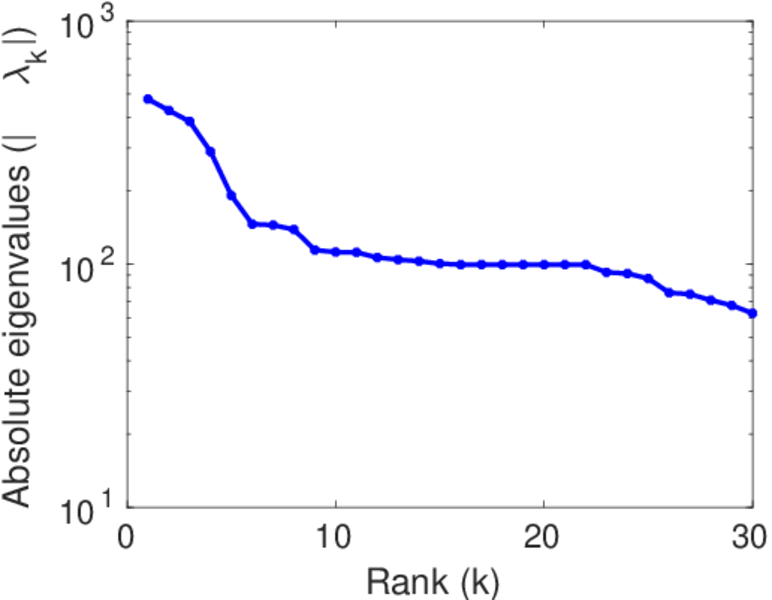
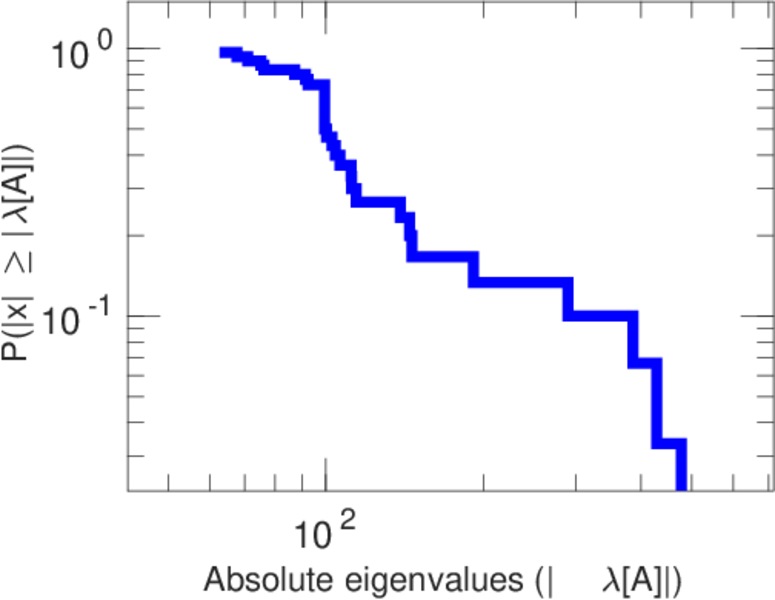
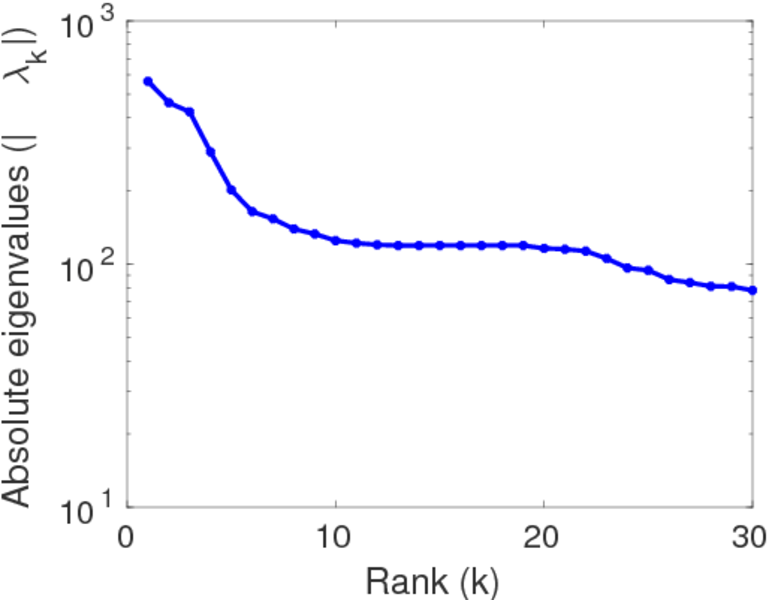
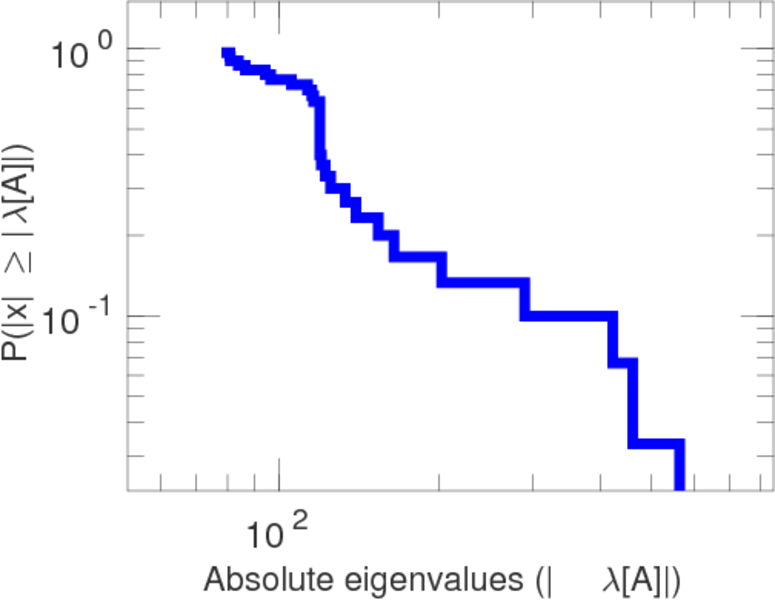
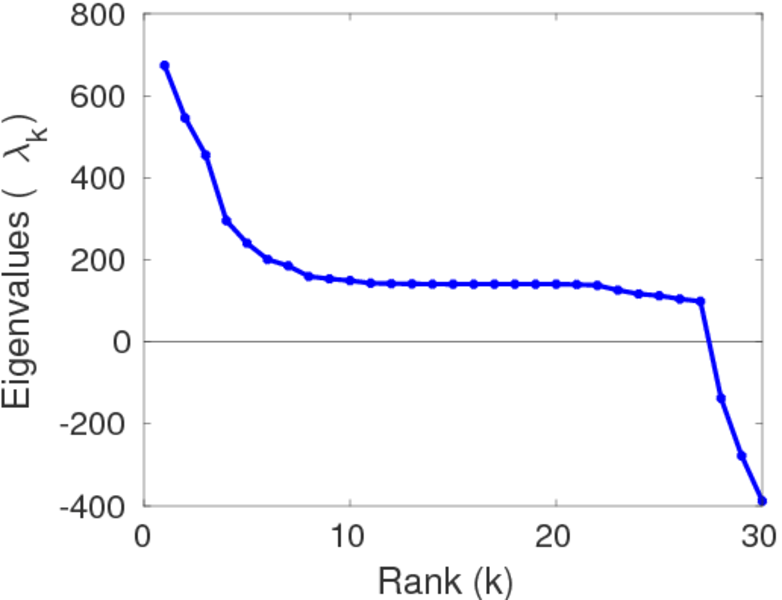
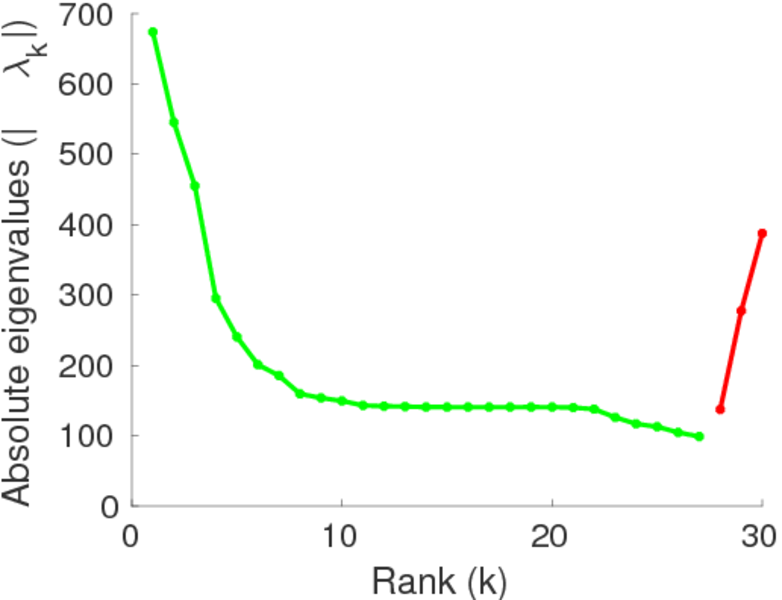
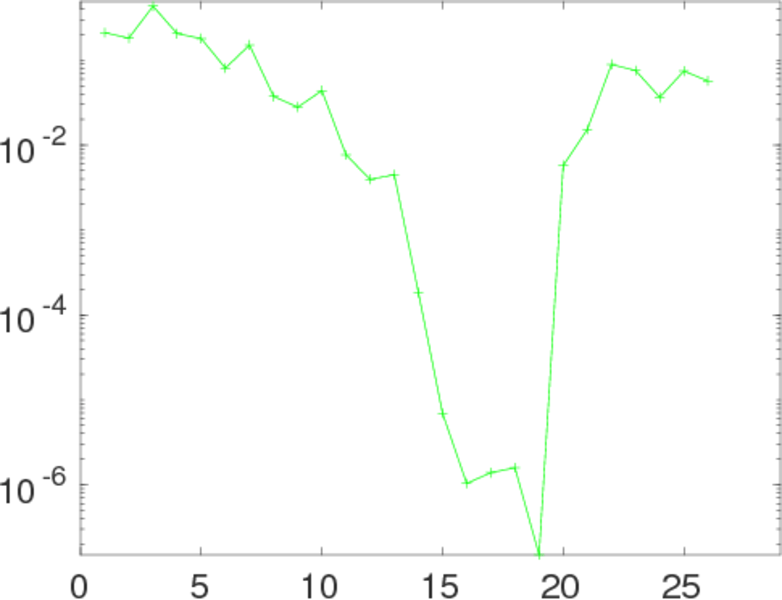
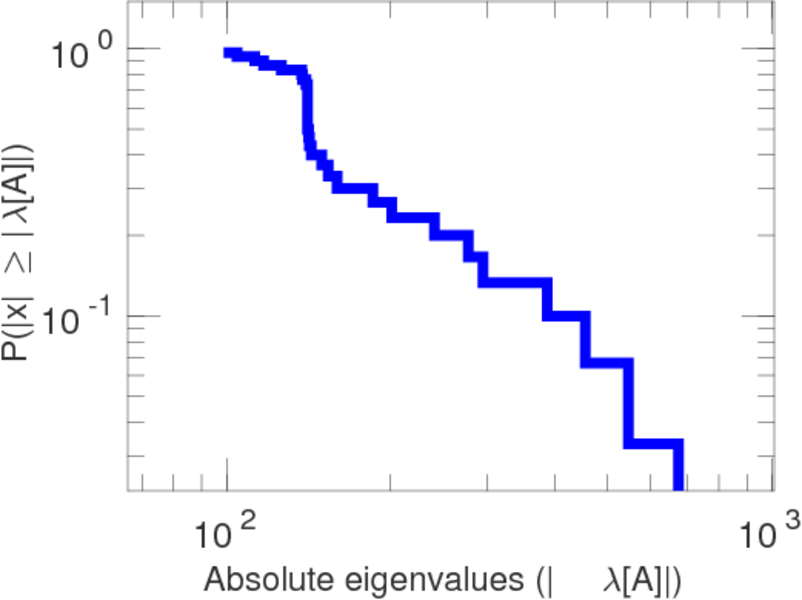
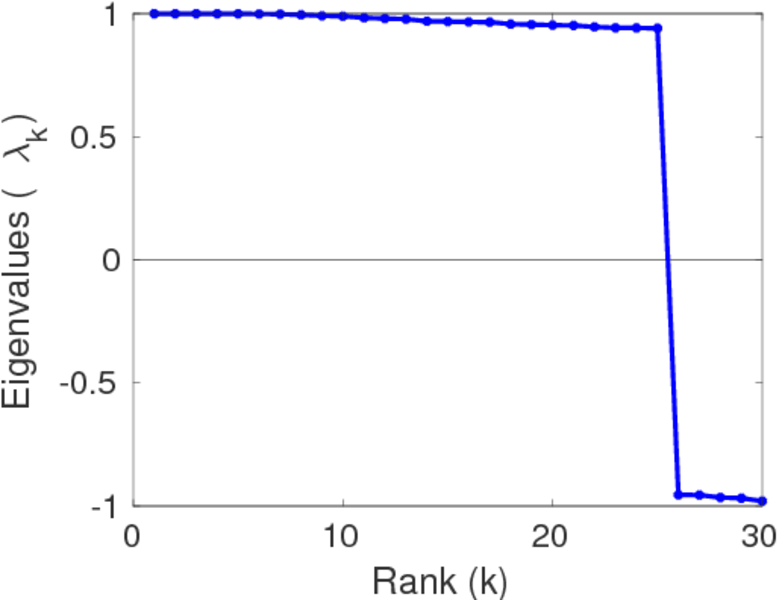
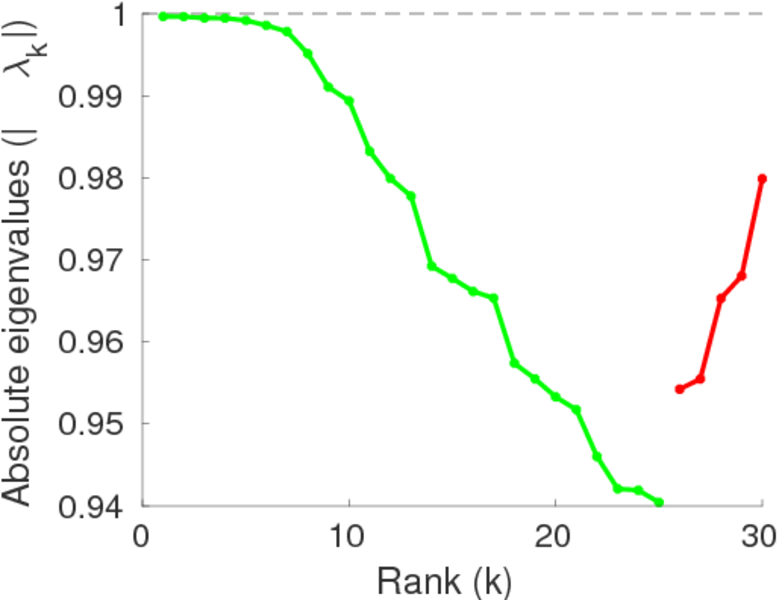
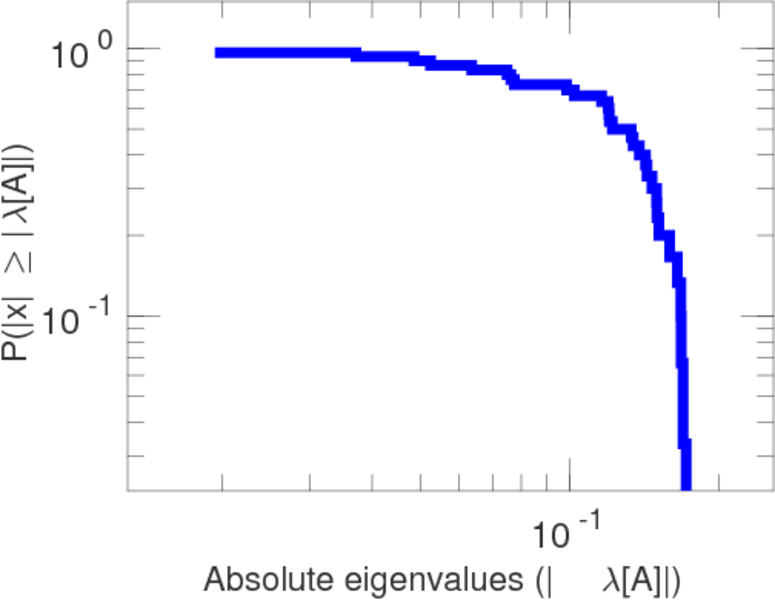
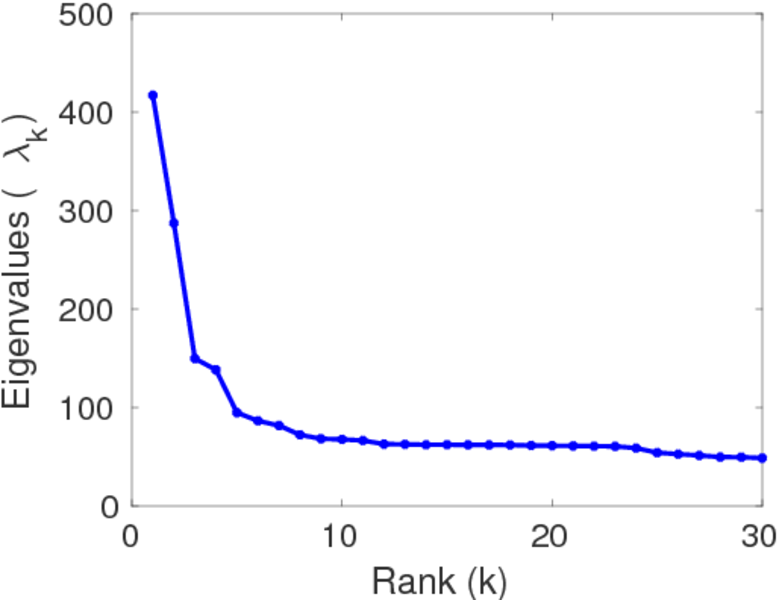
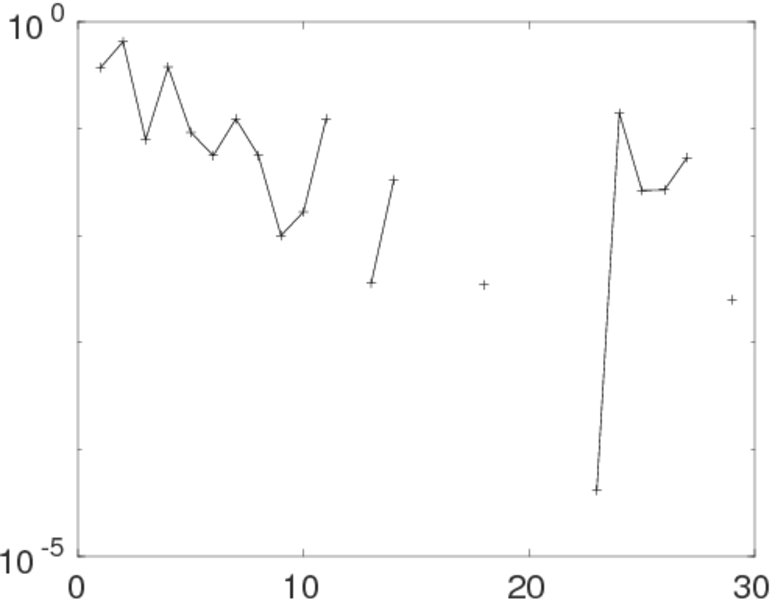
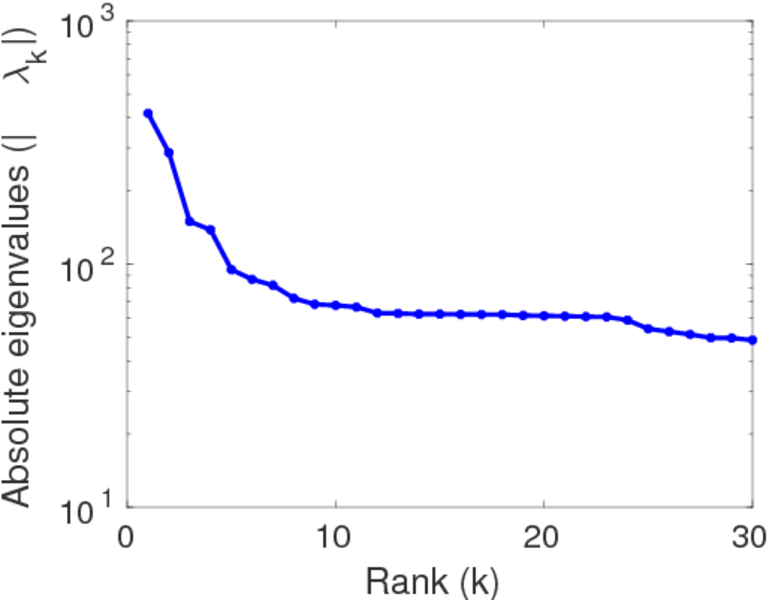
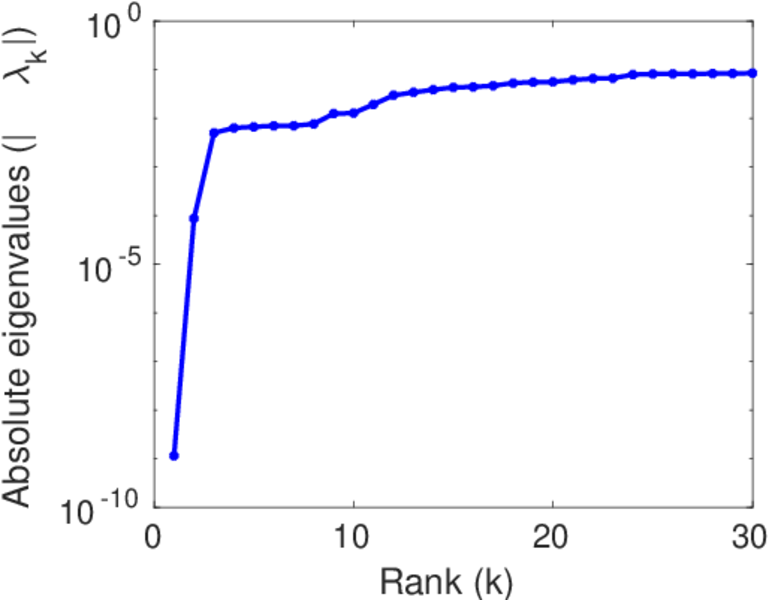
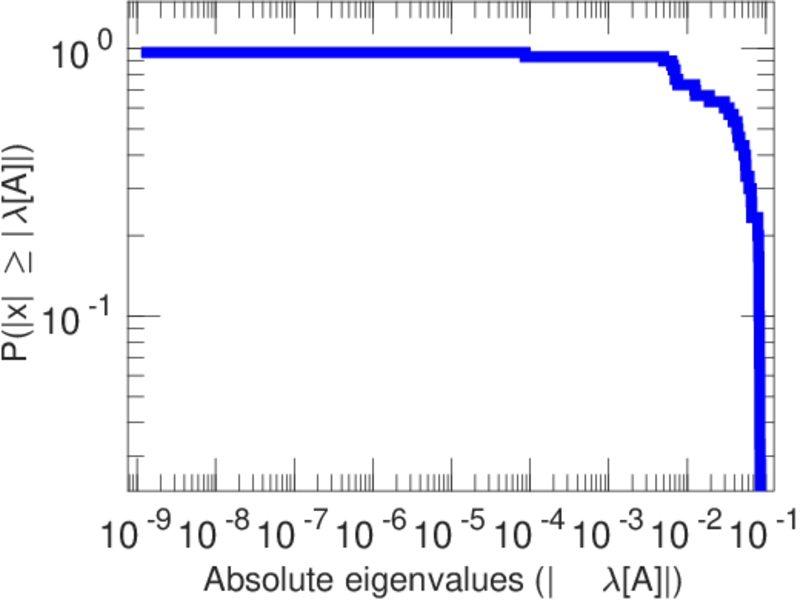
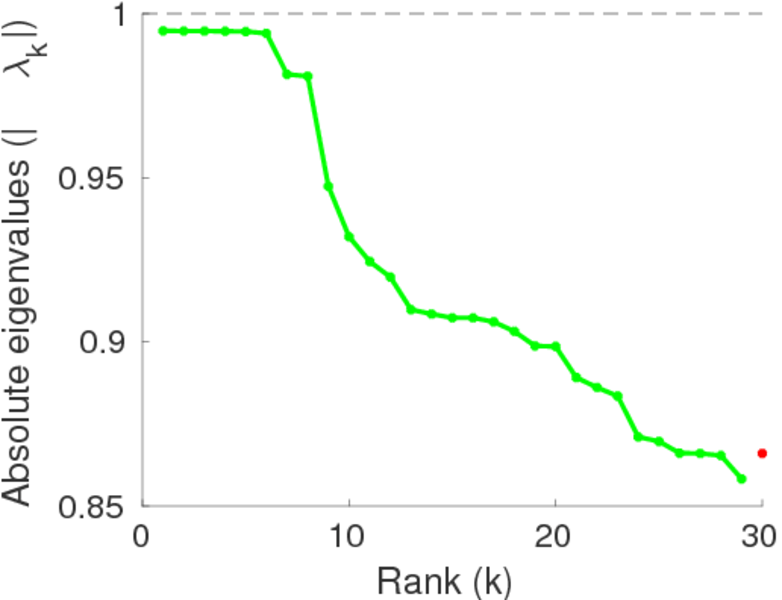
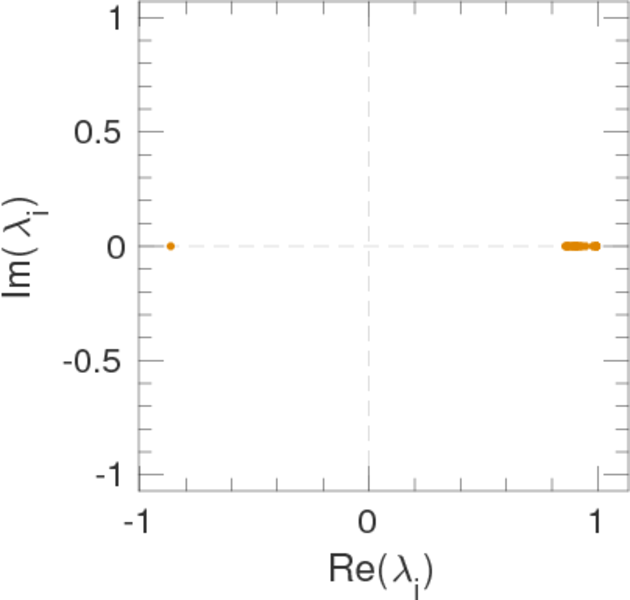
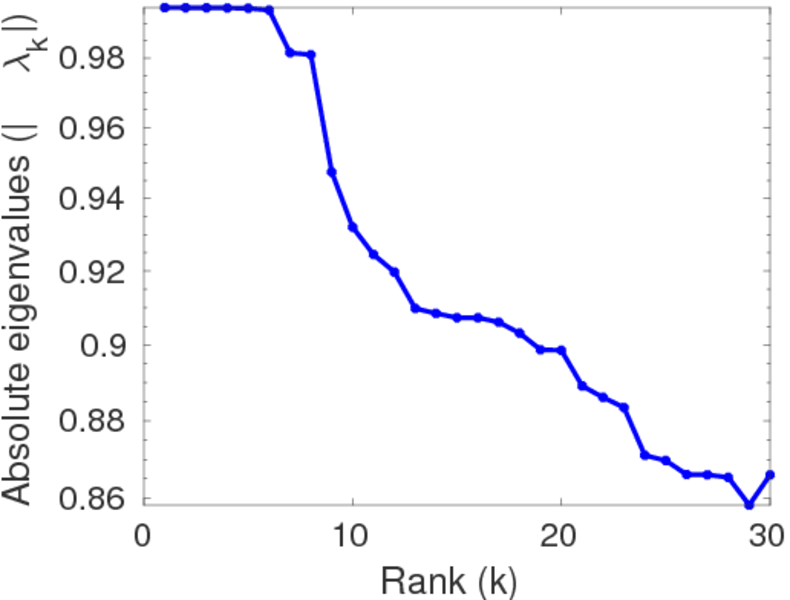
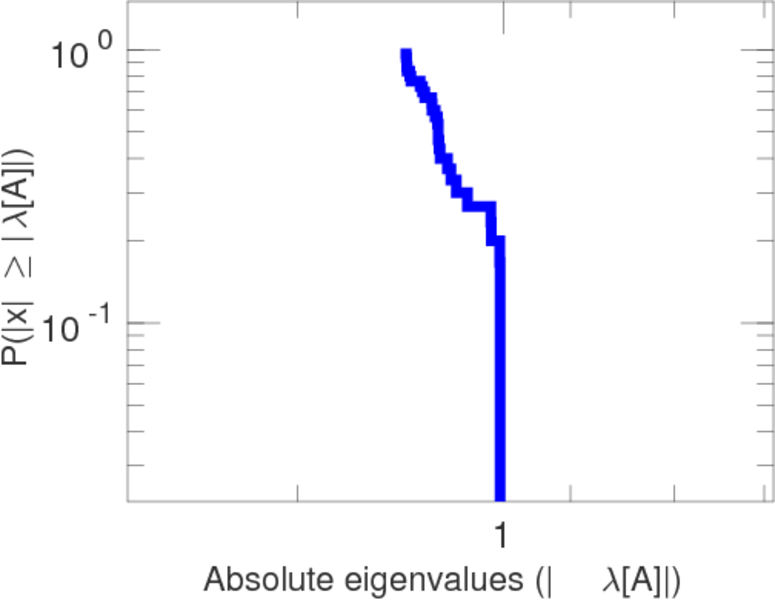
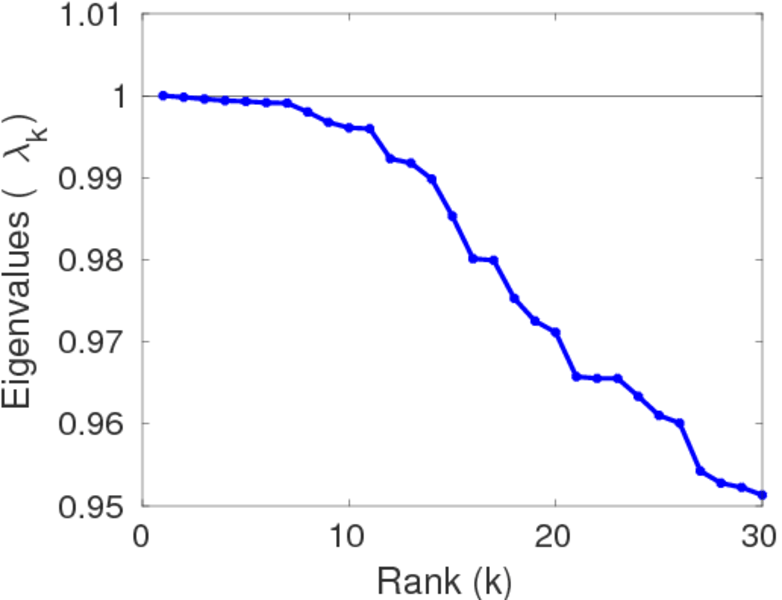
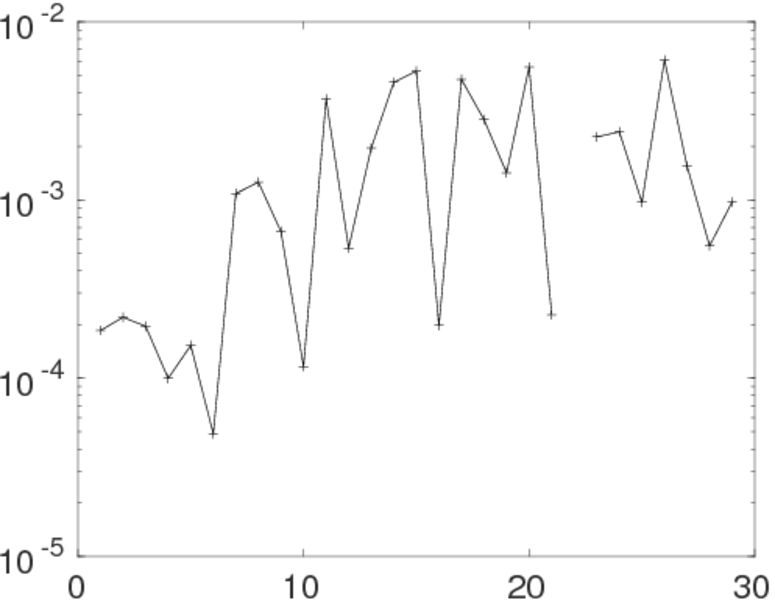
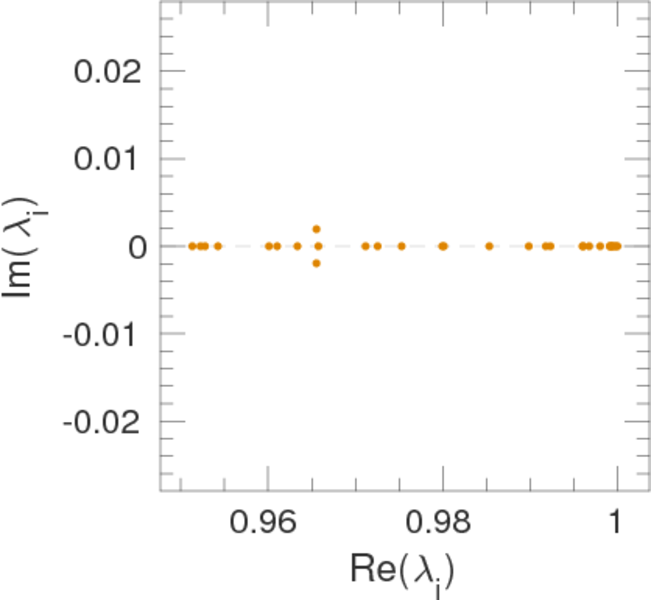
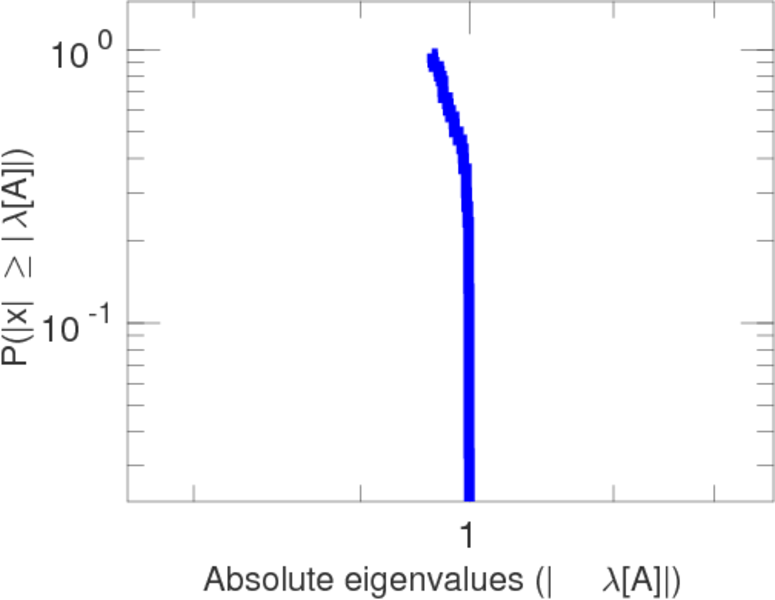
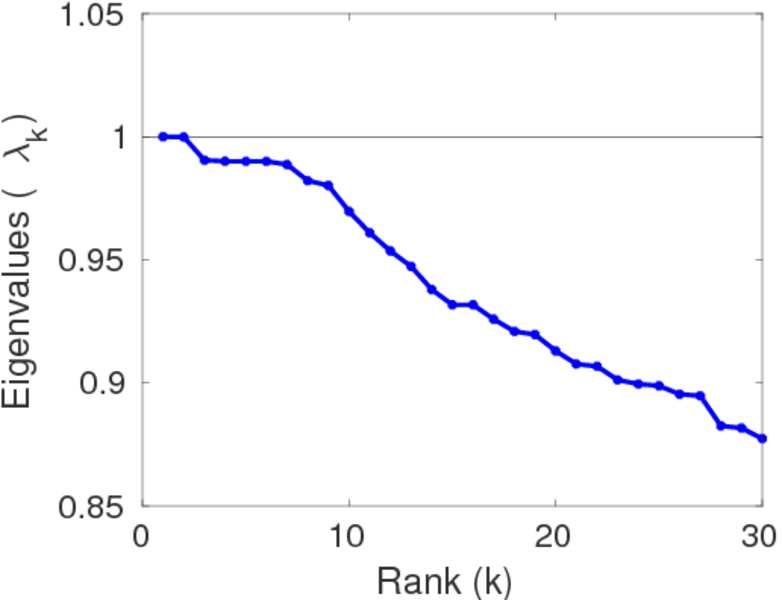
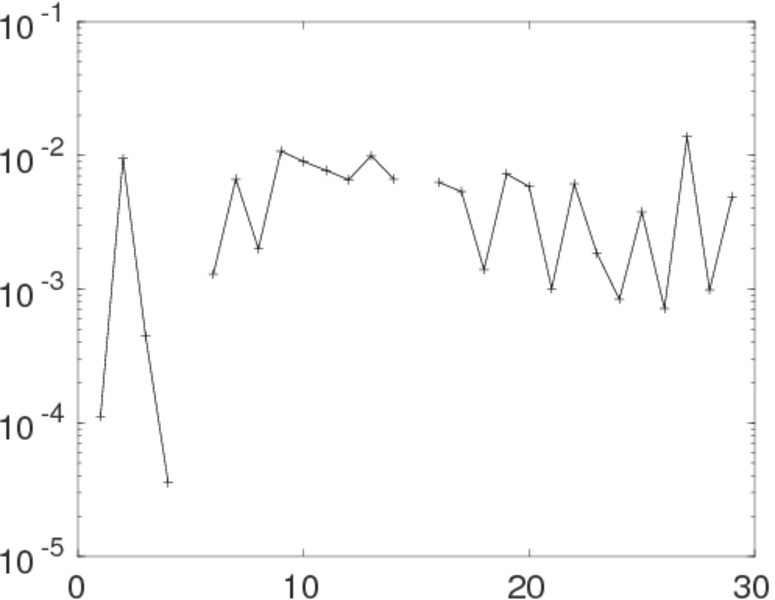
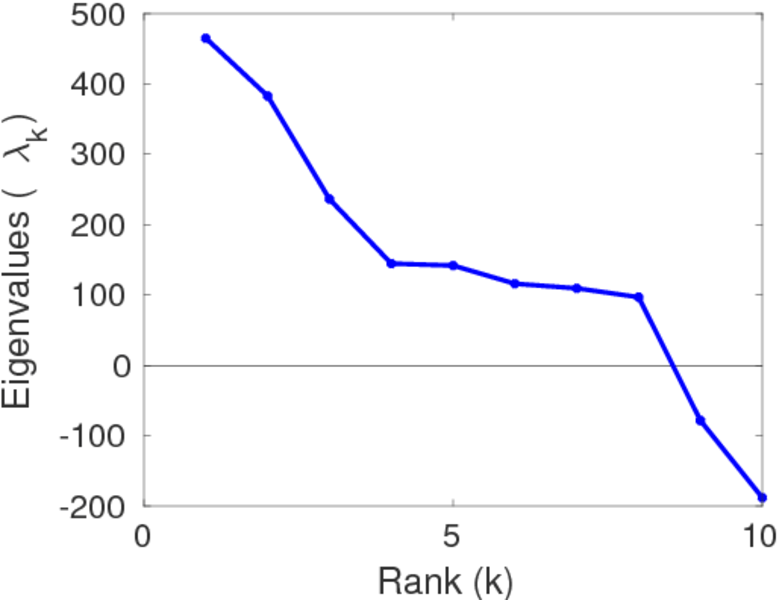
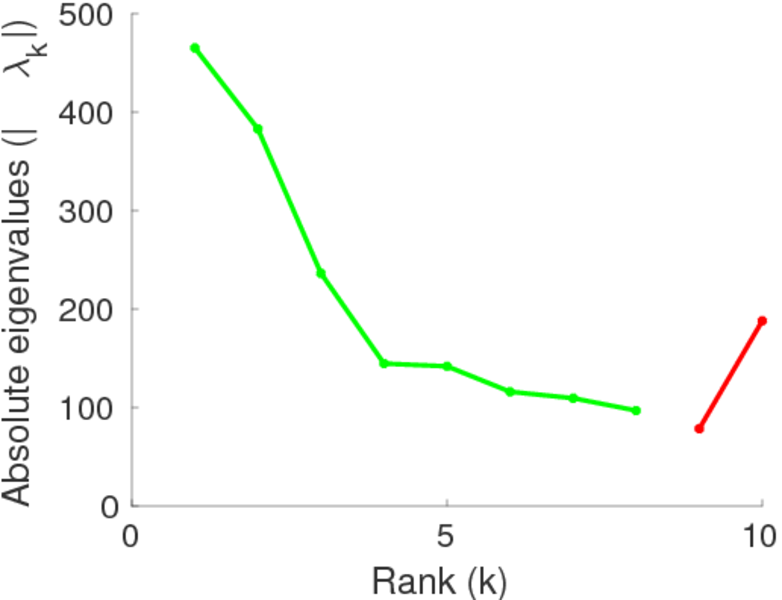
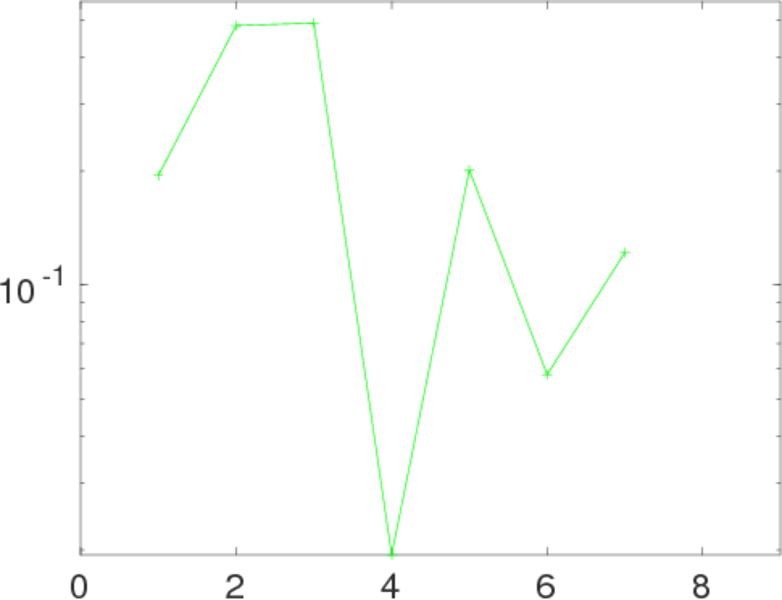
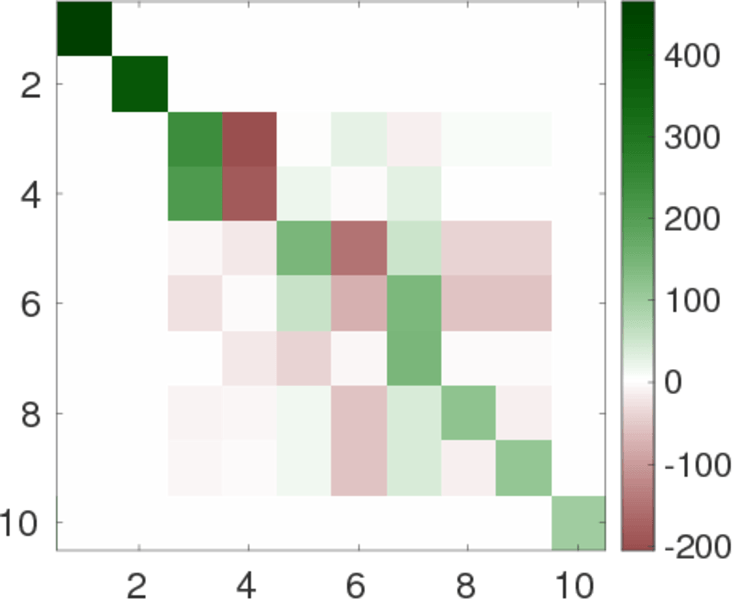
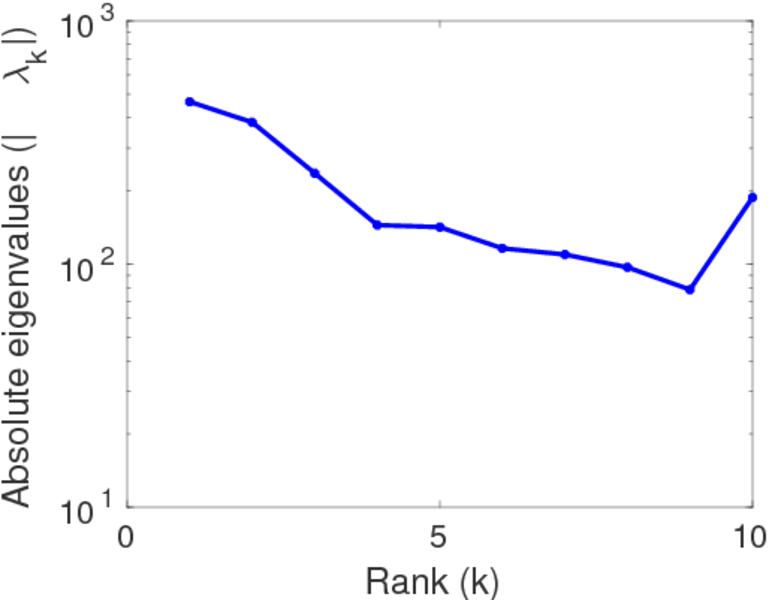
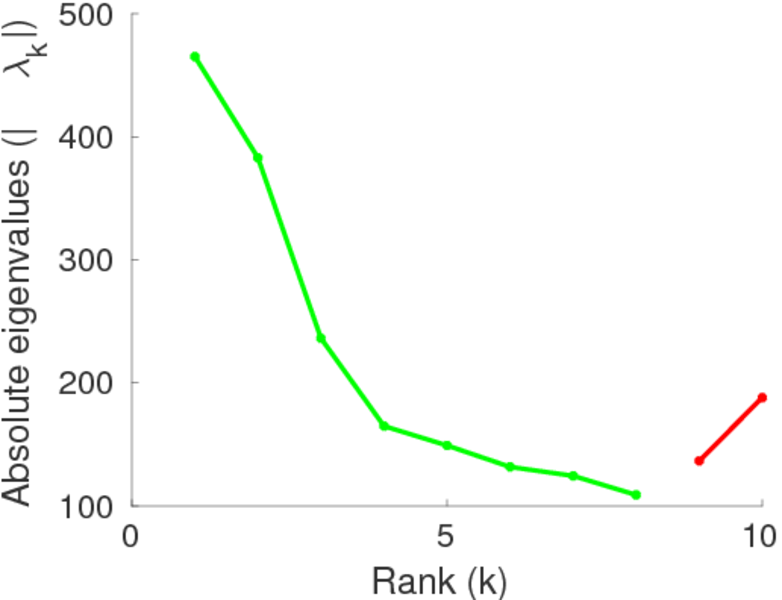
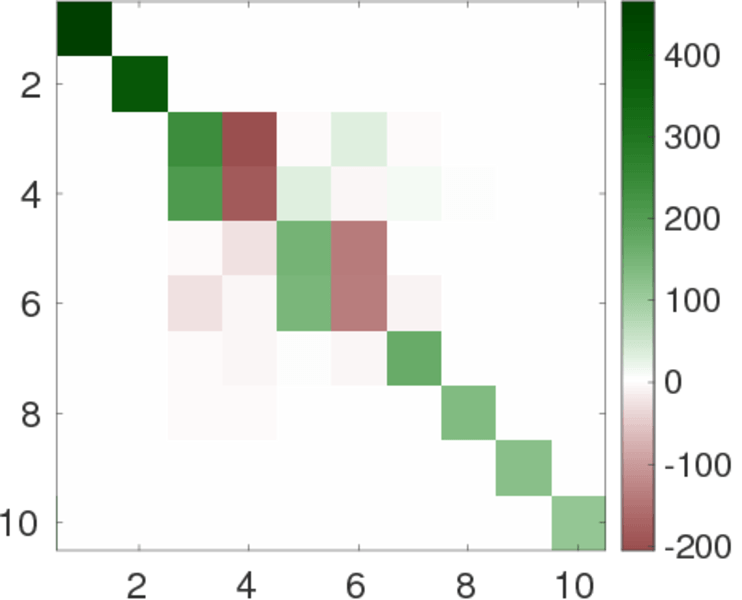
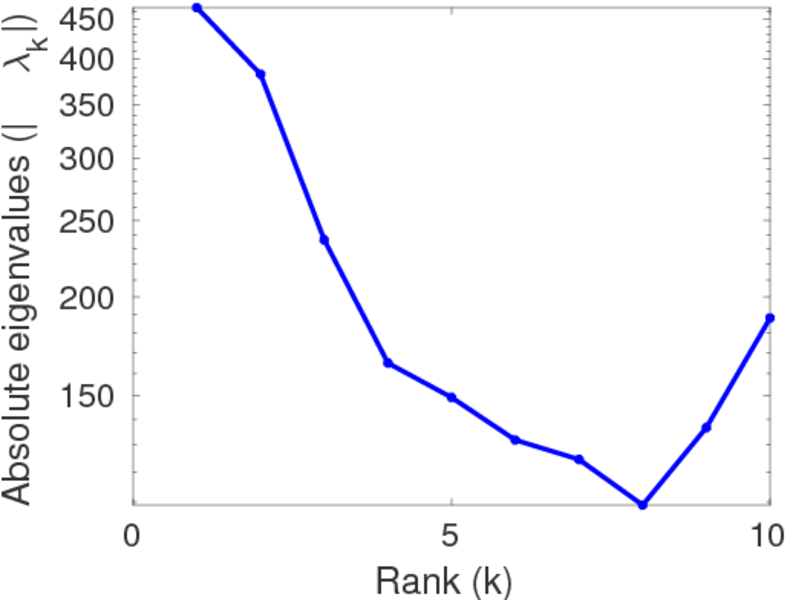
Plots


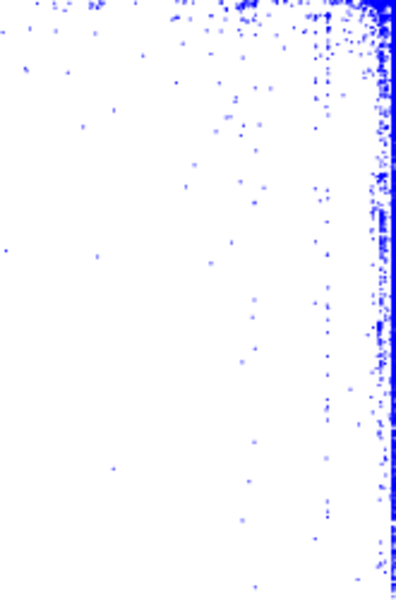
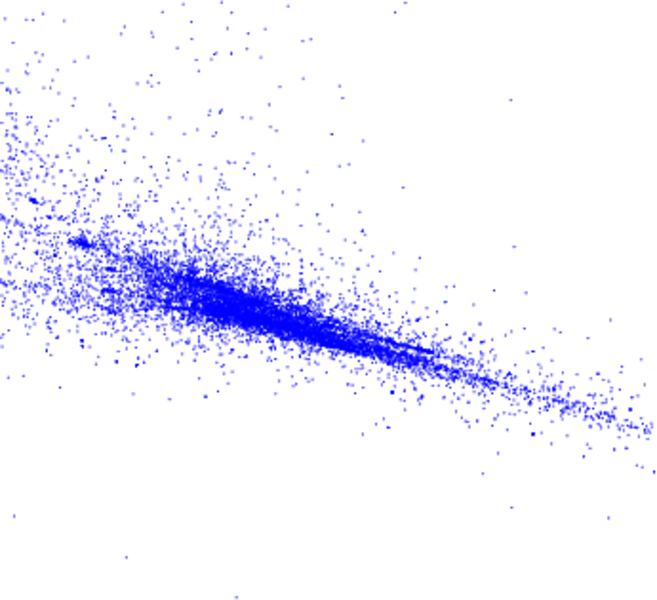
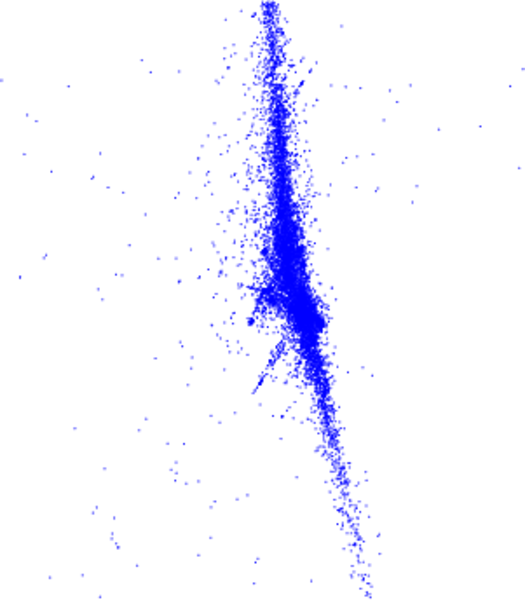
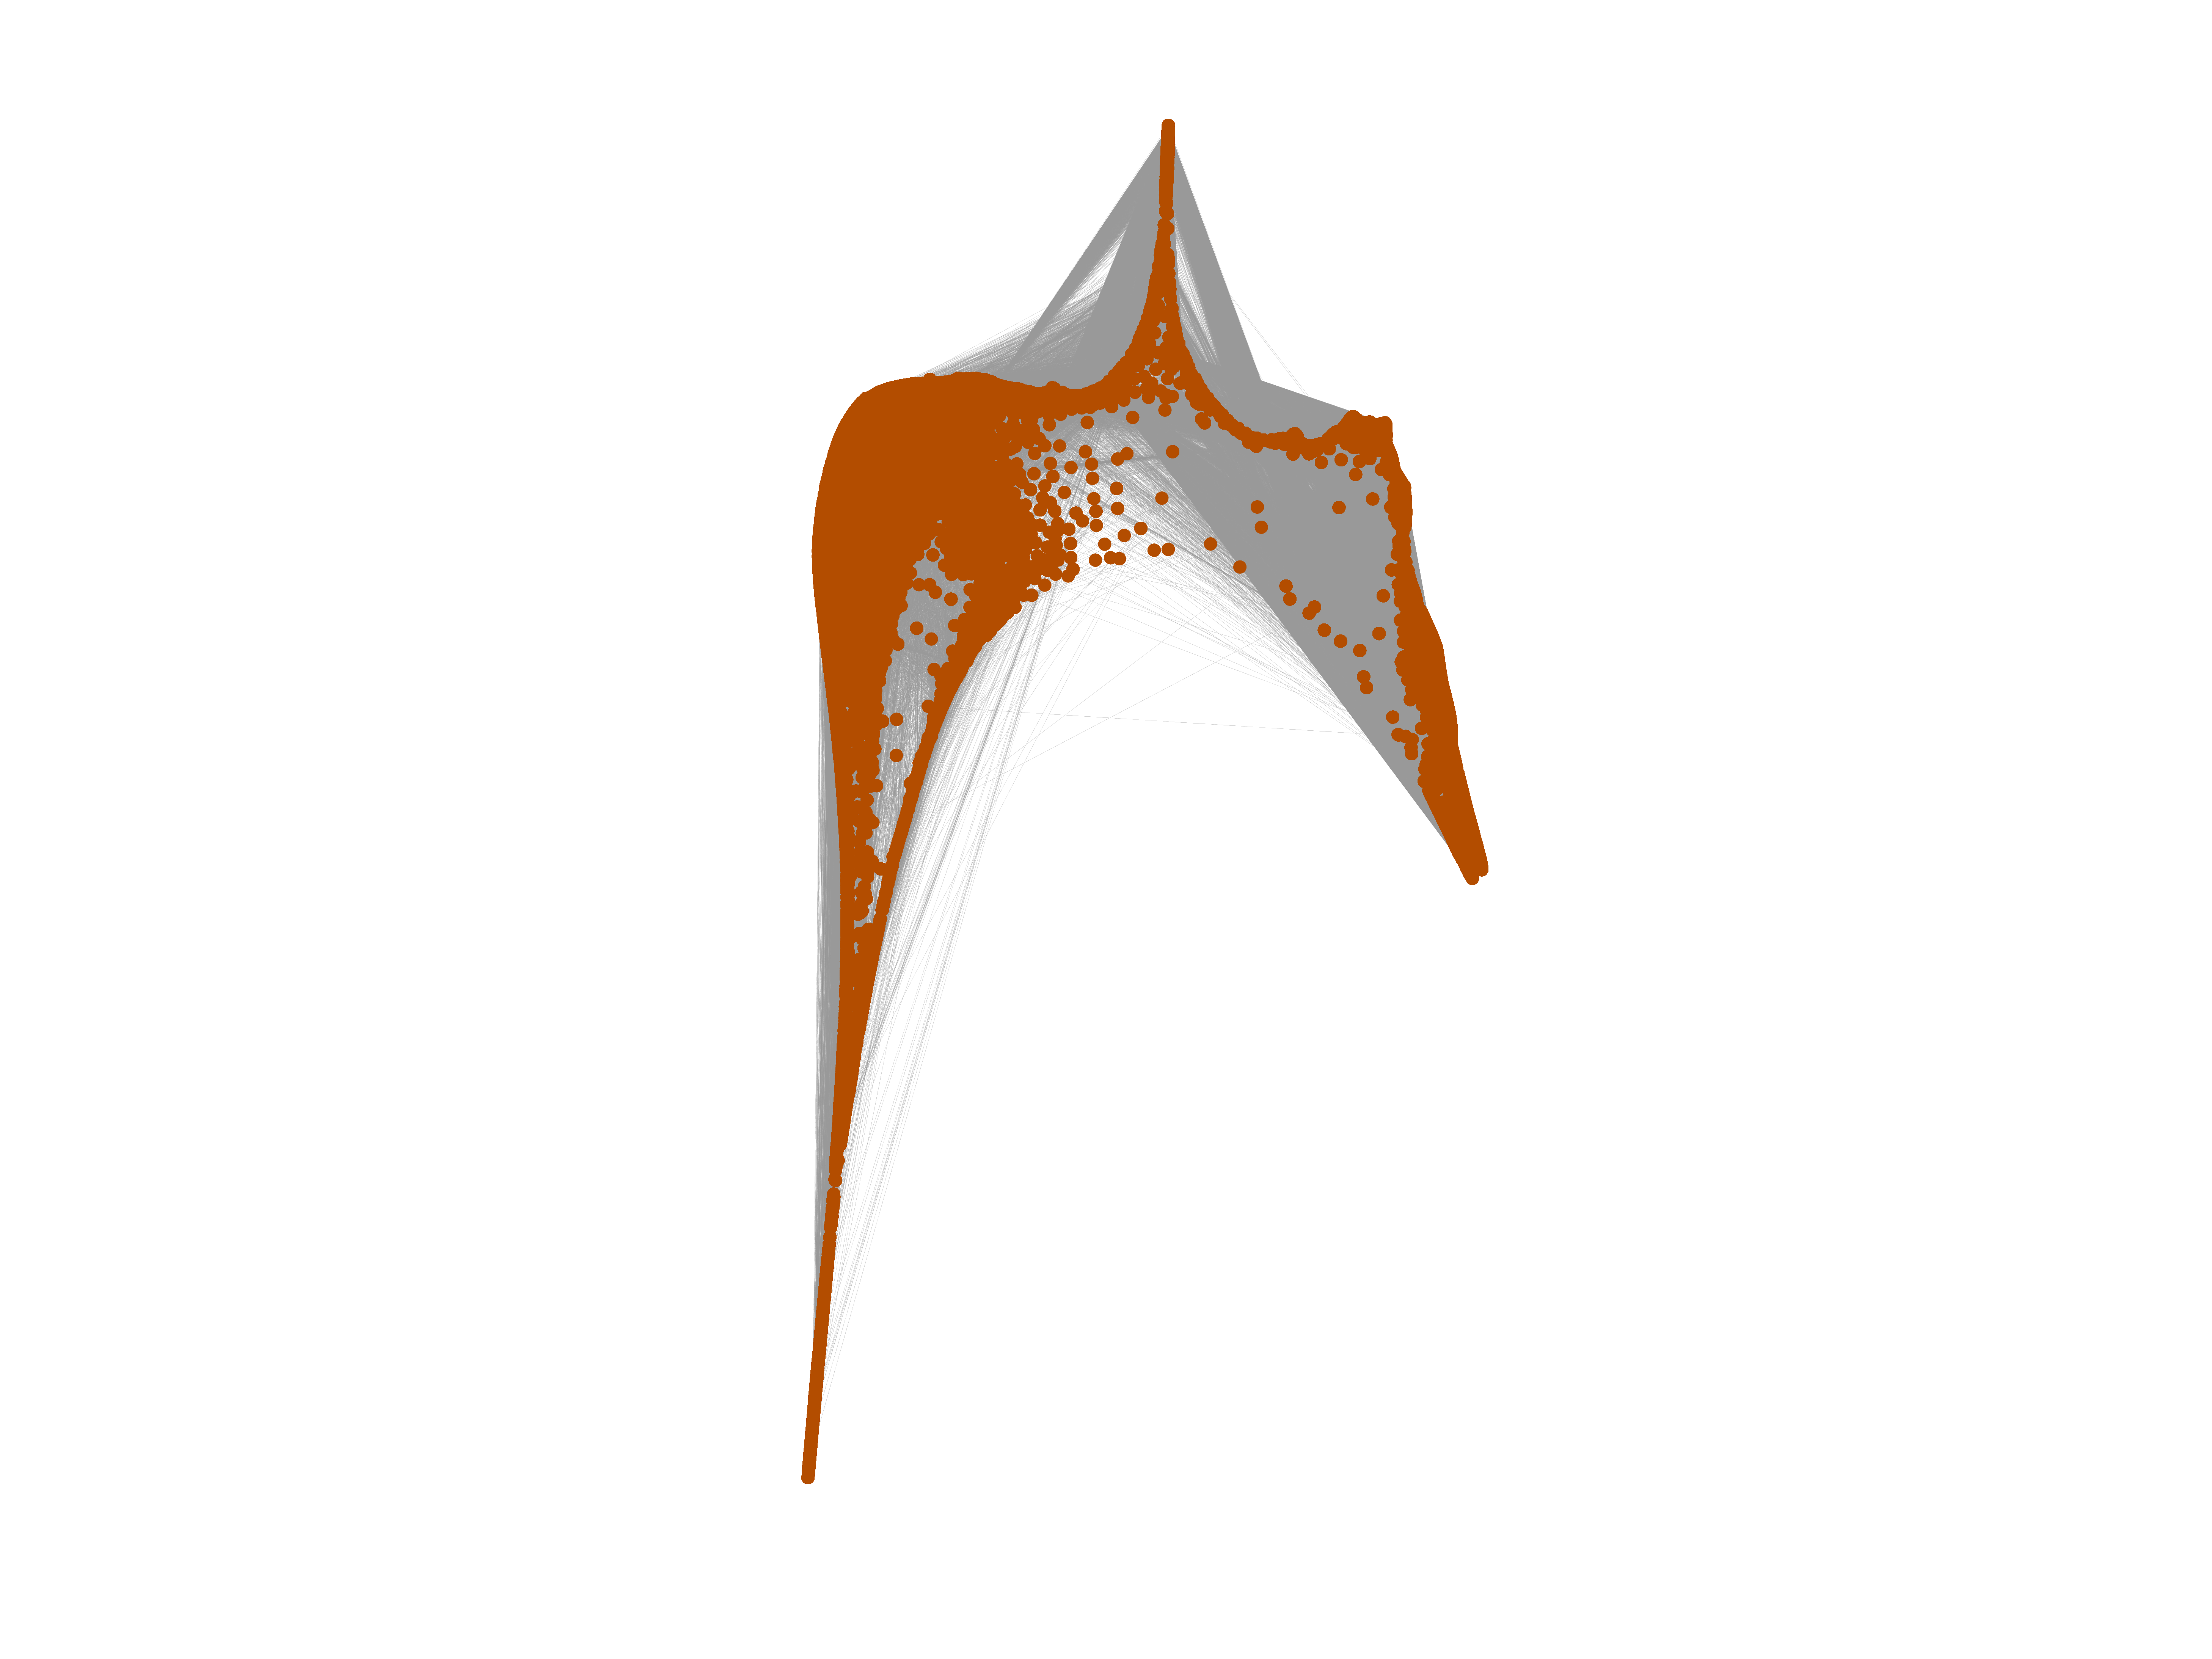
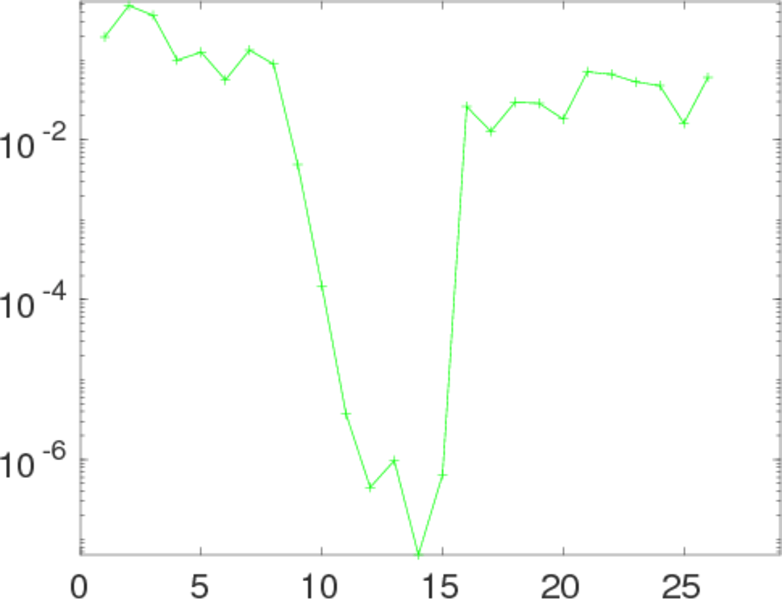
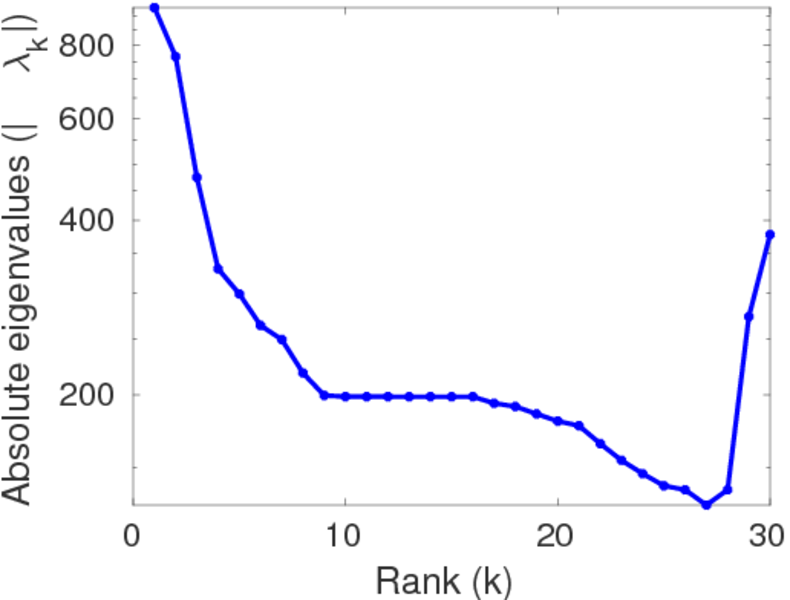
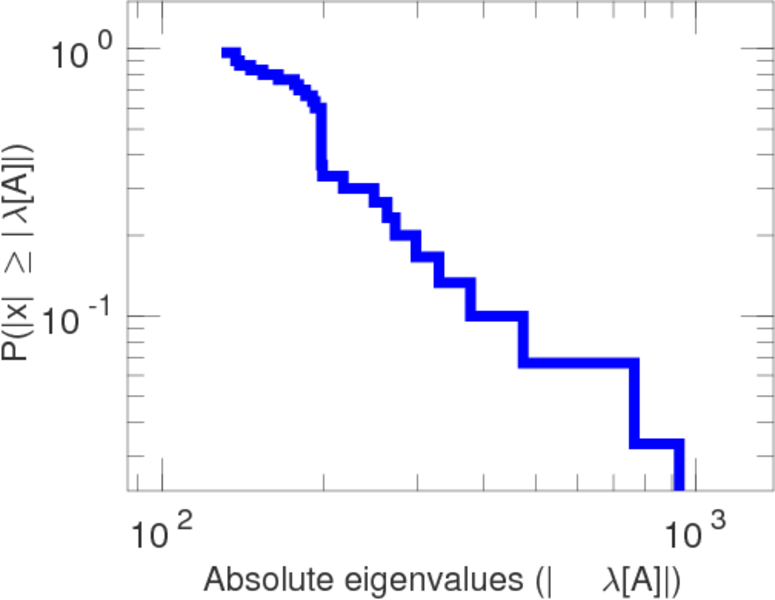
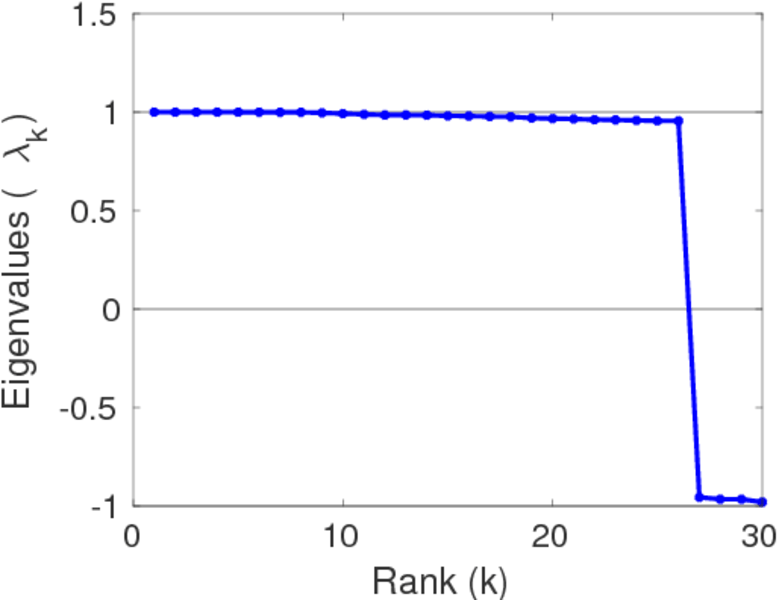
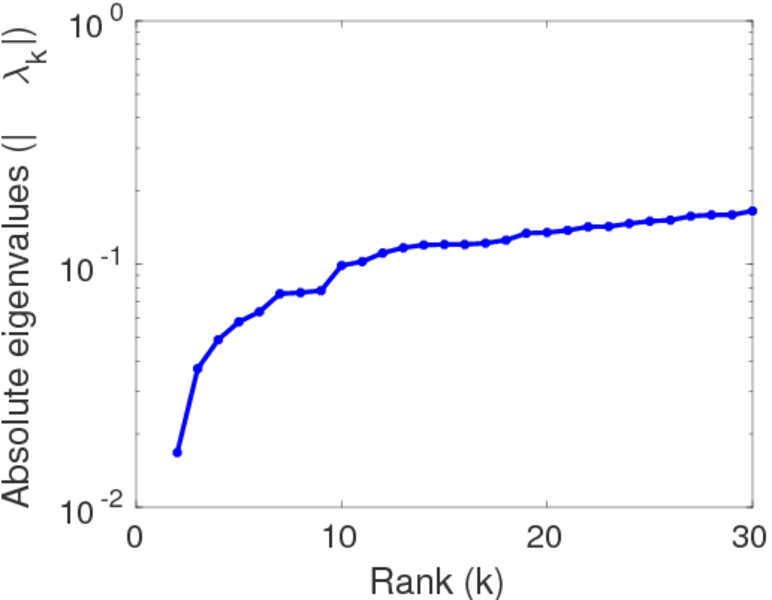
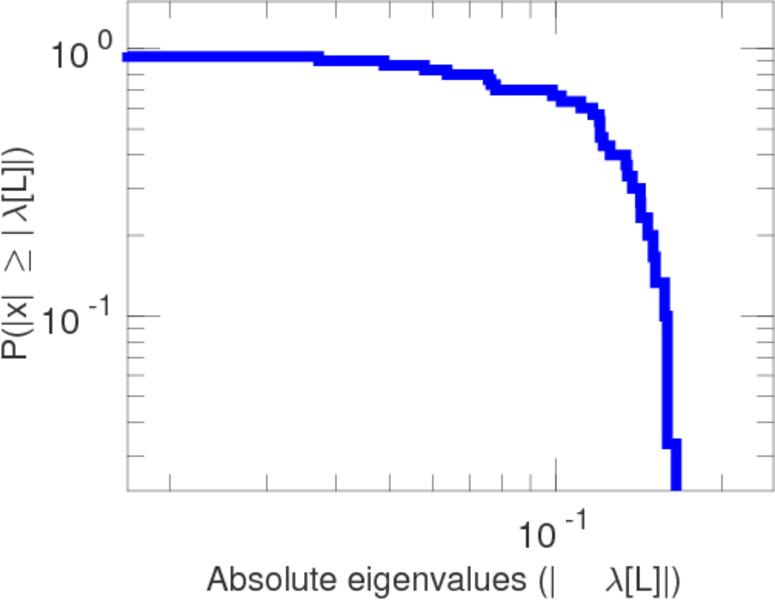
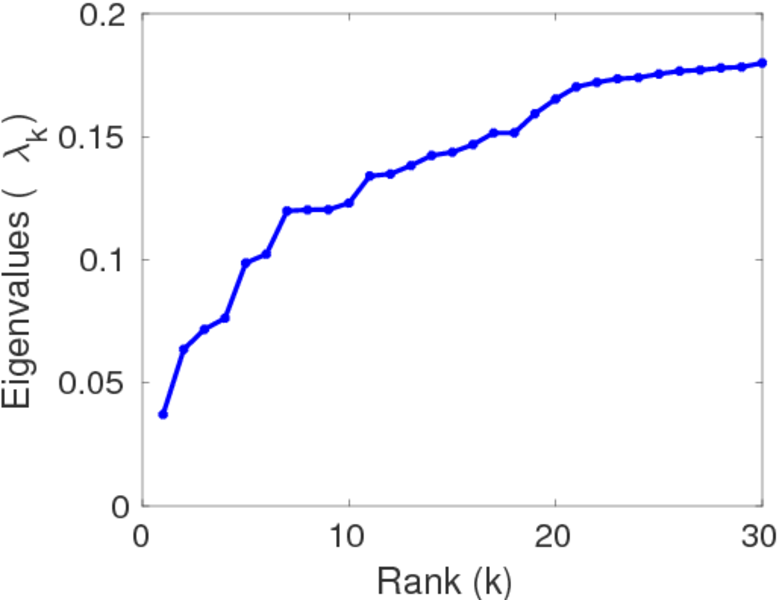
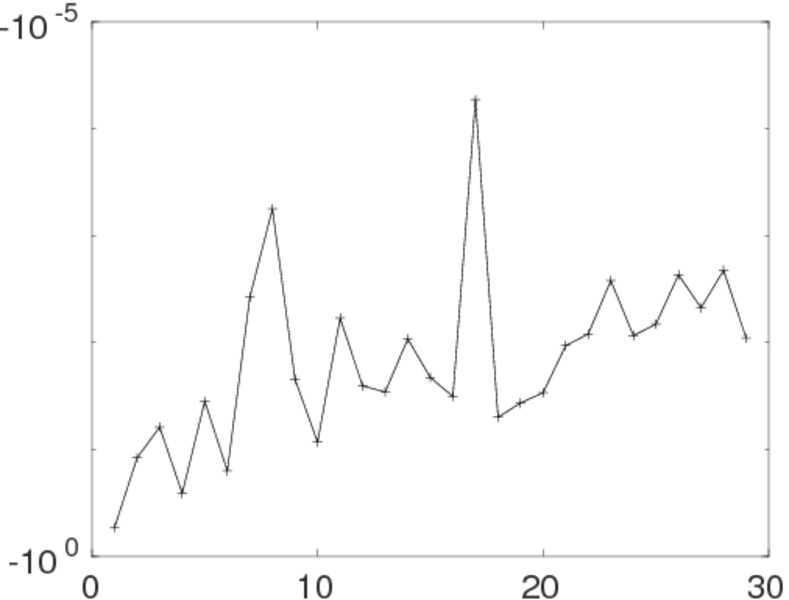
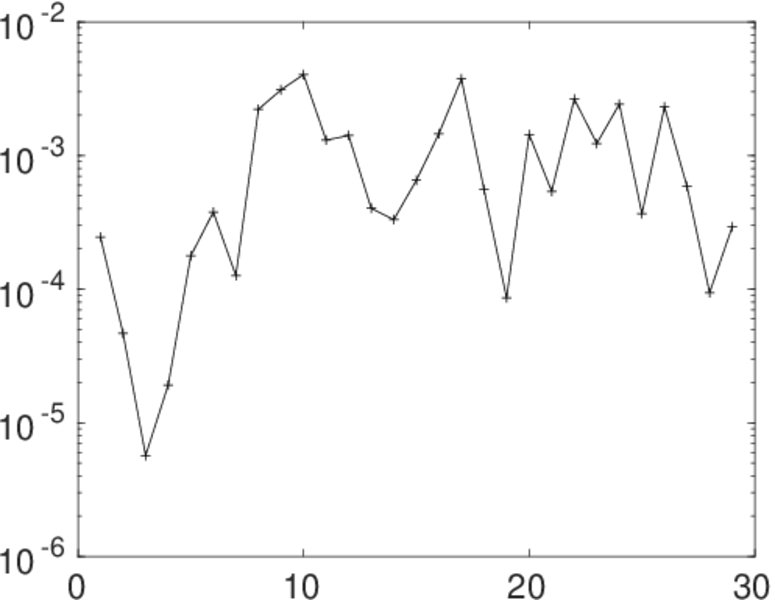
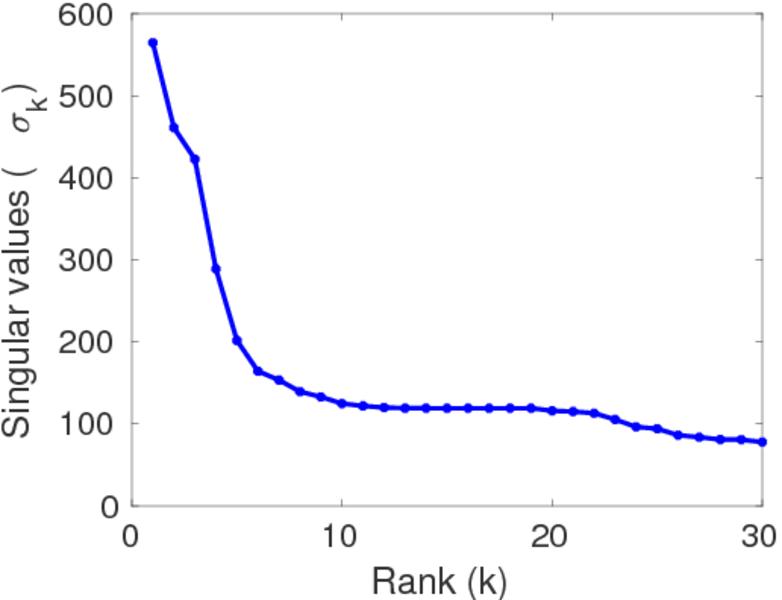
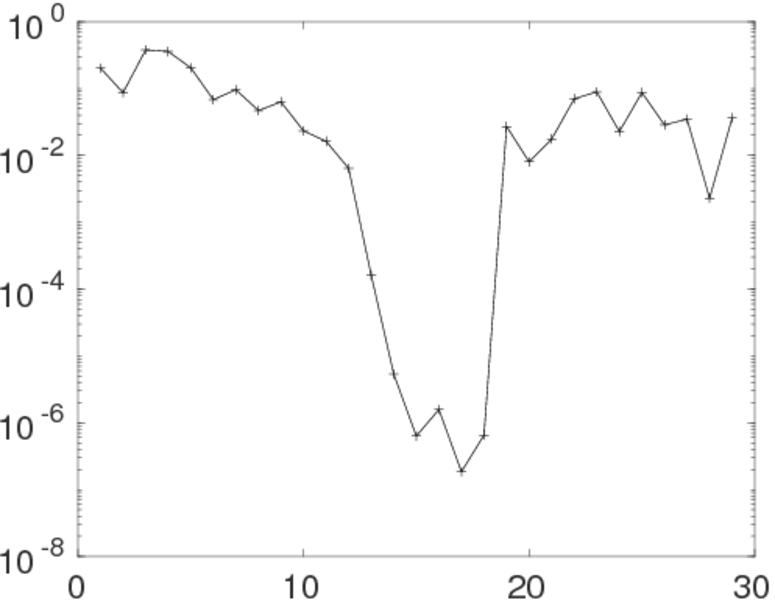
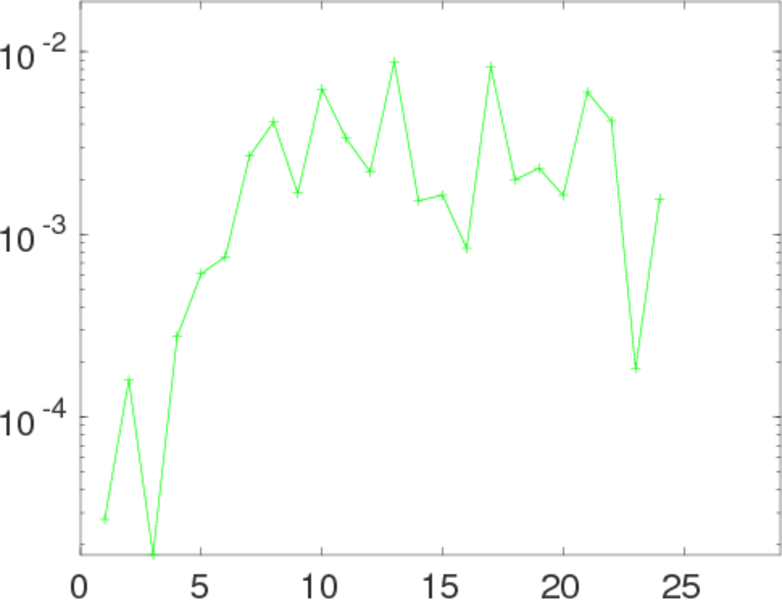
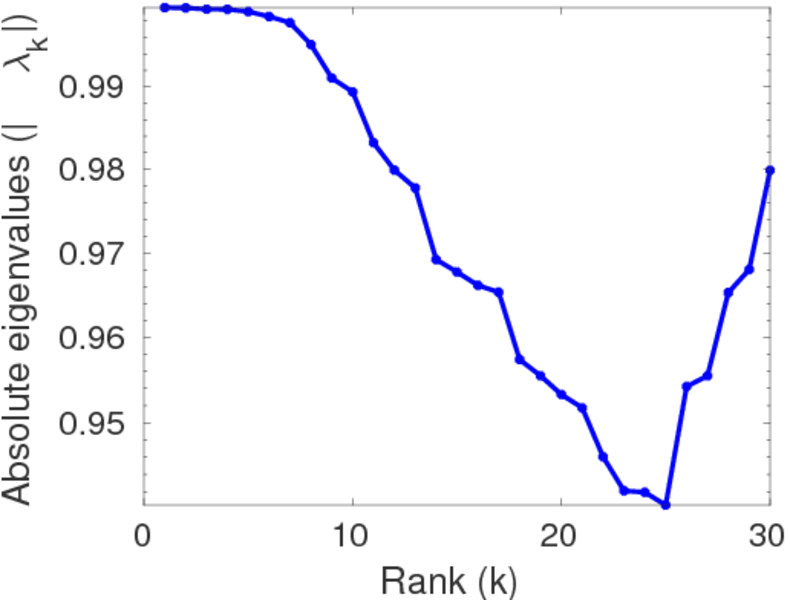
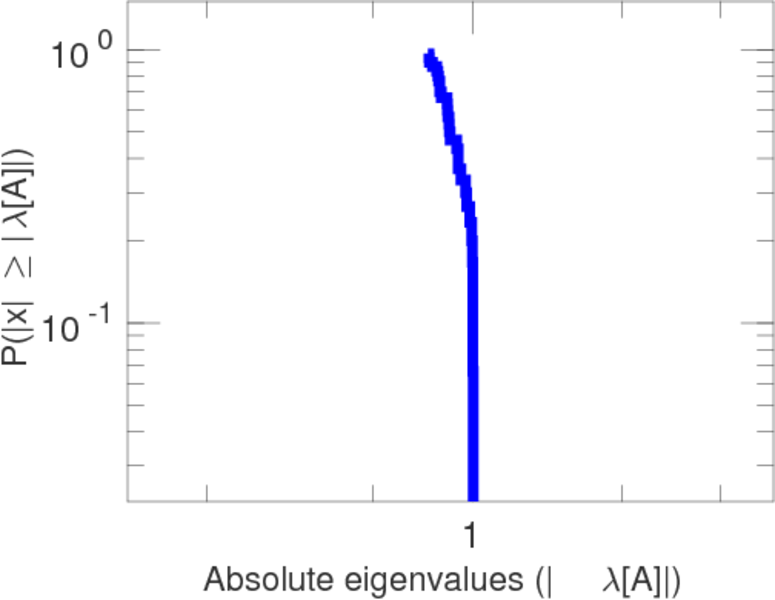
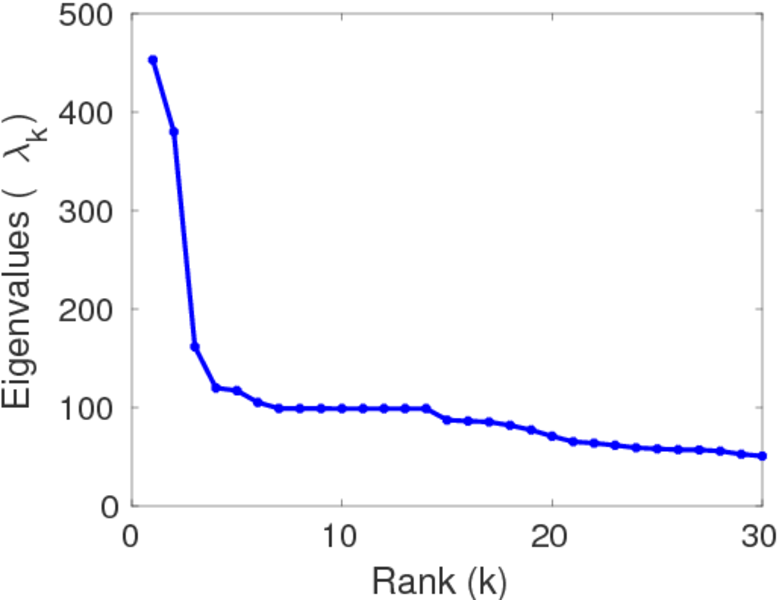
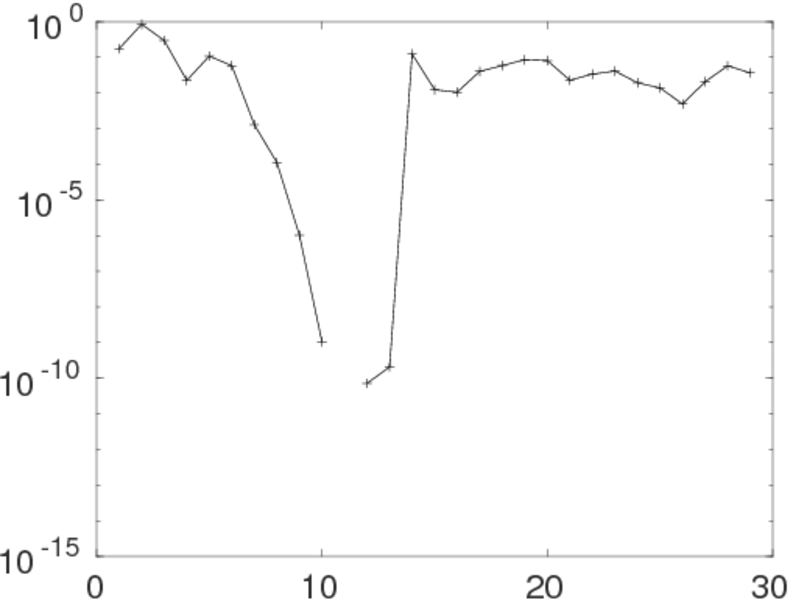
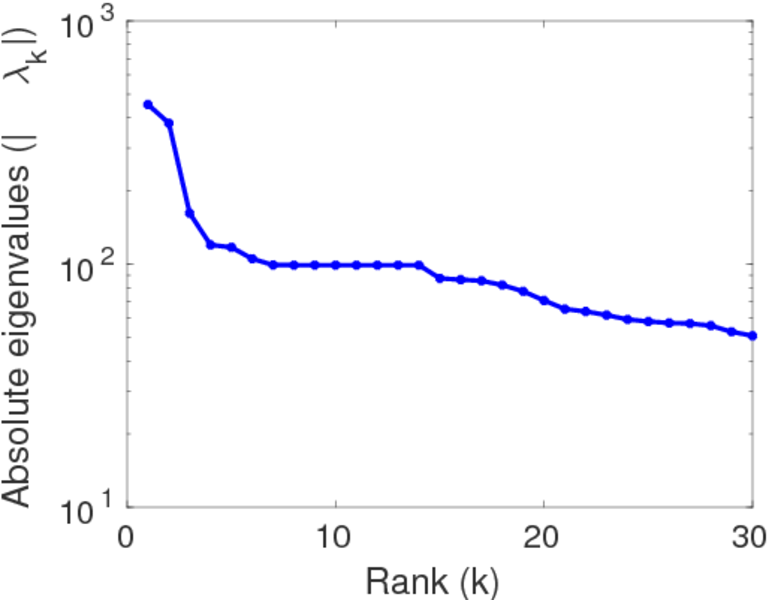
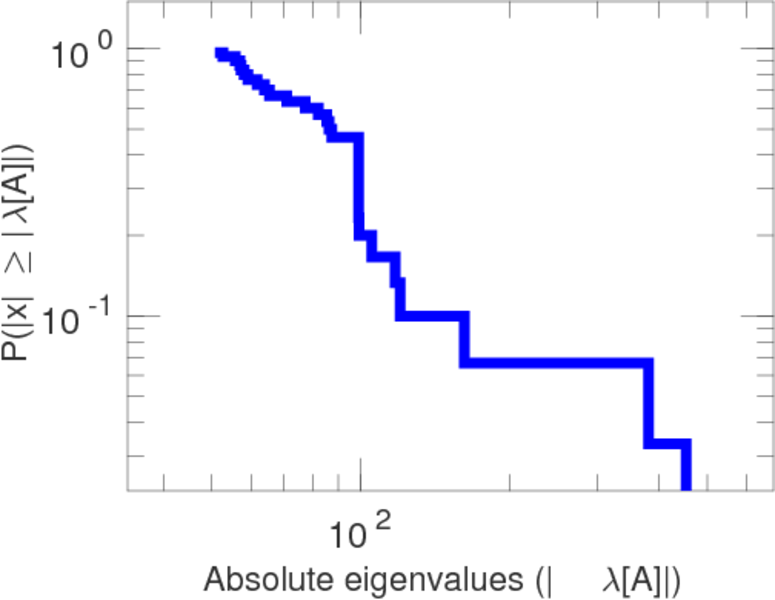
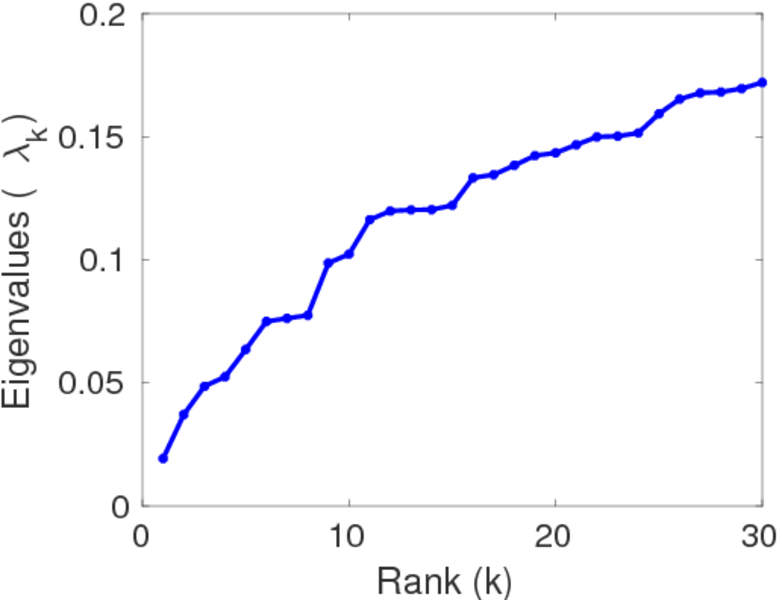
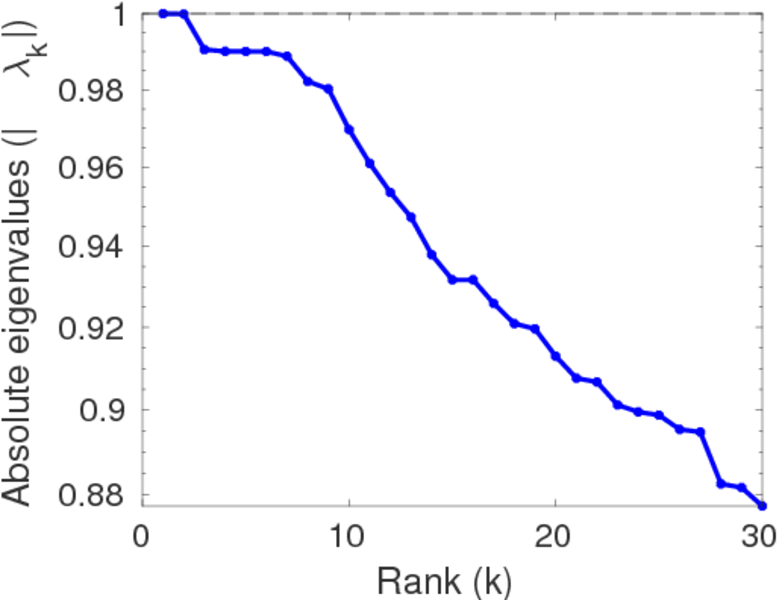
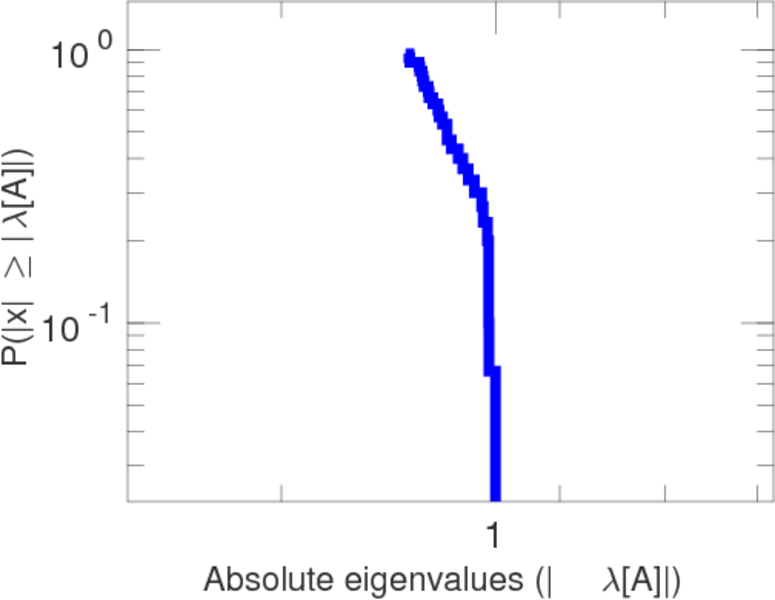
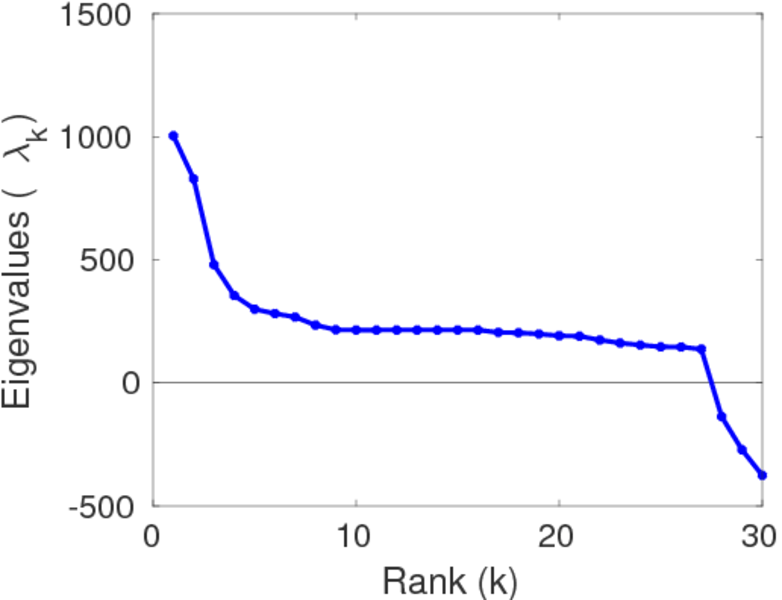
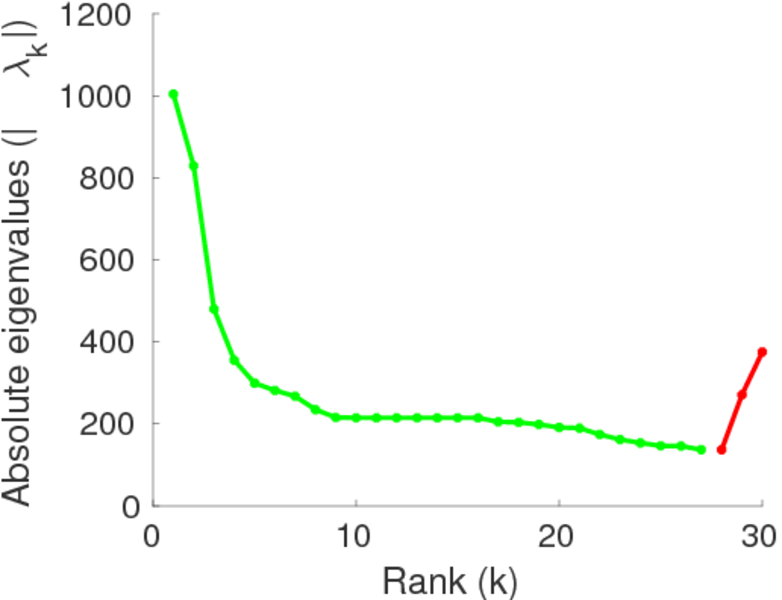
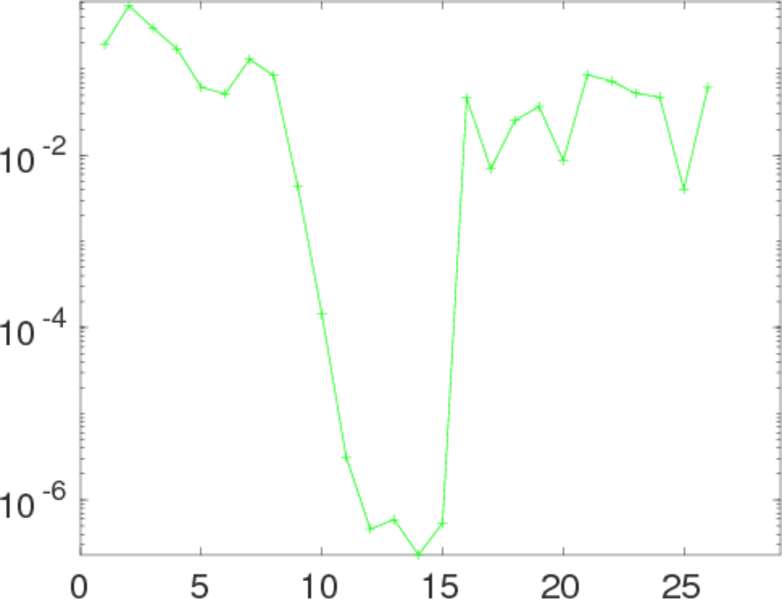
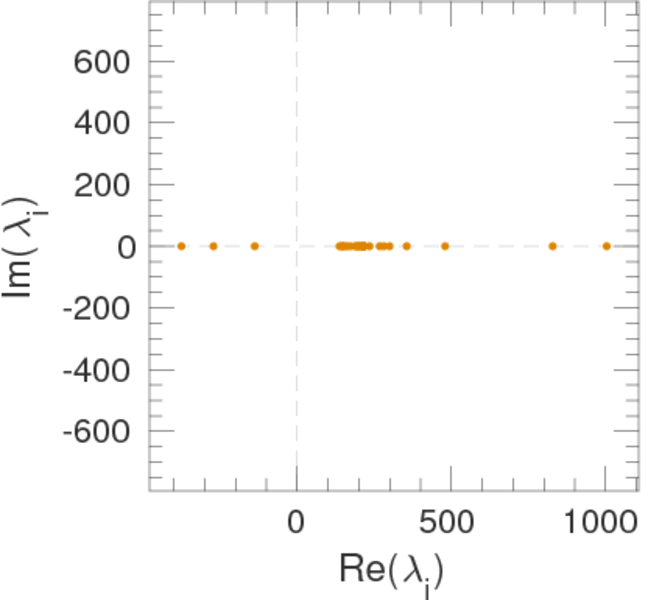
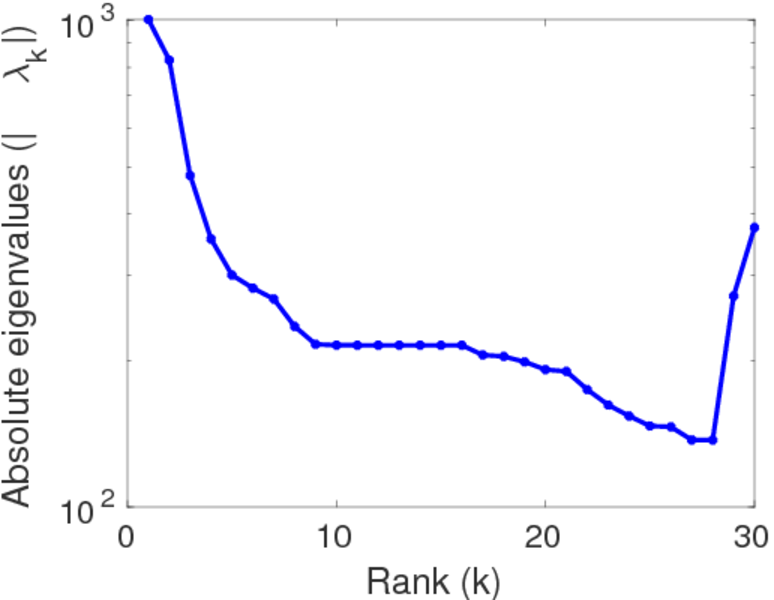
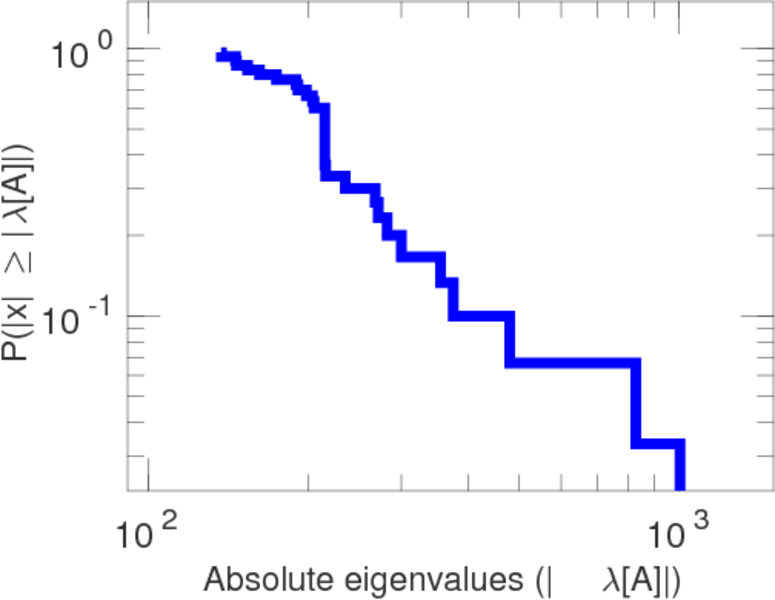
Matrix decompositions plots


Downloads
References
|
[1]
|
Jérôme Kunegis.
KONECT – The Koblenz Network Collection.
In Proc. Int. Conf. on World Wide Web Companion, pages
1343–1350, 2013.
[ http ]
|
 KONECT ‣ Networks ‣
Buy Me a Coffee
KONECT ‣ Networks ‣
Buy Me a Coffee