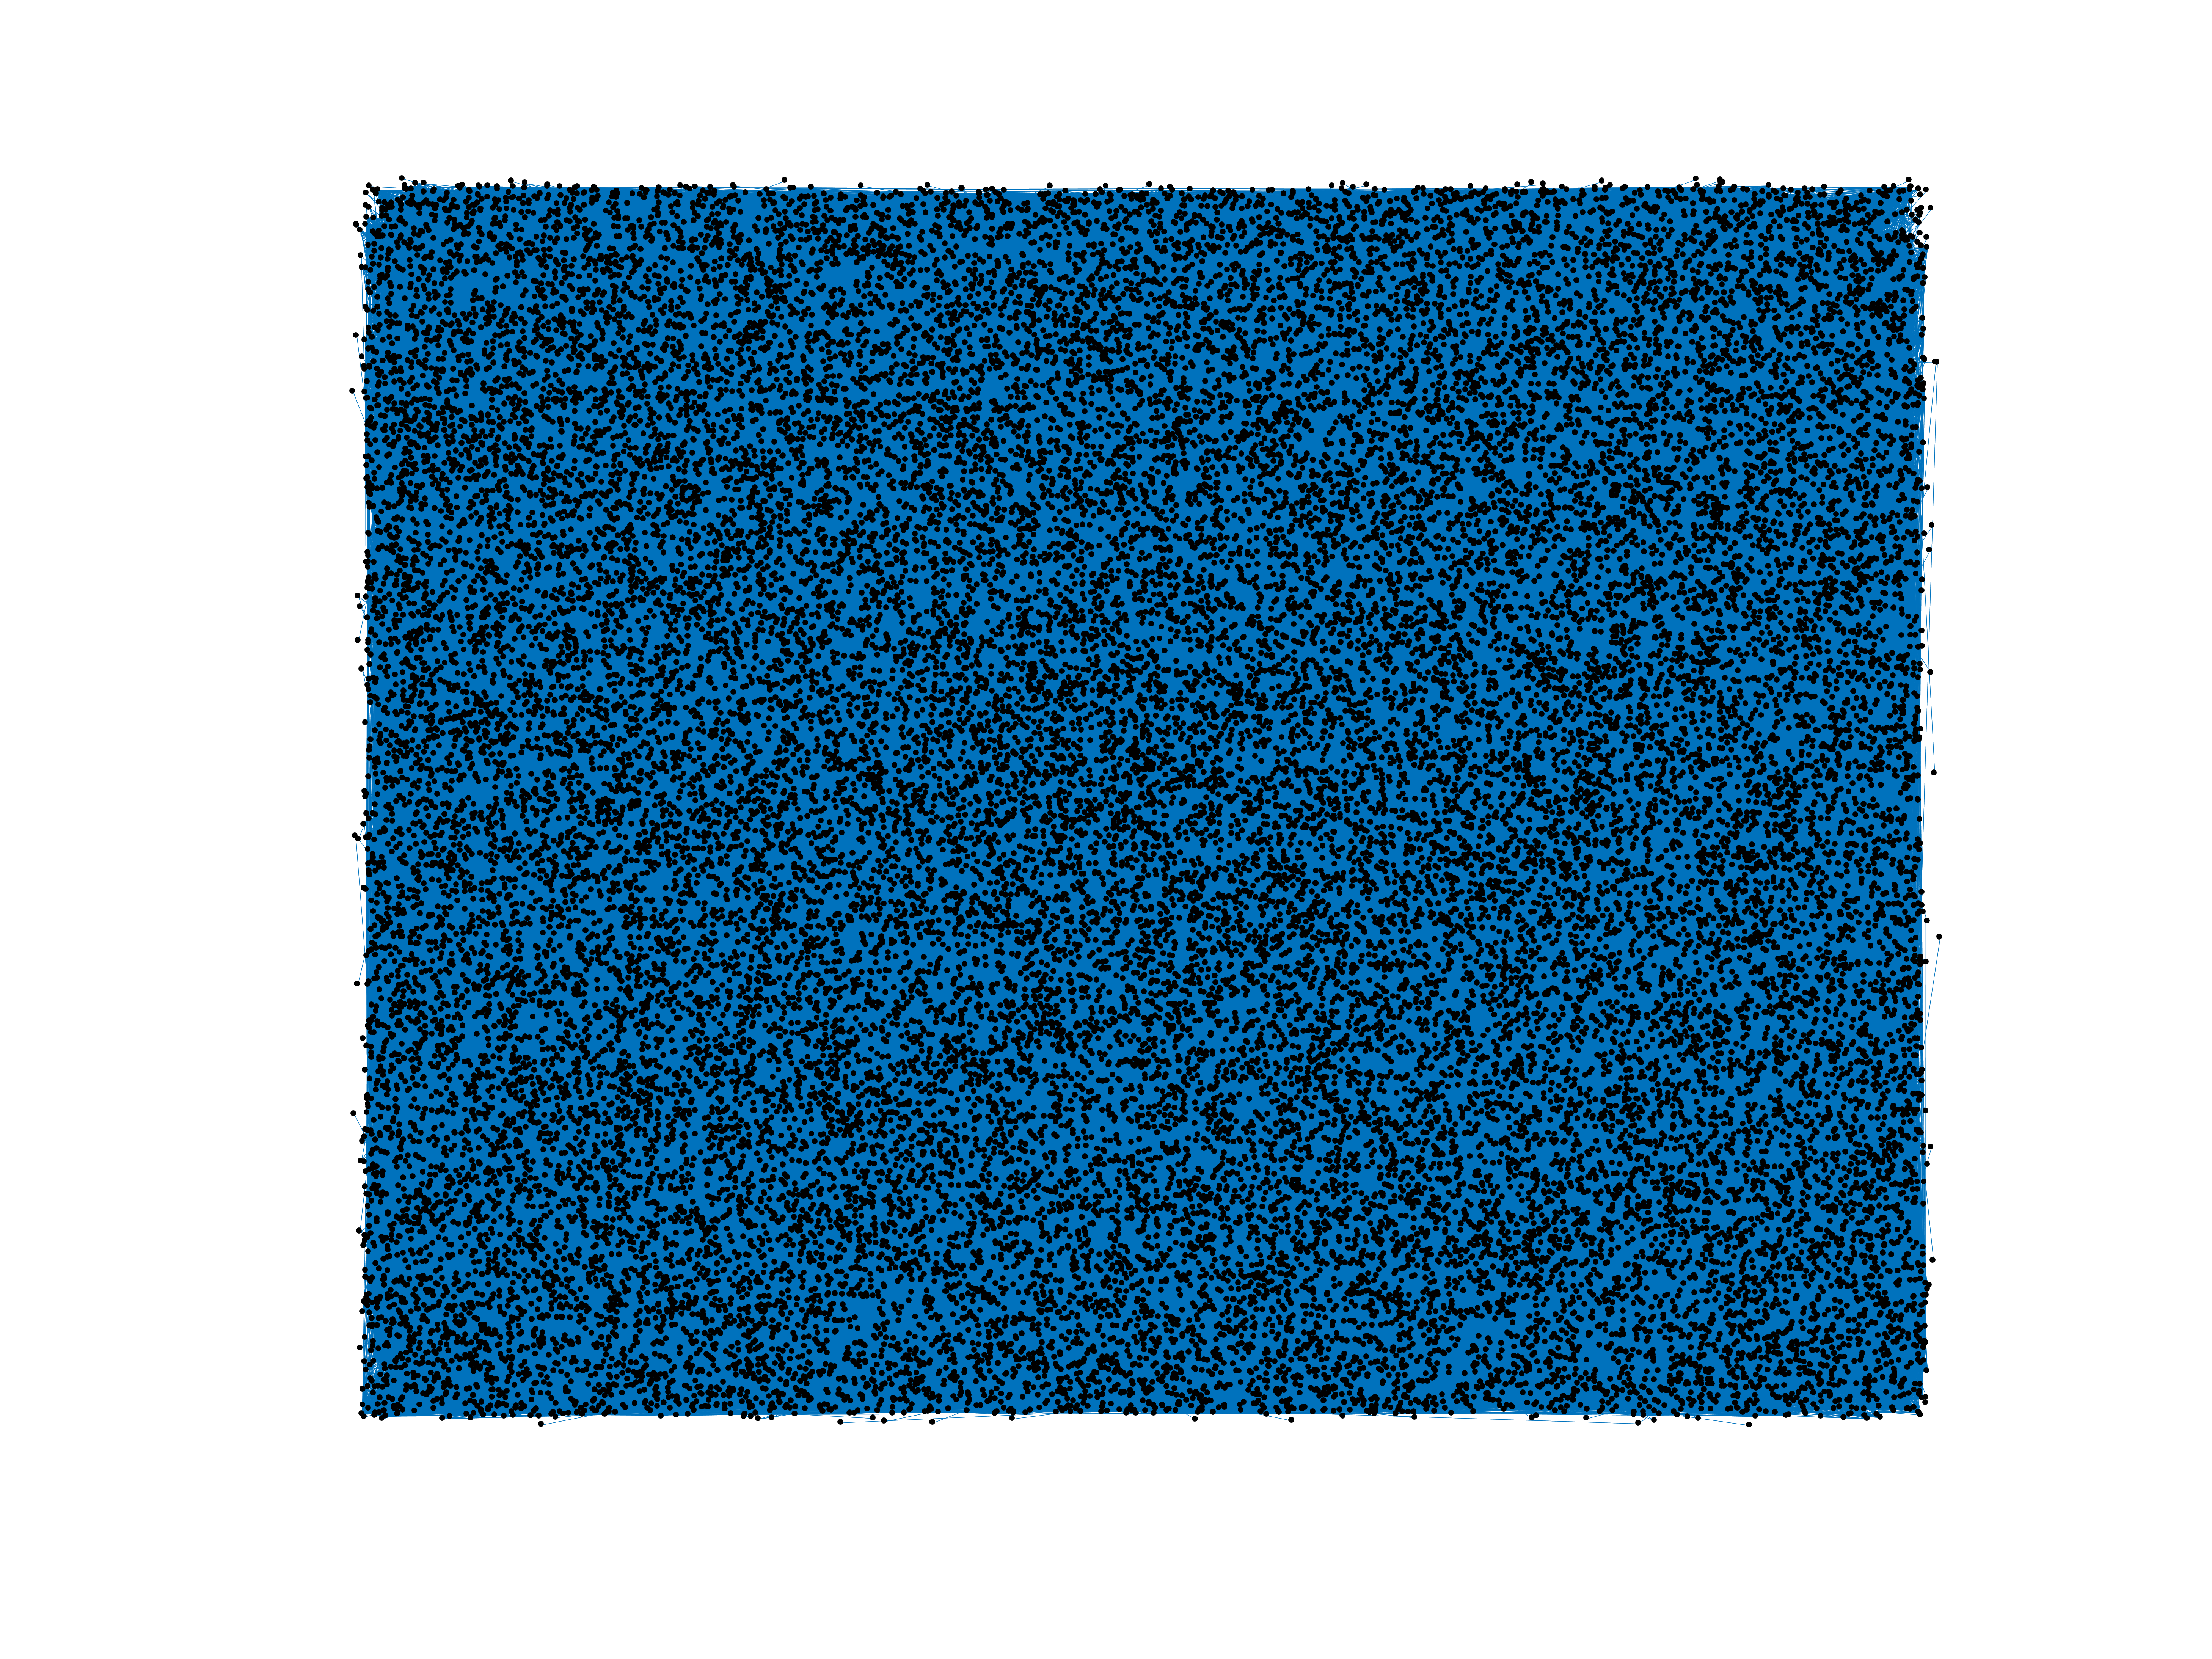
Wikipedia links (qu)
This network consists of the wikilinks of the Wikipedia in the Quechua language
(qu). Nodes are Wikipedia articles, and directed edges are wikilinks, i.e.,
hyperlinks within one wiki. In the wiki source, these are indicated with
[[double brackets]]. Only pages in the article namespace are included.
Metadata
Statistics
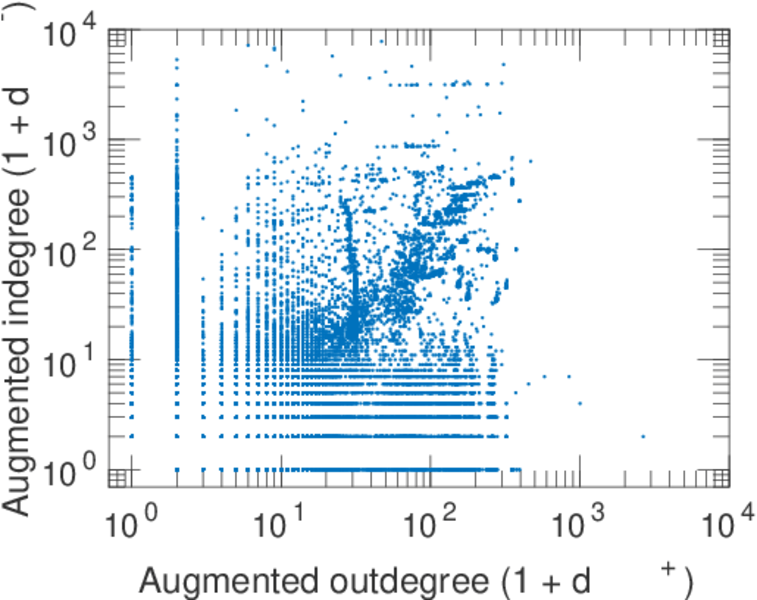
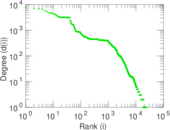
| Size | n = | 37,219
|
| Volume | m = | 1,165,599
|
| Wedge count | s = | 605,951,335
|
| Triangle count | t = | 48,910,567
|
| Square count | q = | 15,705,608,486
|
| 4-Tour count | T4 = | 128,070,672,370
|
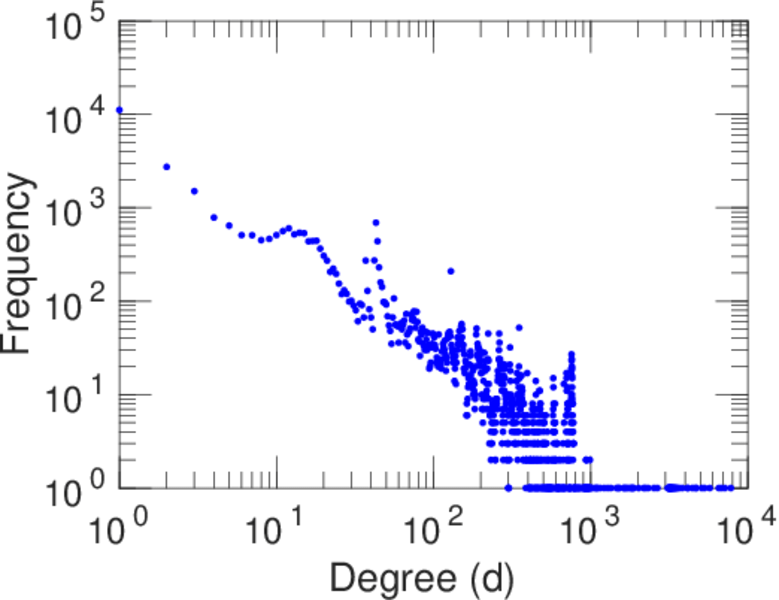
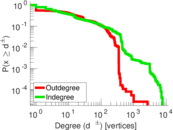
| Maximum degree | dmax = | 7,816
|
| Maximum outdegree | d+max = | 2,663
|
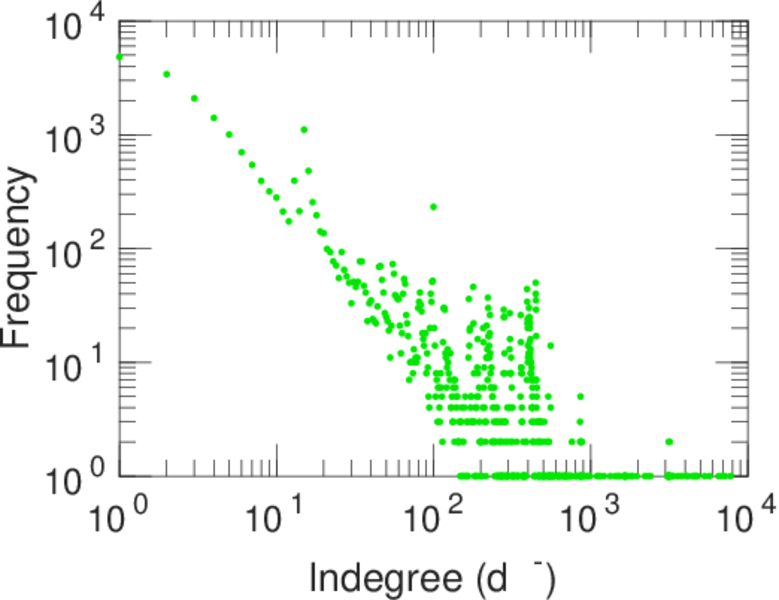
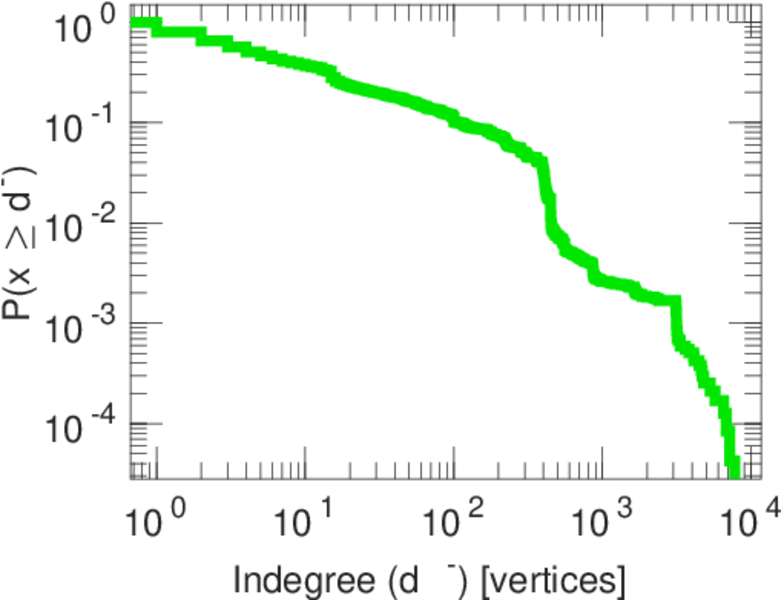
| Maximum indegree | d−max = | 7,770
|
| Average degree | d = | 62.634 6
|
| Fill | p = | 0.000 841 433
|
| Size of LCC | N = | 37,149
|
| Size of LSCC | Ns = | 21,153
|
| Relative size of LSCC | Nrs = | 0.568 339
|
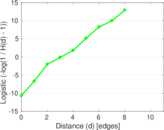
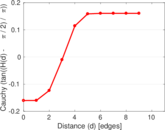
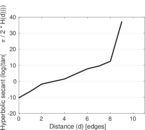
| Diameter | δ = | 11
|
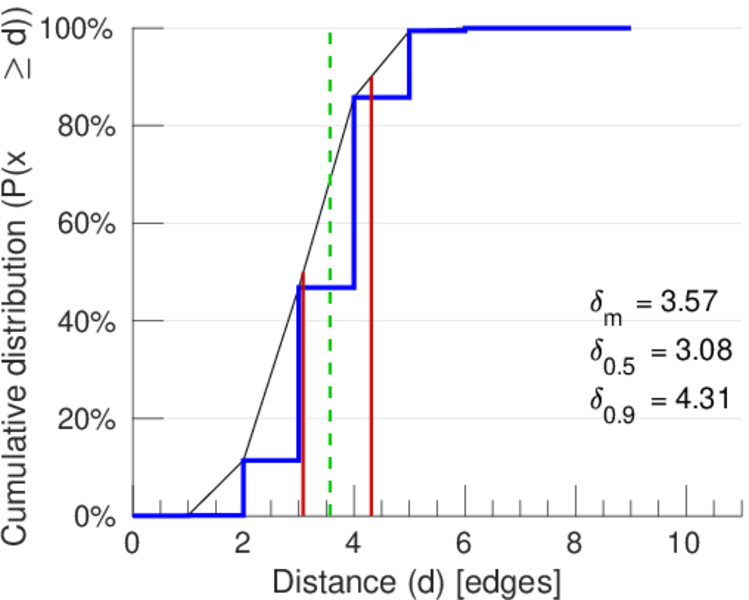
| 50-Percentile effective diameter | δ0.5 = | 3.082 56
|
| 90-Percentile effective diameter | δ0.9 = | 4.308 54
|
| Median distance | δM = | 4
|
| Mean distance | δm = | 3.565 50
|
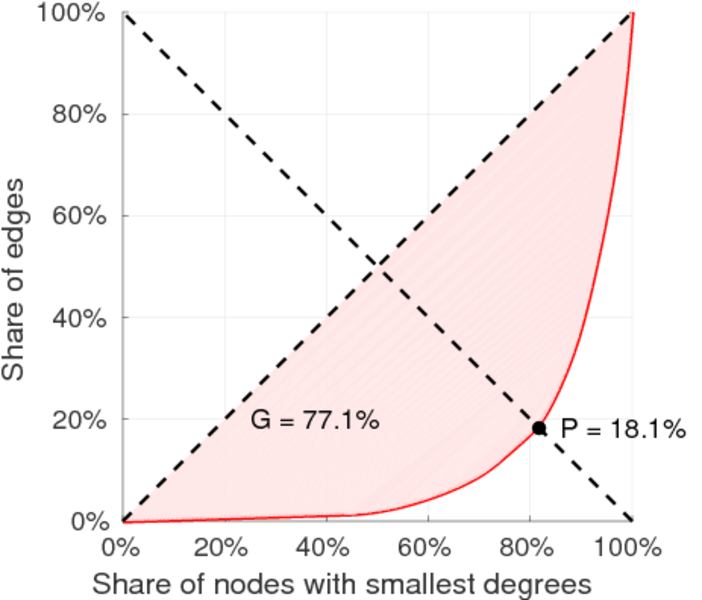
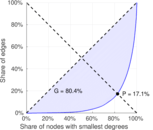
| Gini coefficient | G = | 0.803 538
|
| Balanced inequality ratio | P = | 0.171 450
|
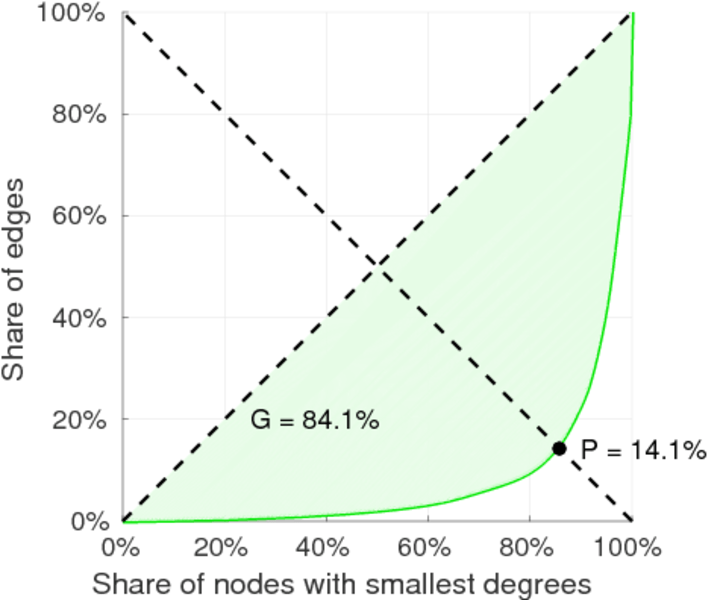
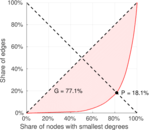
| Outdegree balanced inequality ratio | P+ = | 0.182 045
|
| Indegree balanced inequality ratio | P− = | 0.140 801
|
| Relative edge distribution entropy | Her = | 0.863 422
|
| Power law exponent | γ = | 1.461 33
|
| Tail power law exponent | γt = | 1.621 00
|
| Degree assortativity | ρ = | −0.126 906
|
| Degree assortativity p-value | pρ = | 0.000 00
|
| In/outdegree correlation | ρ± = | +0.581 823
|
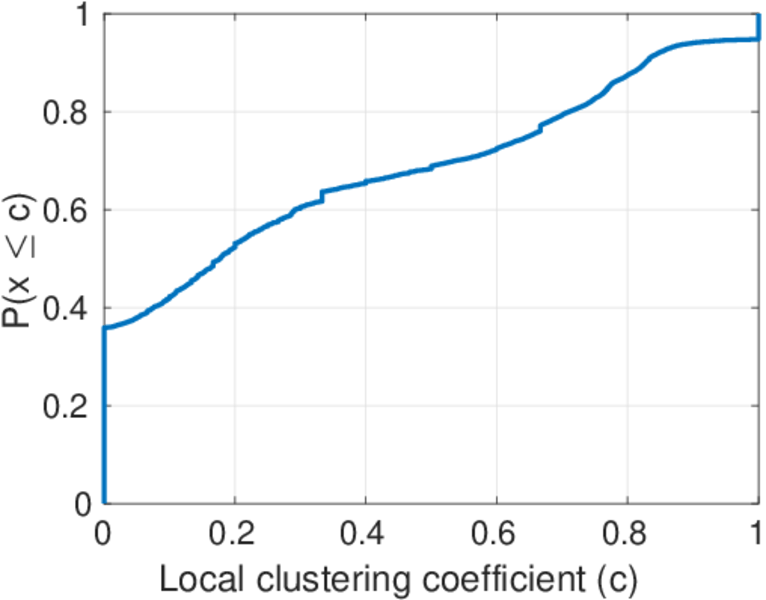
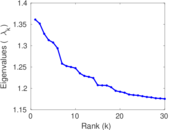
| Clustering coefficient | c = | 0.242 151
|
| Directed clustering coefficient | c± = | 0.784 315
|
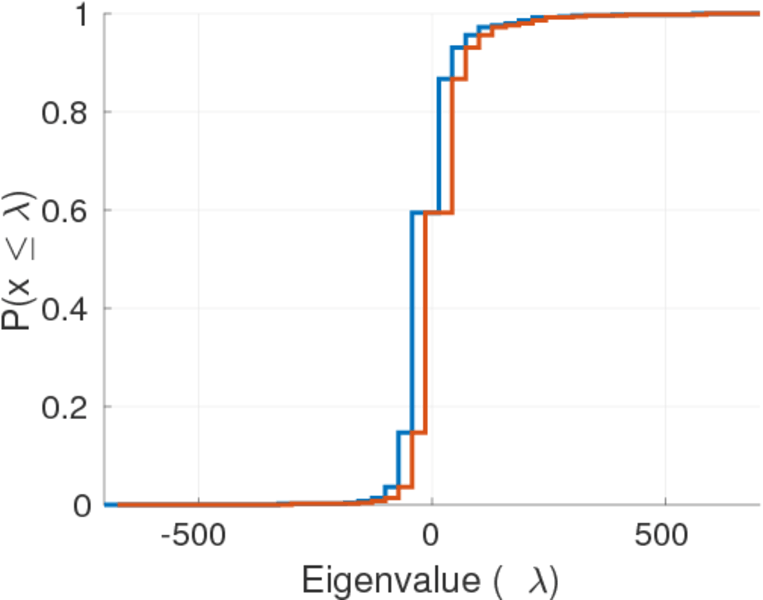
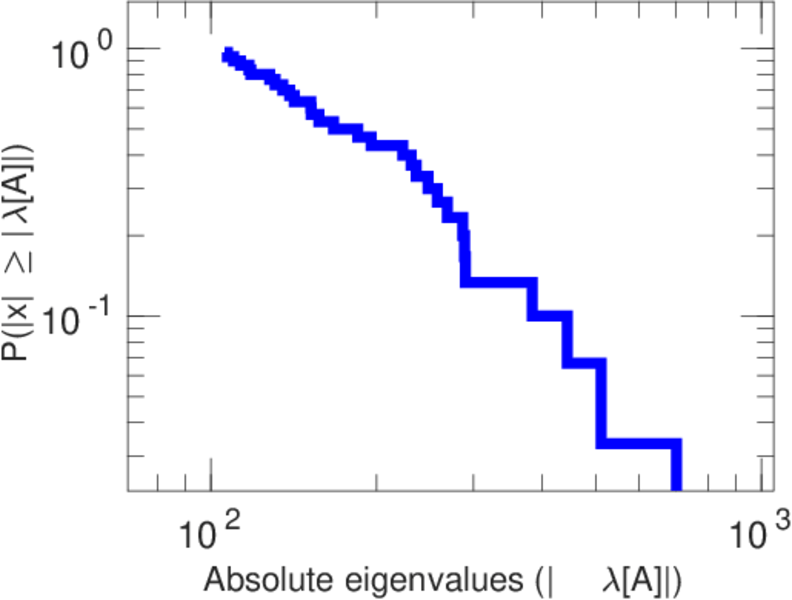
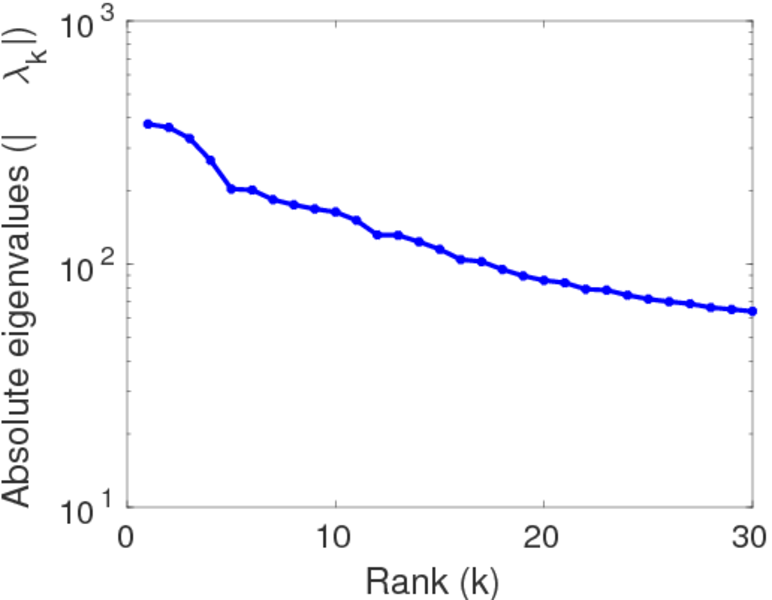
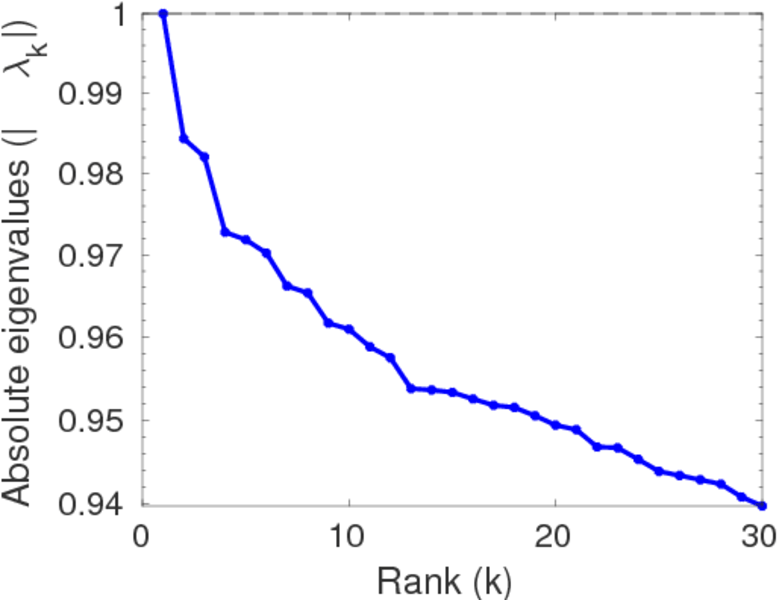
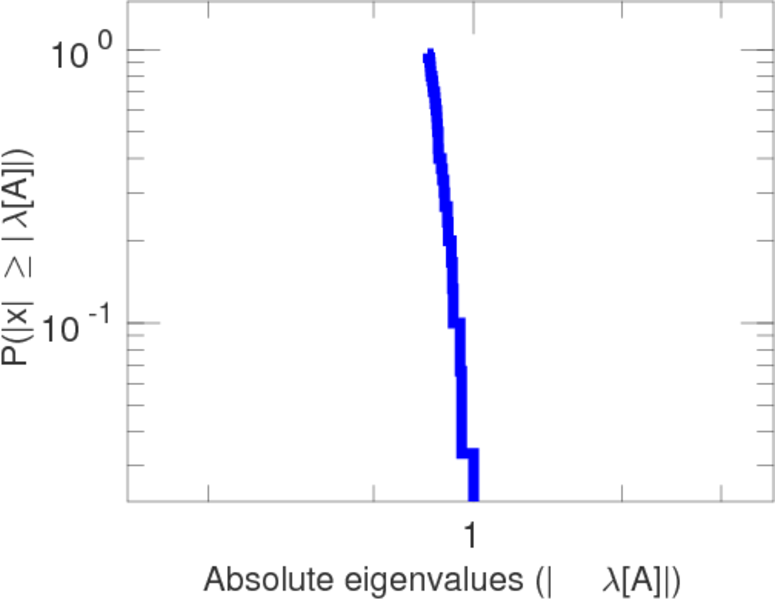
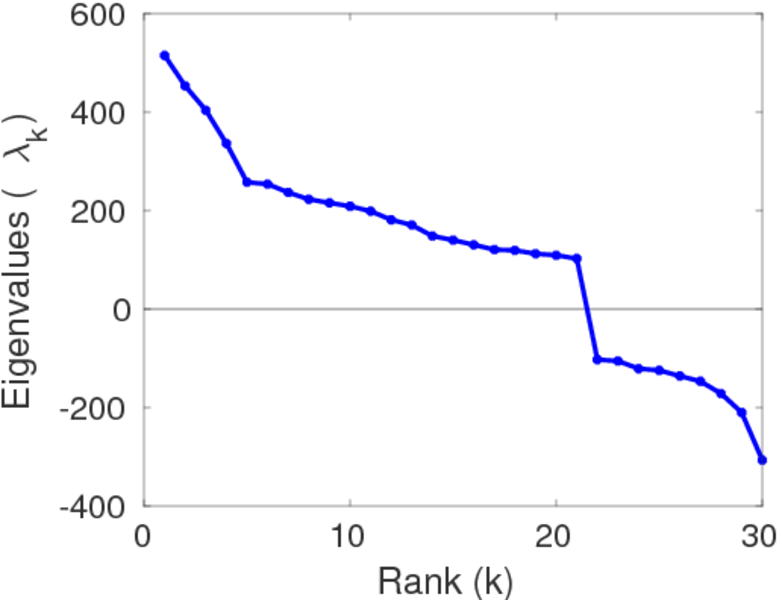
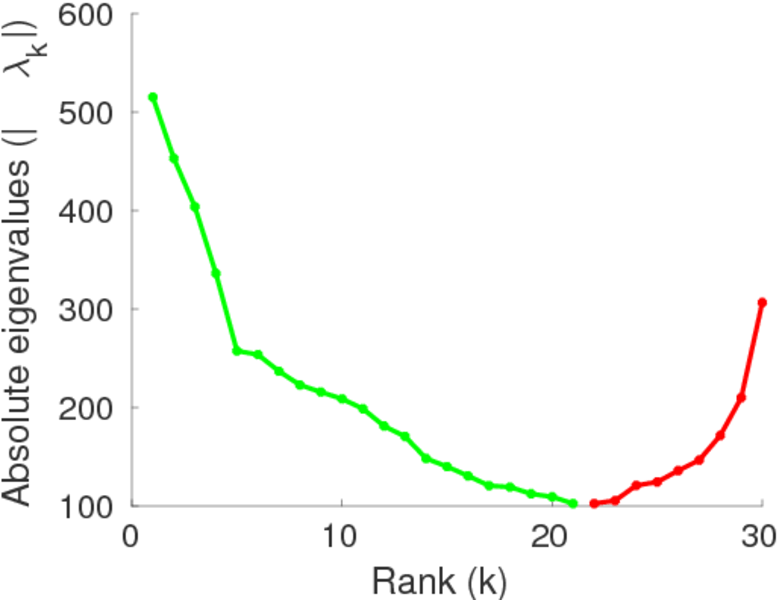
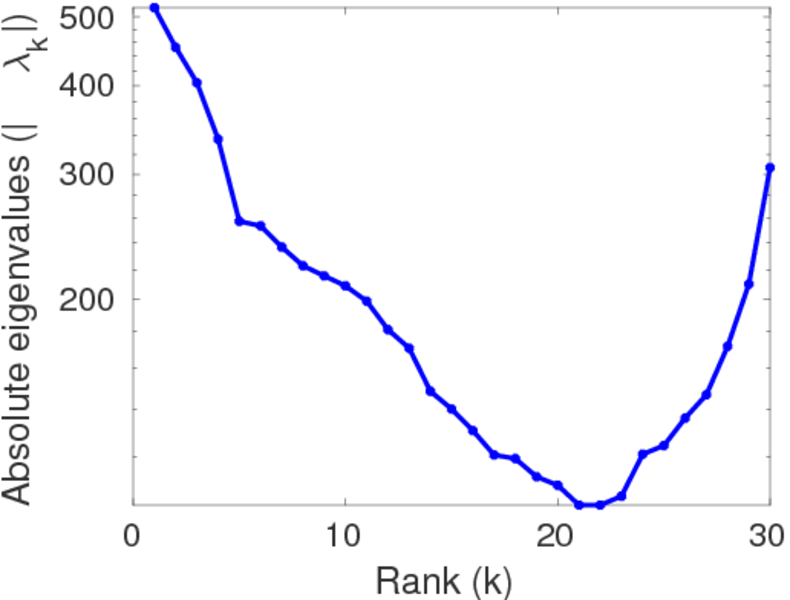
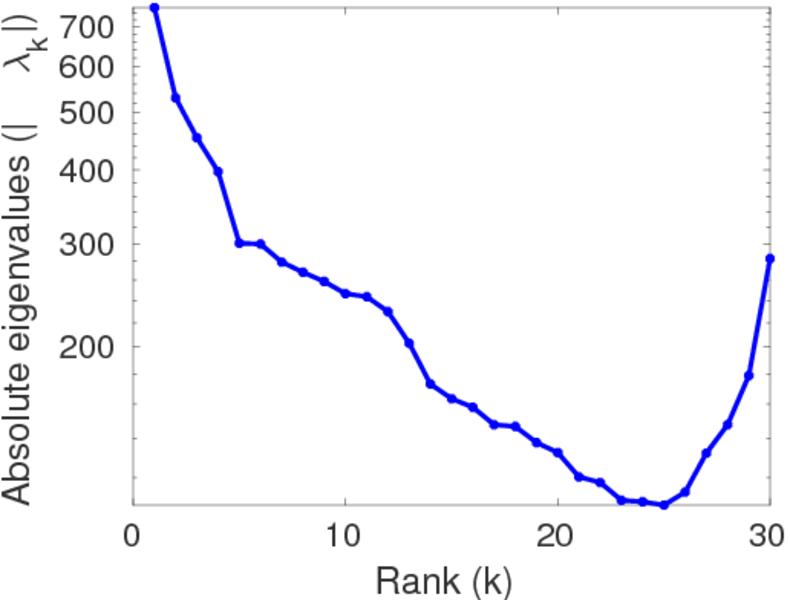
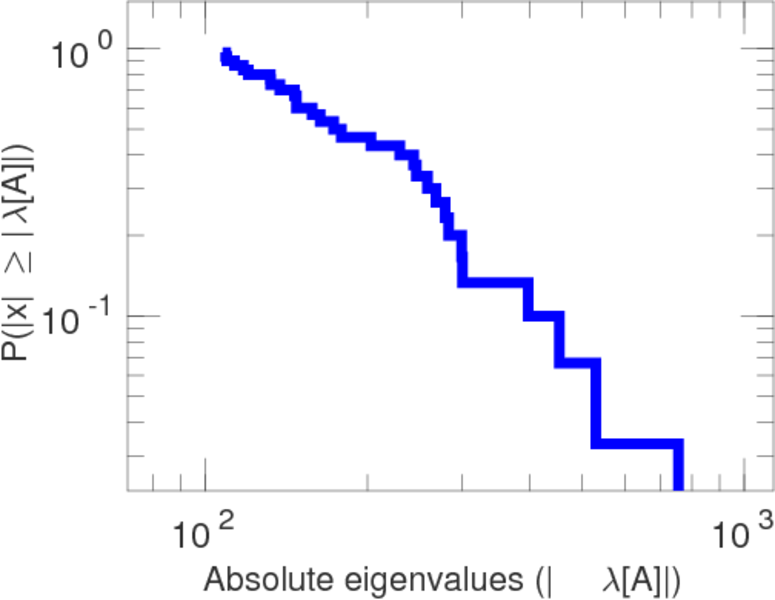
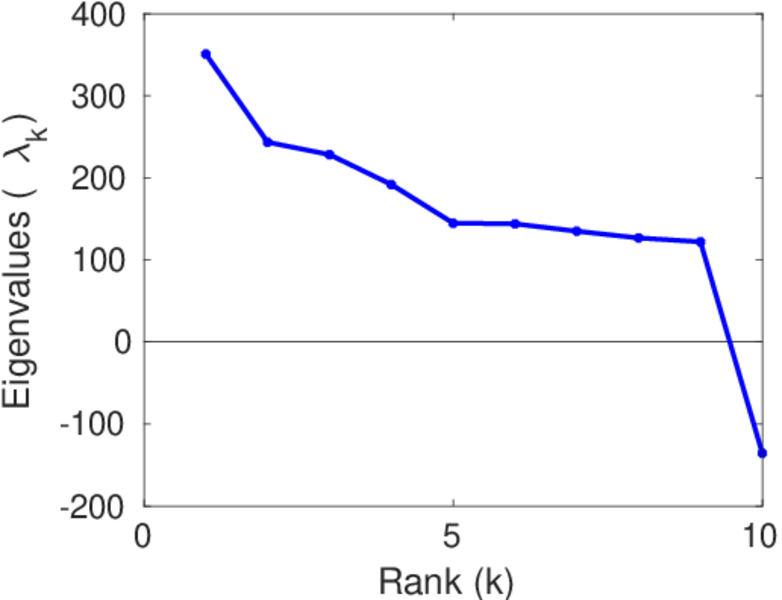
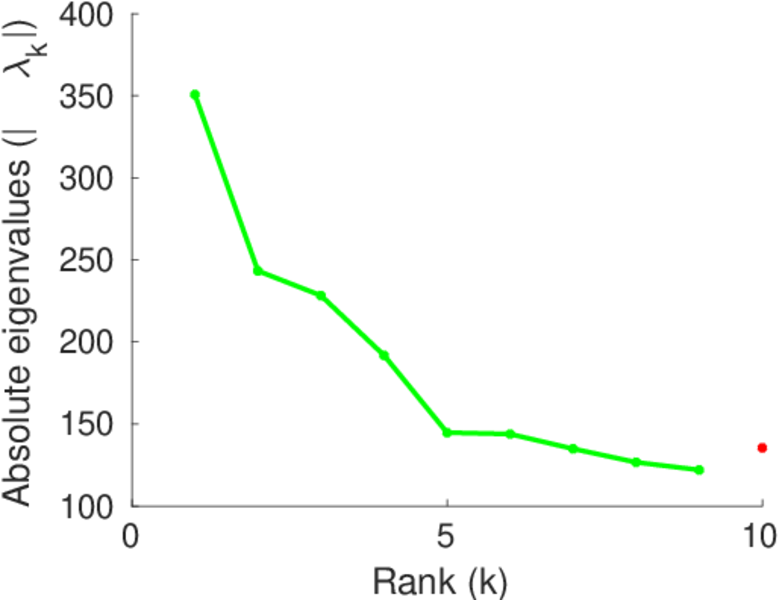
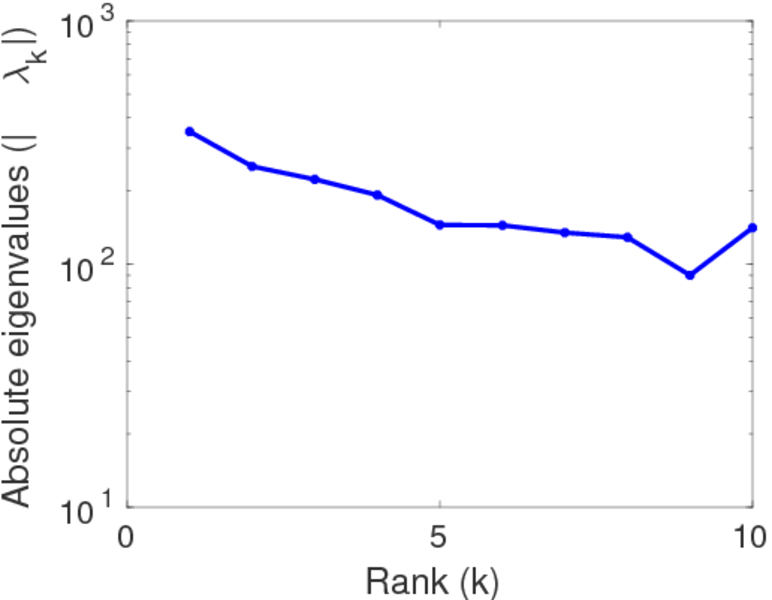
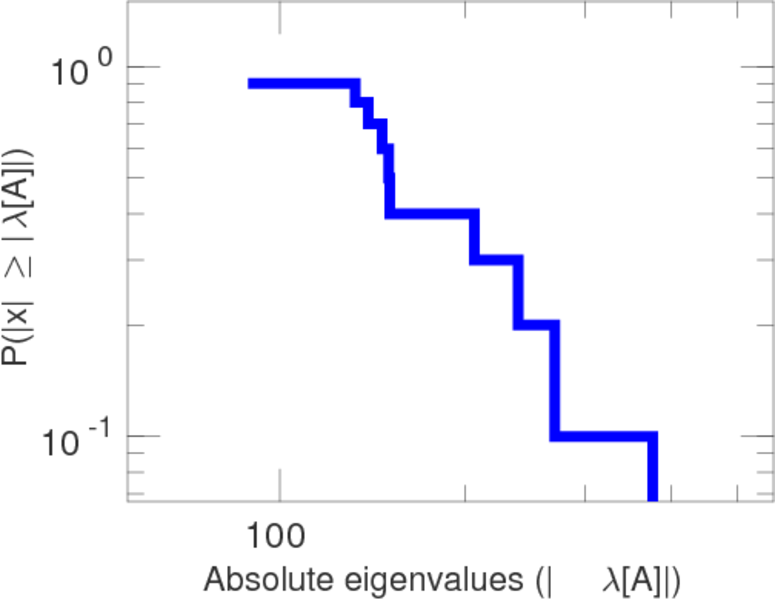
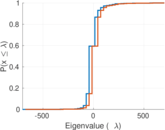
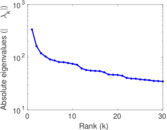
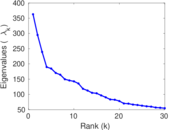
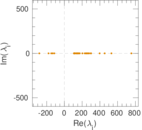
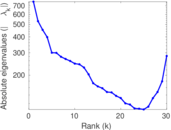
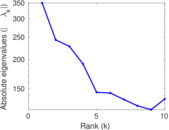
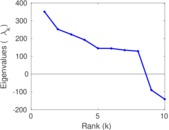
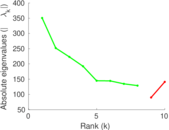
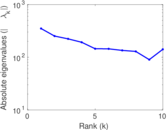
| Spectral norm | α = | 701.451
|
| Operator 2-norm | ν = | 376.459
|
| Cyclic eigenvalue | π = | 336.045
|
| Algebraic connectivity | a = | 0.064 672 2
|
| Reciprocity | y = | 0.284 872
|
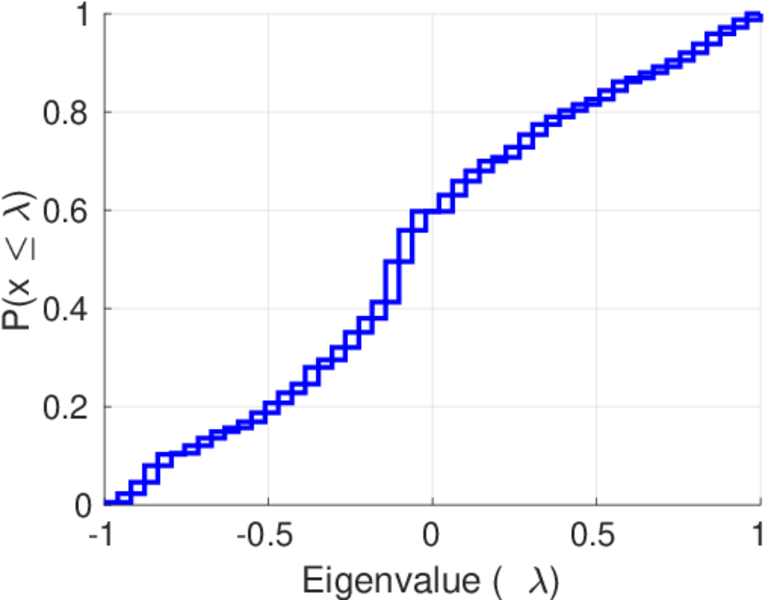
| Non-bipartivity | bA = | 0.590 889
|
| Normalized non-bipartivity | bN = | 0.035 680 6
|
| Spectral bipartite frustration | bK = | 0.000 294 378
|
| Controllability | C = | 17,453
|
| Relative controllability | Cr = | 0.468 927
|
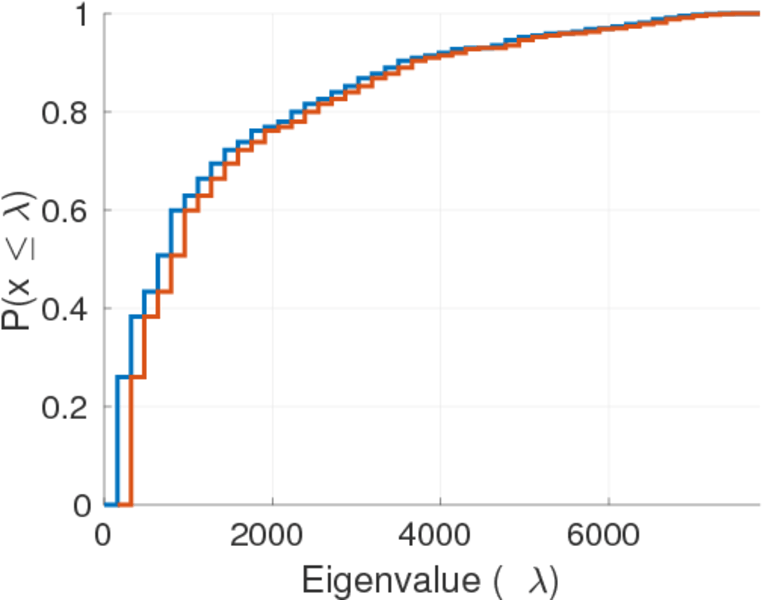
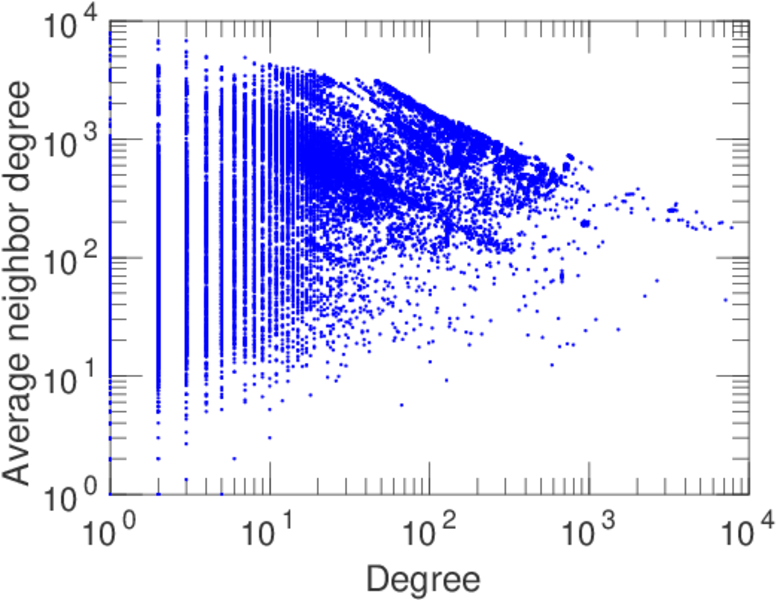
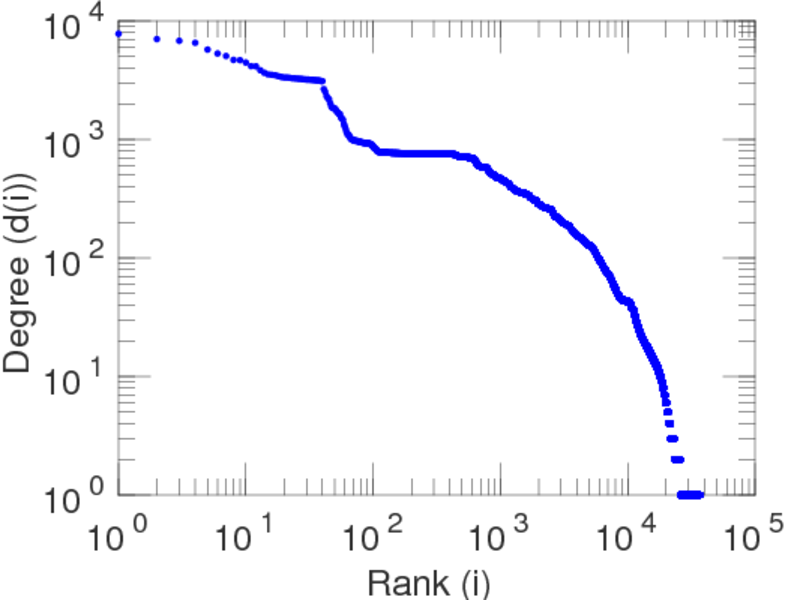
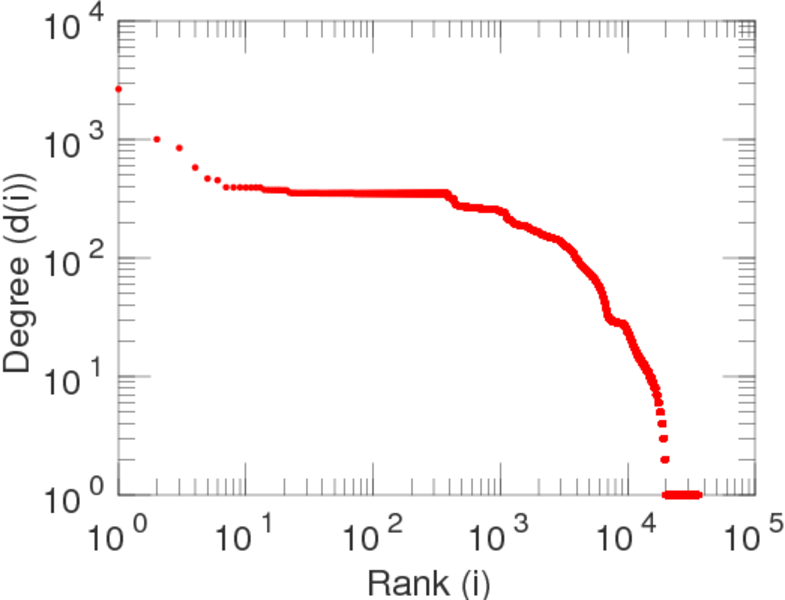
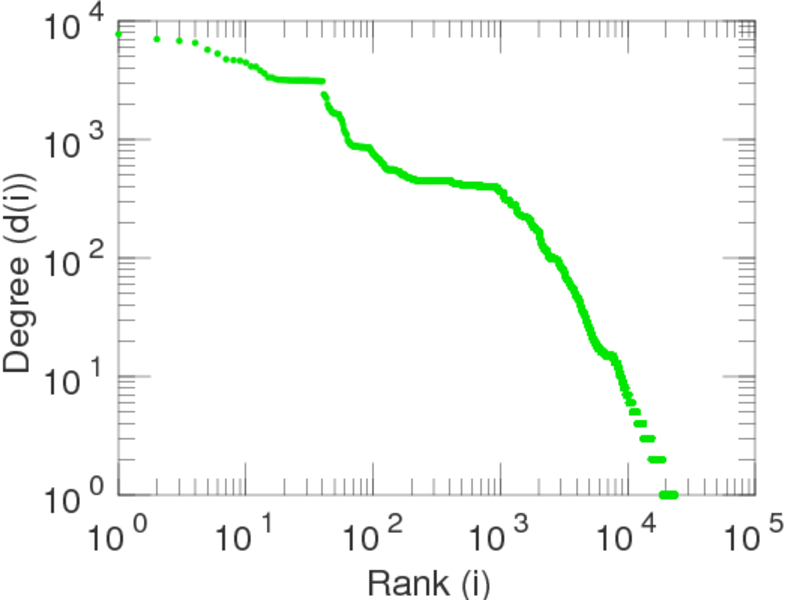
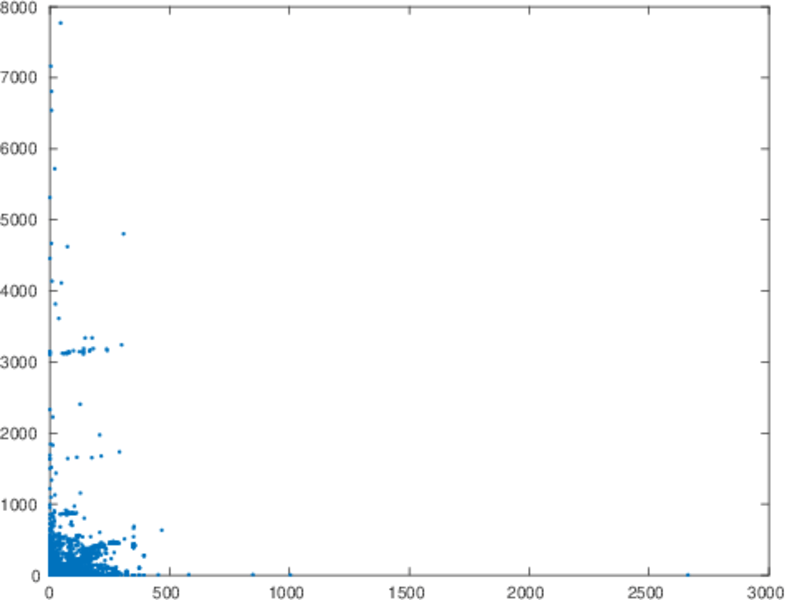
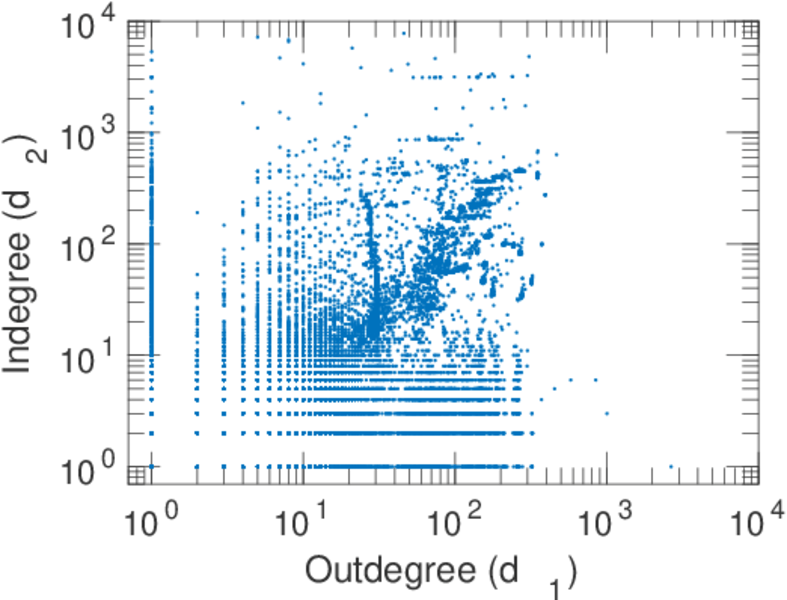
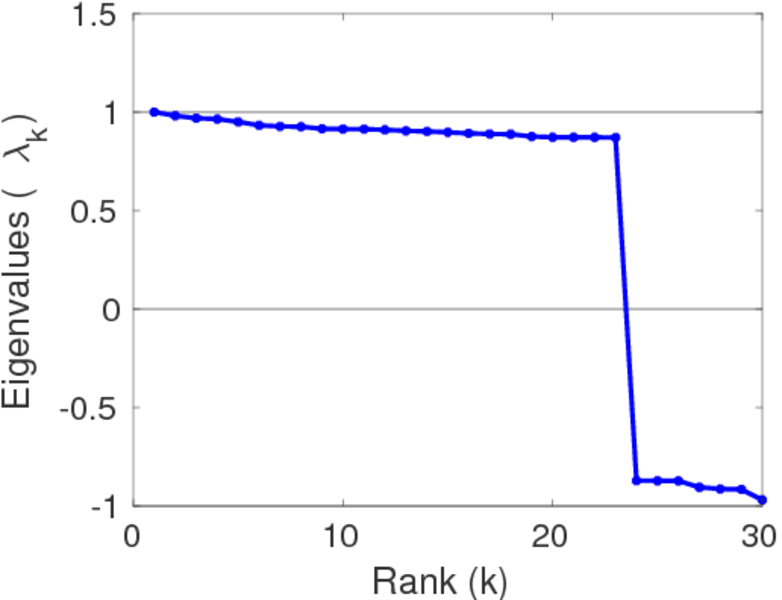
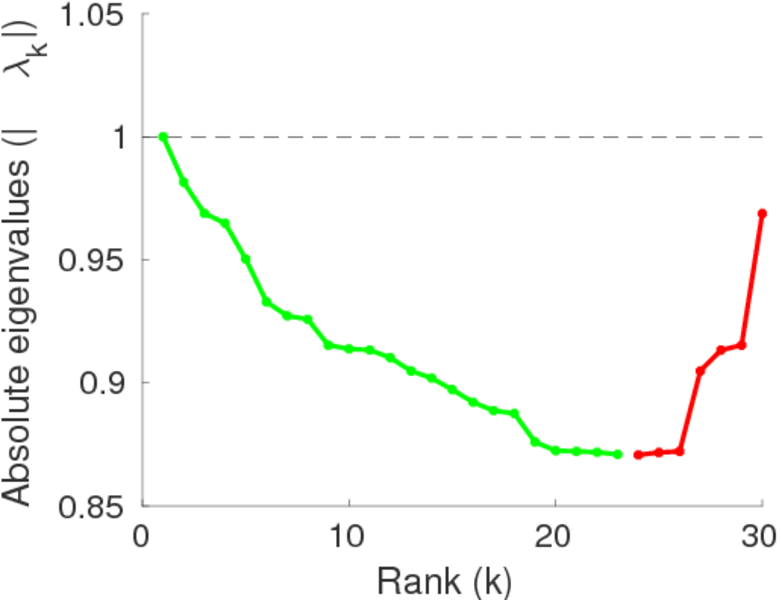
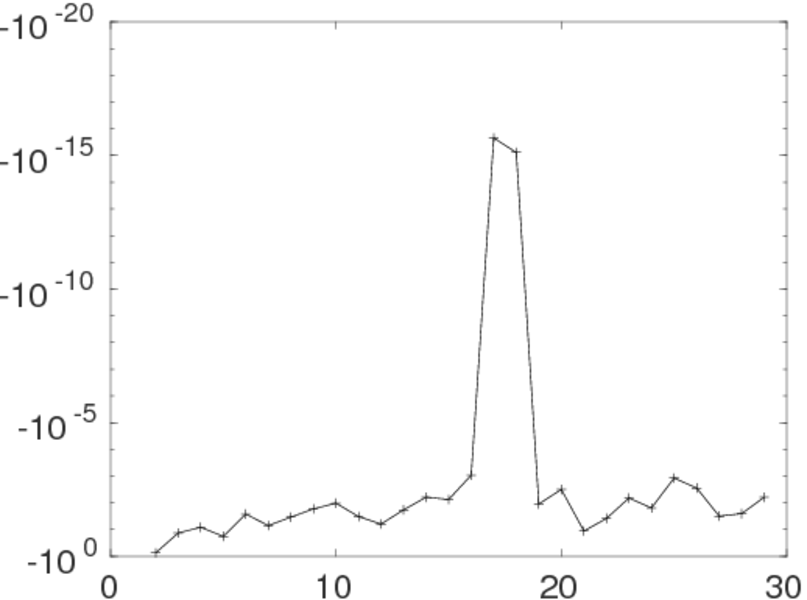
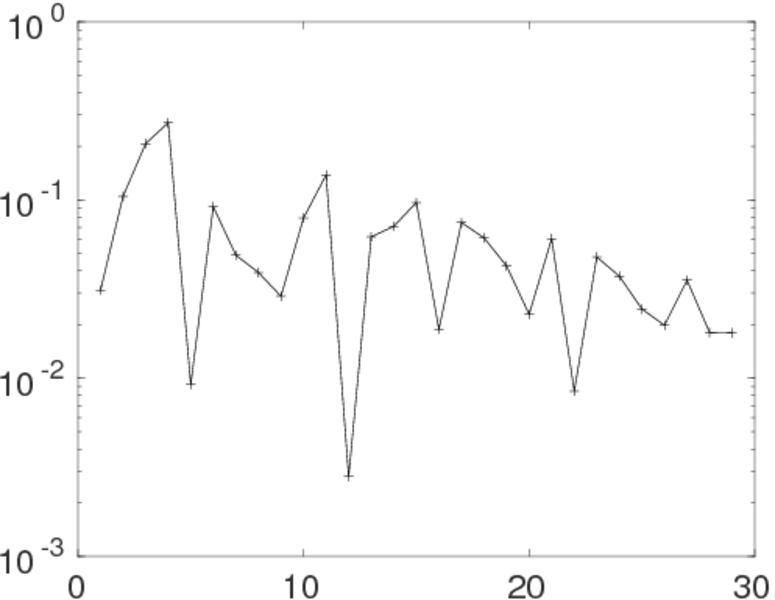
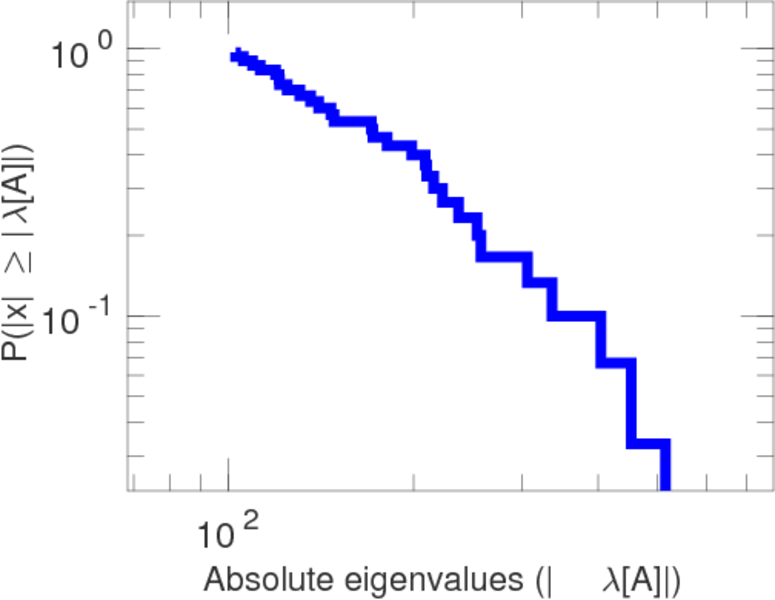
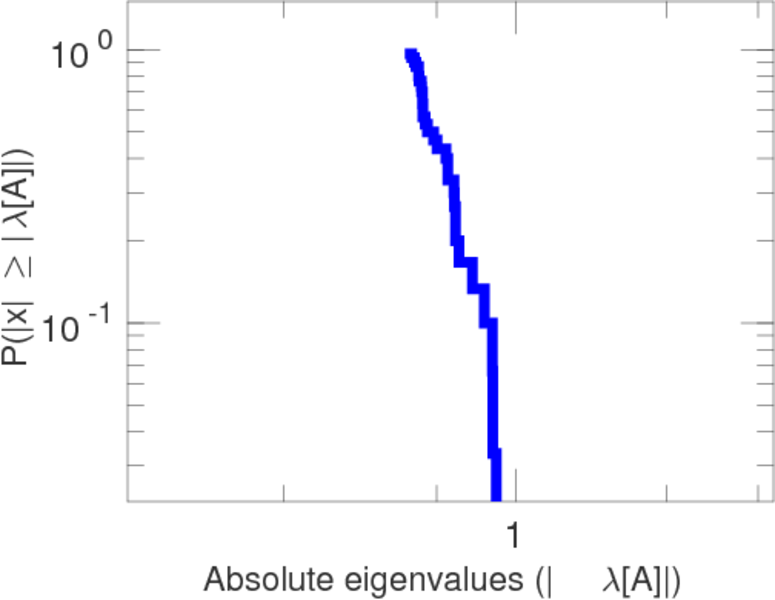
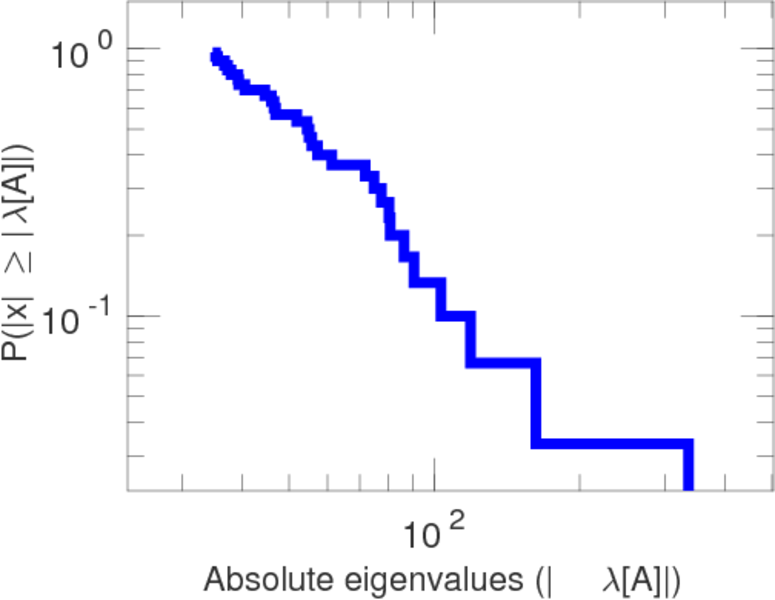
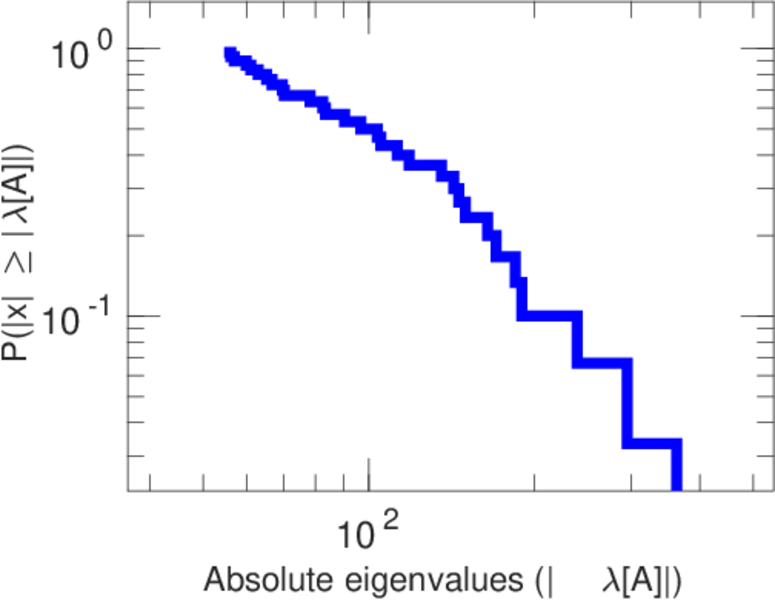
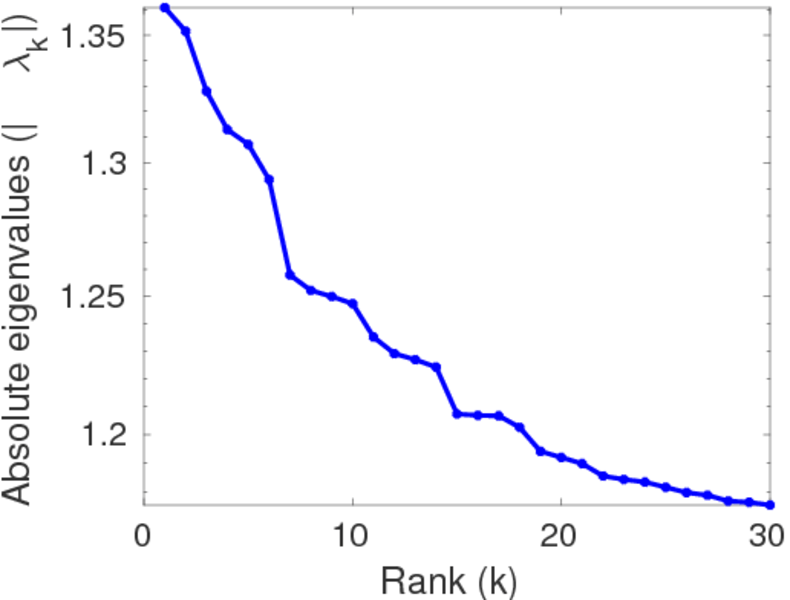
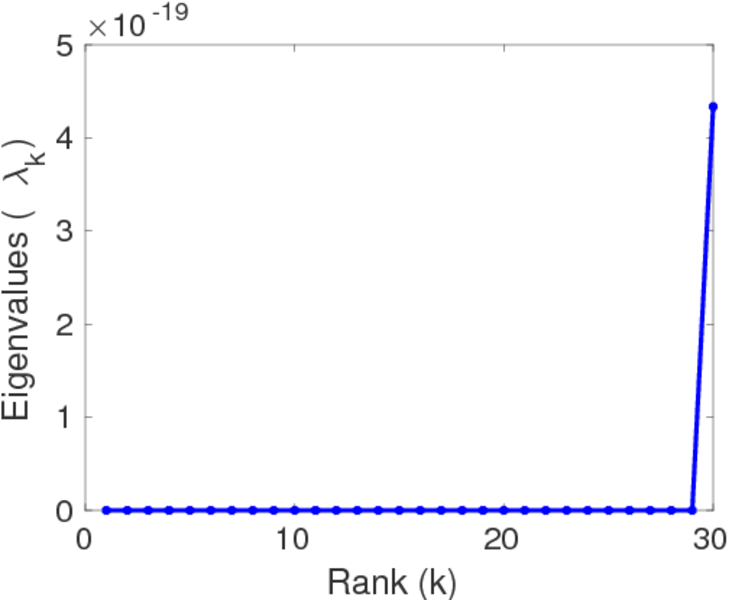
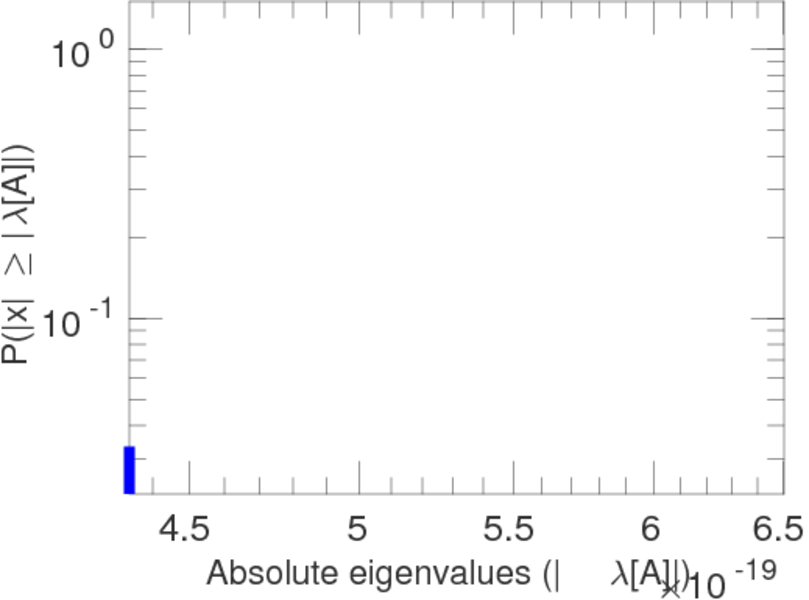
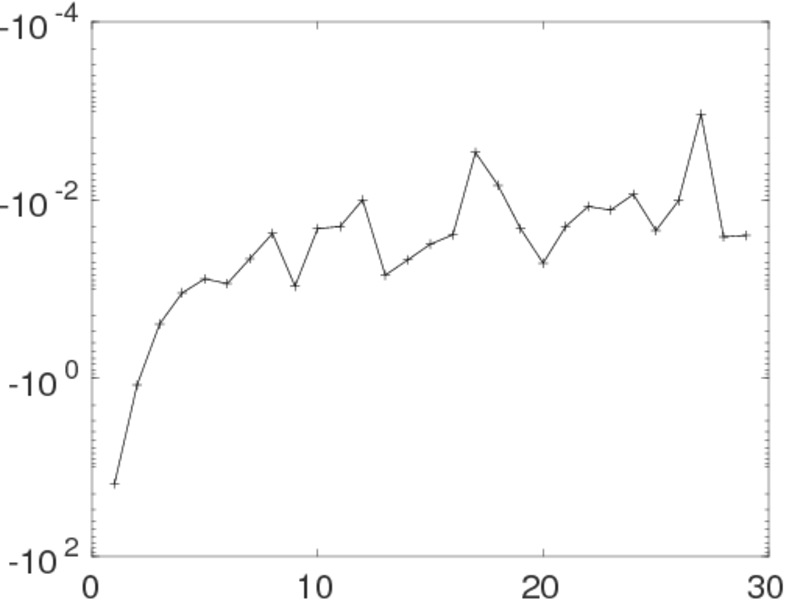
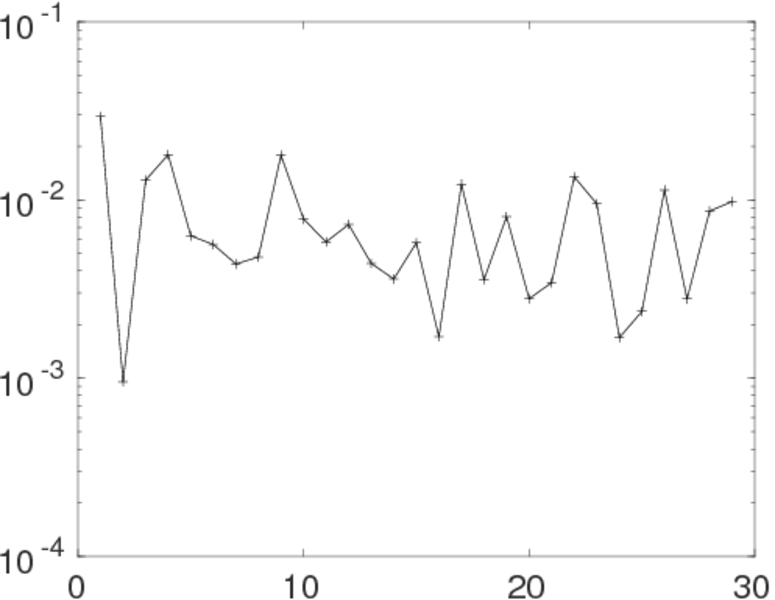
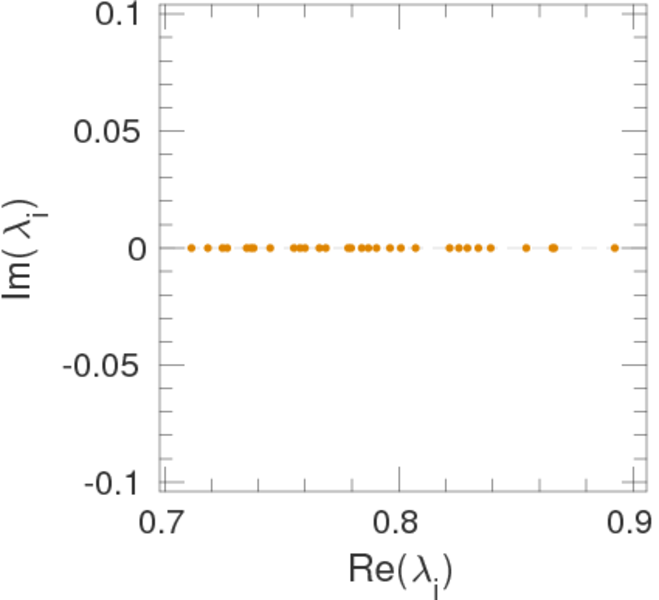
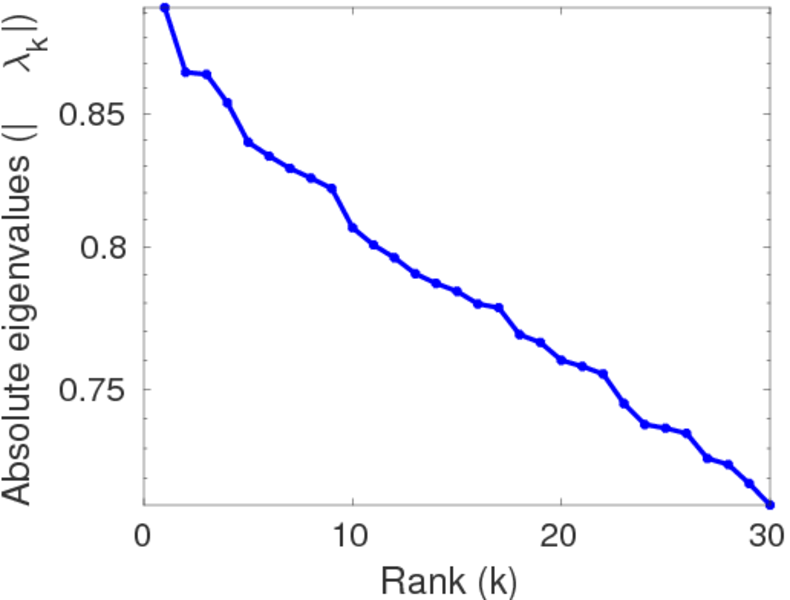
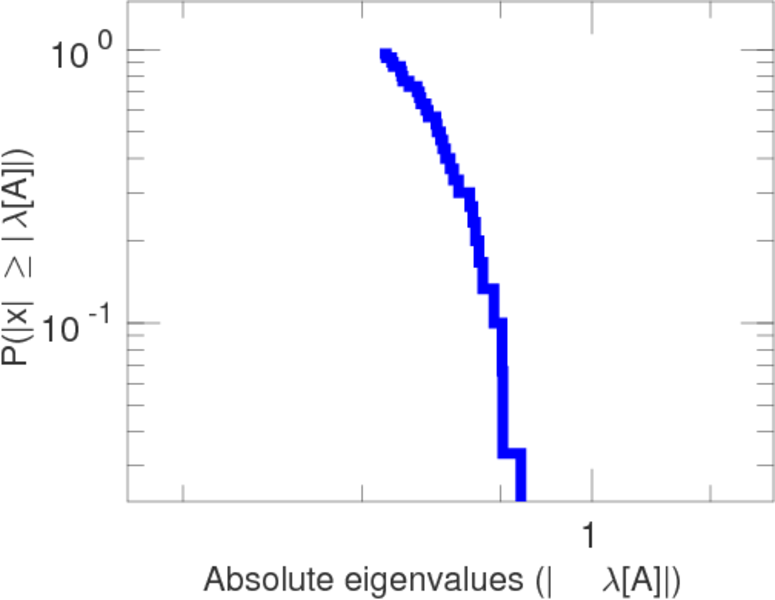
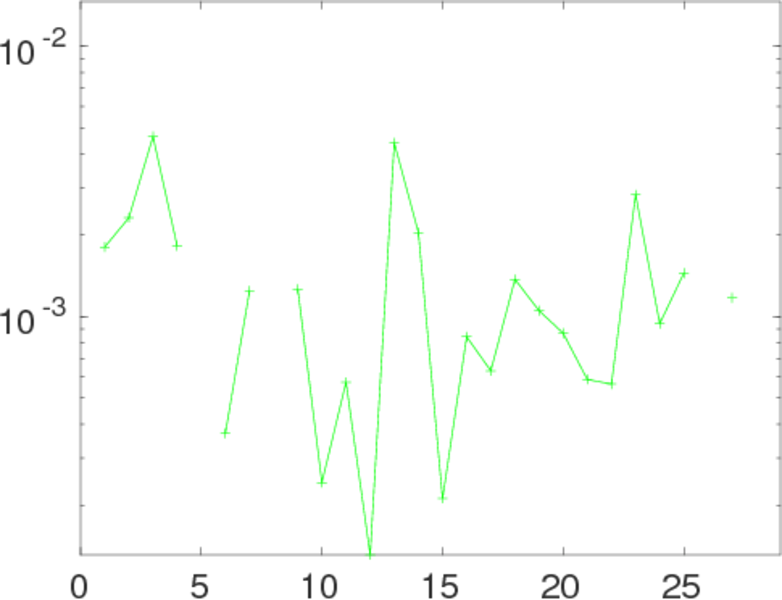
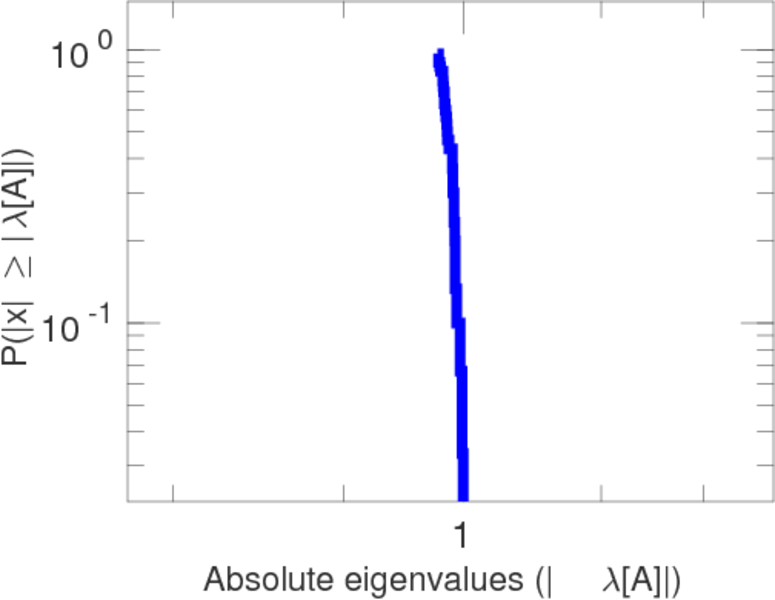
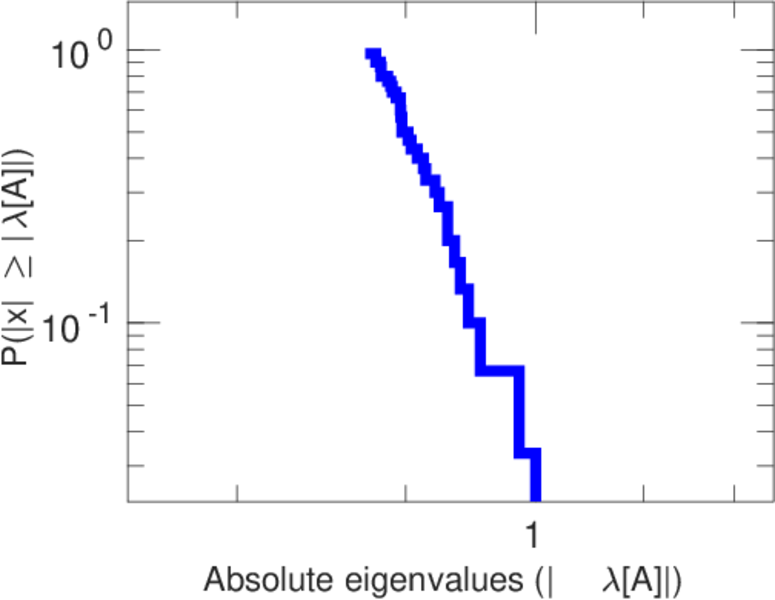
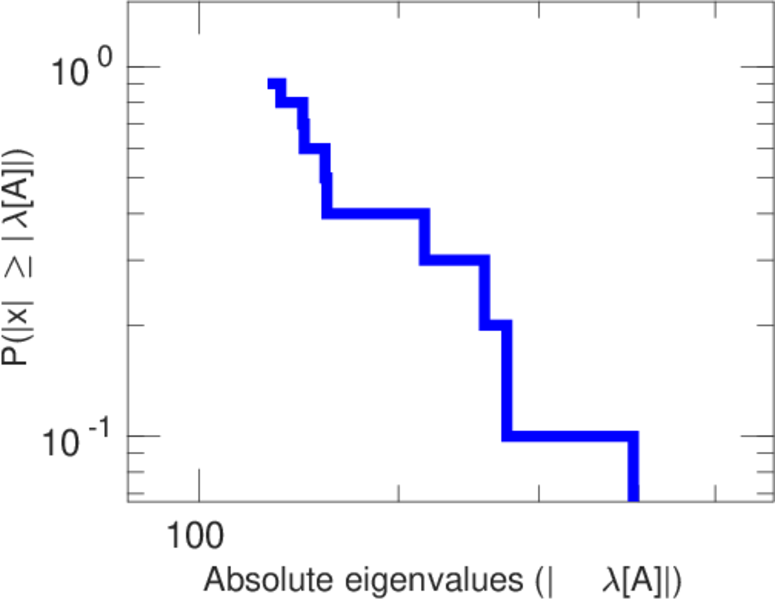
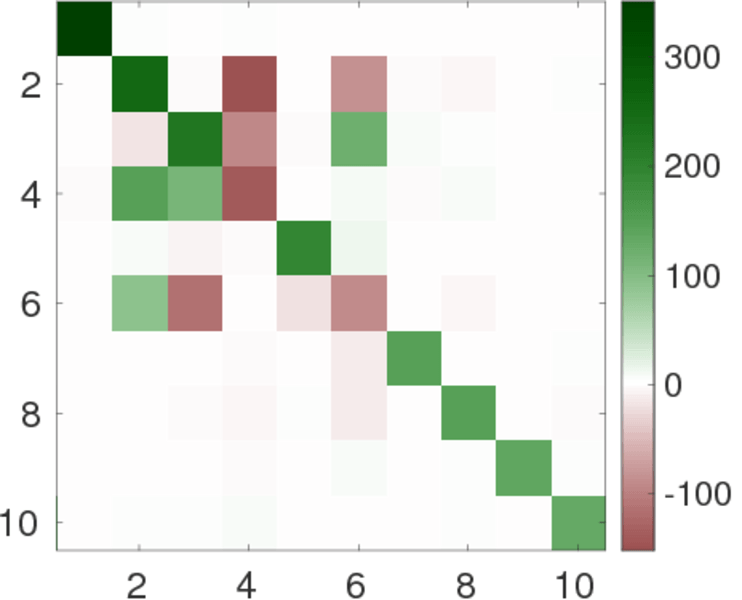
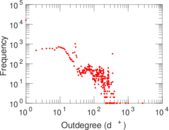
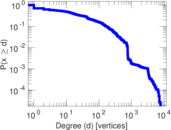
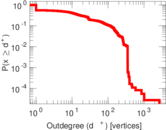
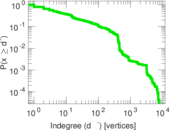
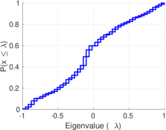
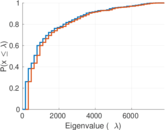
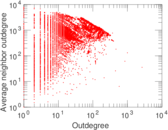
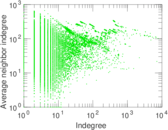
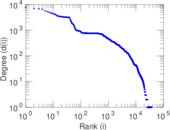
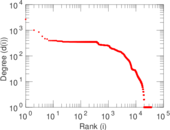
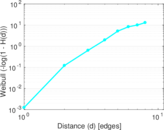
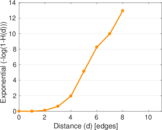
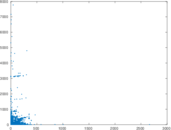
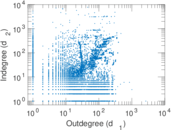
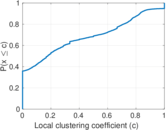
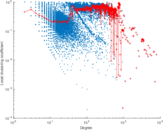
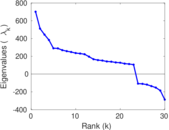
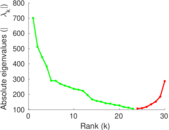
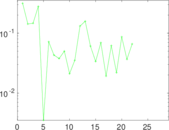
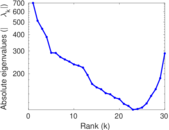
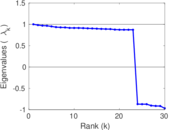
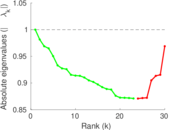
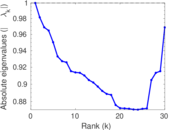
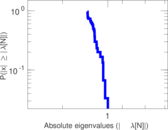
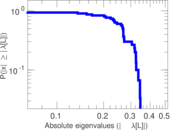
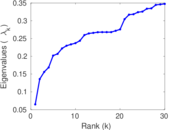
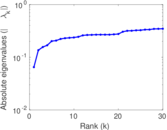
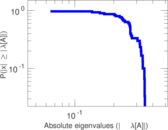
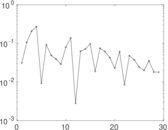
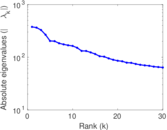
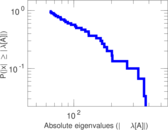
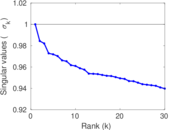
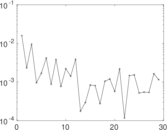
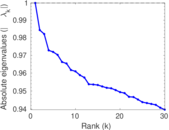
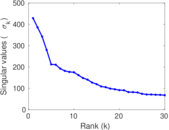
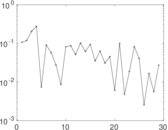
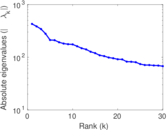
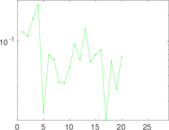
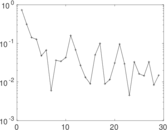
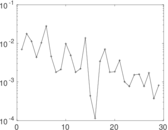
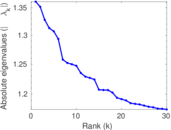
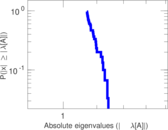
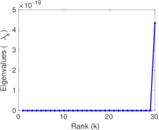
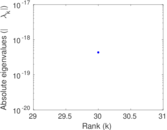
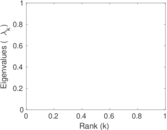
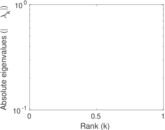
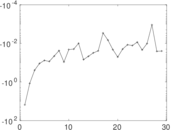
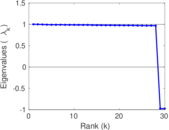
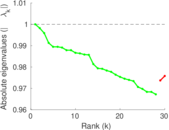
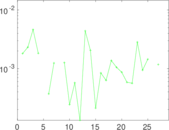
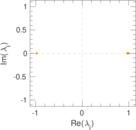
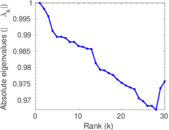
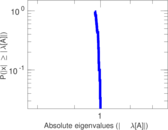
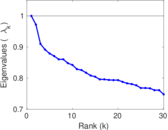
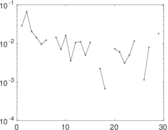
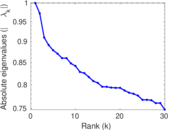
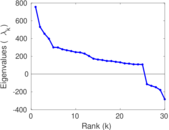
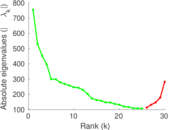
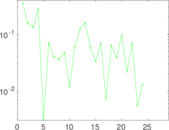
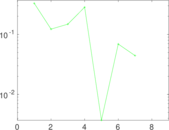
Plots


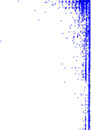

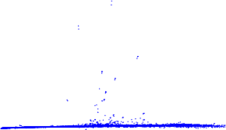


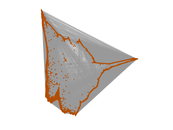


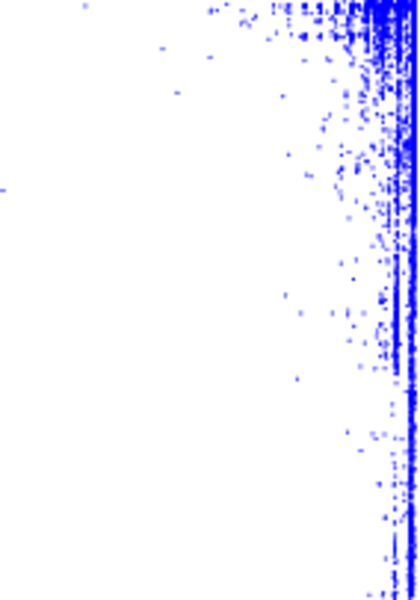
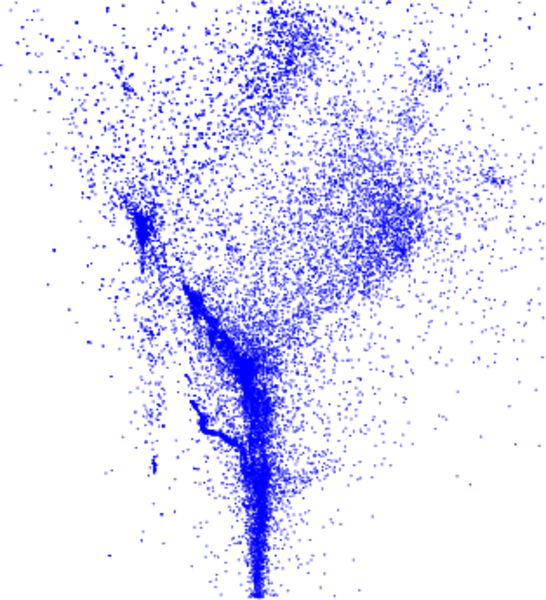
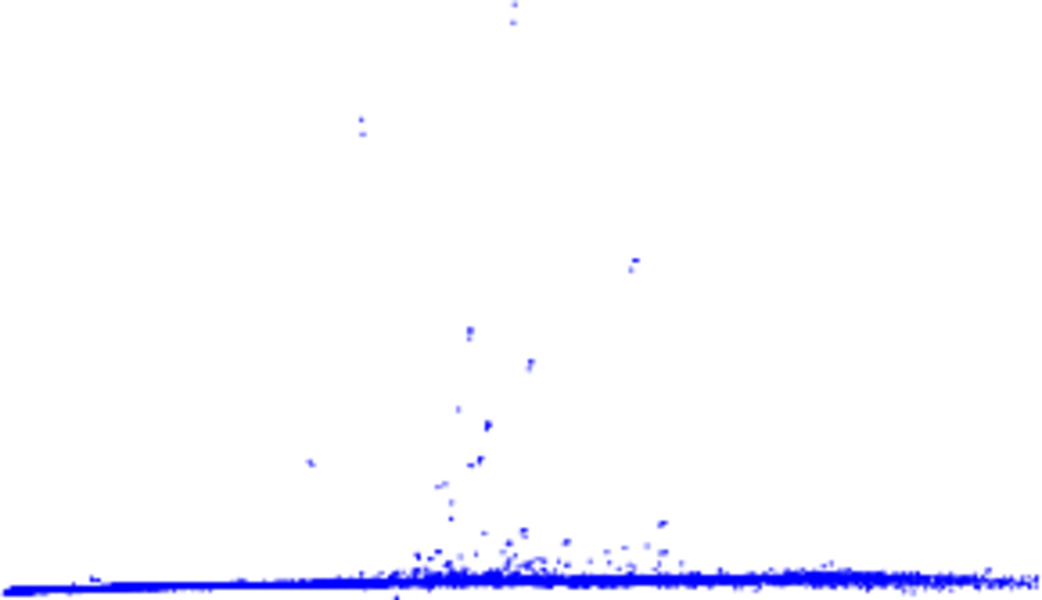
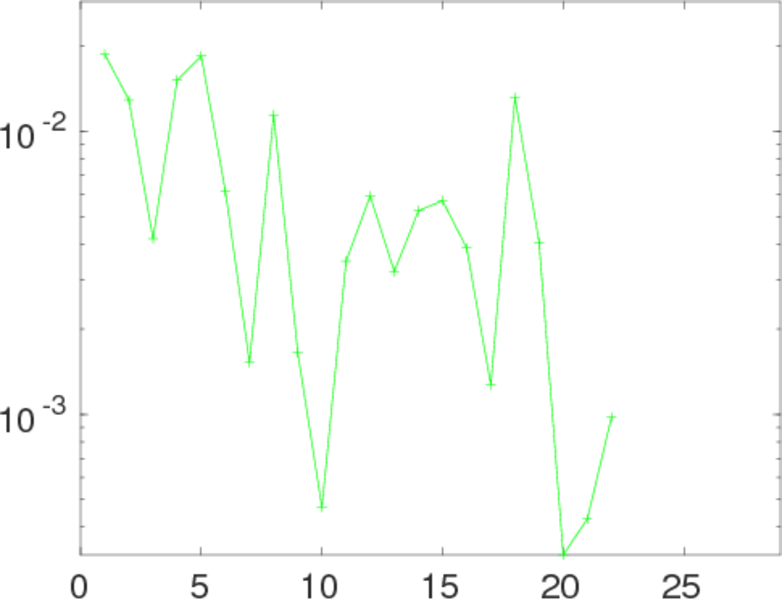
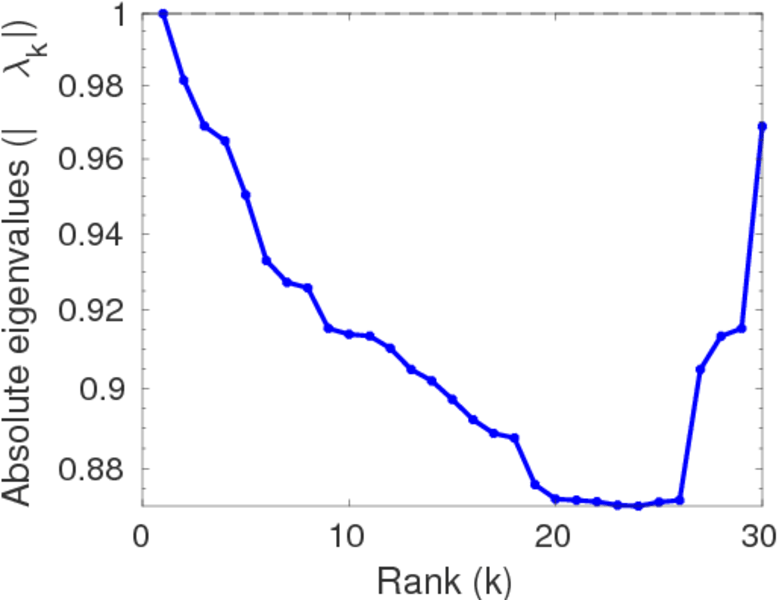
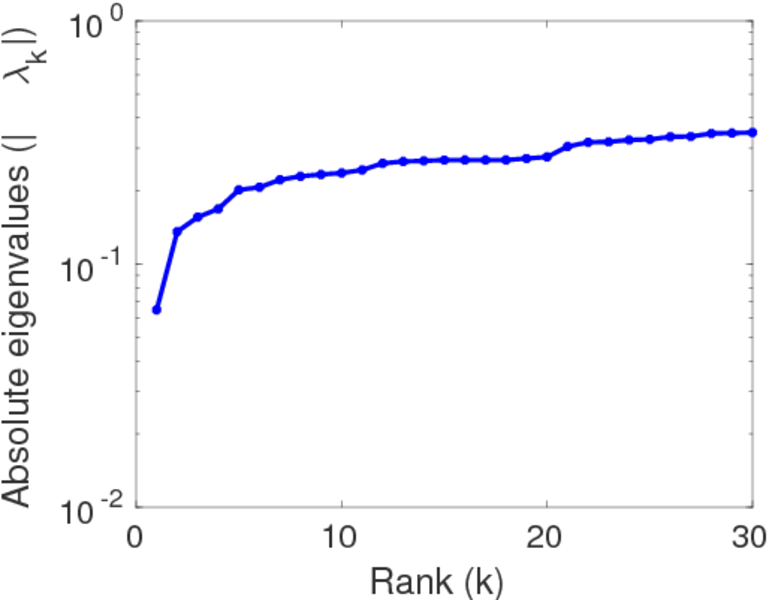
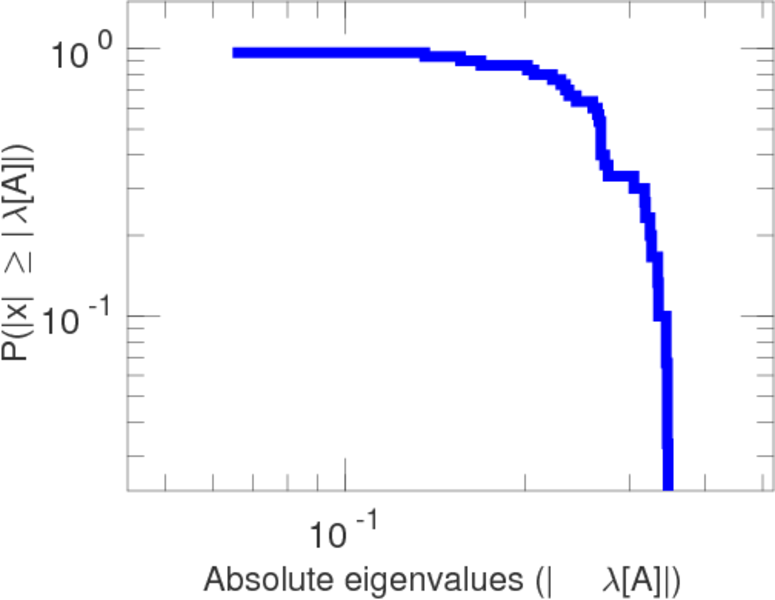
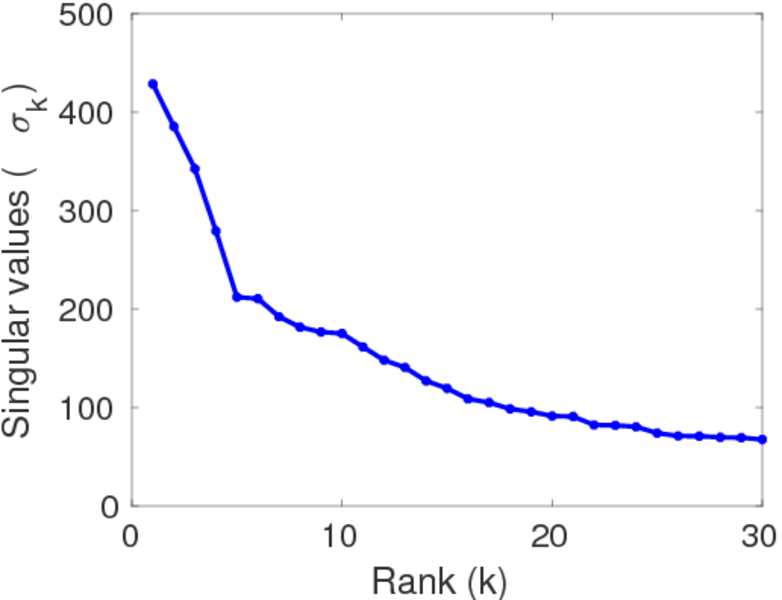
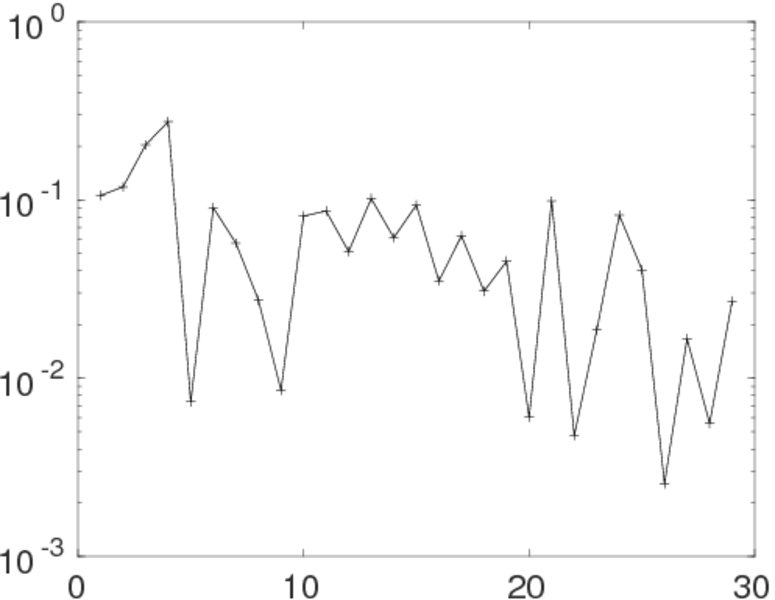
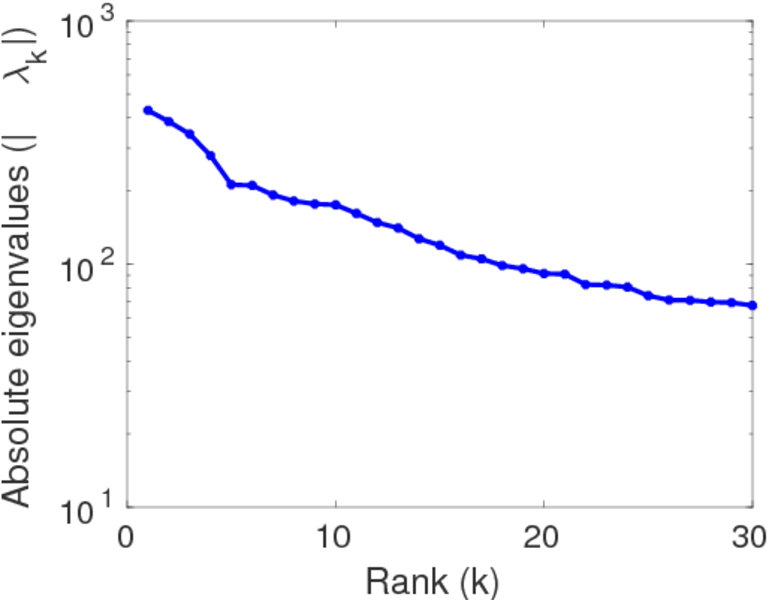
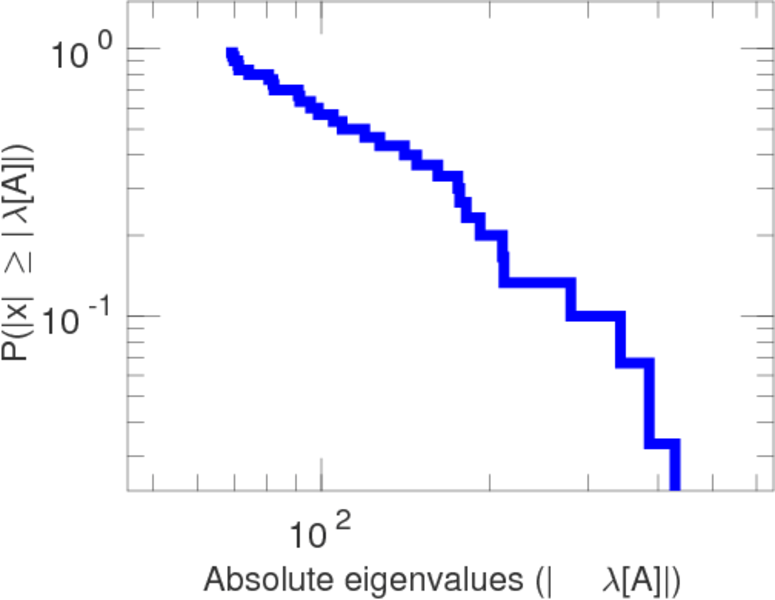
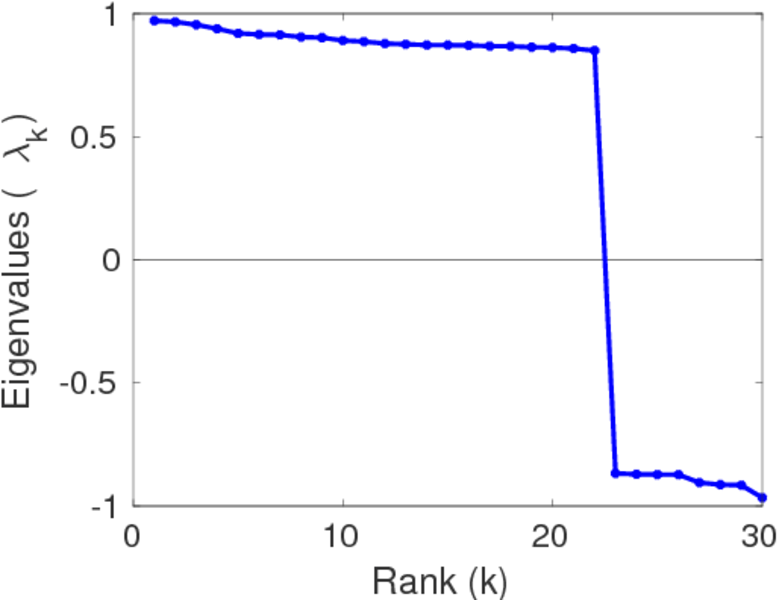
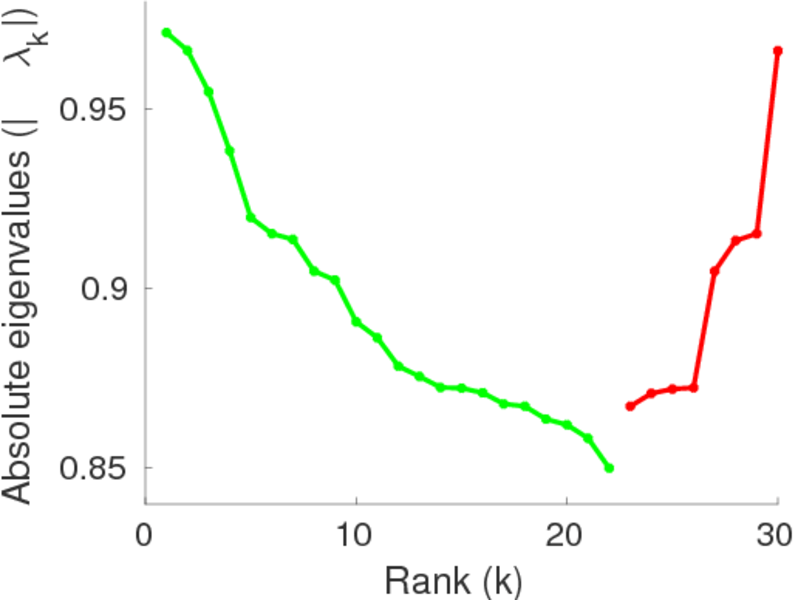
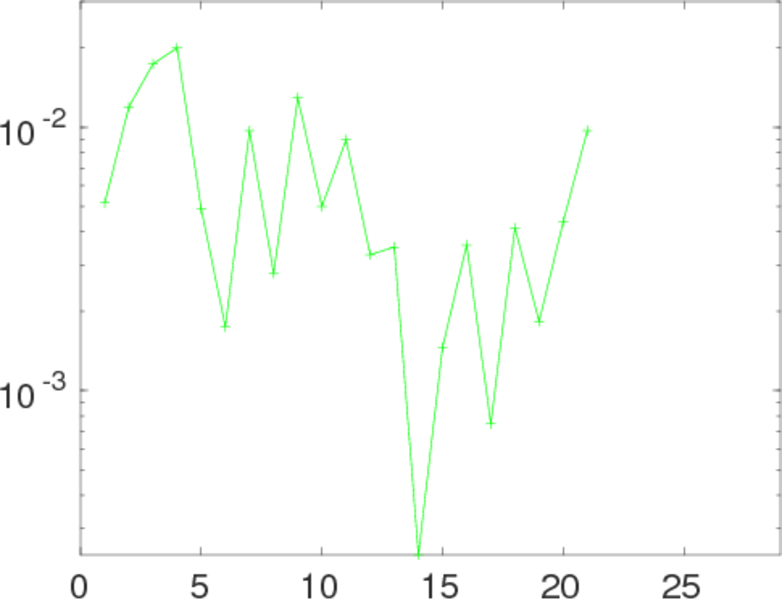
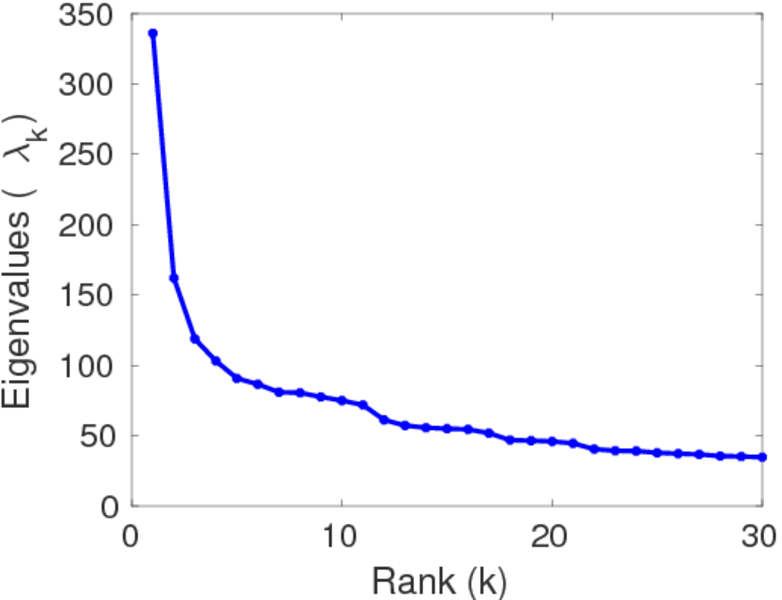
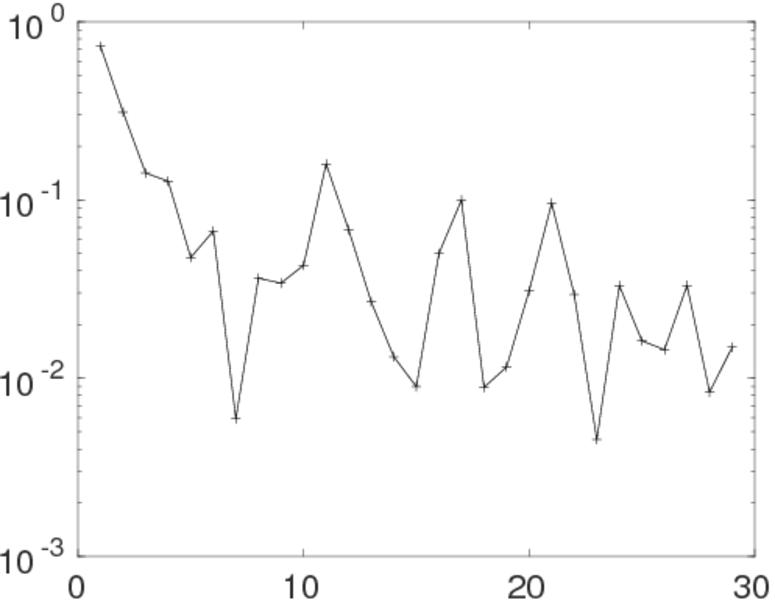
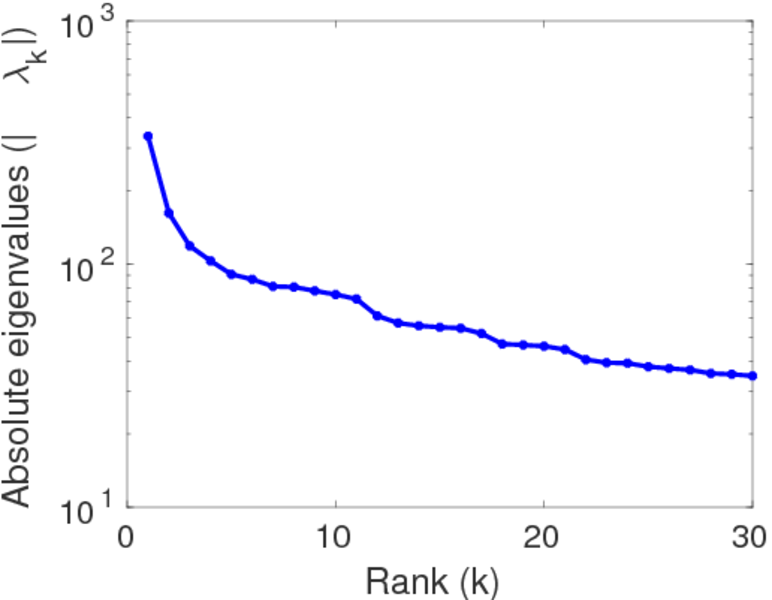
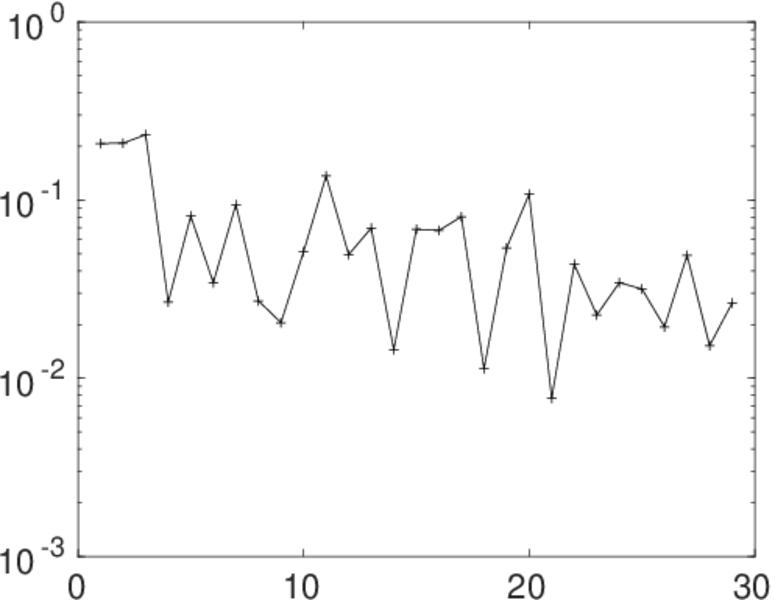
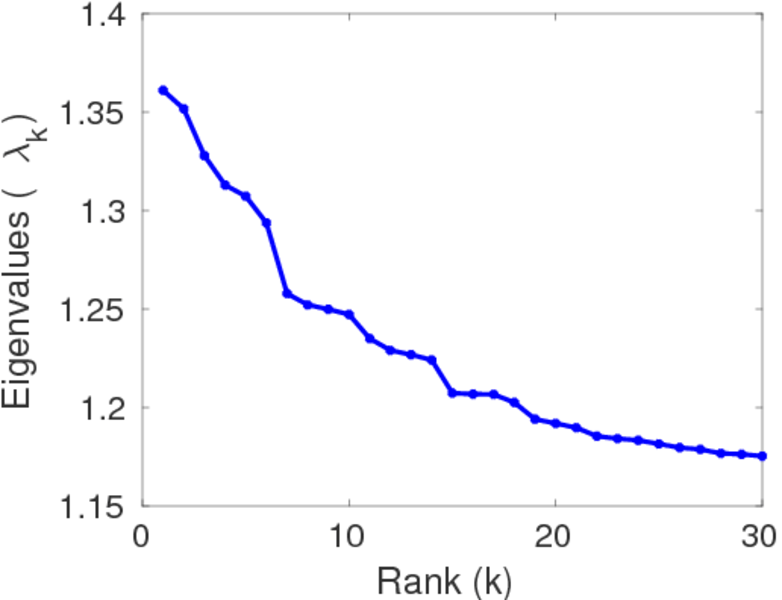
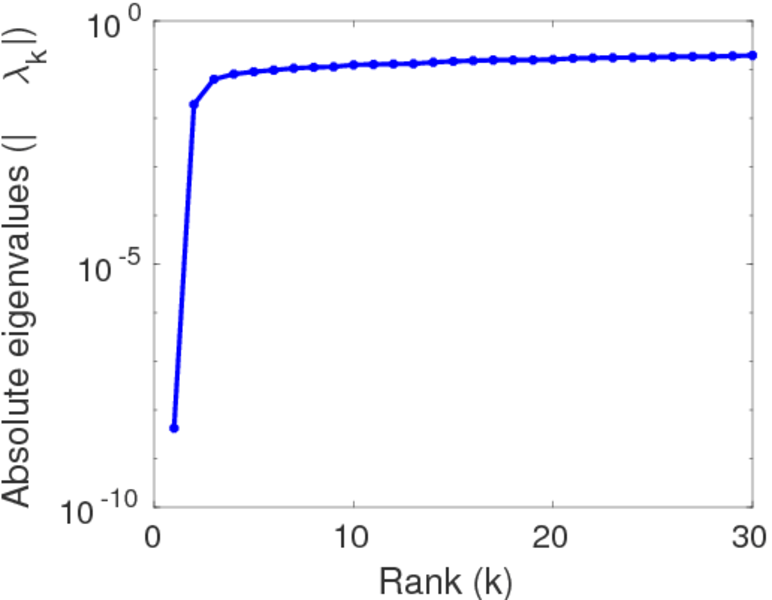
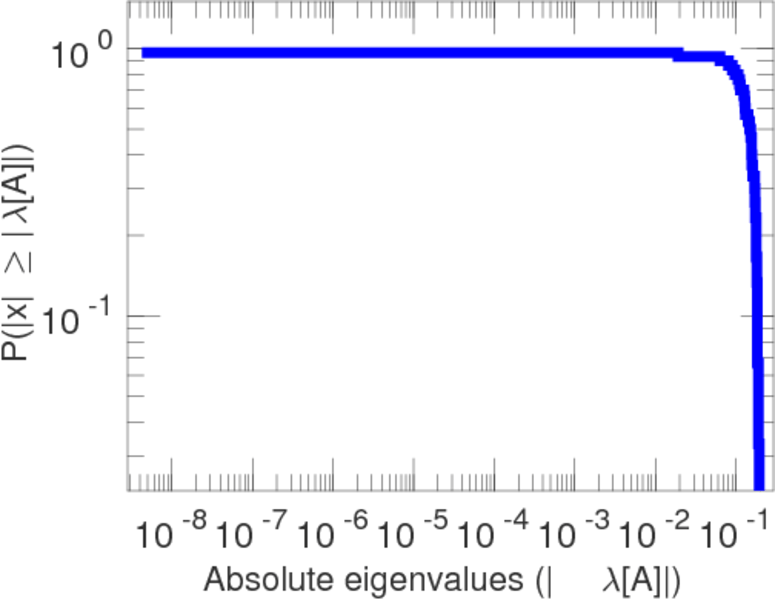
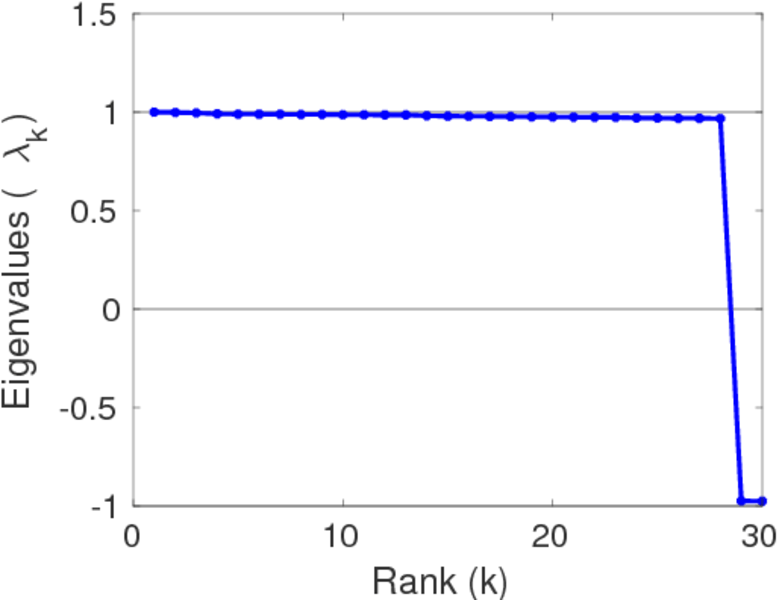
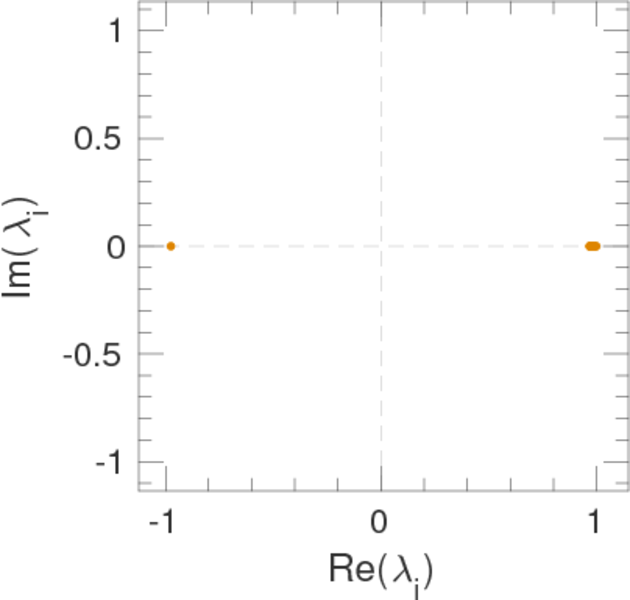
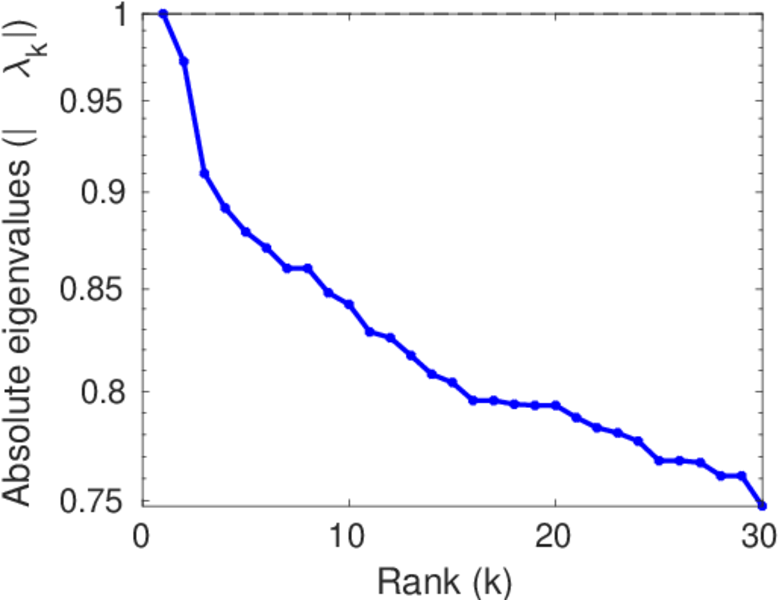
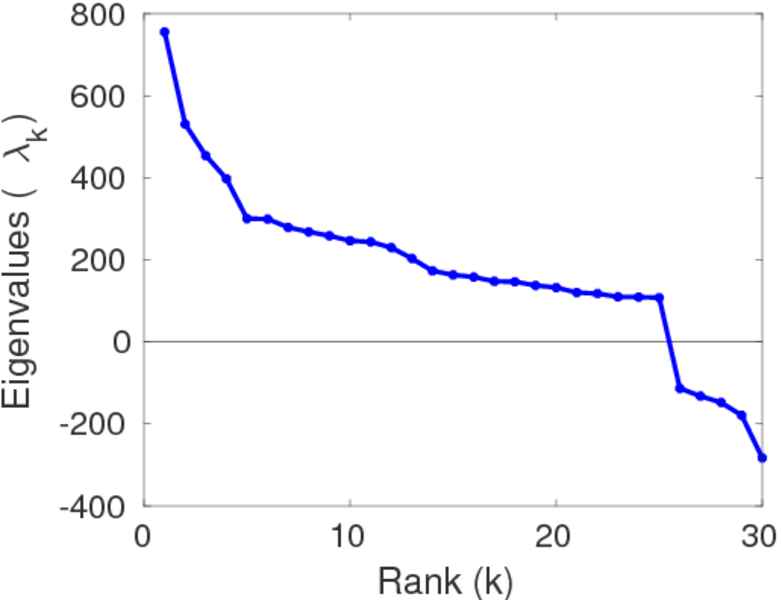
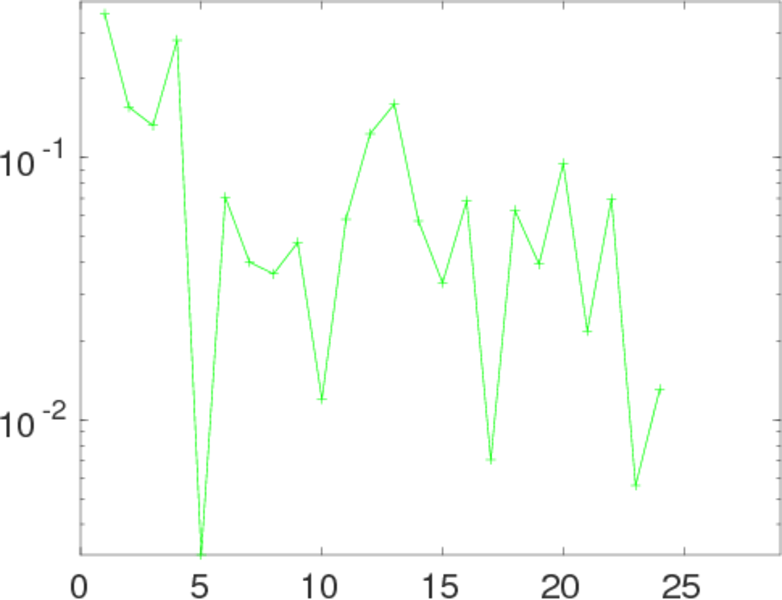
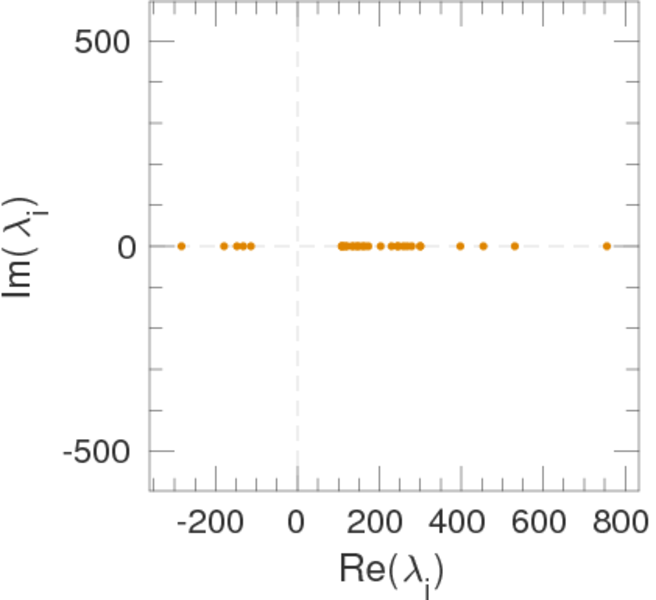
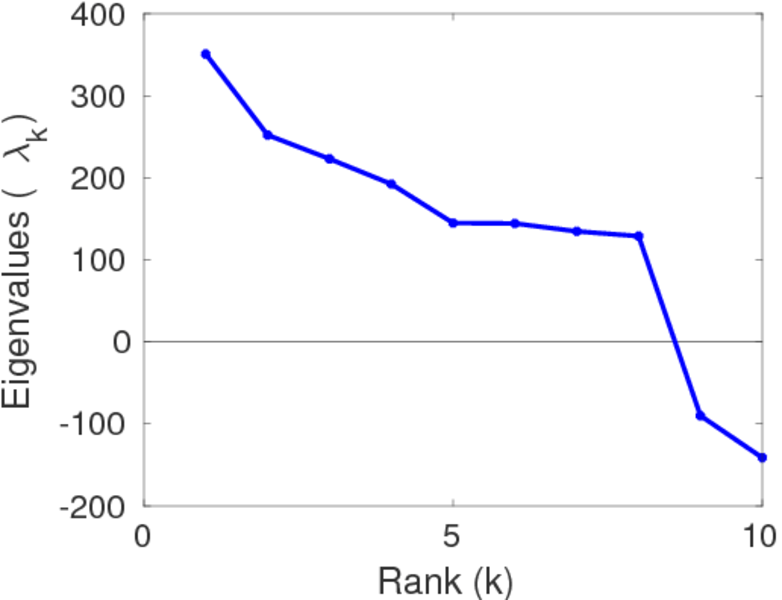
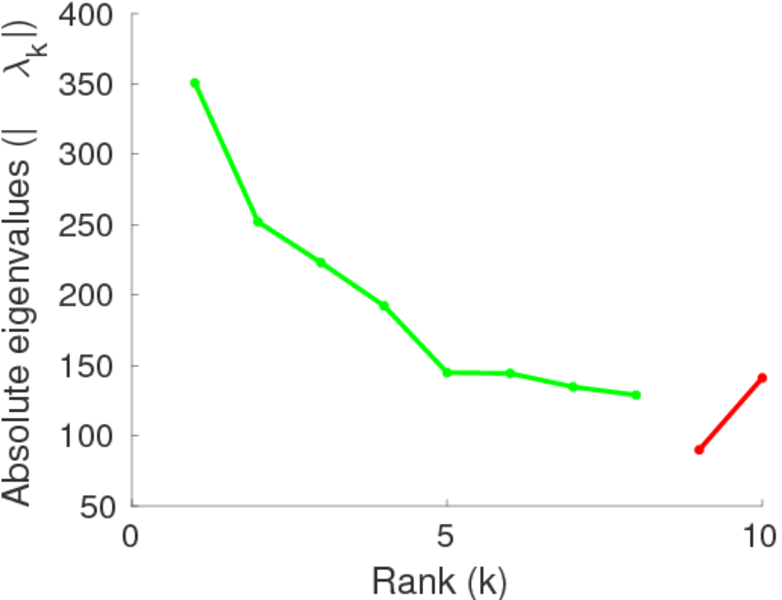
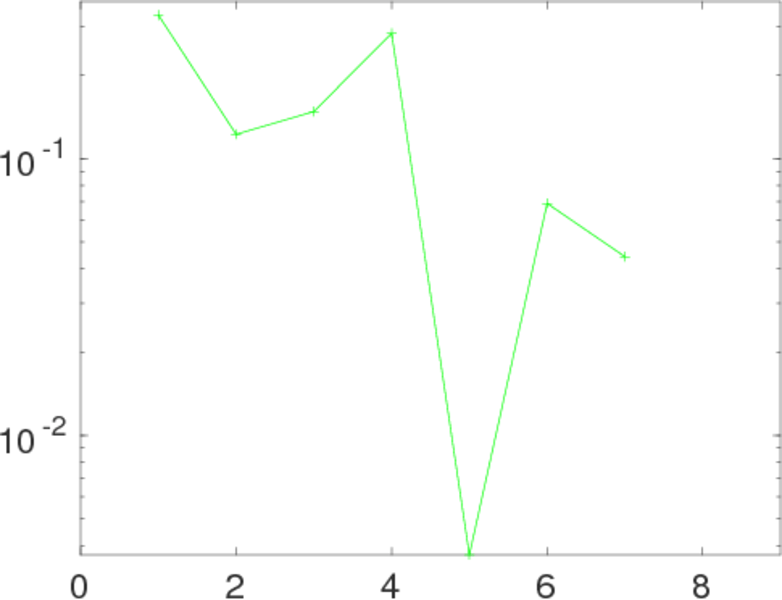
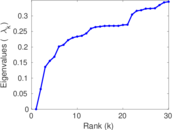
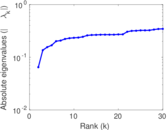
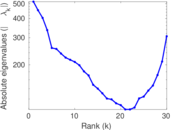
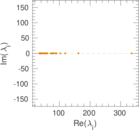
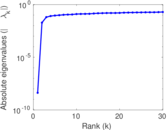
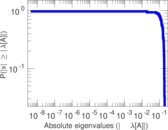
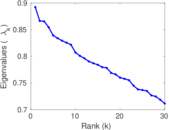
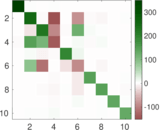
Matrix decompositions plots


Downloads
References
|
[1]
|
Jérôme Kunegis.
KONECT – The Koblenz Network Collection.
In Proc. Int. Conf. on World Wide Web Companion, pages
1343–1350, 2013.
[ http ]
|
 KONECT ‣ Networks ‣
Buy Me a Coffee
KONECT ‣ Networks ‣
Buy Me a Coffee