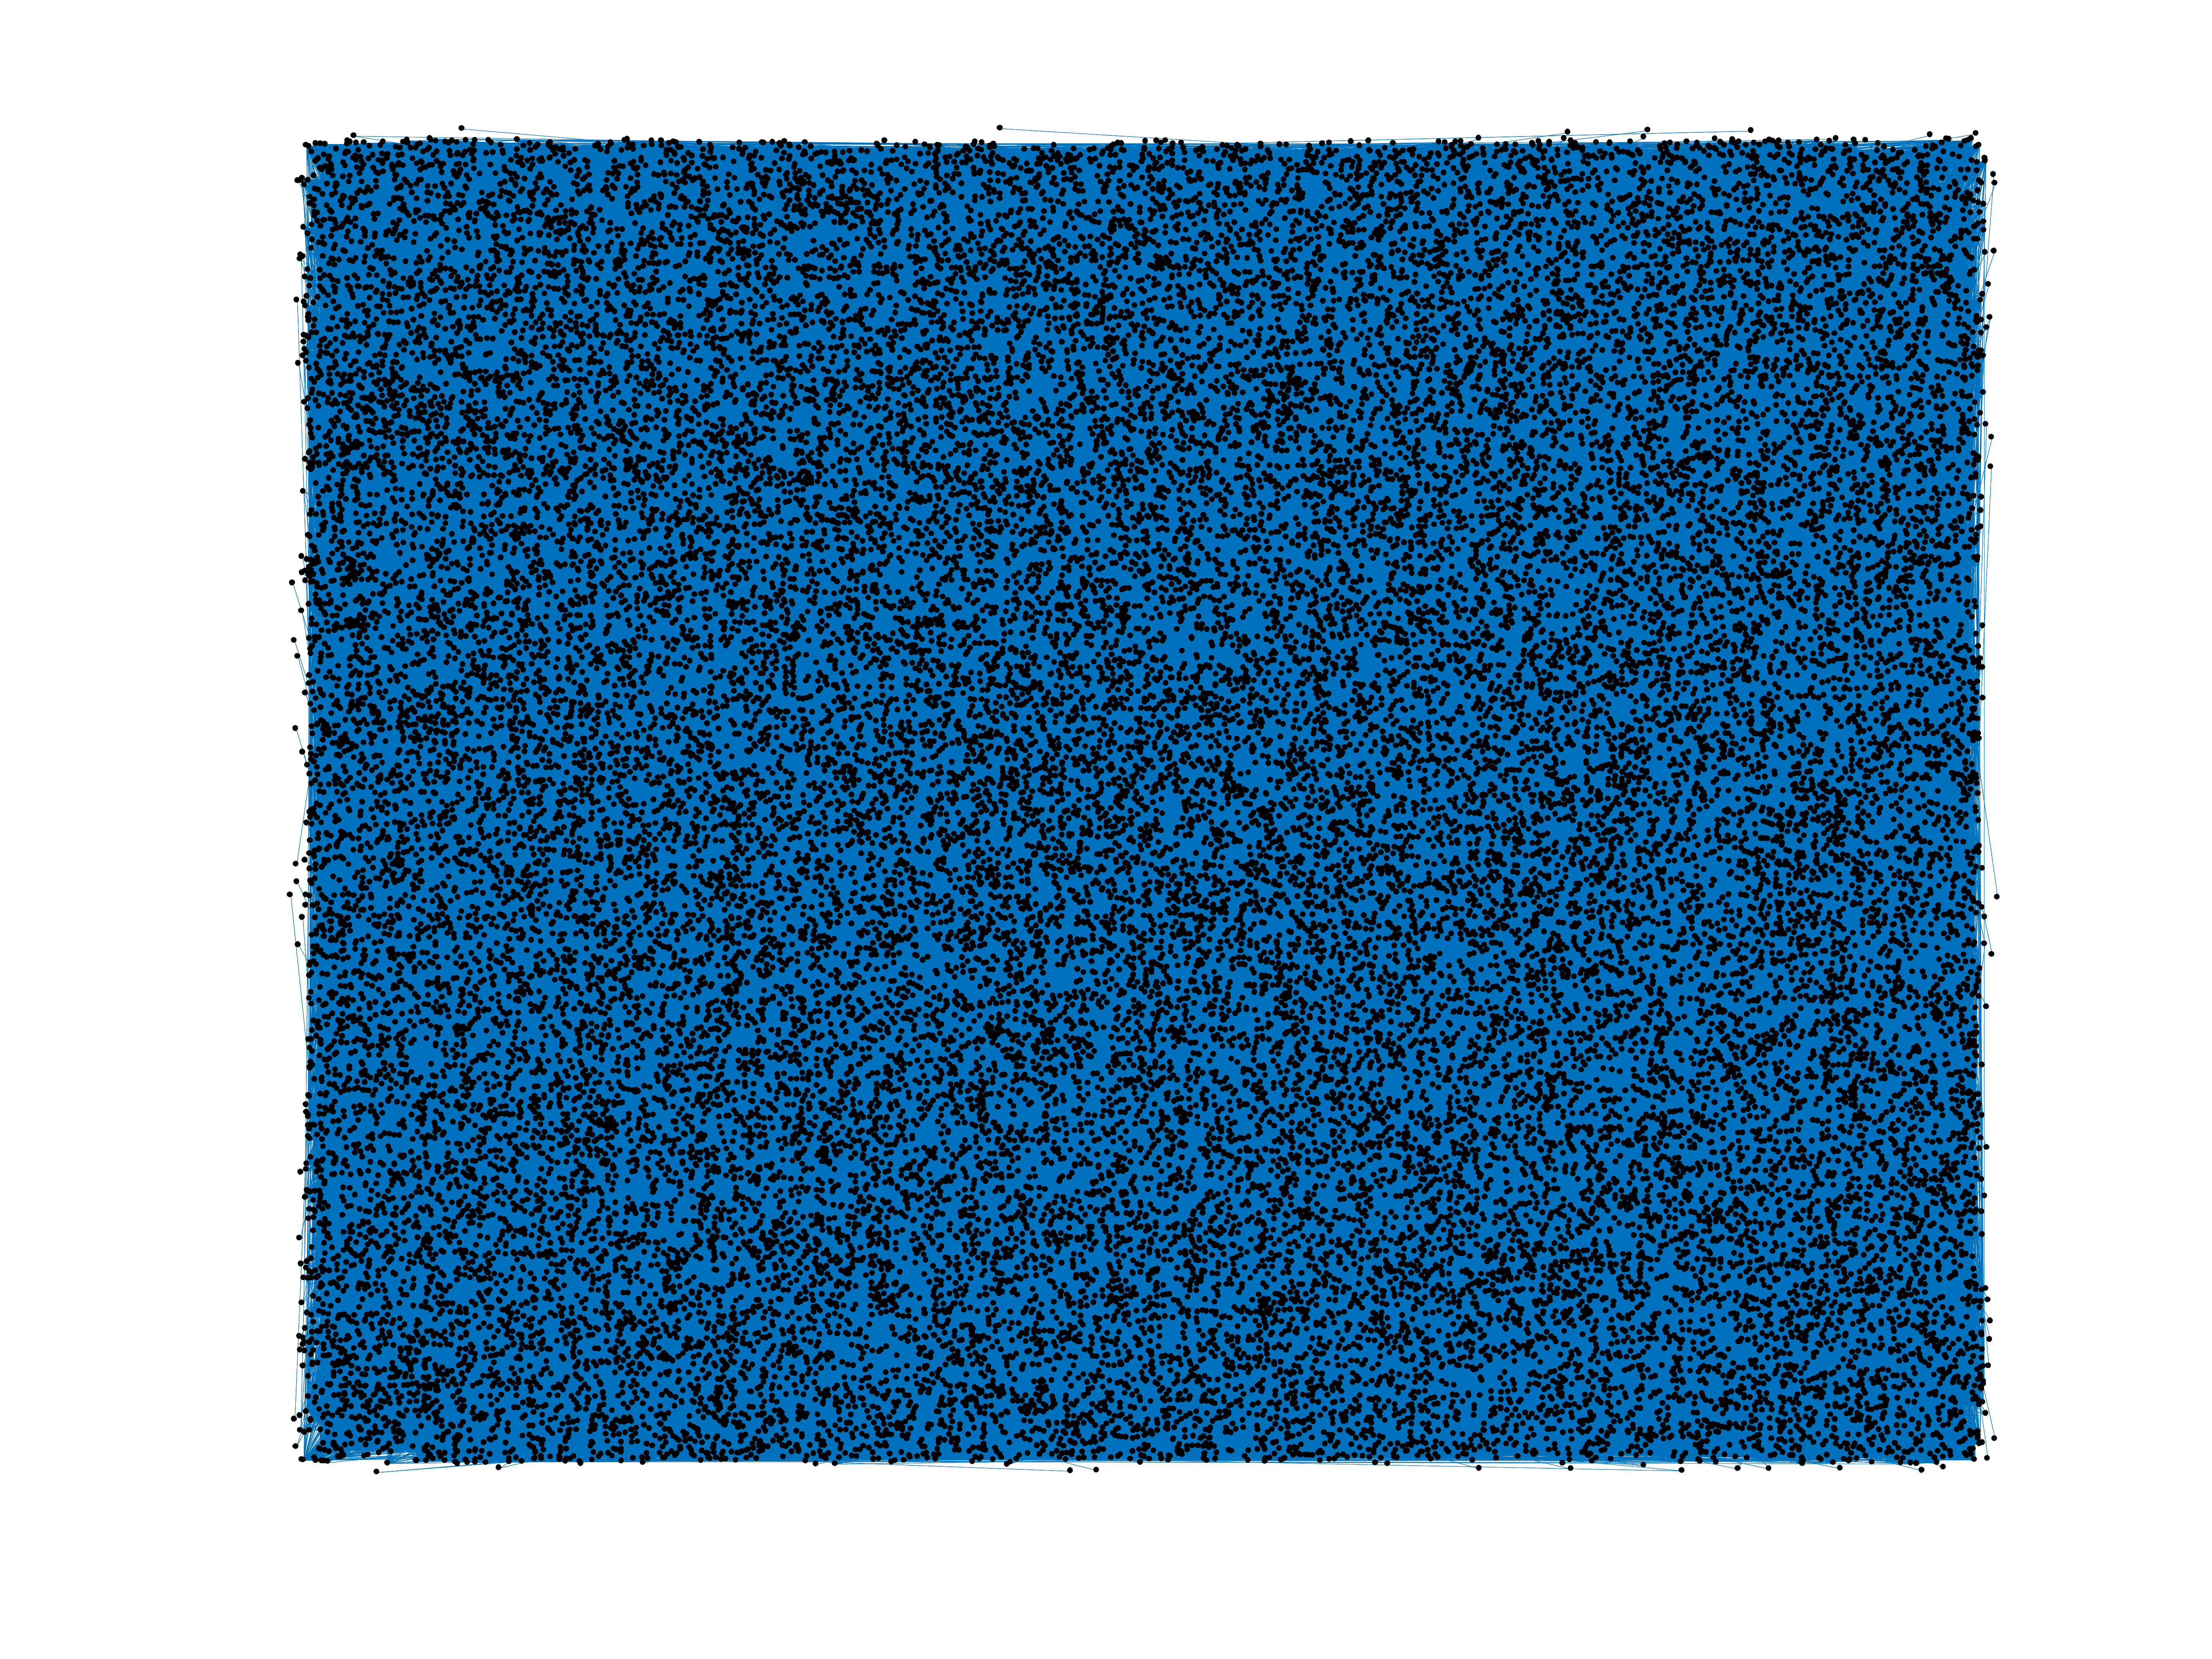
Wikipedia links (scn)
This network consists of the wikilinks of the Wikipedia in the Sicilian
language (scn). Nodes are Wikipedia articles, and directed edges are
wikilinks, i.e., hyperlinks within one wiki. In the wiki source, these are
indicated with [[double brackets]]. Only pages in the article namespace are
included.
Metadata
Statistics
| Size | n = | 39,957
|
| Volume | m = | 1,182,785
|
| Wedge count | s = | 133,663,093
|
| Claw count | z = | 72,619,669,411
|
| Cross count | x = | 34,262,549,581,314
|
| Triangle count | t = | 29,676,577
|
| Square count | q = | 4,549,805,363
|
| 4-Tour count | T4 = | 36,934,567,730
|
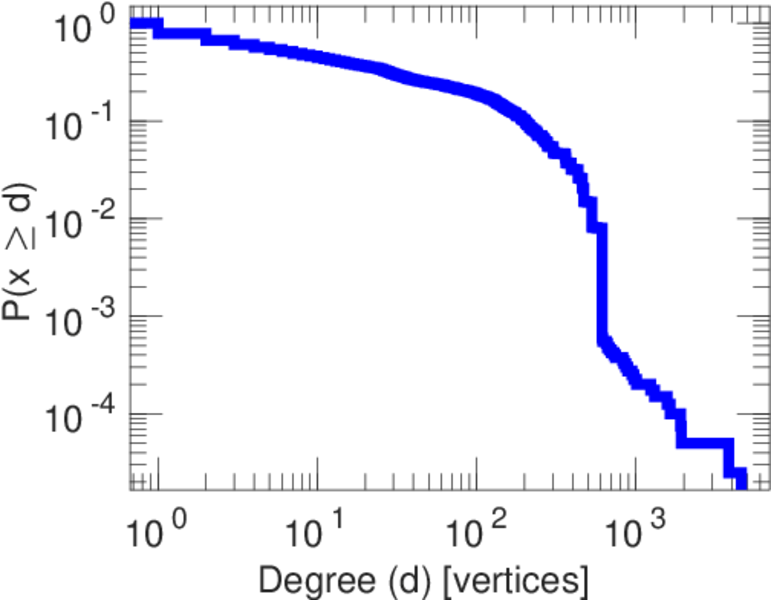
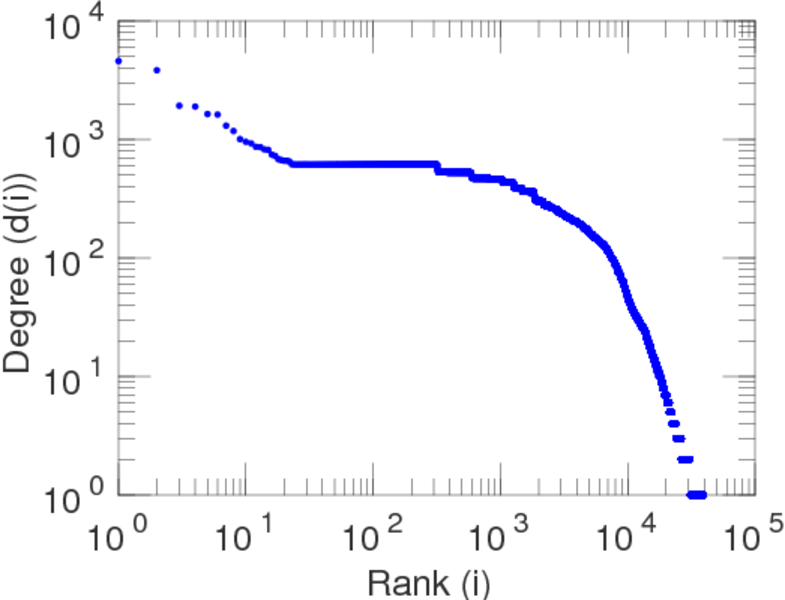
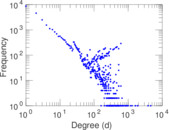
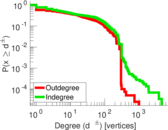
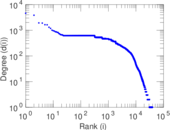
| Maximum degree | dmax = | 4,592
|
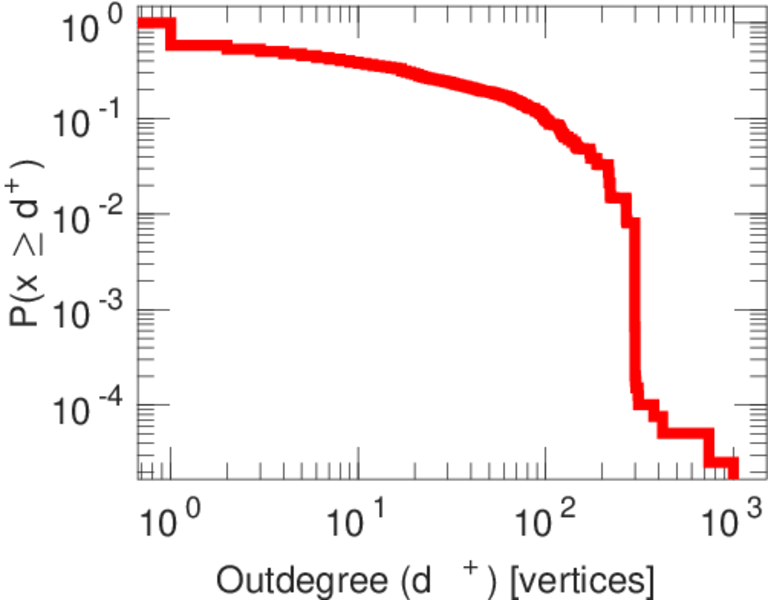
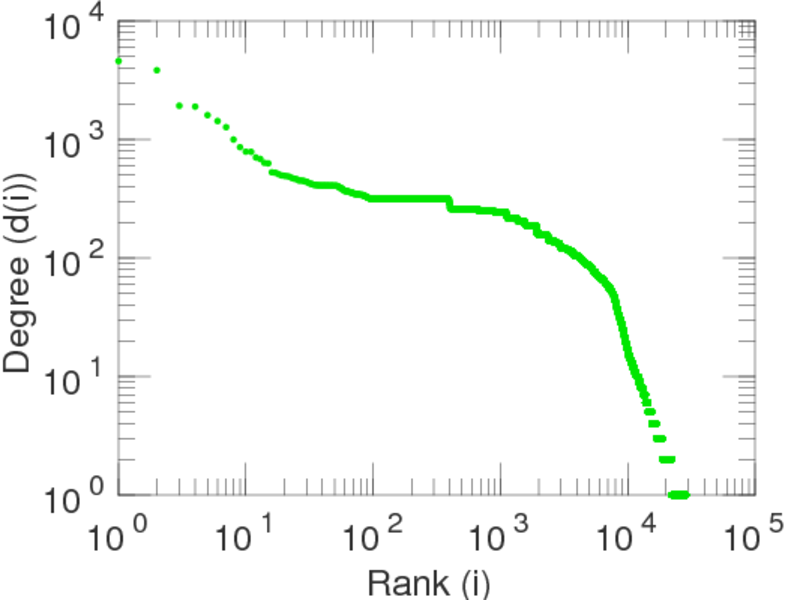
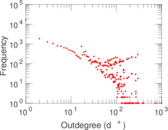
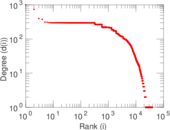
| Maximum outdegree | d+max = | 1,003
|
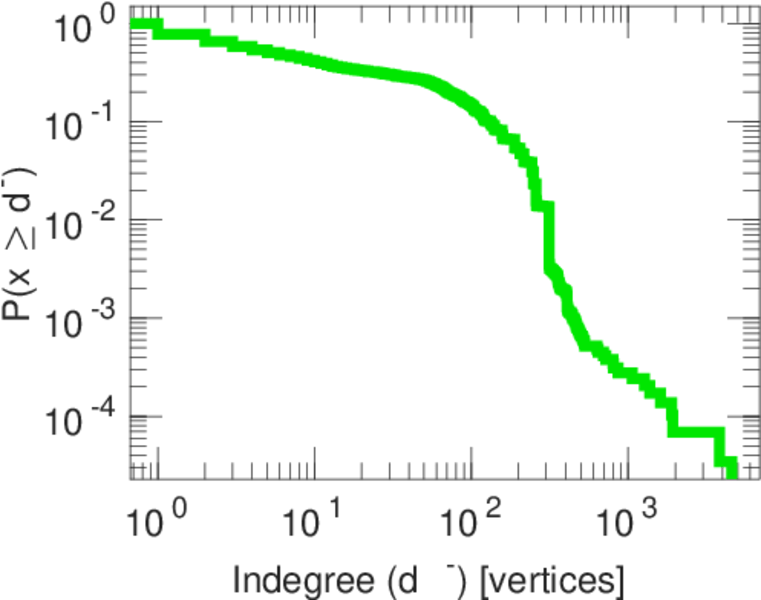
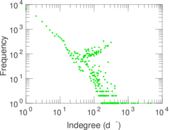
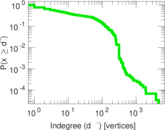
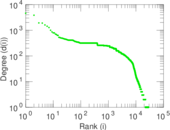
| Maximum indegree | d−max = | 4,592
|
| Average degree | d = | 59.202 9
|
| Fill | p = | 0.000 740 833
|
| Size of LCC | N = | 39,859
|
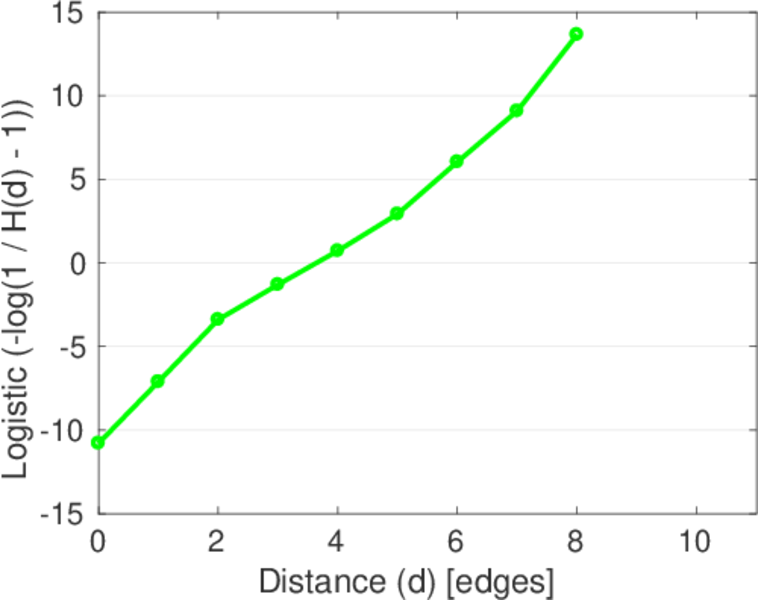
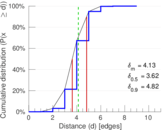
| Diameter | δ = | 11
|
| 50-Percentile effective diameter | δ0.5 = | 3.624 40
|
| 90-Percentile effective diameter | δ0.9 = | 4.822 99
|
| Median distance | δM = | 4
|
| Mean distance | δm = | 4.134 64
|
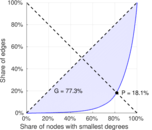
| Gini coefficient | G = | 0.773 332
|
| Balanced inequality ratio | P = | 0.180 655
|
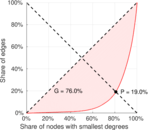
| Outdegree balanced inequality ratio | P+ = | 0.189 679
|
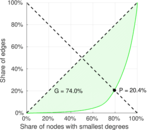
| Indegree balanced inequality ratio | P− = | 0.203 938
|
| Relative edge distribution entropy | Her = | 0.887 327
|
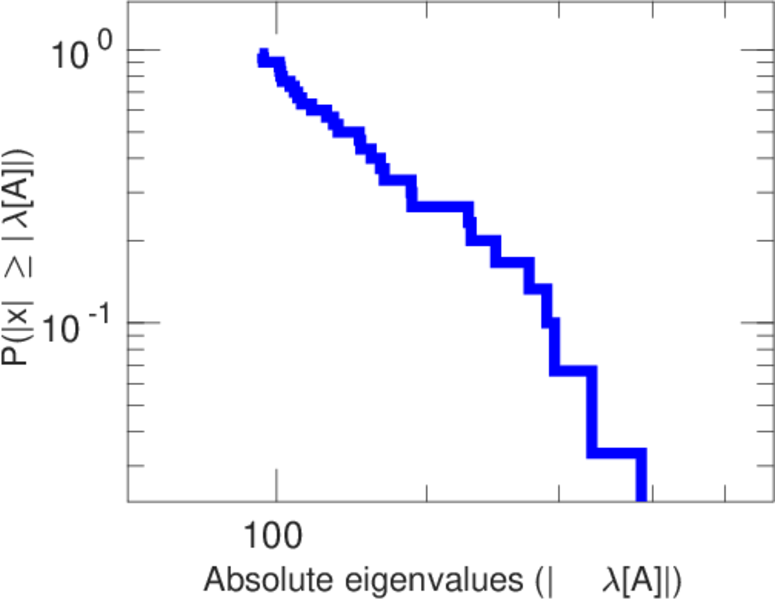
| Tail power law exponent | γt = | 1.371 00
|
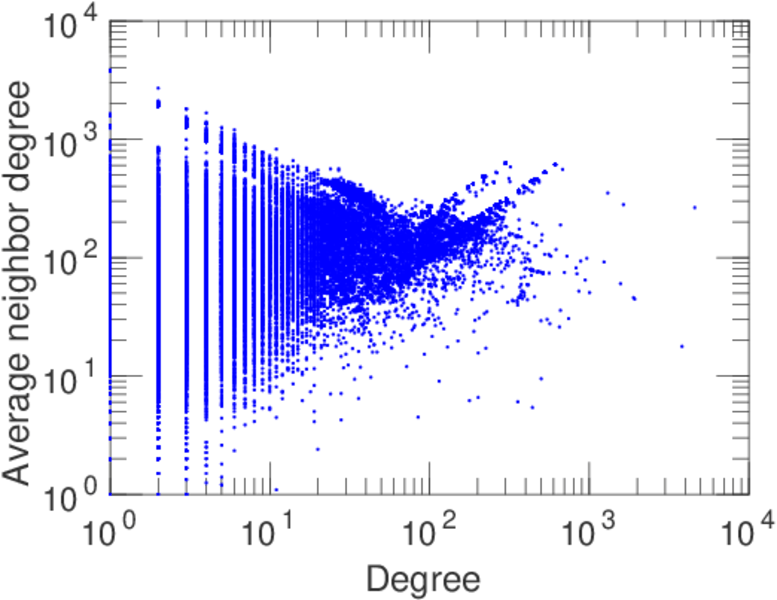
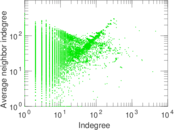
| Degree assortativity | ρ = | −0.003 246 30
|
| Degree assortativity p-value | pρ = | 8.174 64 × 10−5
|
| Clustering coefficient | c = | 0.666 076
|
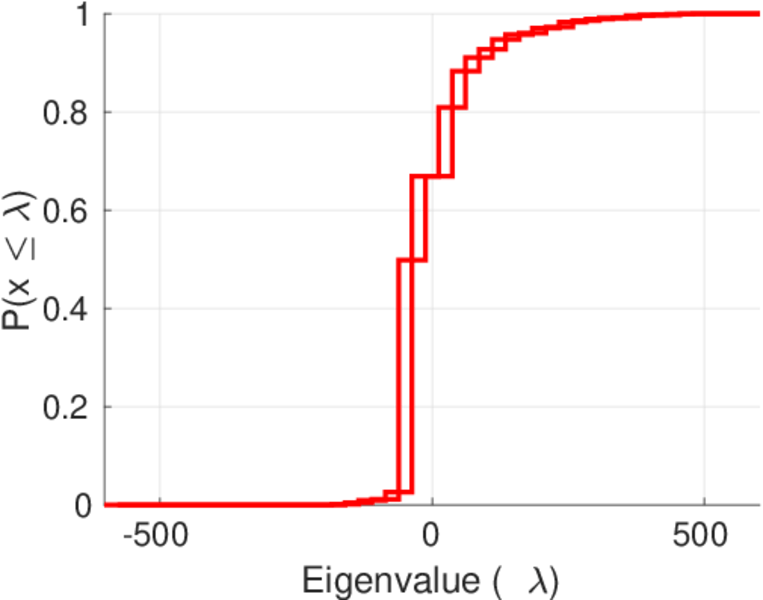
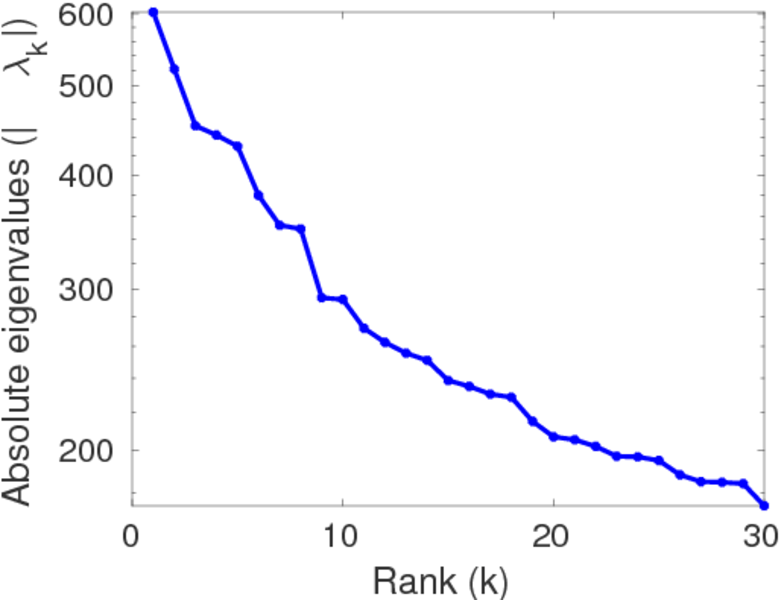
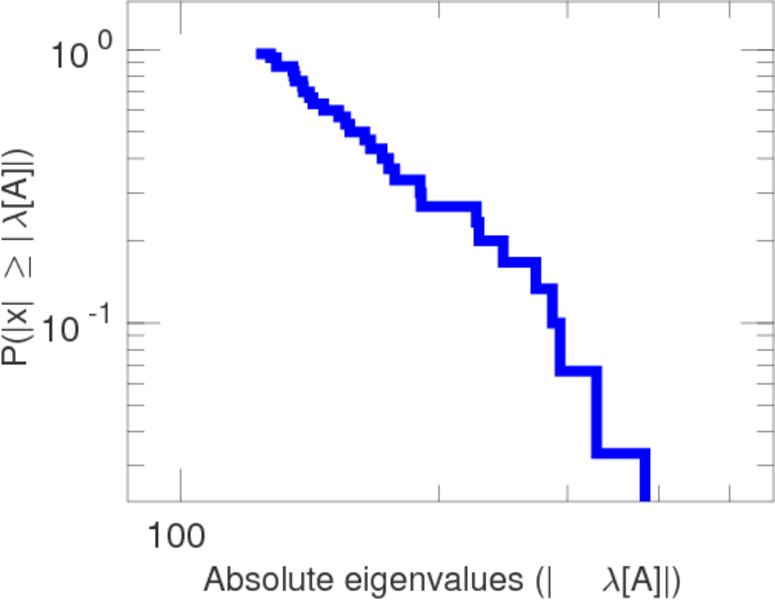
| Spectral norm | α = | 602.458
|
| Algebraic connectivity | a = | 0.042 410 8
|
| Spectral separation | |λ1[A] / λ2[A]| = | 1.153 99
|
| Reciprocity | y = | 0.755 092
|
| Normalized non-bipartivity | bN = | 0.022 801 9
|
| Spectral bipartite frustration | bK = | 0.000 286 926
|
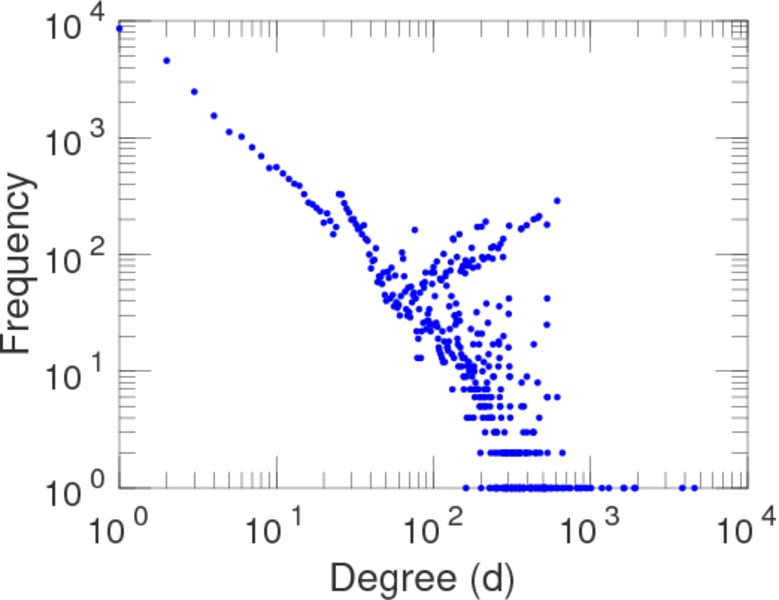
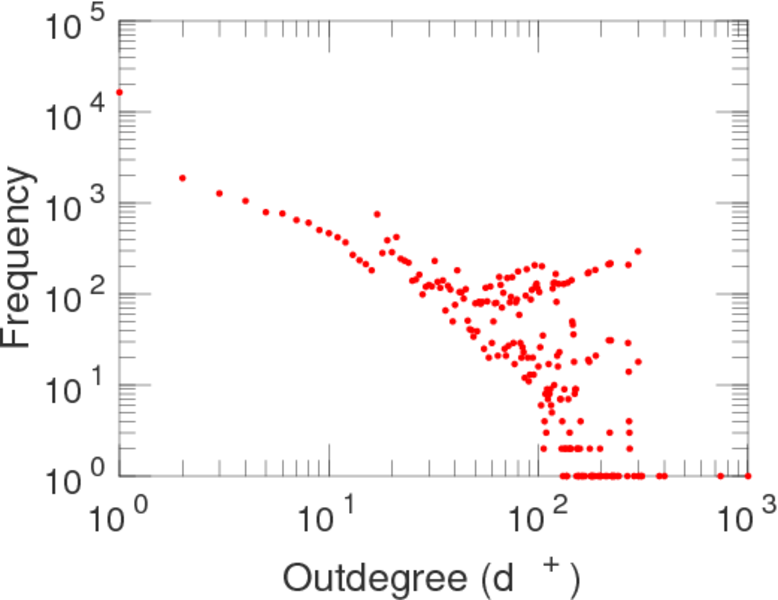
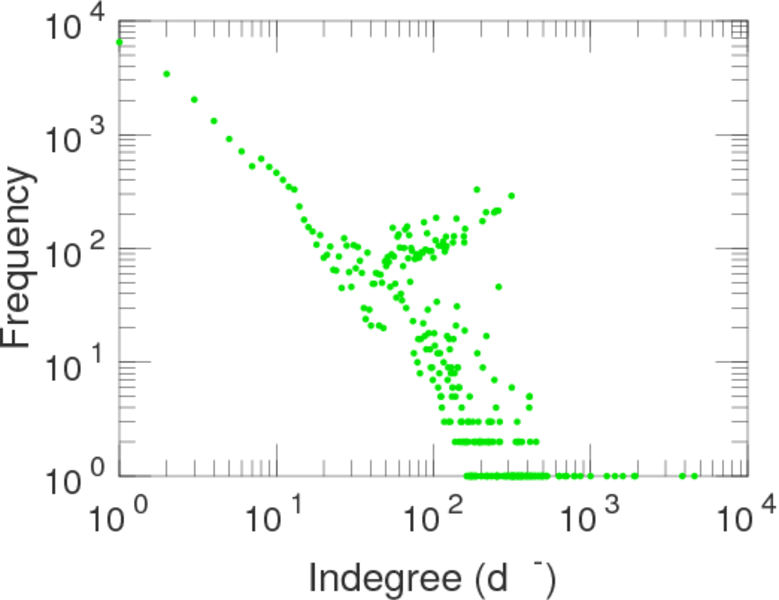
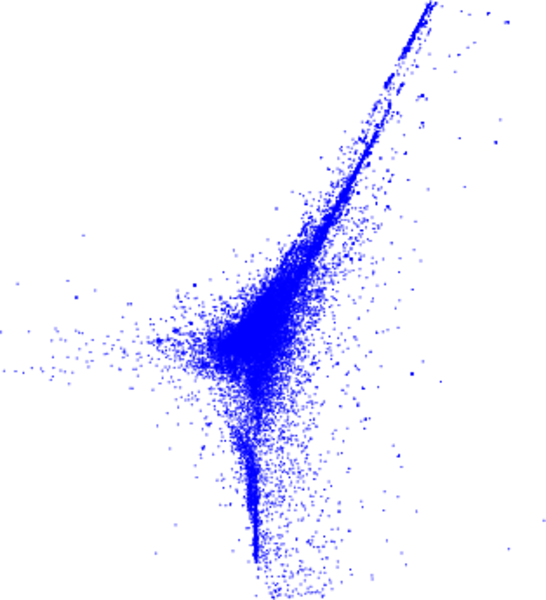
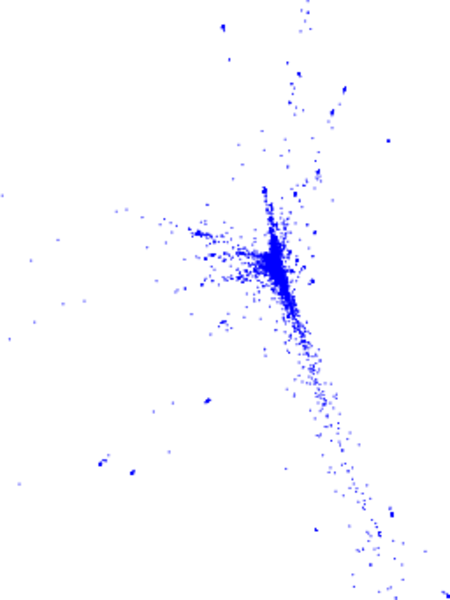
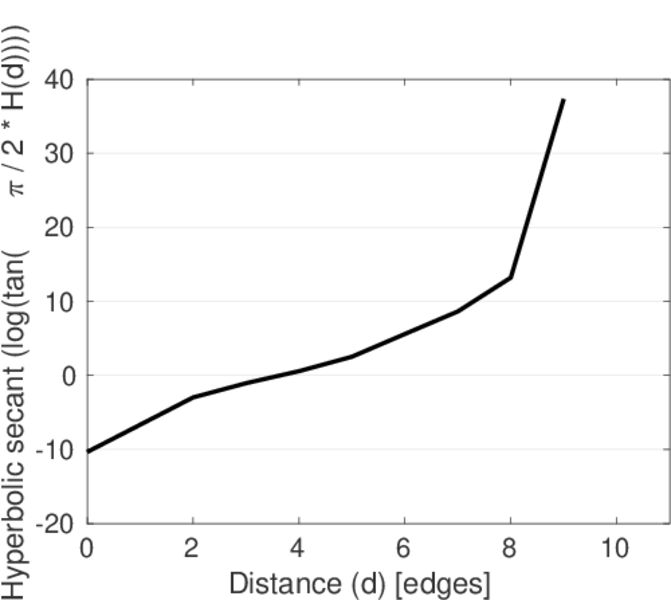
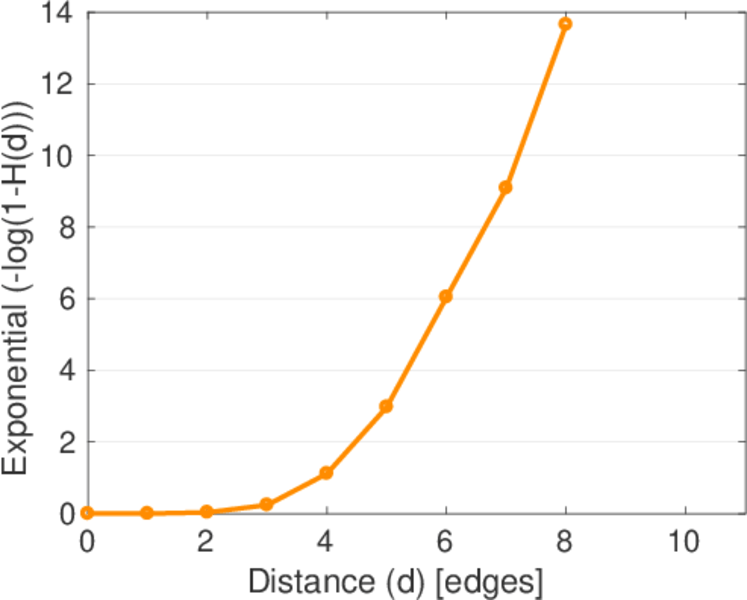
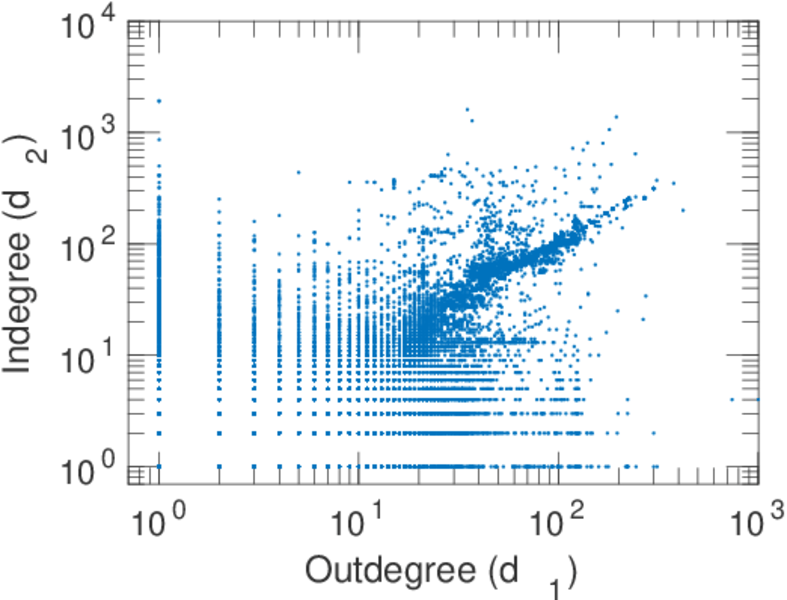
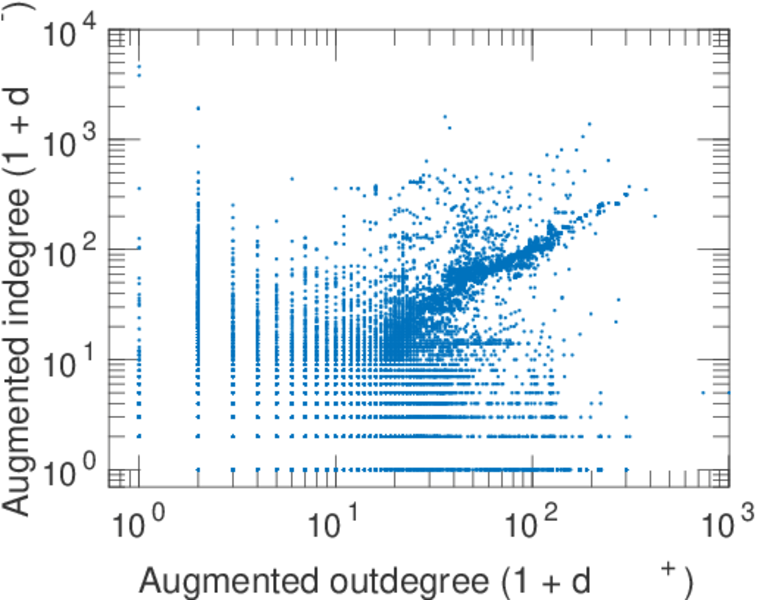
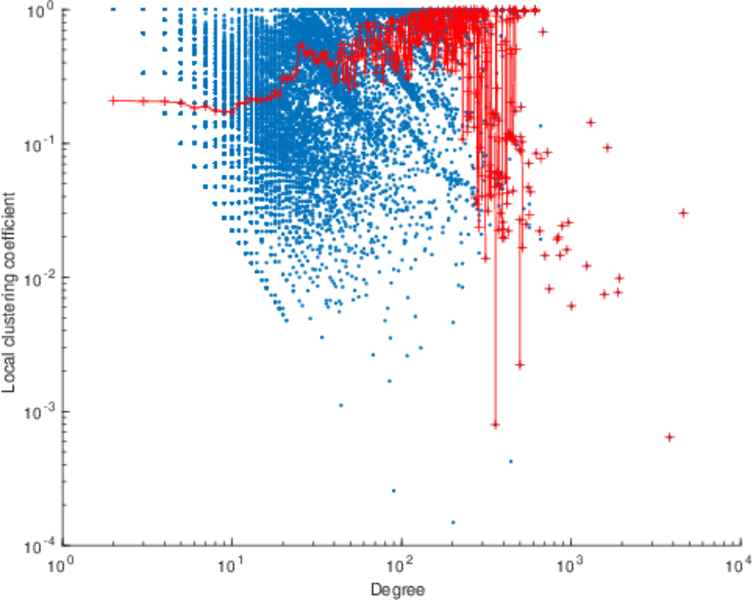
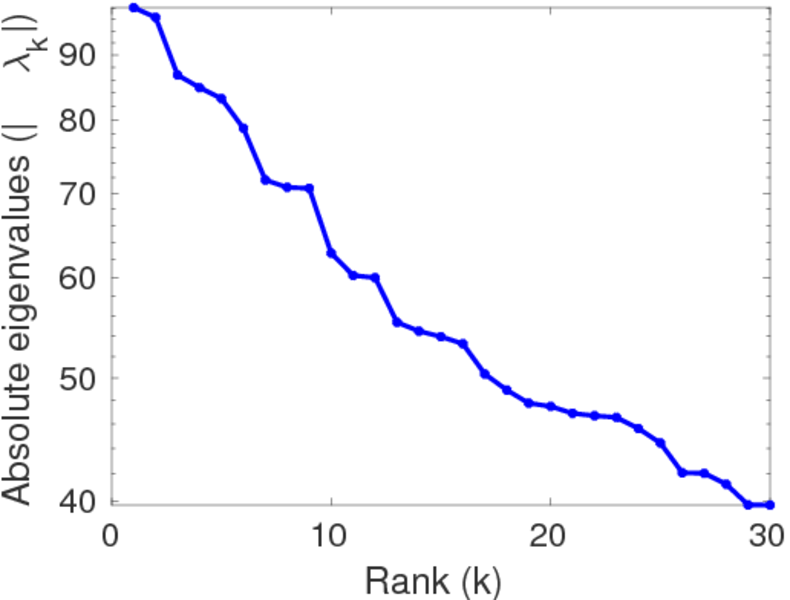
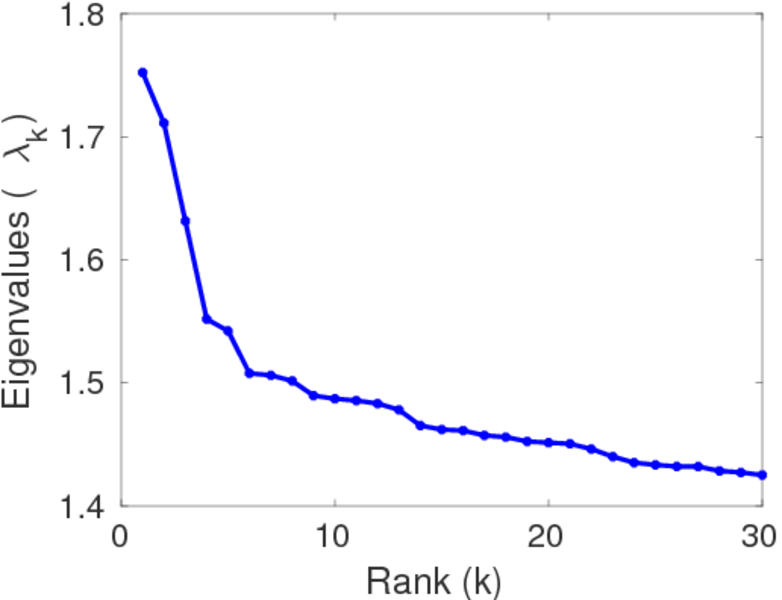
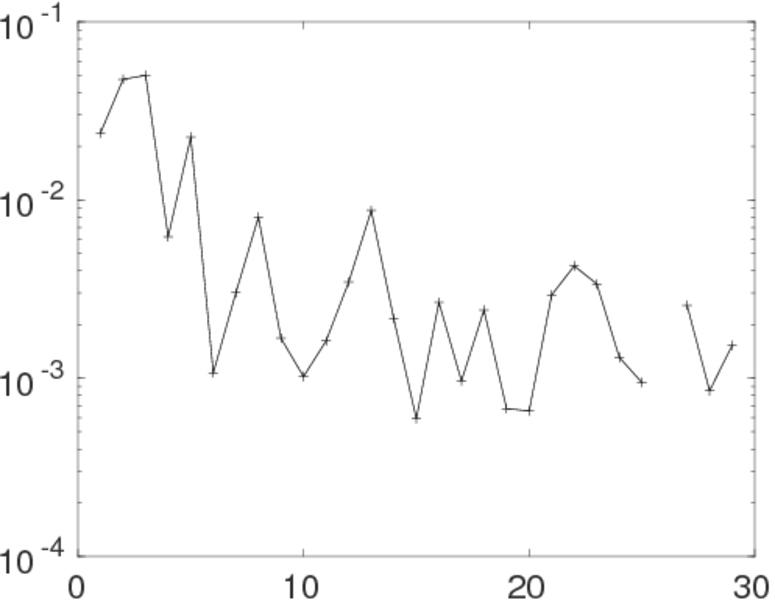
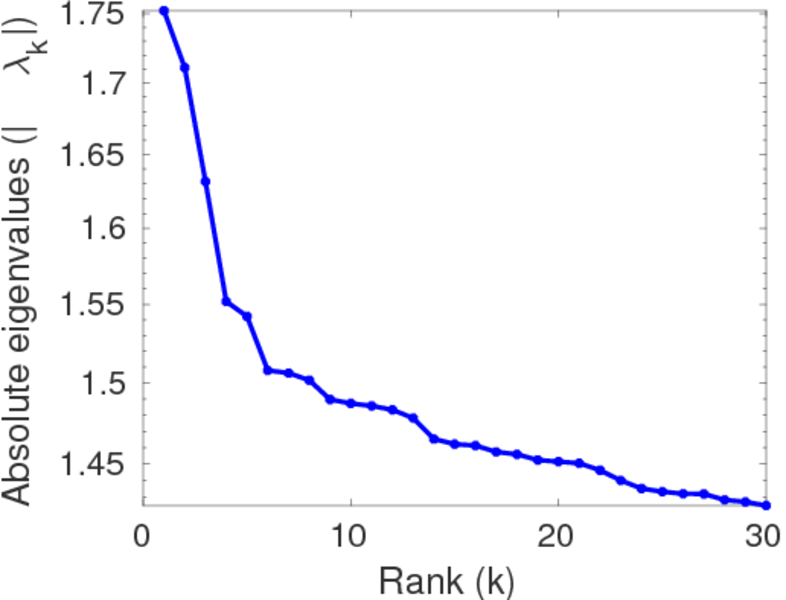
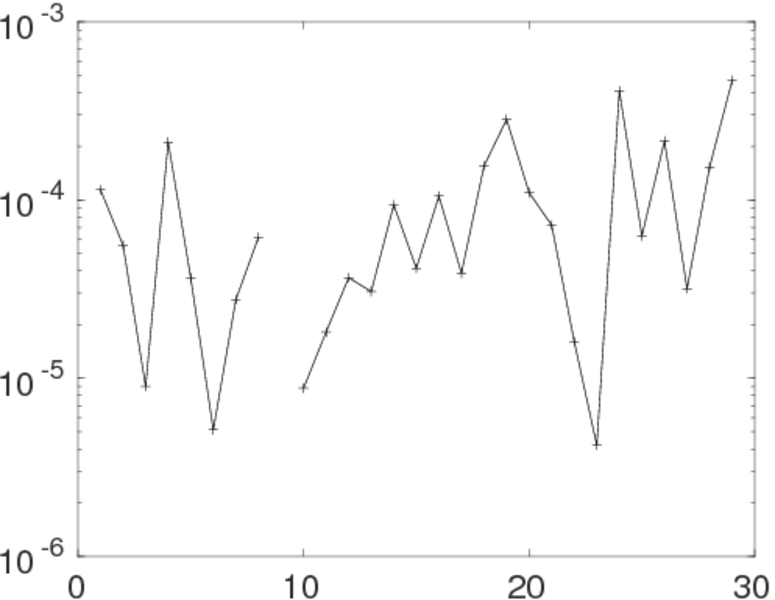
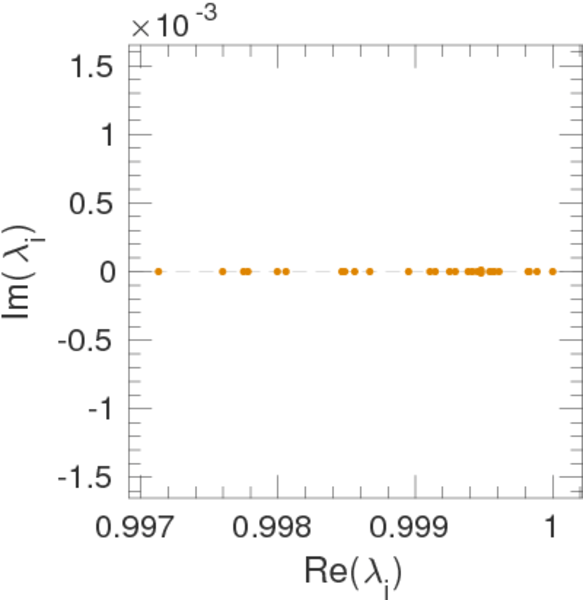
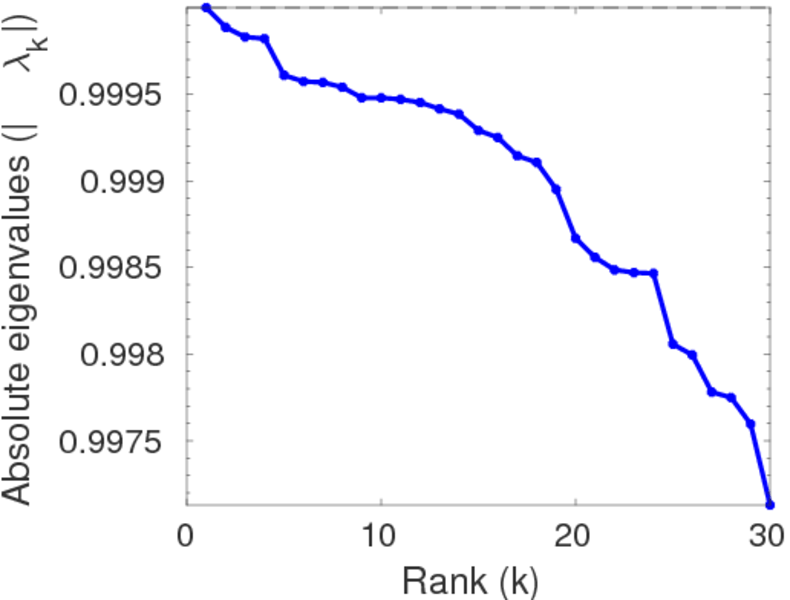
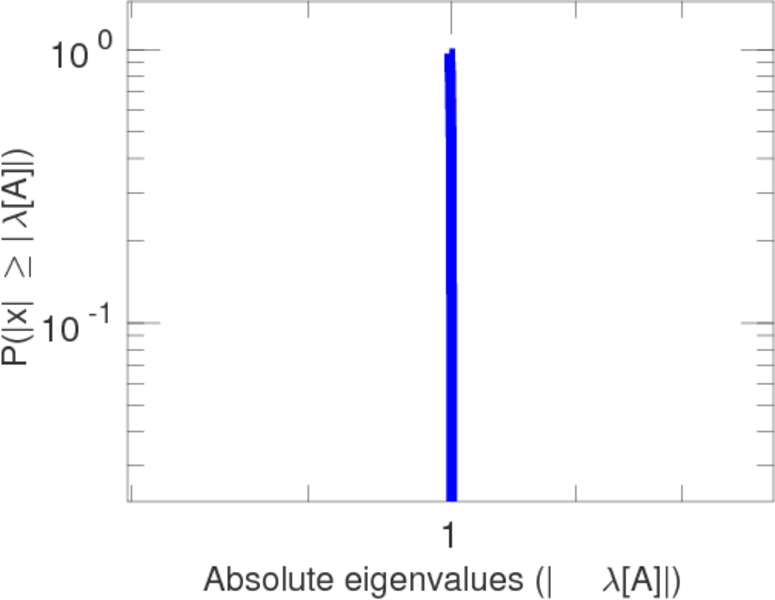
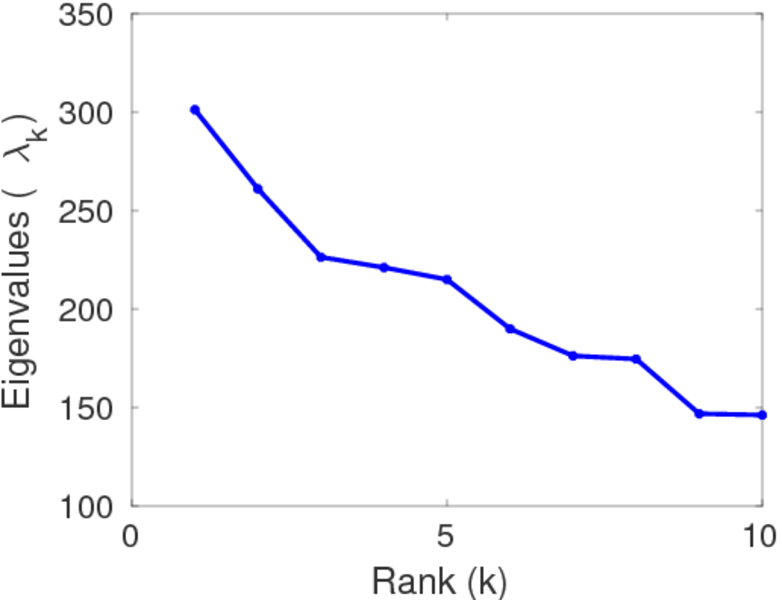
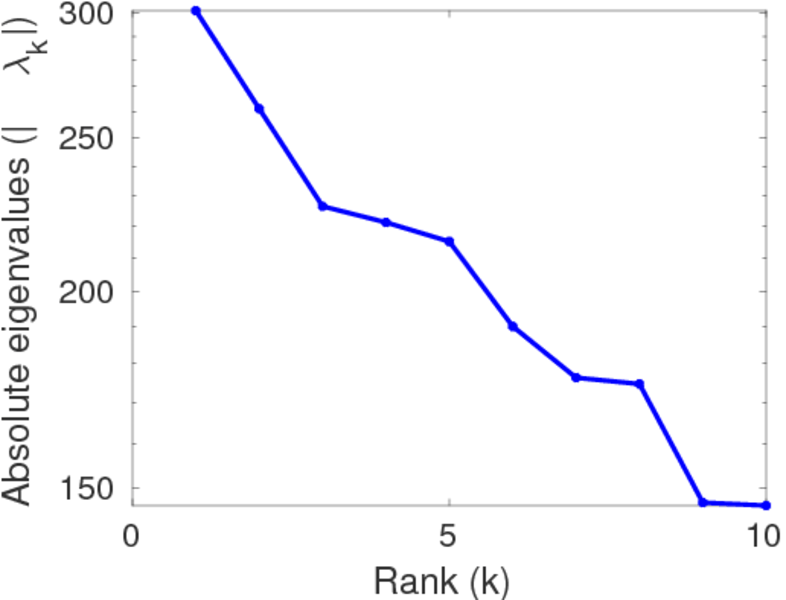
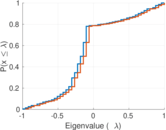
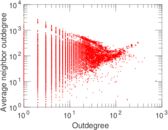
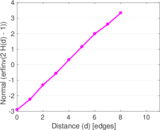
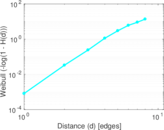
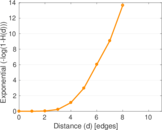
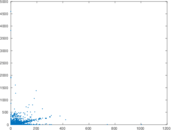
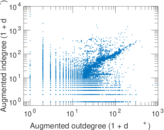
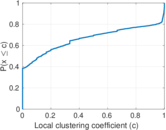
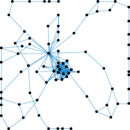
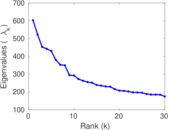
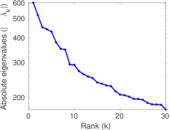
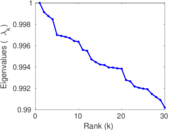
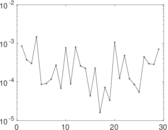
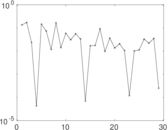
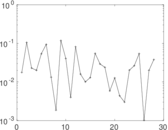
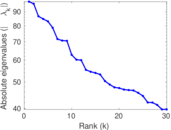
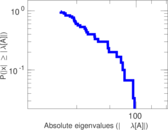
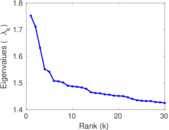
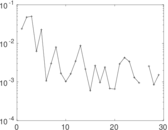
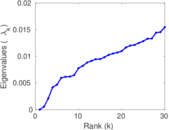
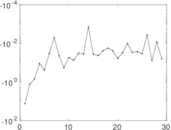
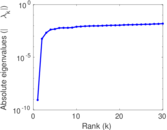
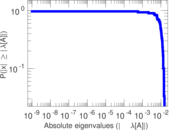
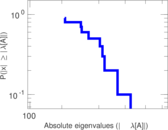
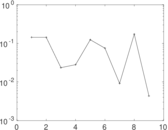
Plots


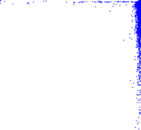
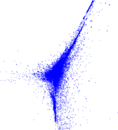


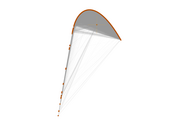
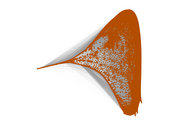
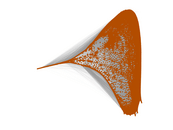


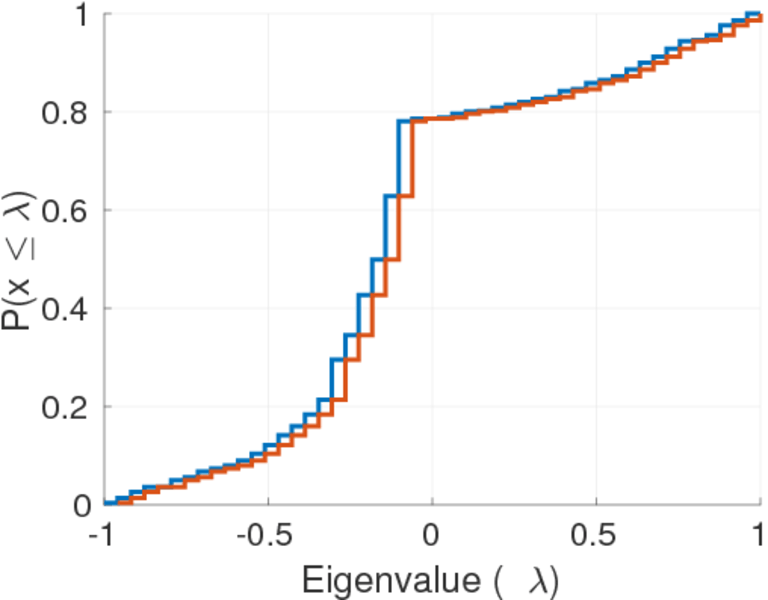
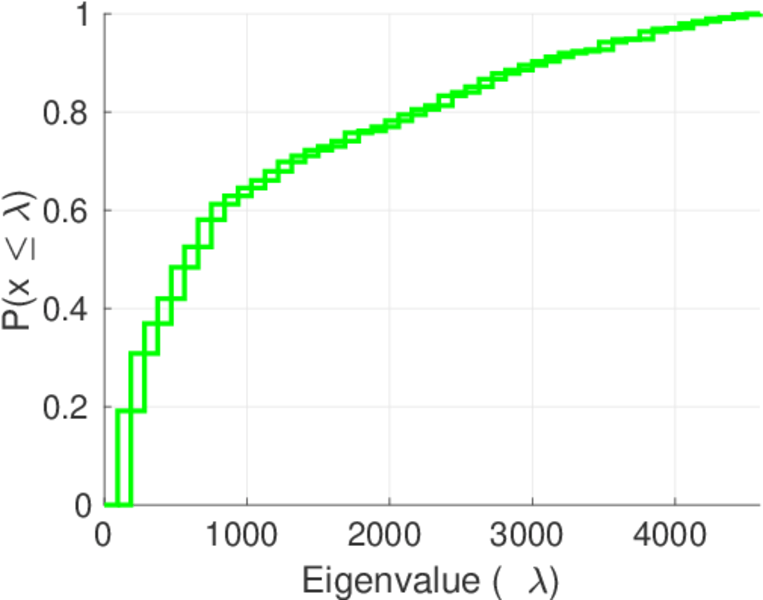
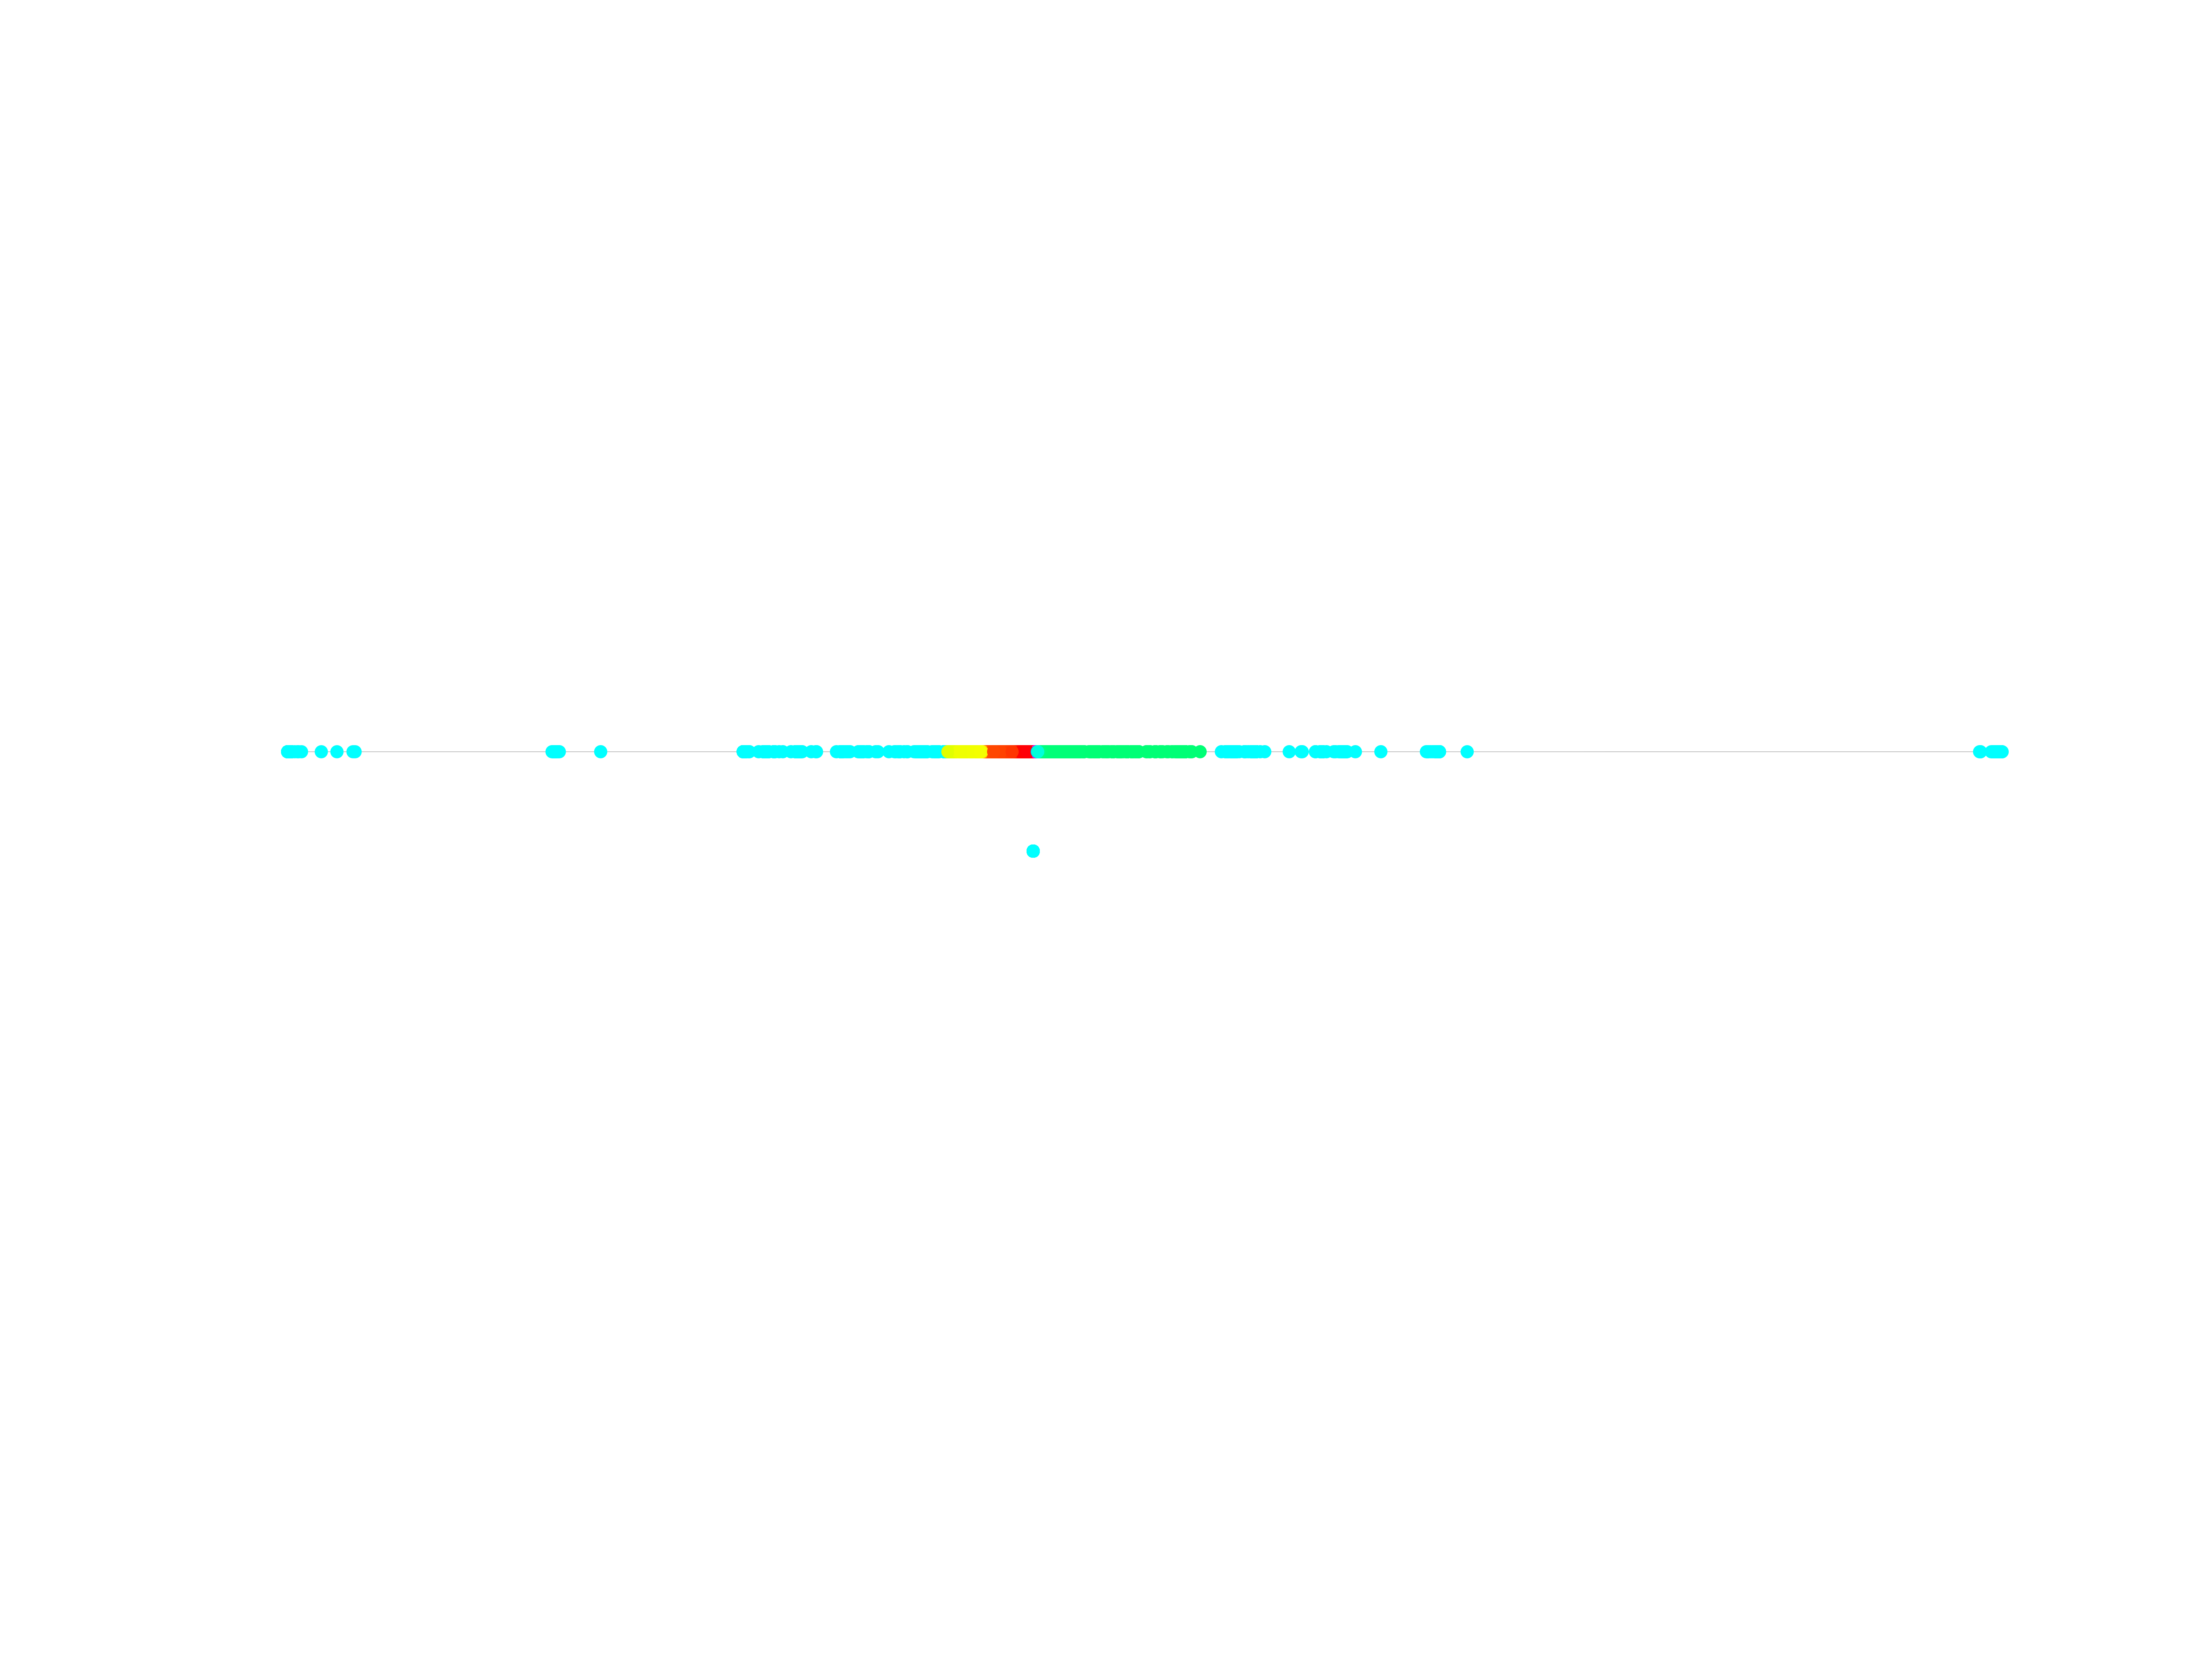
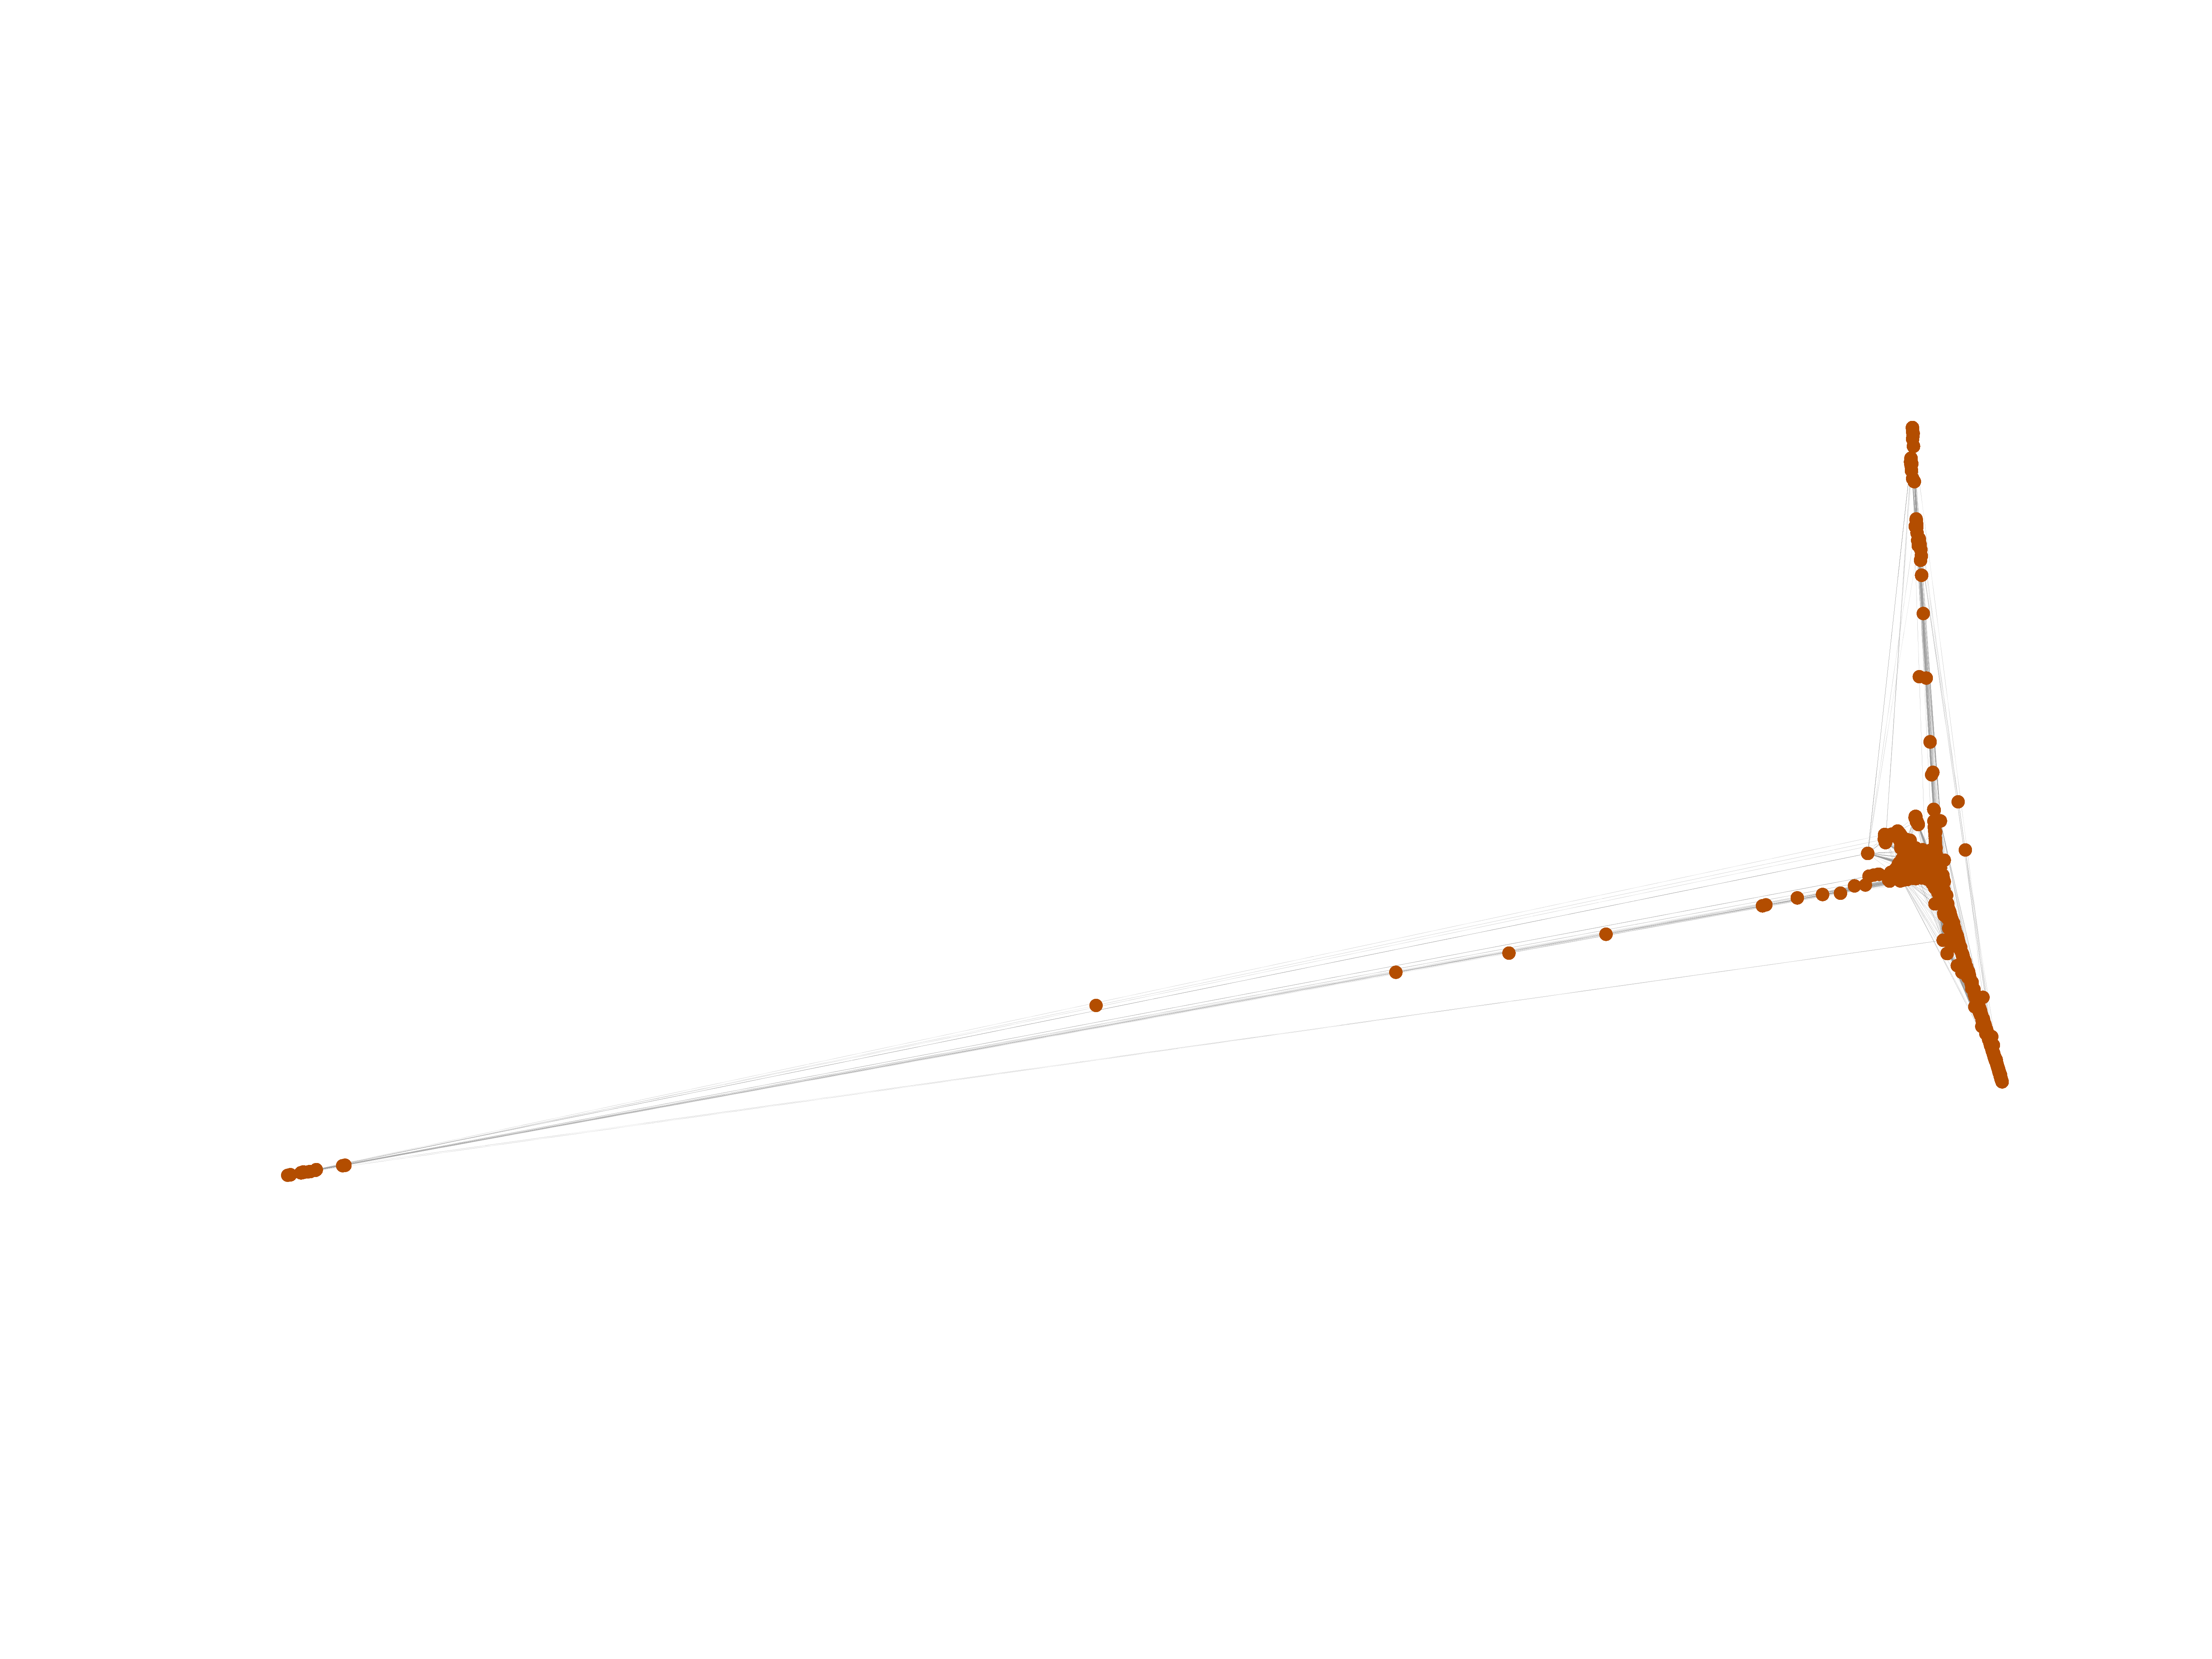
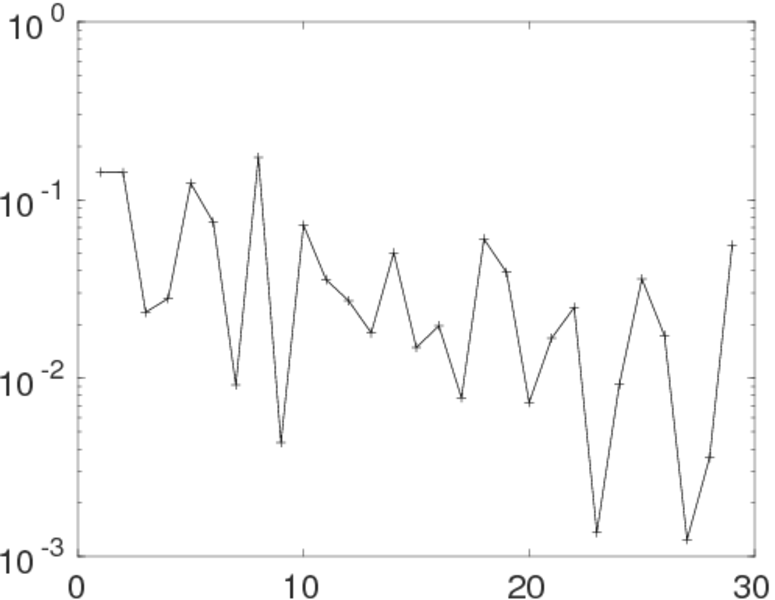
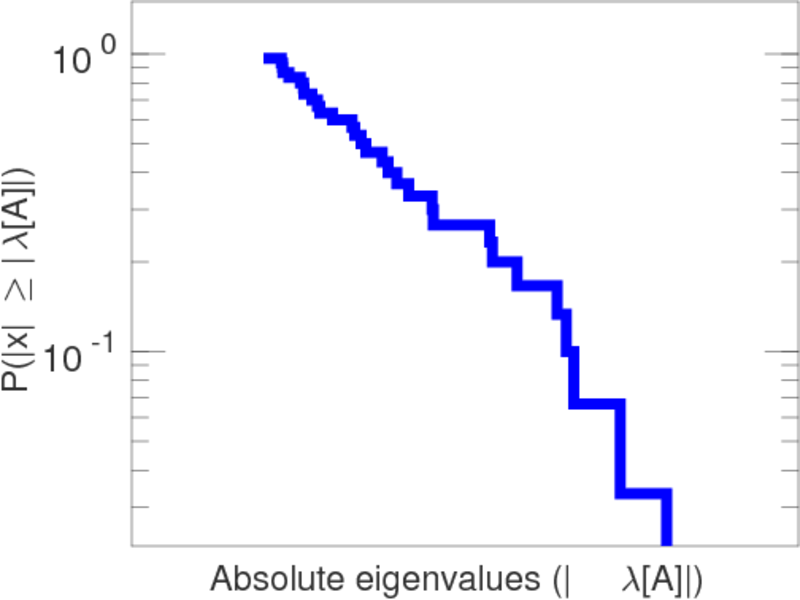
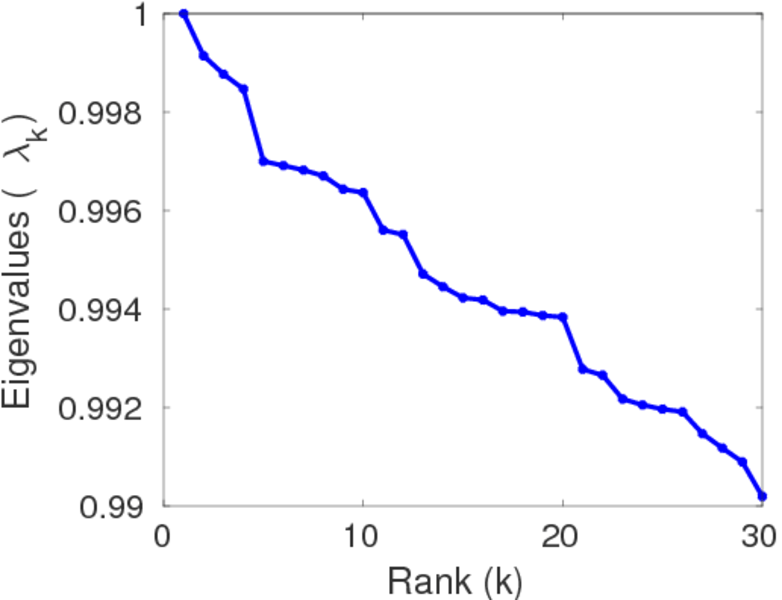
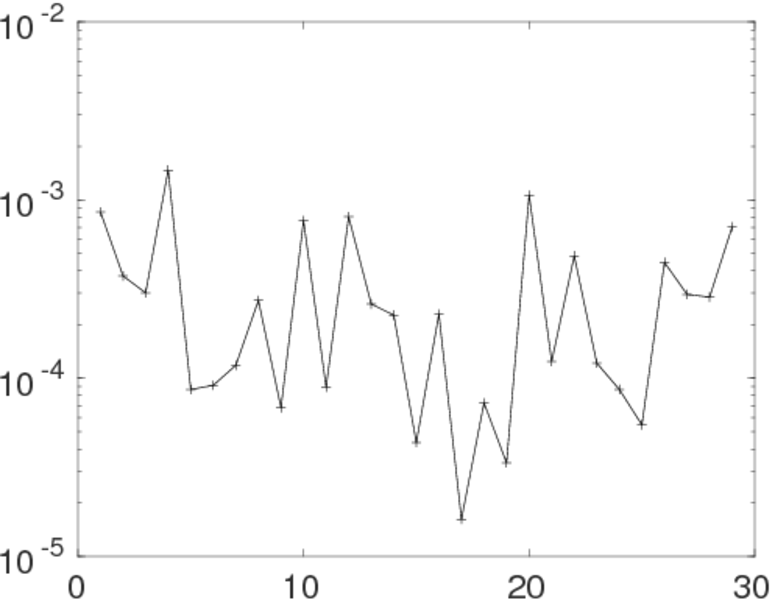
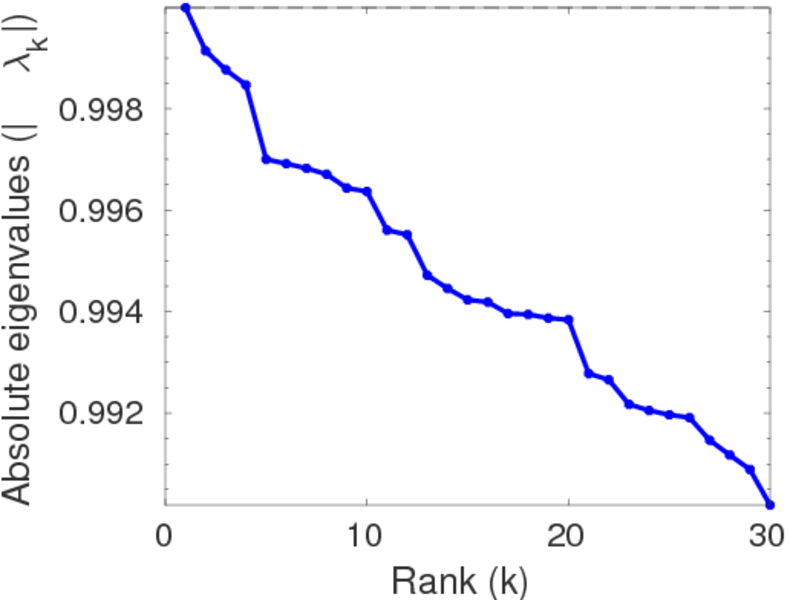
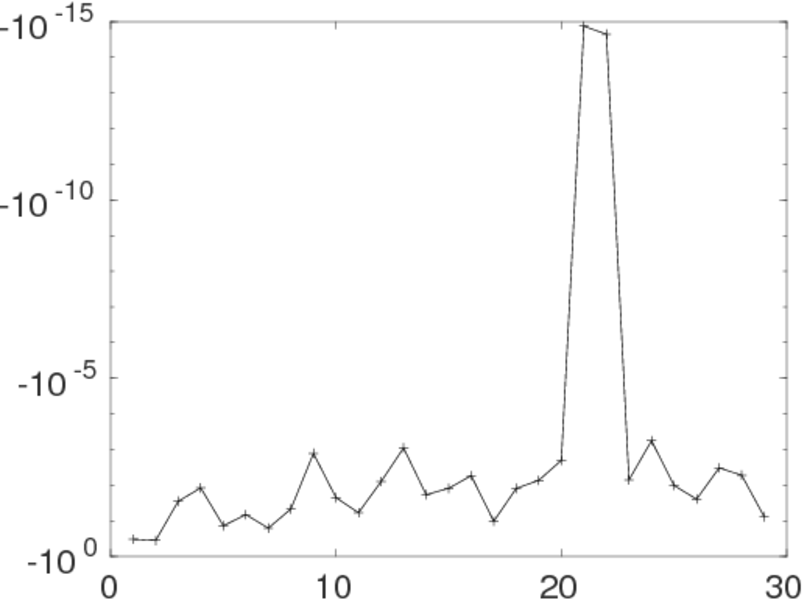
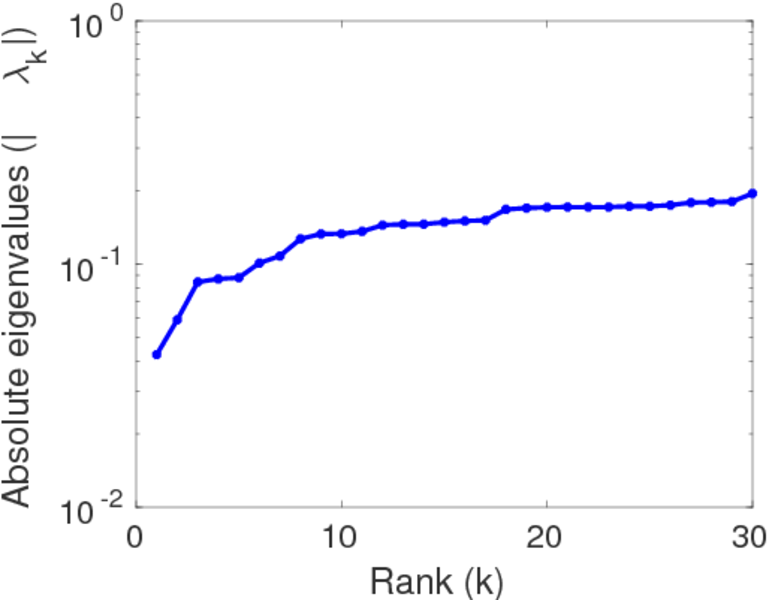
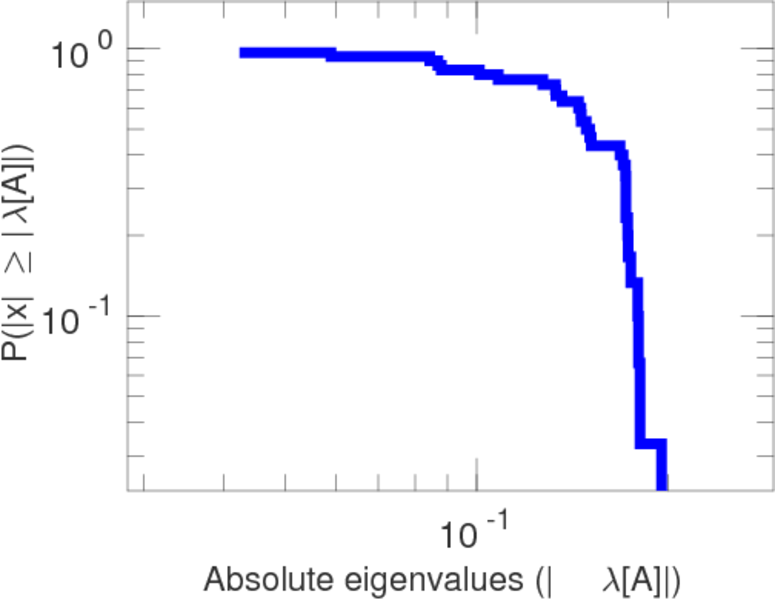
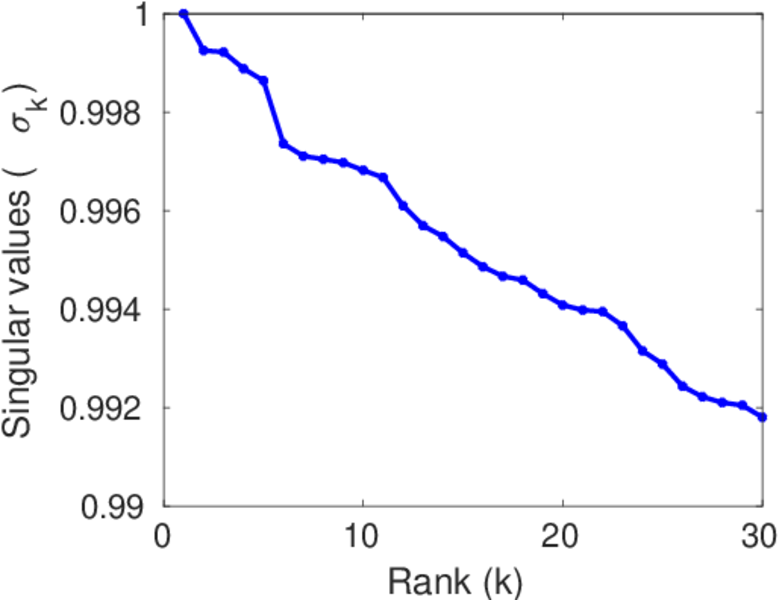
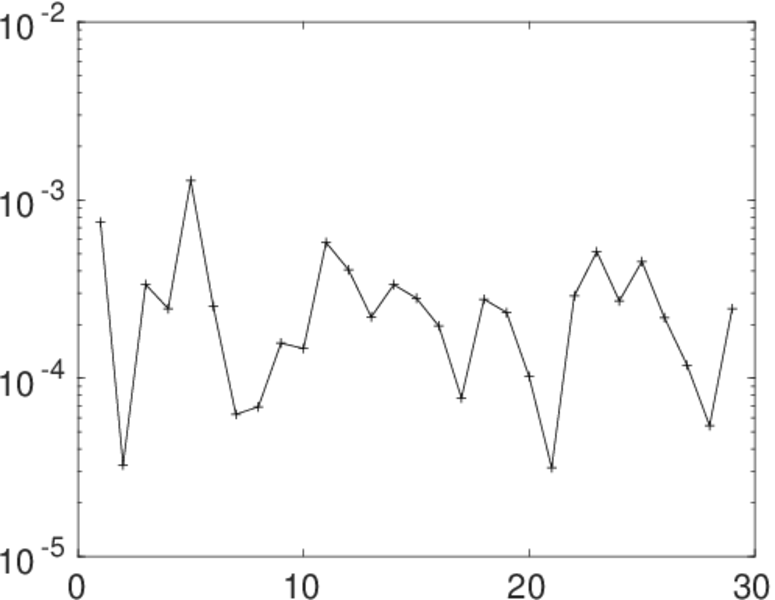
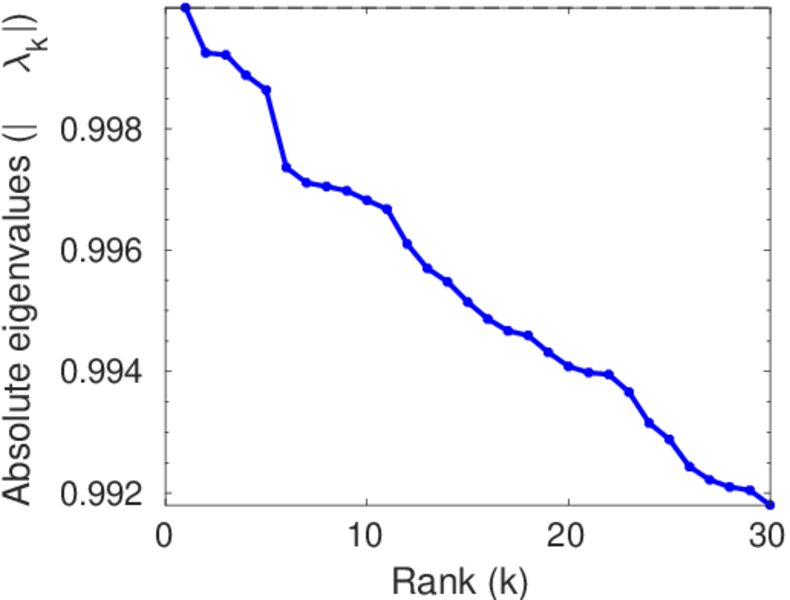
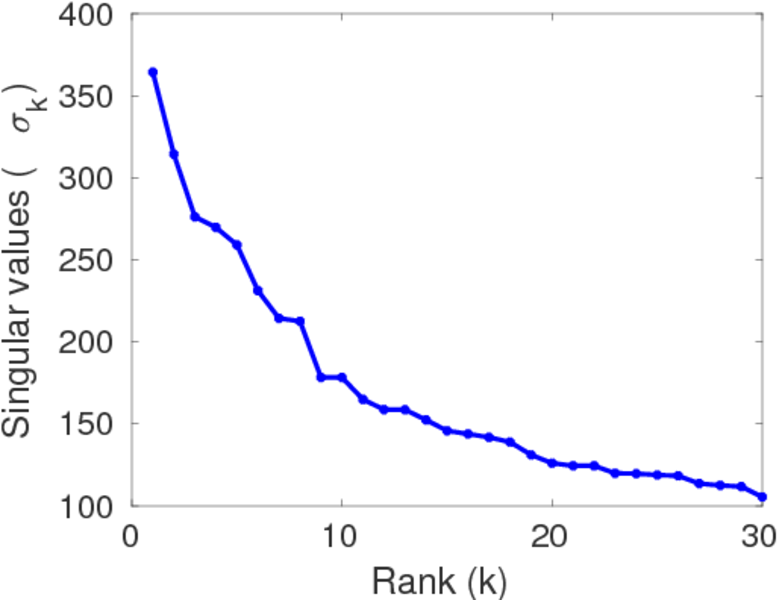
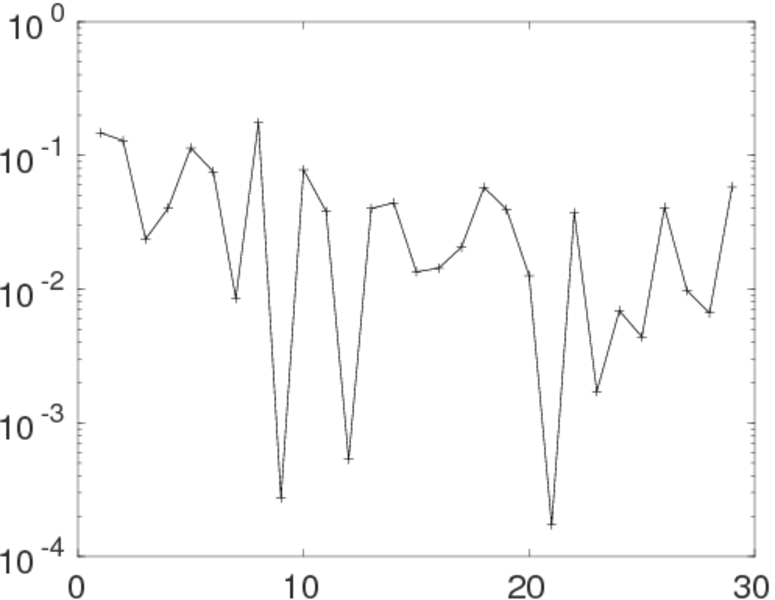
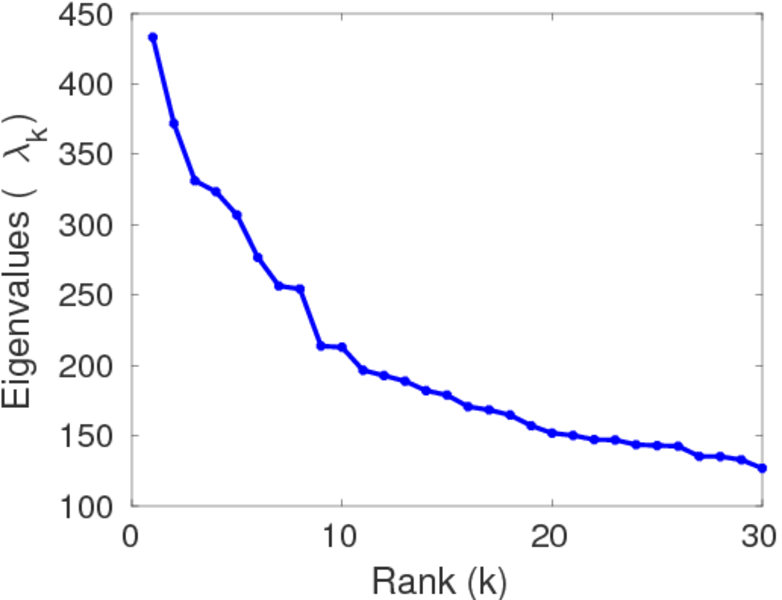
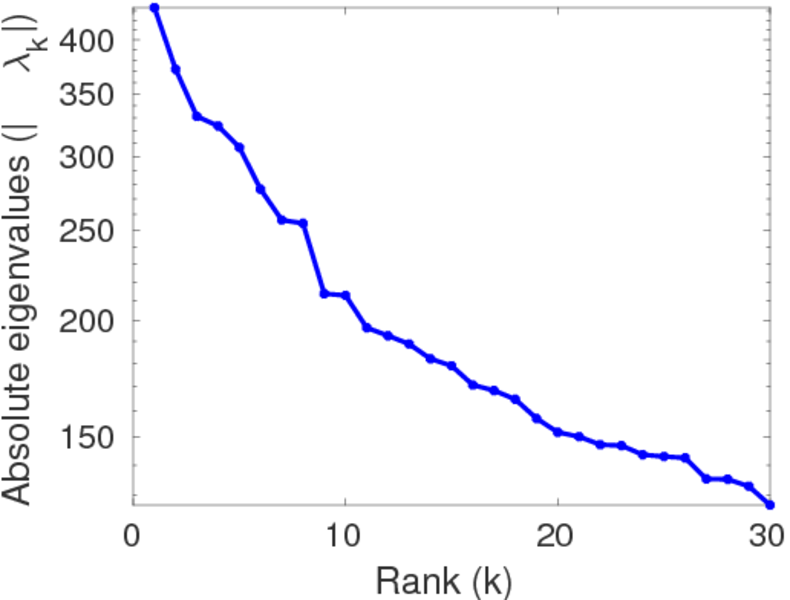
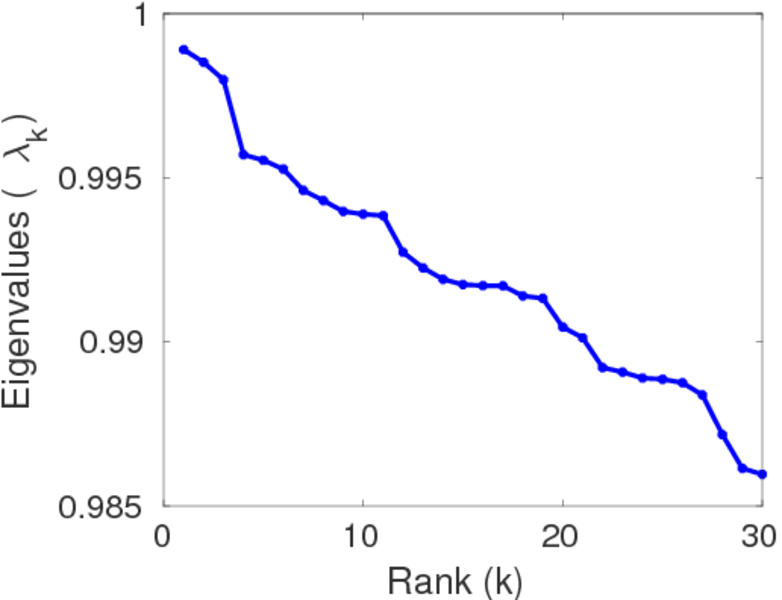
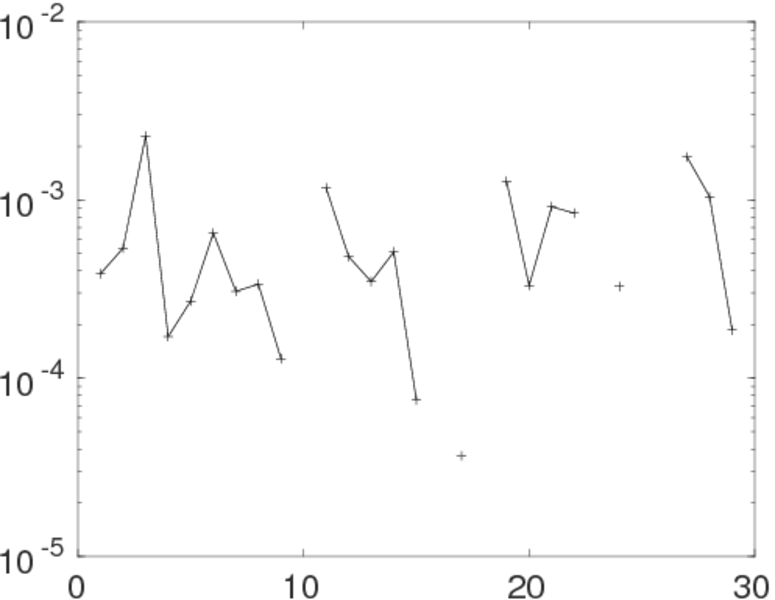
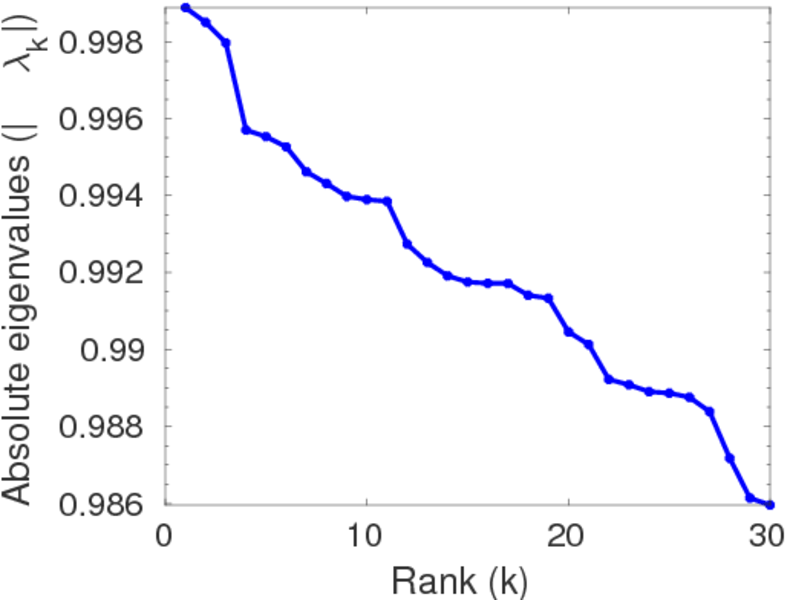
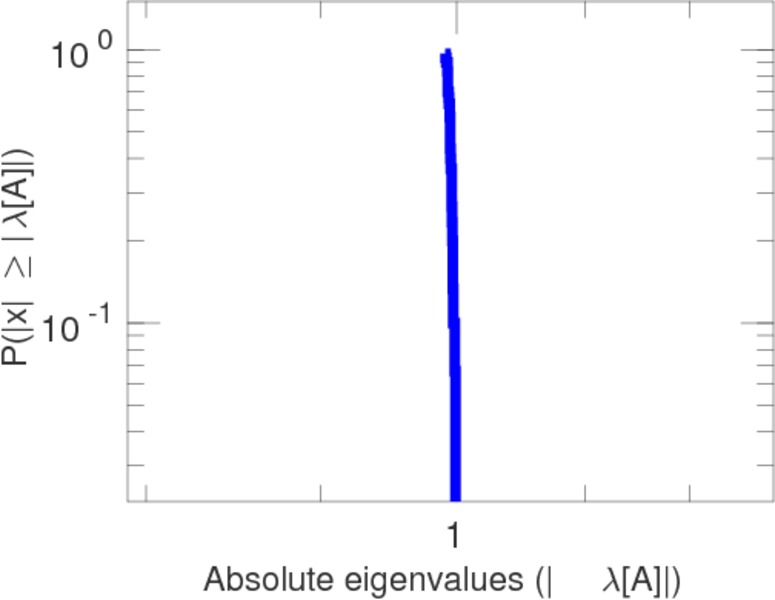
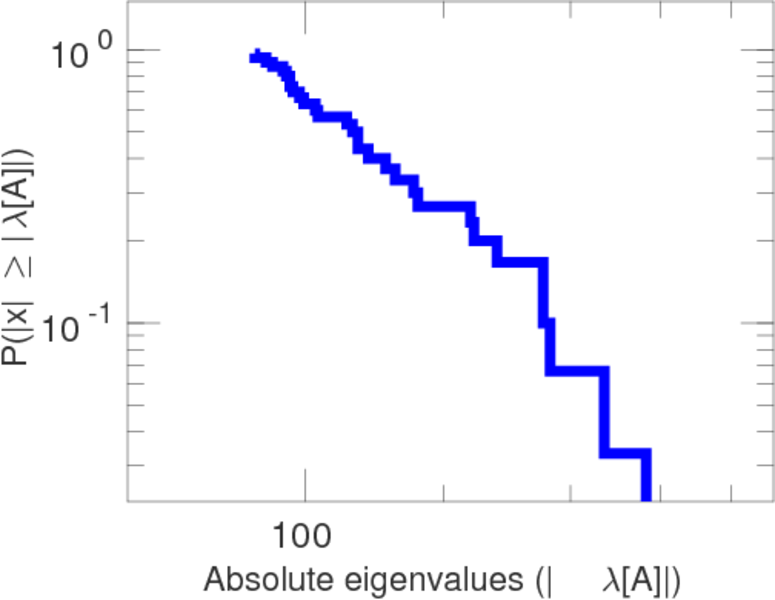
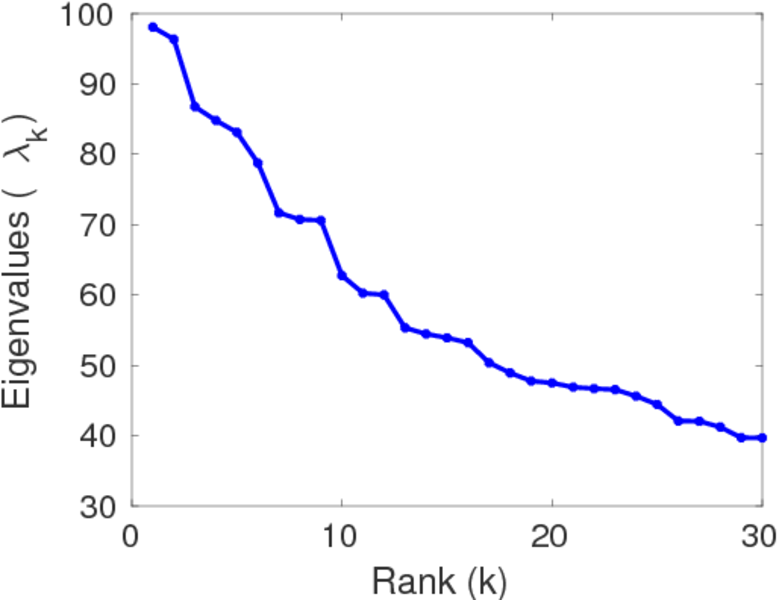
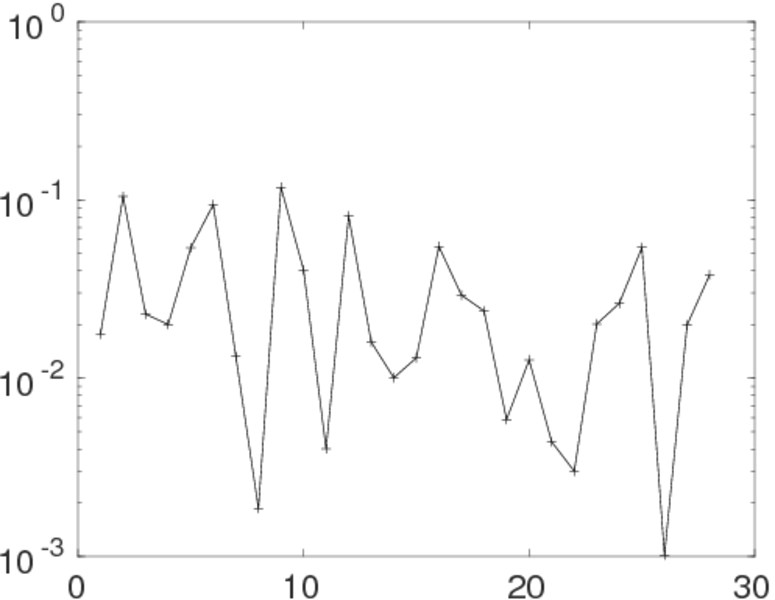
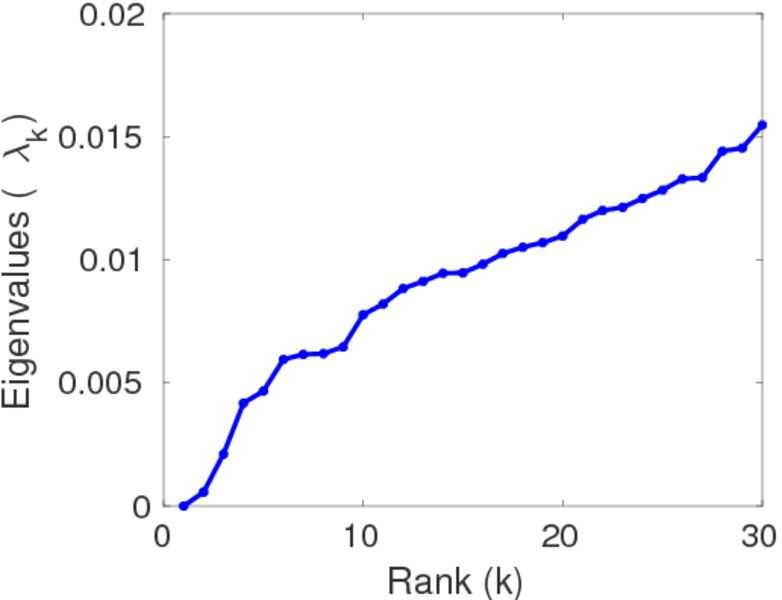
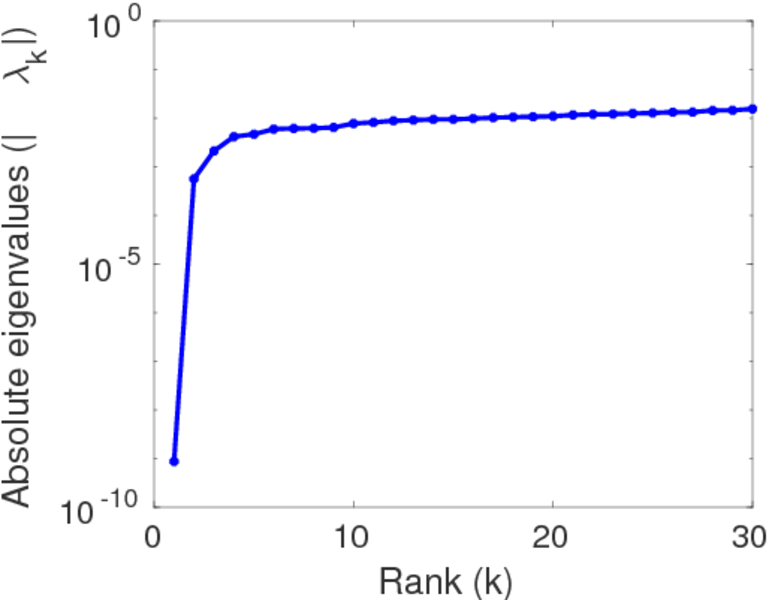
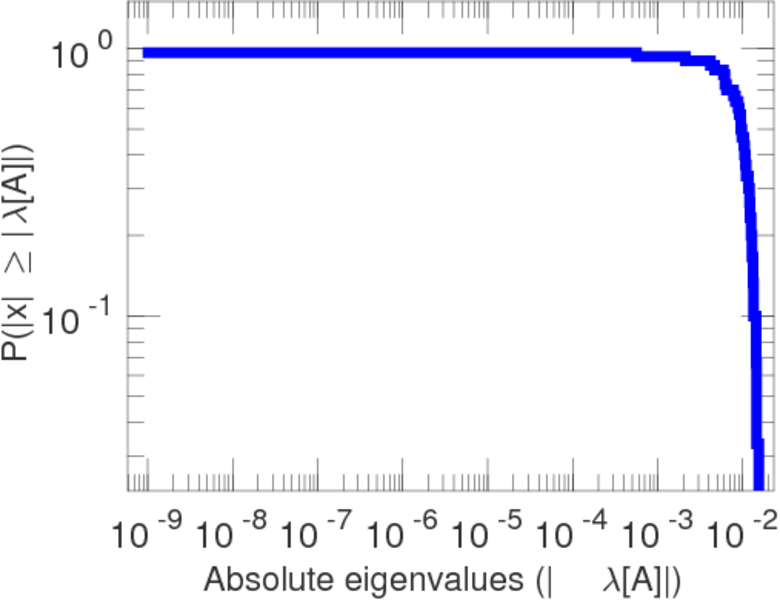
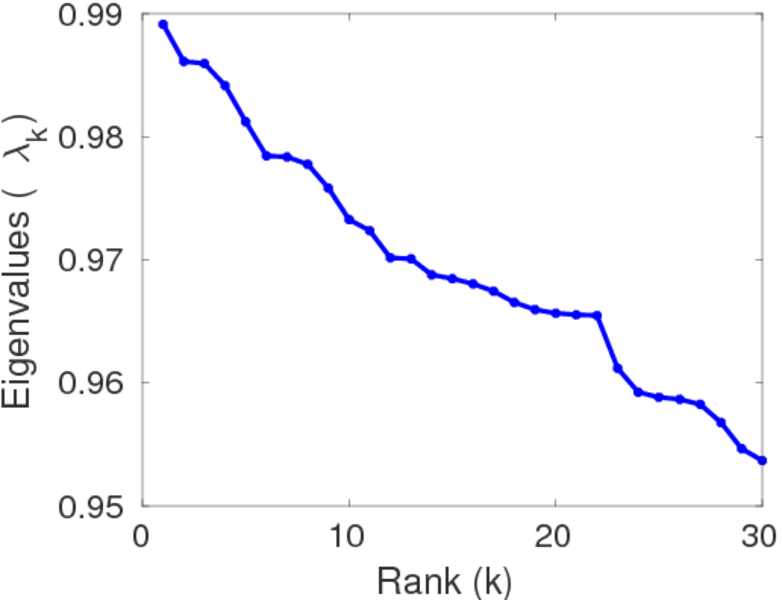
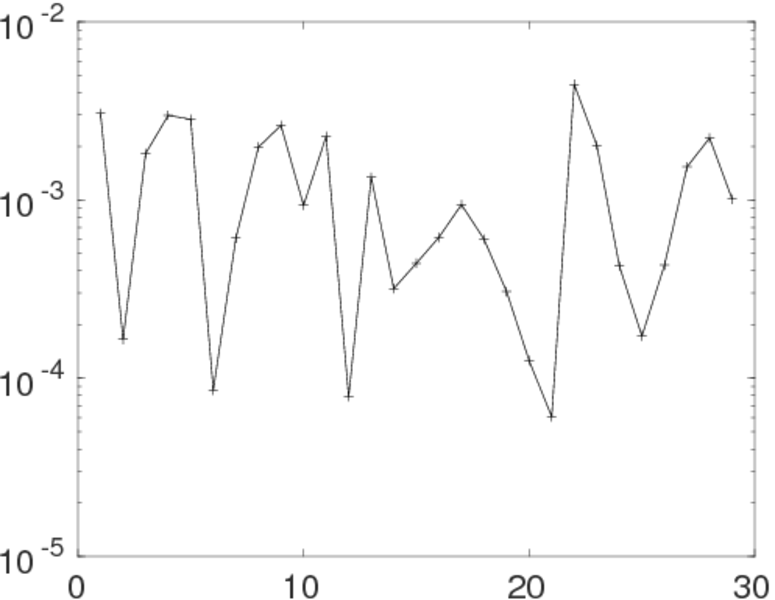
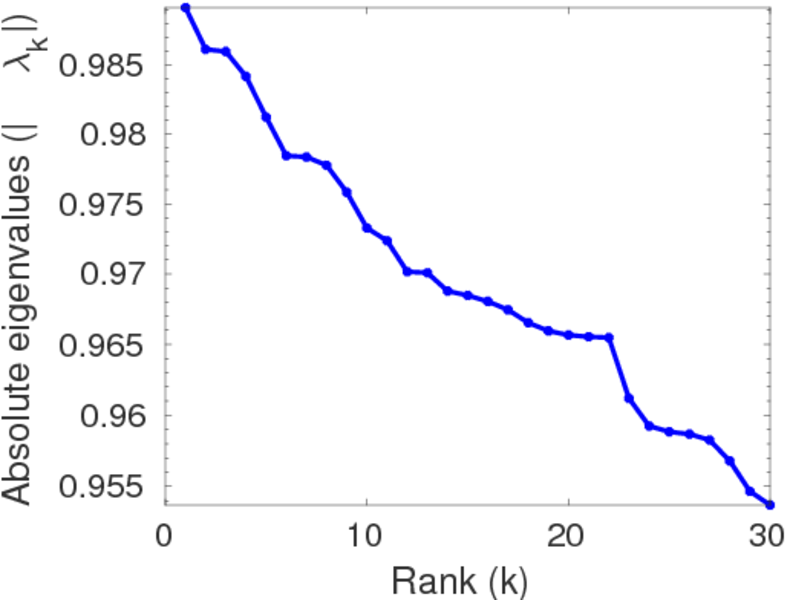
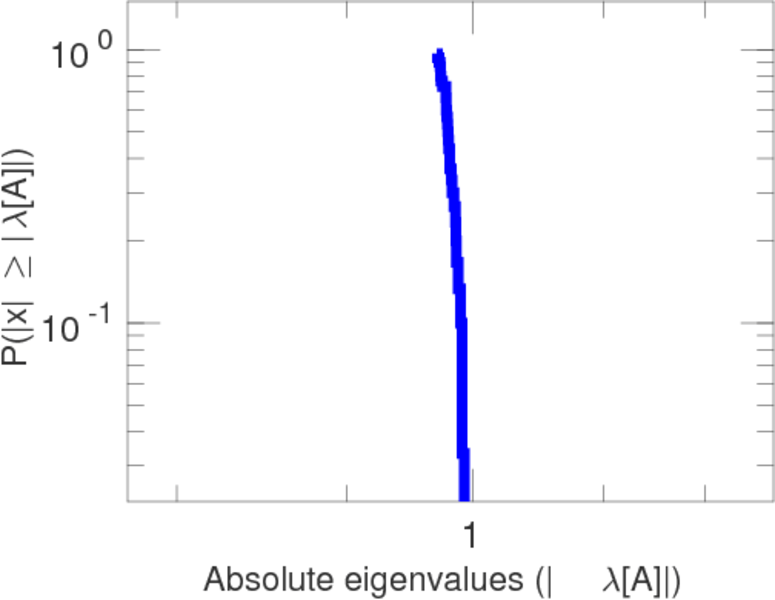
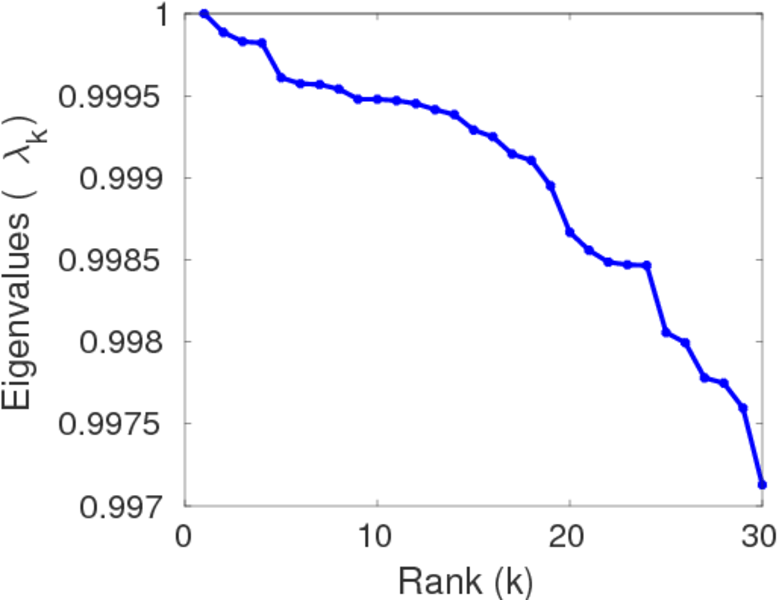
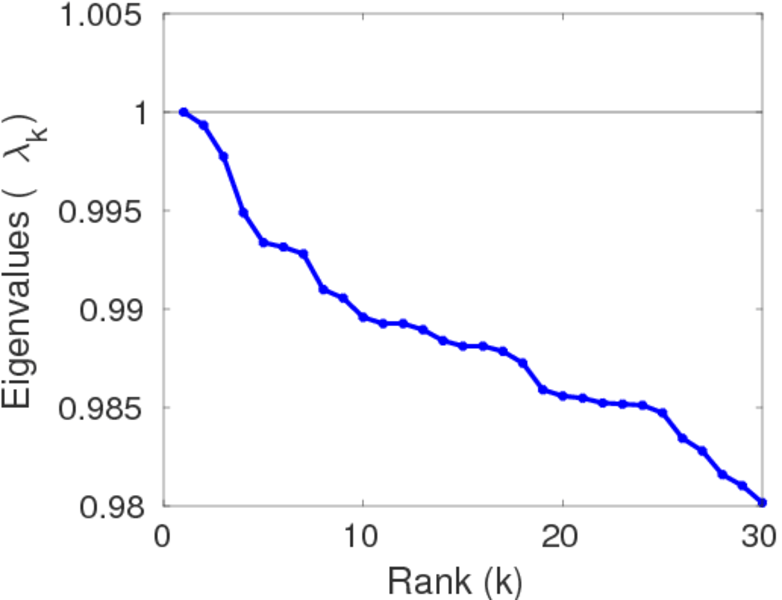
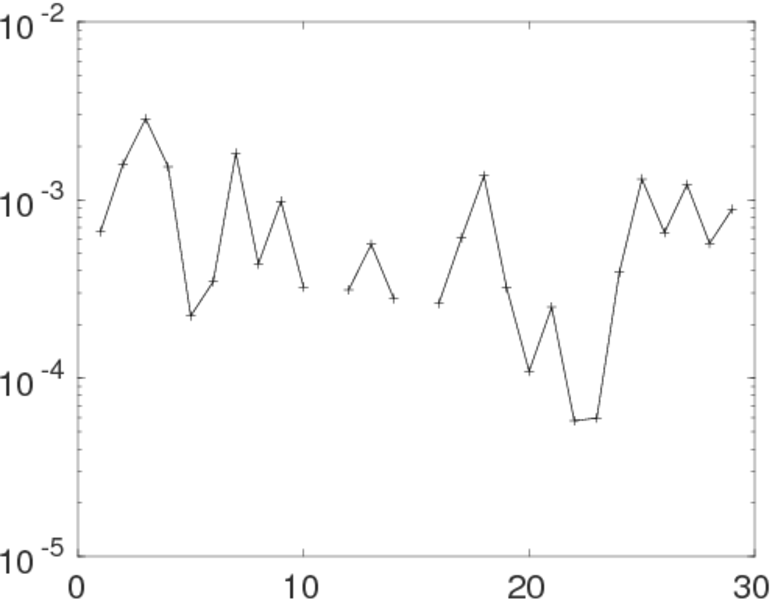
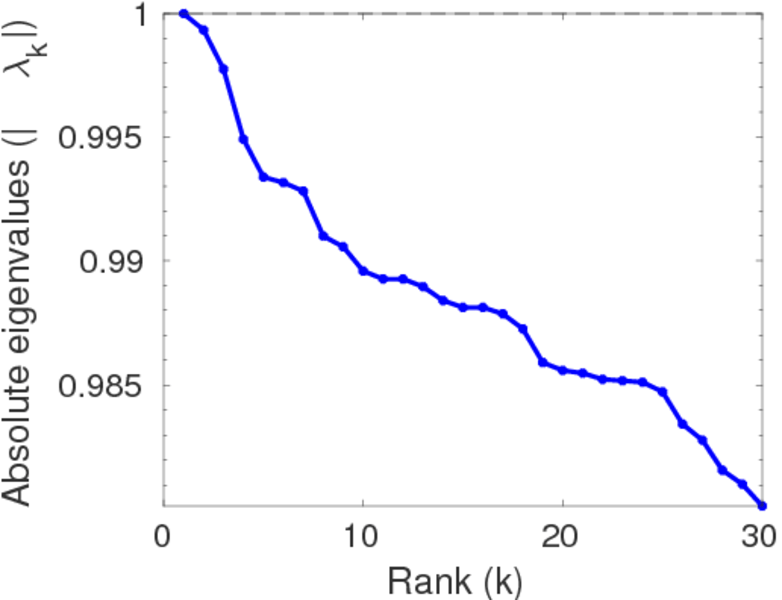
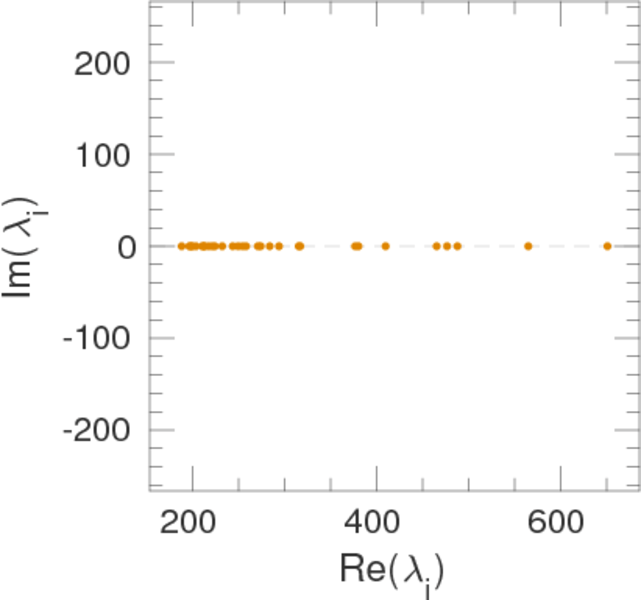
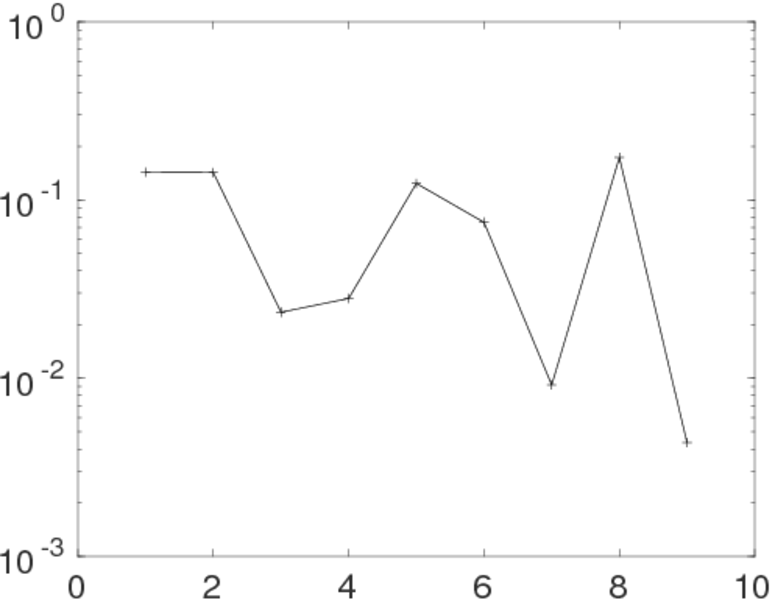
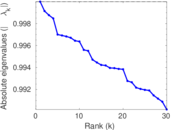
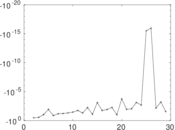
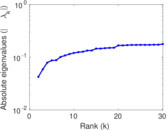
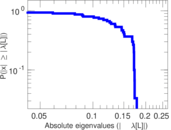
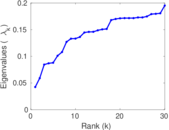
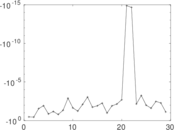
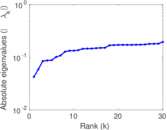
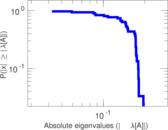
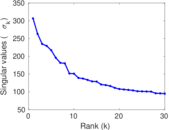
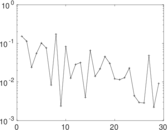
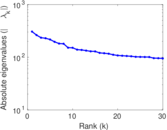
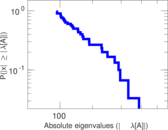
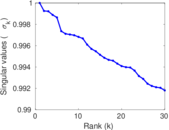
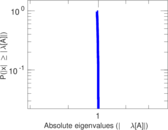
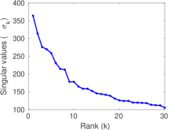
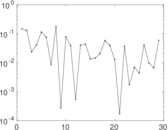
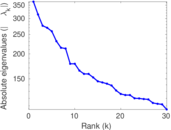
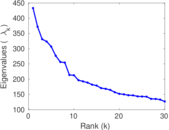
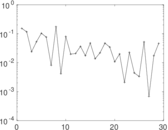
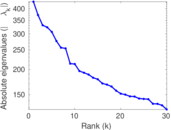
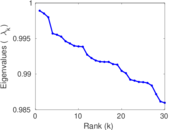
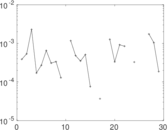
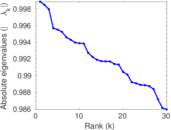
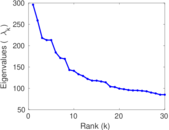
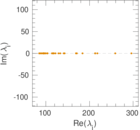
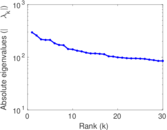
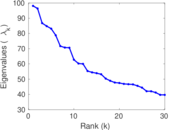
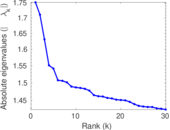
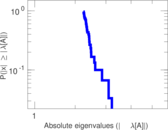
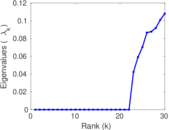
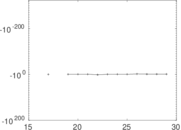
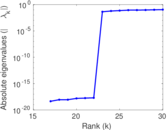
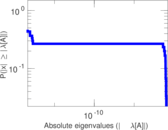
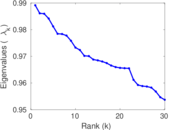
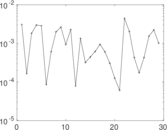
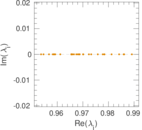
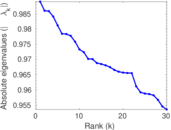
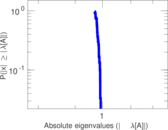
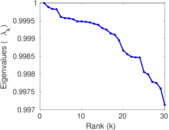
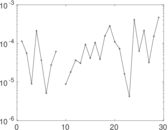
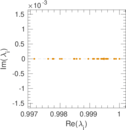
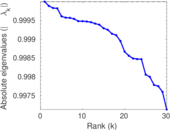
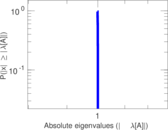
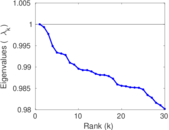
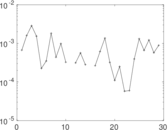
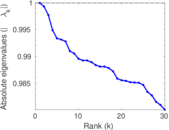
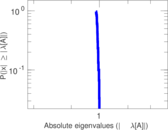
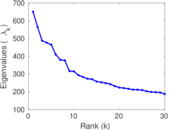
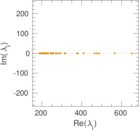
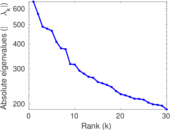
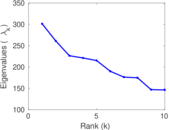
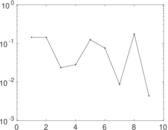
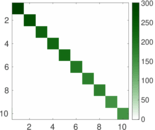
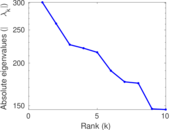
Matrix decompositions plots


Downloads
References
|
[1]
|
Jérôme Kunegis.
KONECT – The Koblenz Network Collection.
In Proc. Int. Conf. on World Wide Web Companion, pages
1343–1350, 2013.
[ http ]
|
 KONECT ‣ Networks ‣
Buy Me a Coffee
KONECT ‣ Networks ‣
Buy Me a Coffee