Wikipedia links (sco)
This network consists of the wikilinks of the Wikipedia in the Scots language
(sco). Nodes are Wikipedia articles, and directed edges are wikilinks, i.e.,
hyperlinks within one wiki. In the wiki source, these are indicated with
[[double brackets]]. Only pages in the article namespace are included.
Metadata
Statistics
| Size | n = | 64,347
|
| Volume | m = | 1,397,072
|
| Wedge count | s = | 412,953,327
|
| Claw count | z = | 633,118,413,573
|
| Triangle count | t = | 16,471,247
|
| Square count | q = | 2,157,090,491
|
| 4-Tour count | T4 = | 15,974,561,712
|
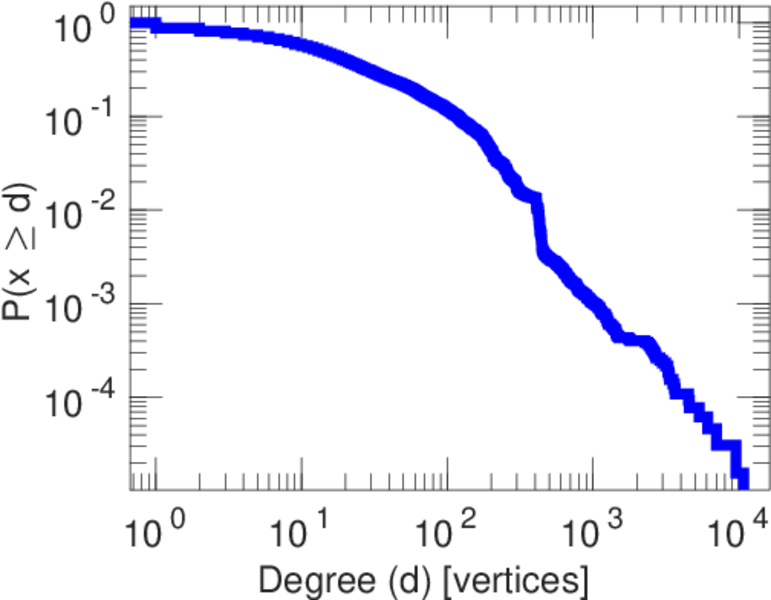
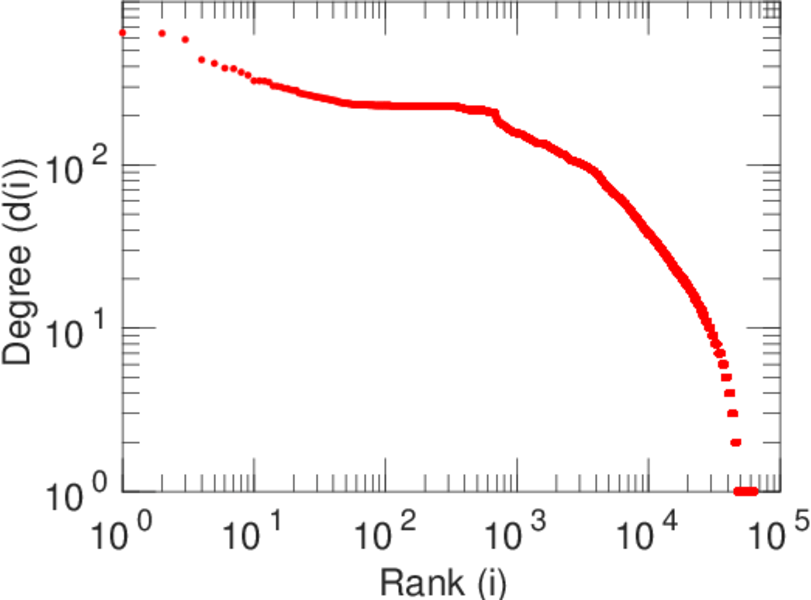
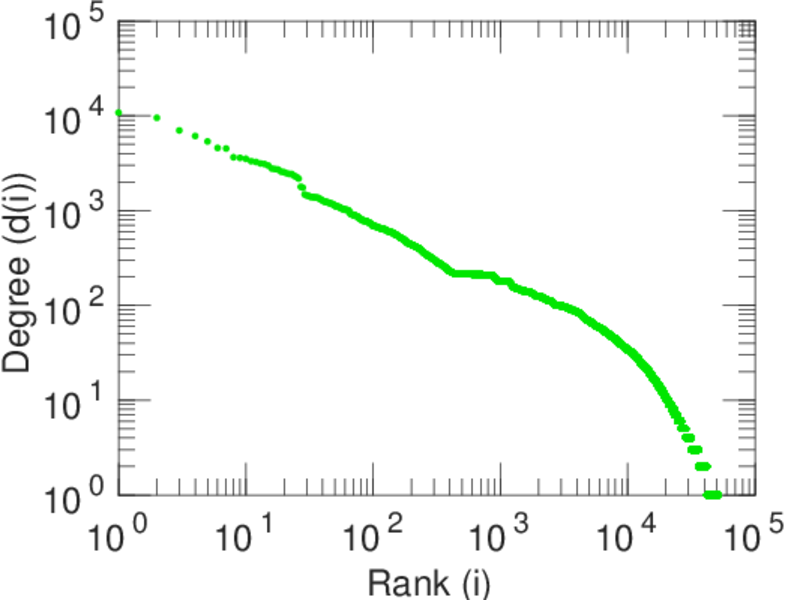
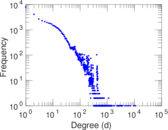
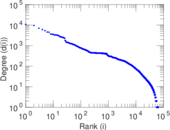
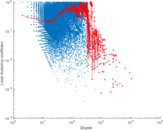
| Maximum degree | dmax = | 10,803
|
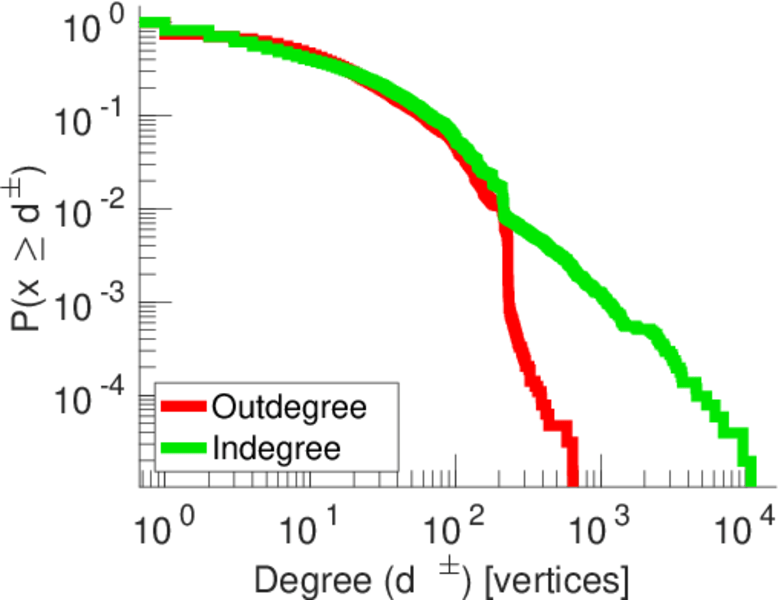
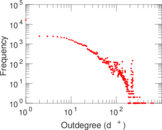
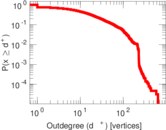
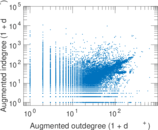
| Maximum outdegree | d+max = | 644
|
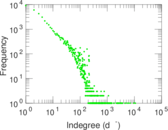
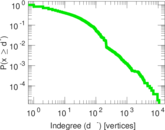
| Maximum indegree | d−max = | 10,802
|
| Average degree | d = | 43.423 1
|
| Size of LCC | N = | 64,278
|
| Size of LSCC | Ns = | 46,609
|
| Relative size of LSCC | Nrs = | 0.724 338
|
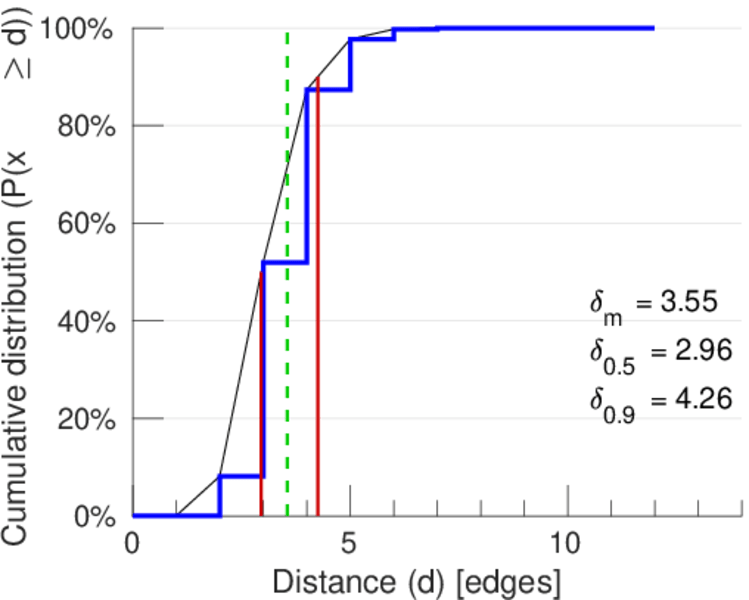
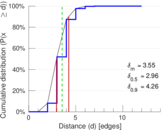
| Diameter | δ = | 13
|
| 50-Percentile effective diameter | δ0.5 = | 2.955 86
|
| 90-Percentile effective diameter | δ0.9 = | 4.256 89
|
| Median distance | δM = | 3
|
| Mean distance | δm = | 3.551 26
|
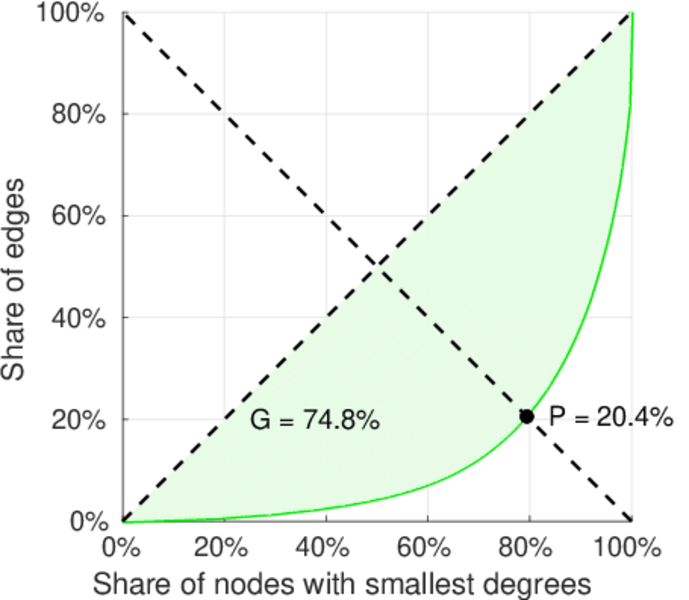
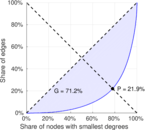
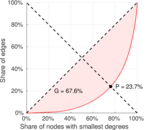
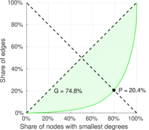
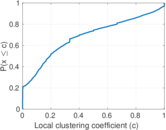
| Gini coefficient | G = | 0.711 634
|
| Balanced inequality ratio | P = | 0.218 703
|
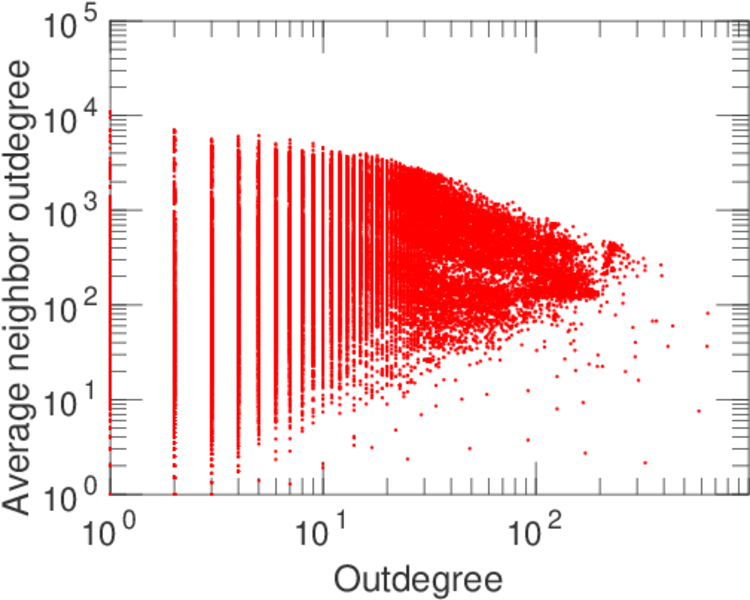
| Outdegree balanced inequality ratio | P+ = | 0.237 437
|
| Indegree balanced inequality ratio | P− = | 0.204 168
|
| Relative edge distribution entropy | Her = | 0.903 987
|
| Power law exponent | γ = | 1.409 50
|
| Tail power law exponent | γt = | 2.061 00
|
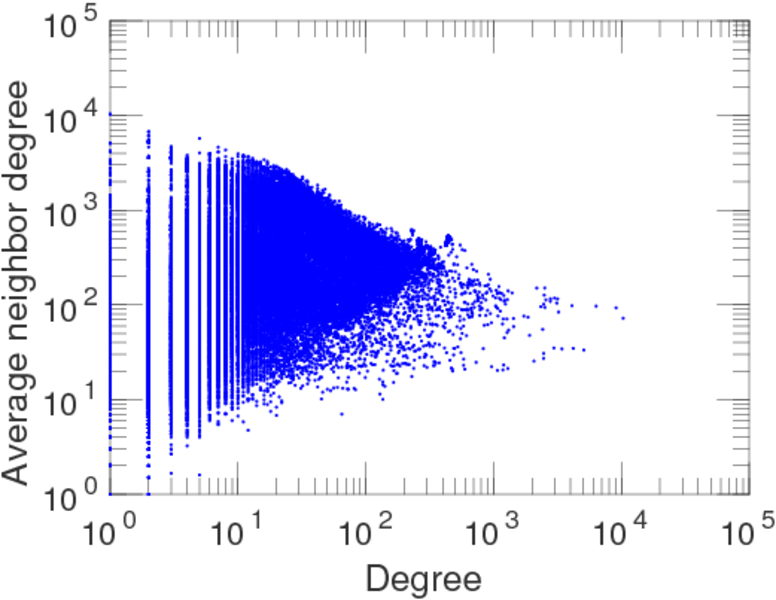
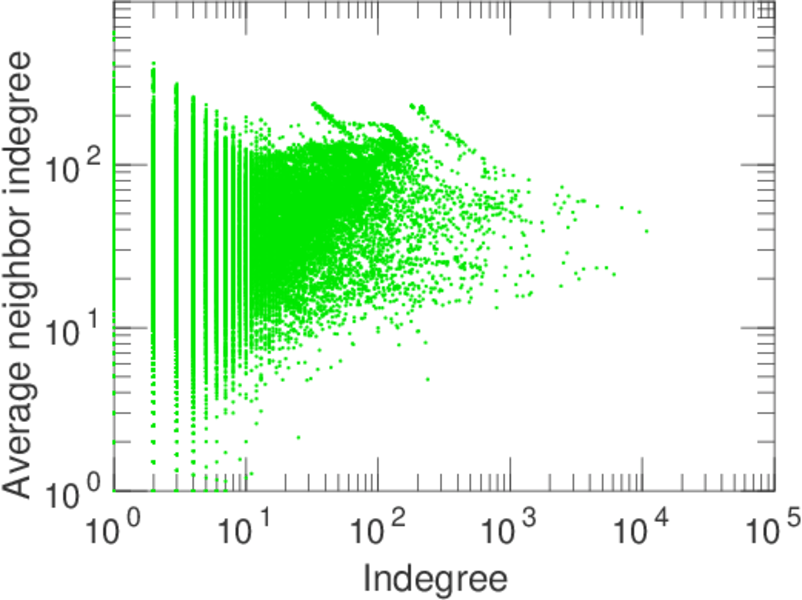
| Degree assortativity | ρ = | −0.065 841 0
|
| Degree assortativity p-value | pρ = | 0.000 00
|
| In/outdegree correlation | ρ± = | +0.681 845
|
| Clustering coefficient | c = | 0.119 659
|
| Directed clustering coefficient | c± = | 0.708 254
|
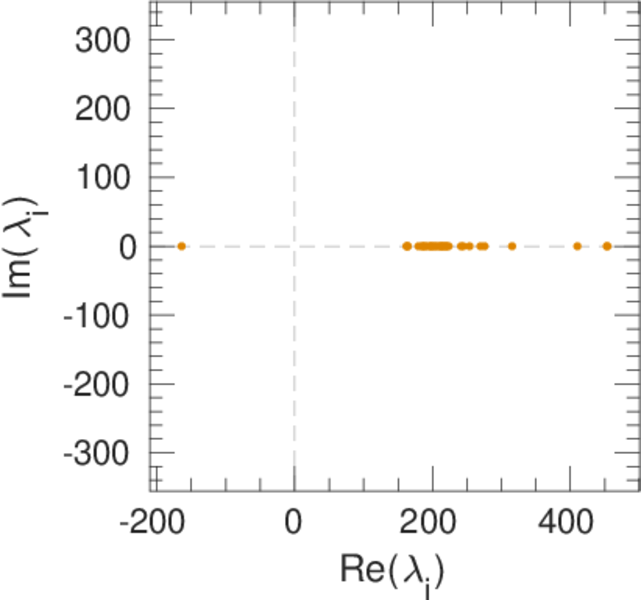
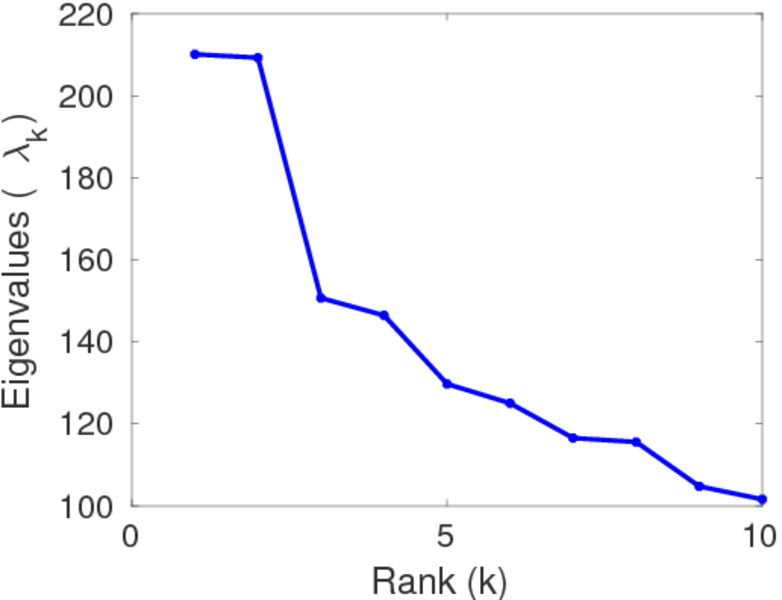
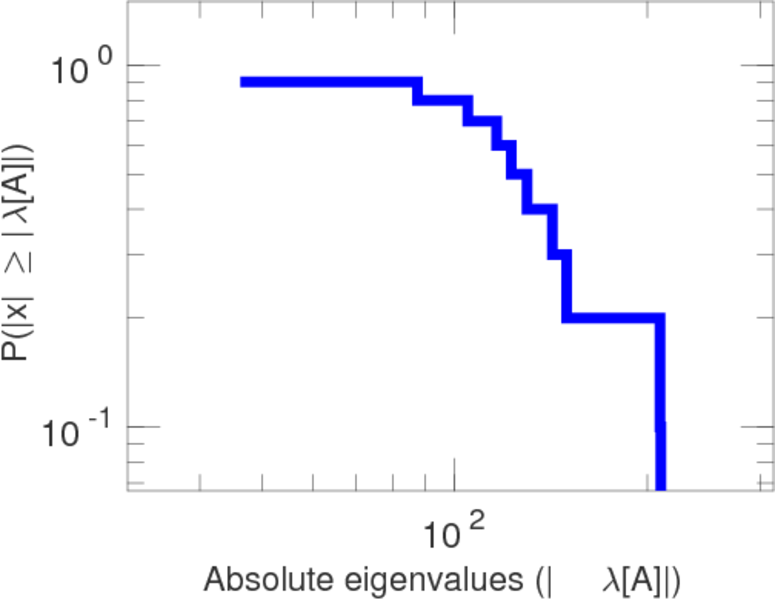
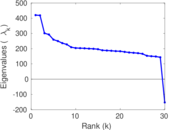
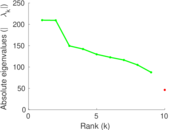
| Operator 2-norm | ν = | 219.582
|
| Cyclic eigenvalue | π = | 208.042
|
| Algebraic connectivity | a = | 0.090 046 5
|
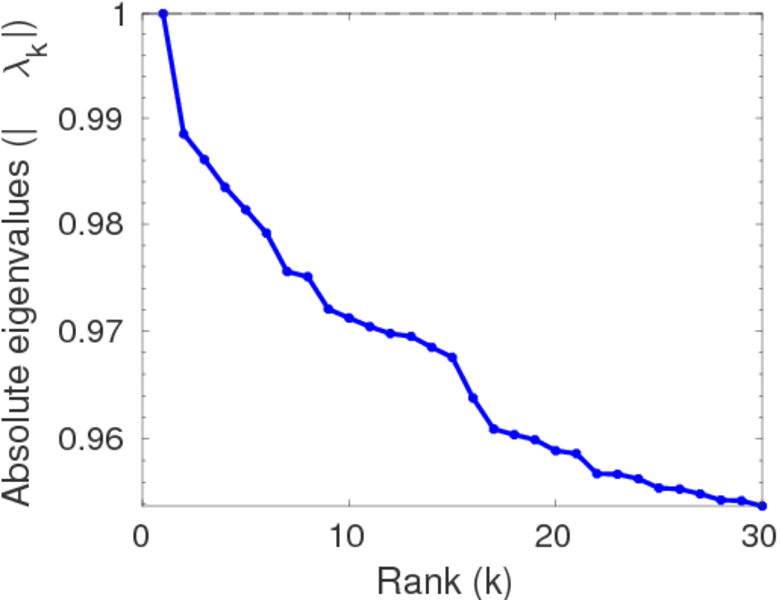
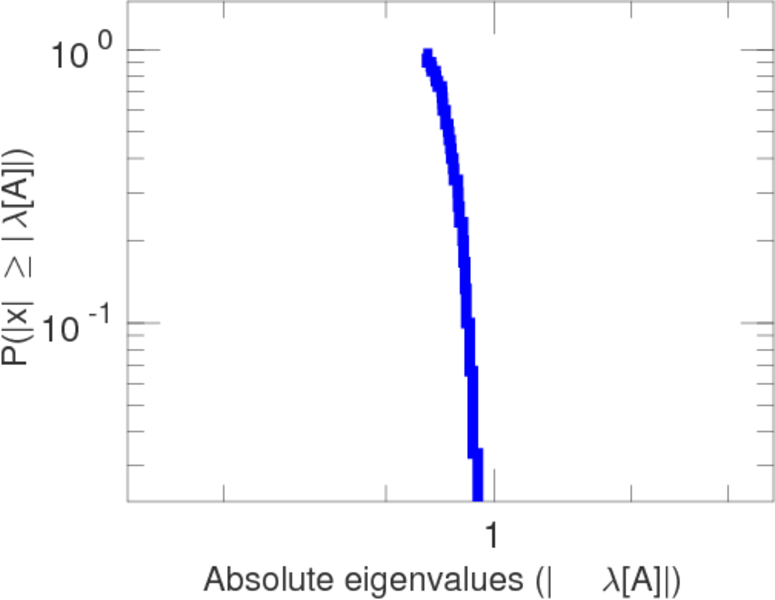
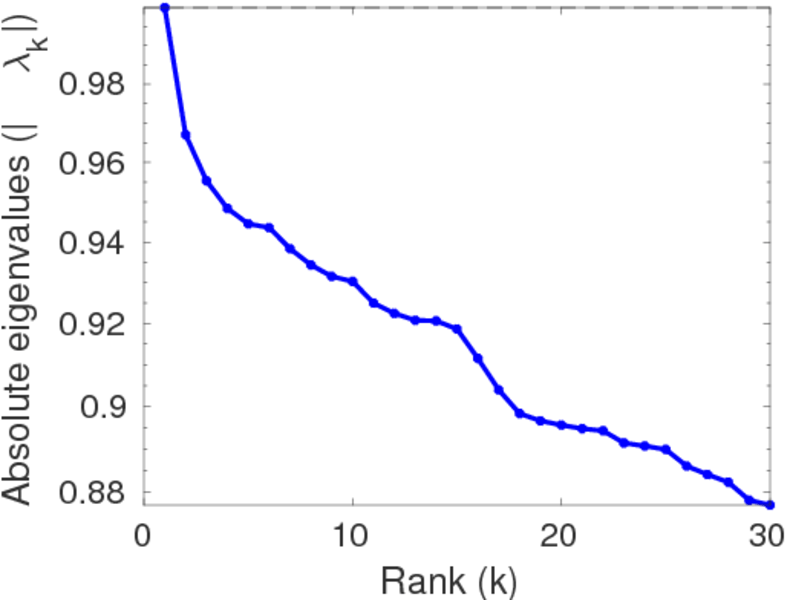
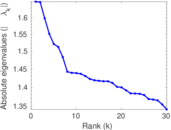
| Spectral separation | |λ1[A] / λ2[A]| = | 1.004 68
|
| Reciprocity | y = | 0.507 068
|
| Non-bipartivity | bA = | 0.607 506
|
| Normalized non-bipartivity | bN = | 0.050 117 1
|
| Spectral bipartite frustration | bK = | 0.000 693 951
|
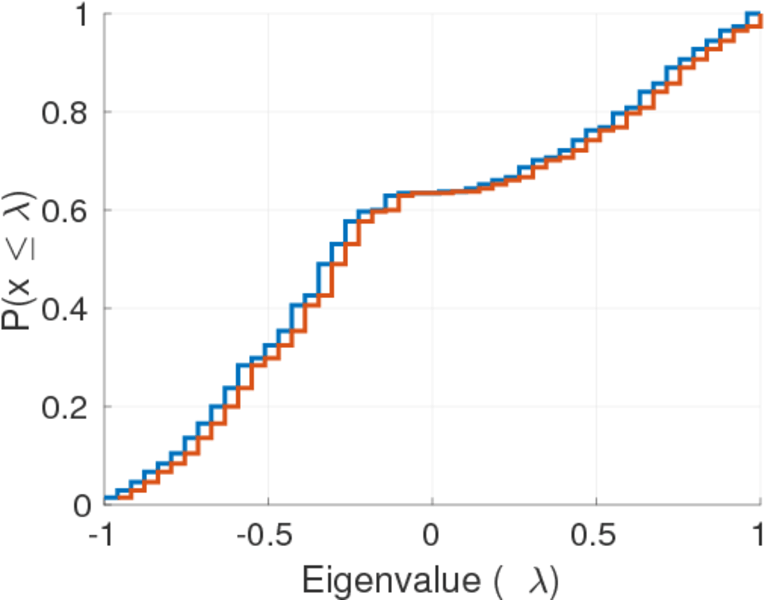
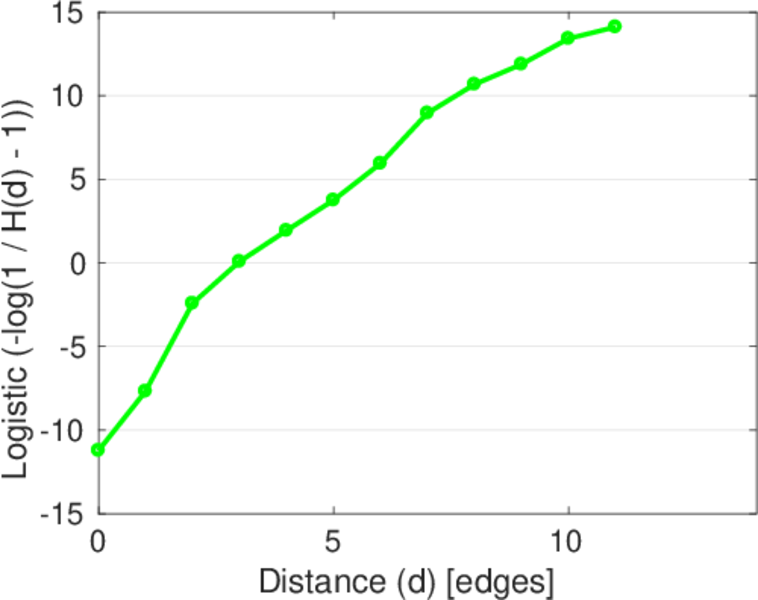
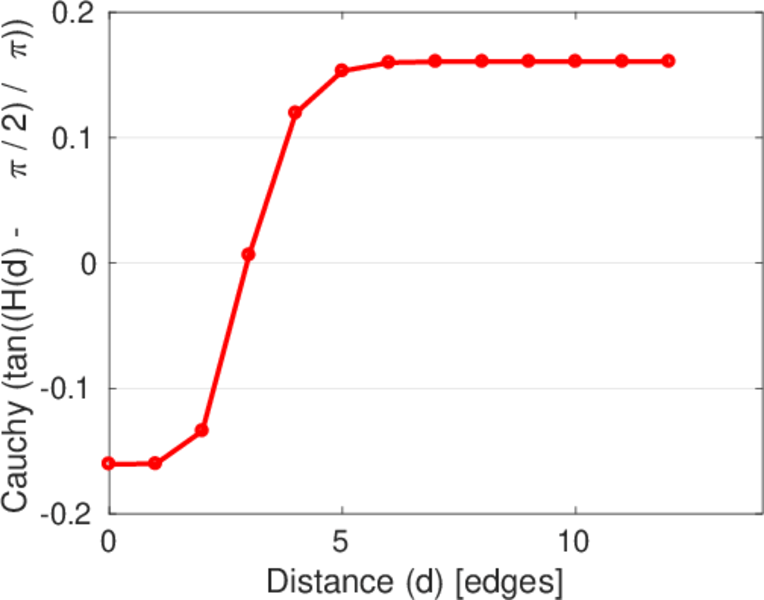
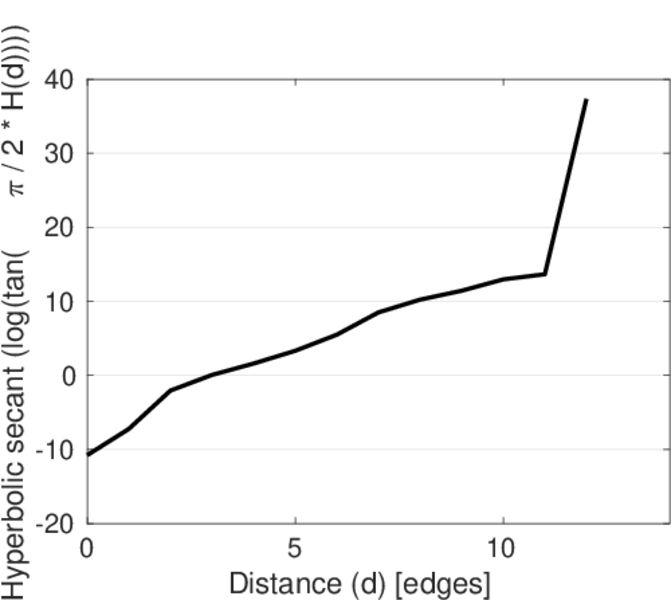
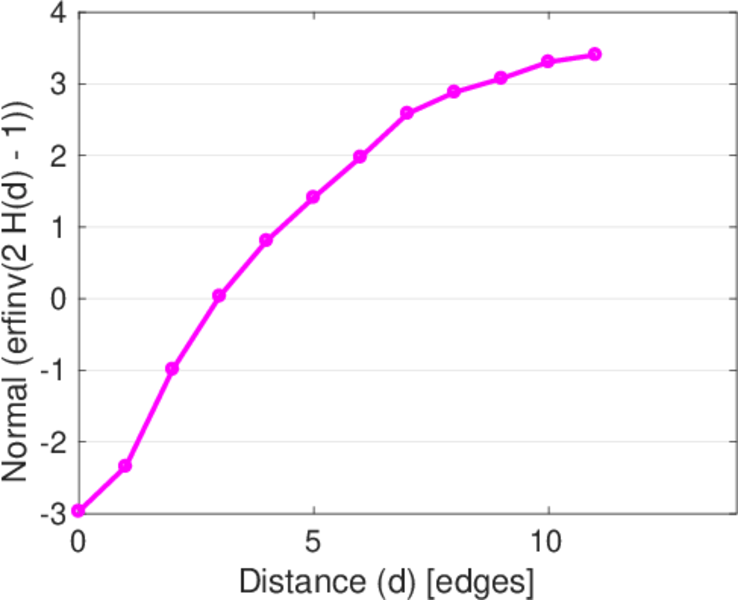
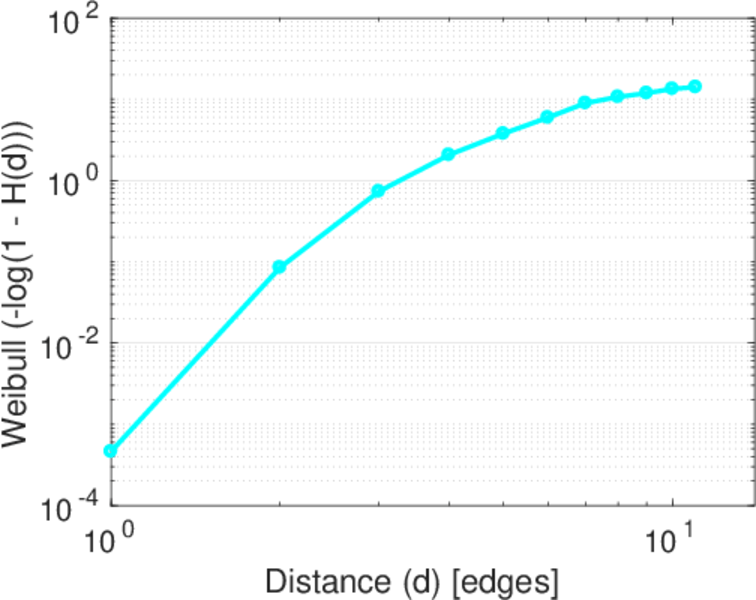
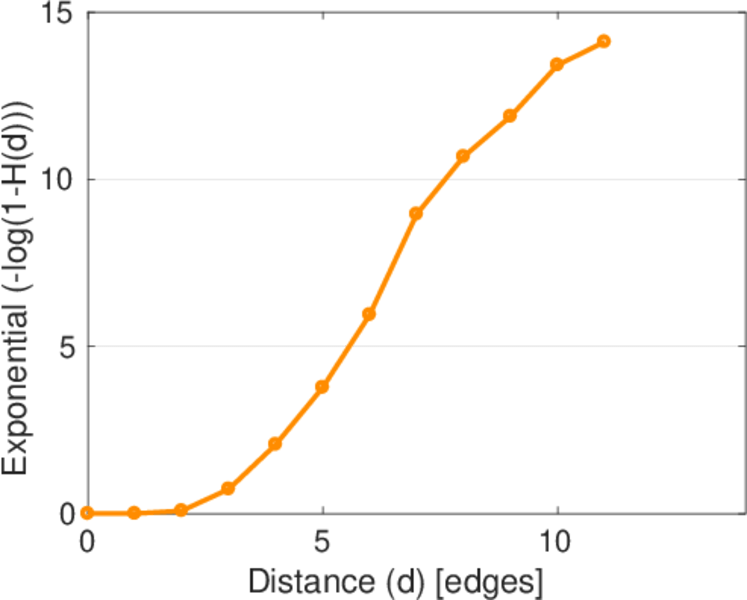
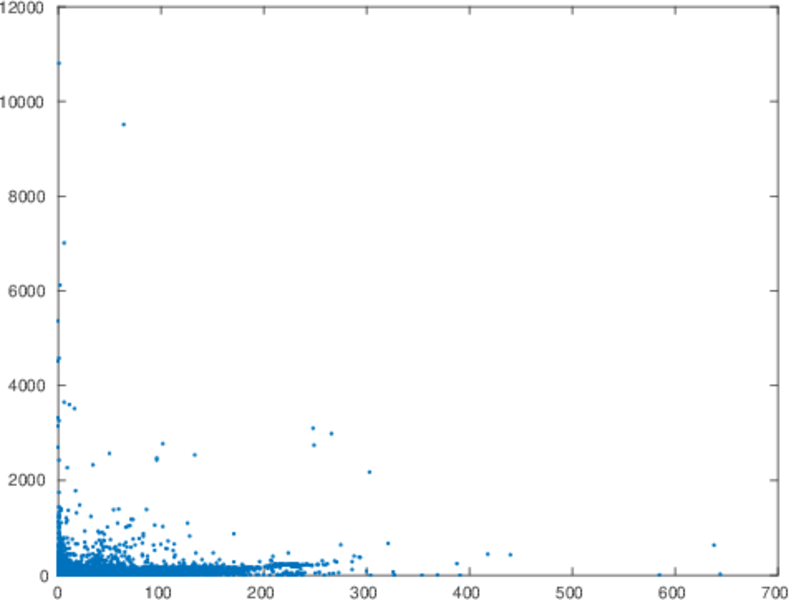
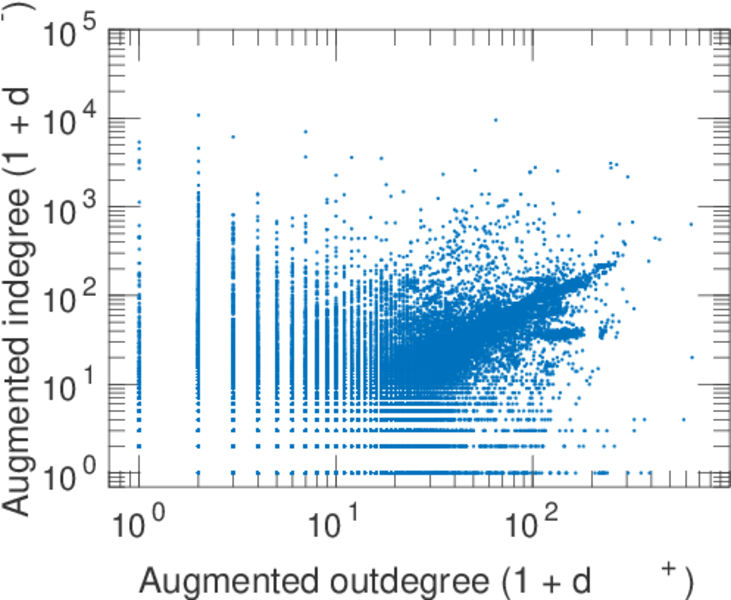
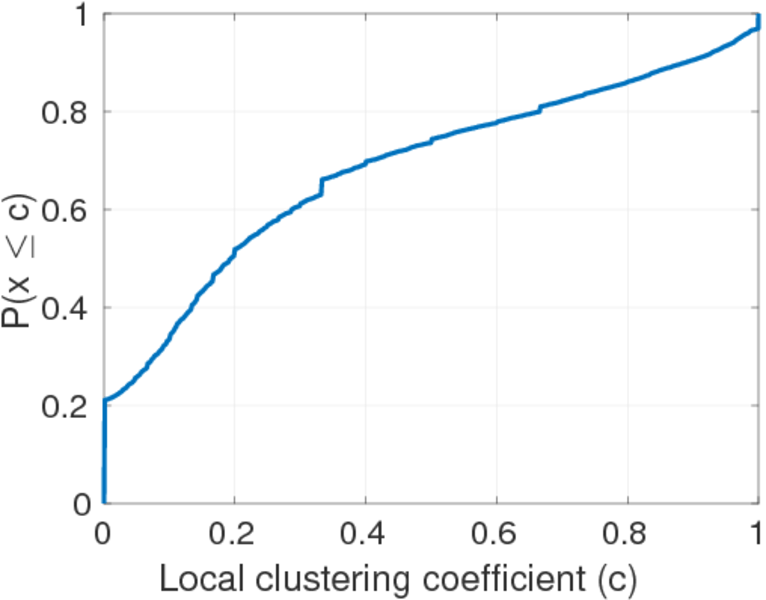
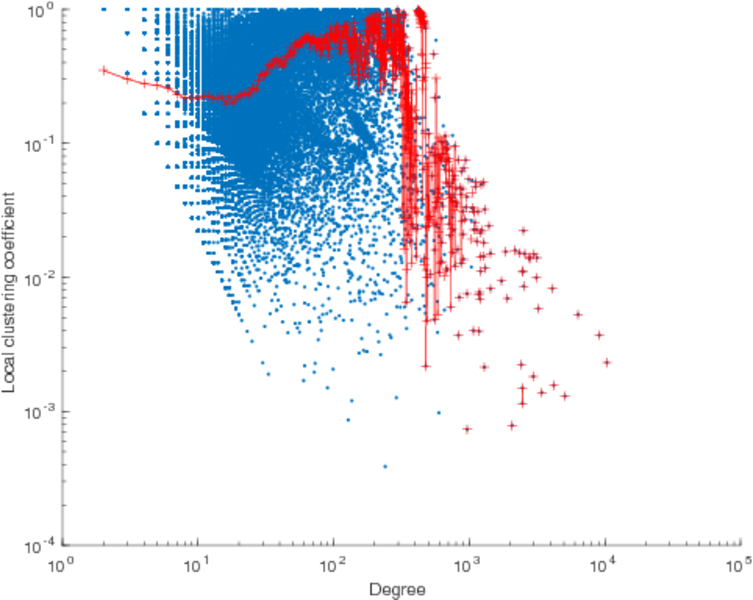
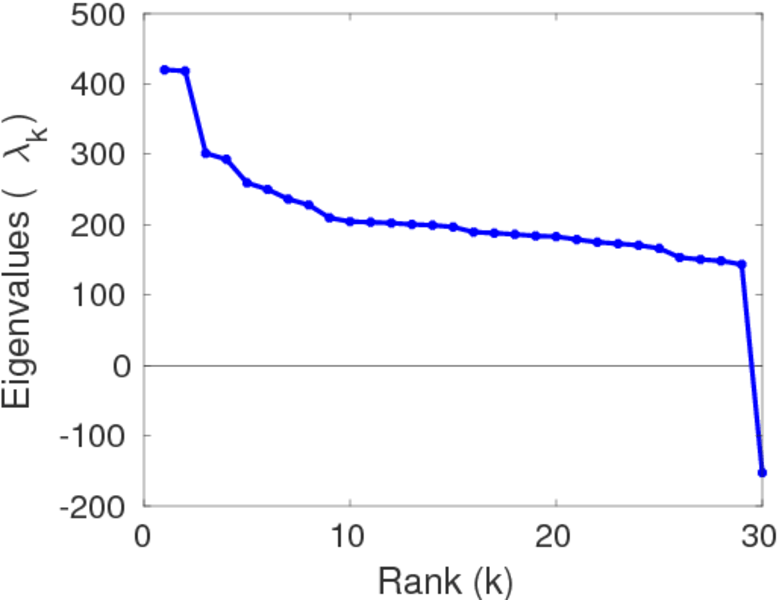
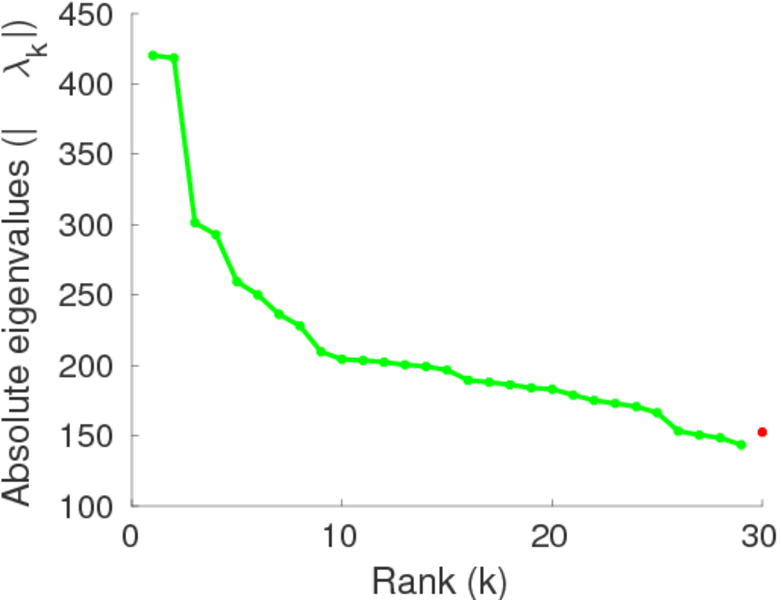
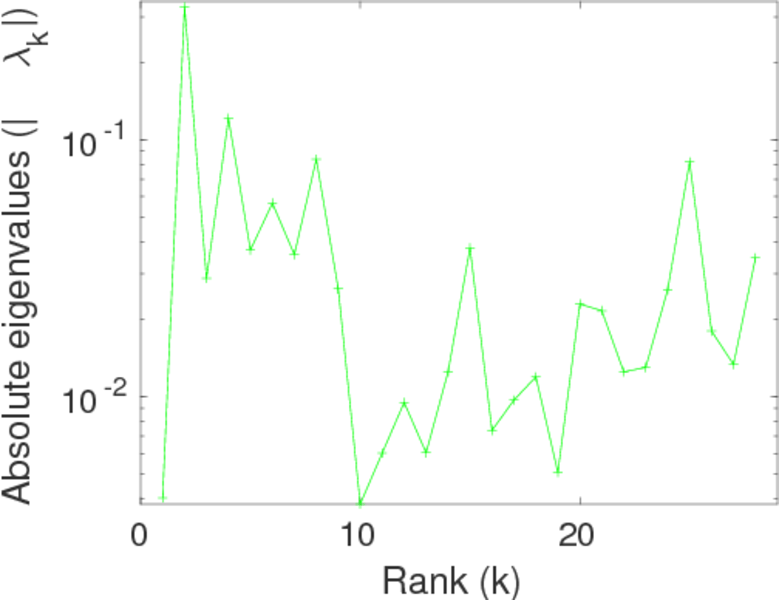
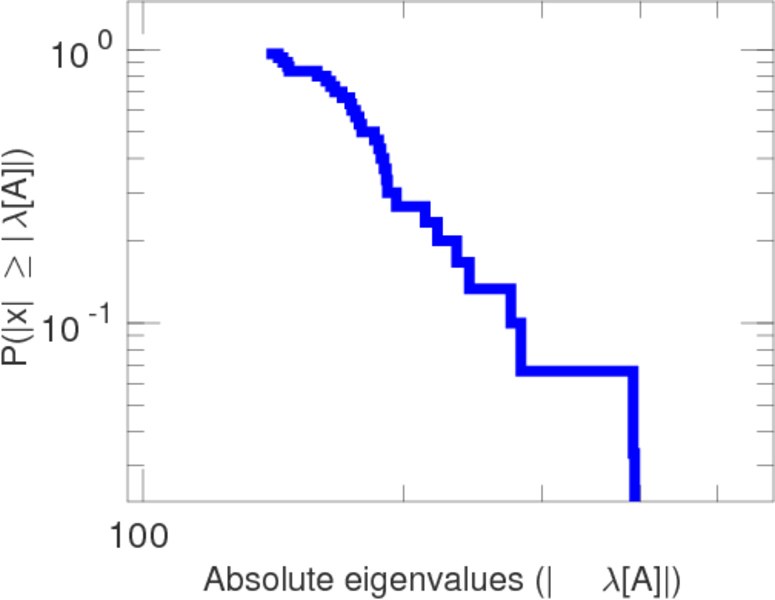
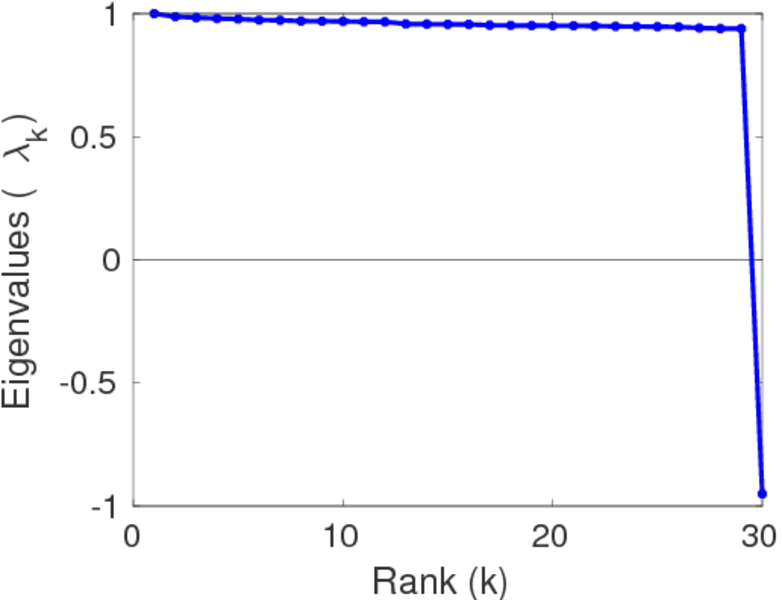
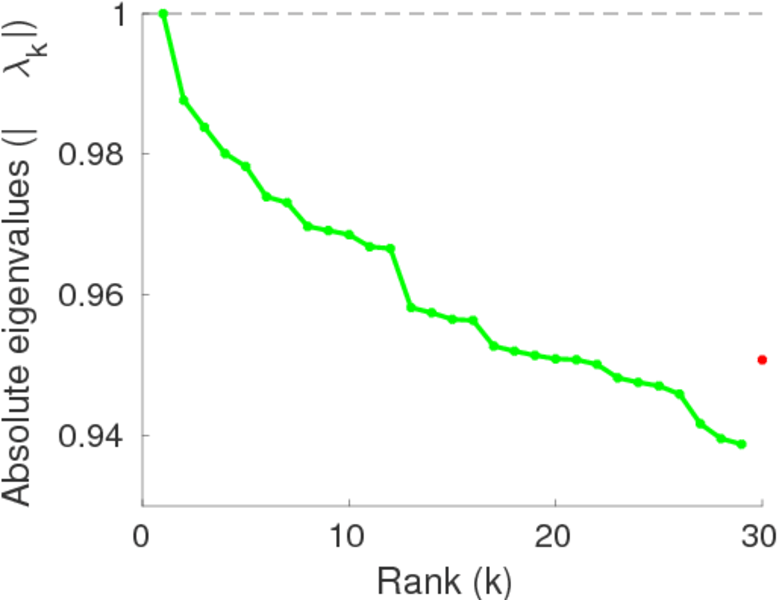
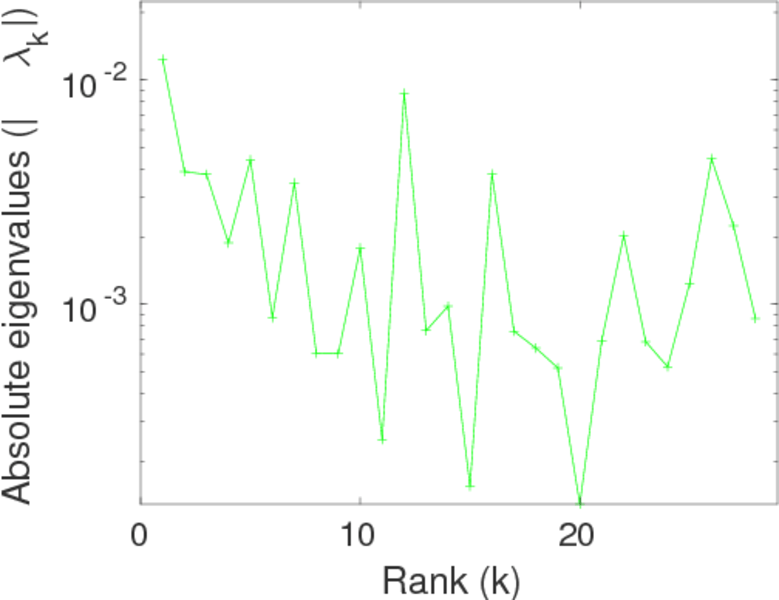
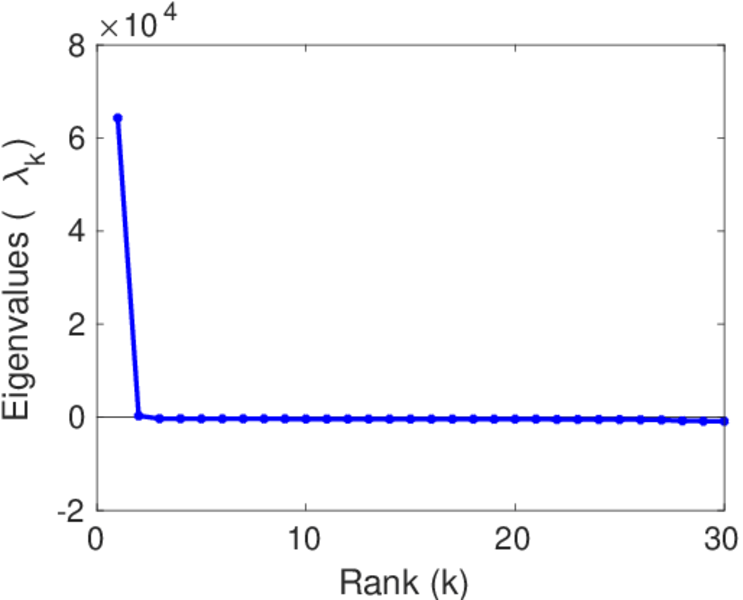
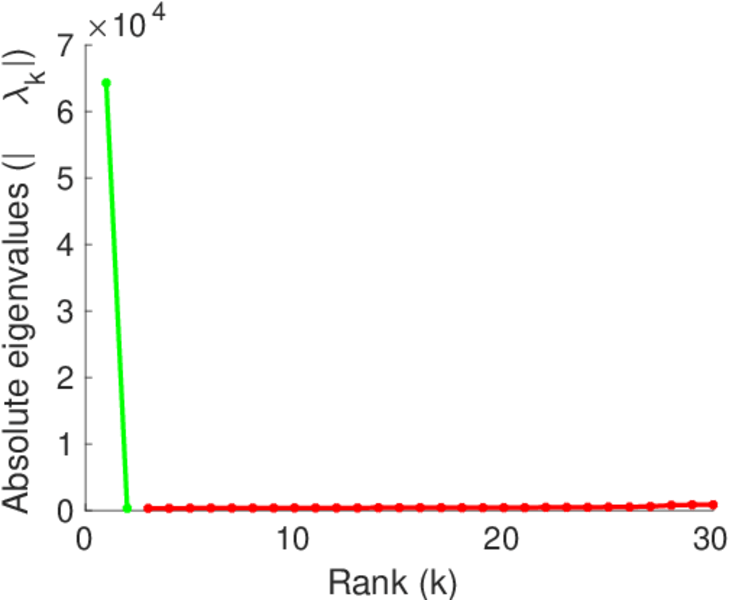
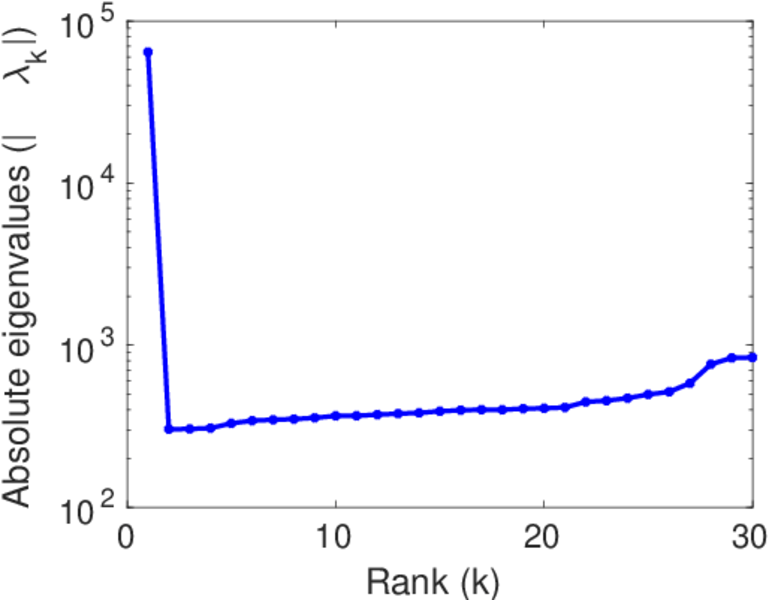
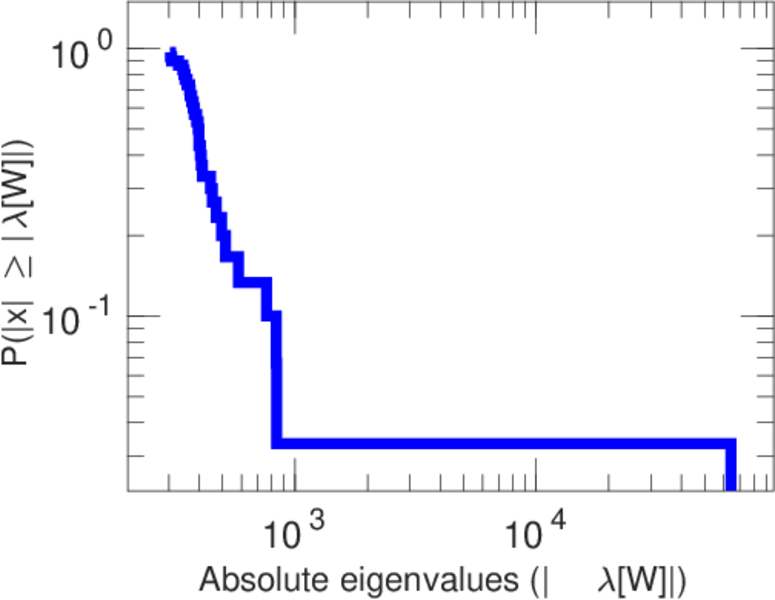
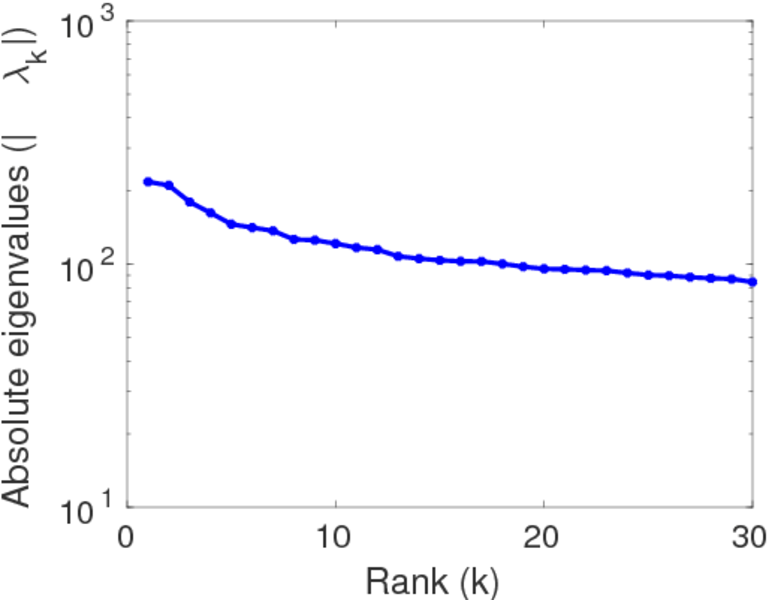
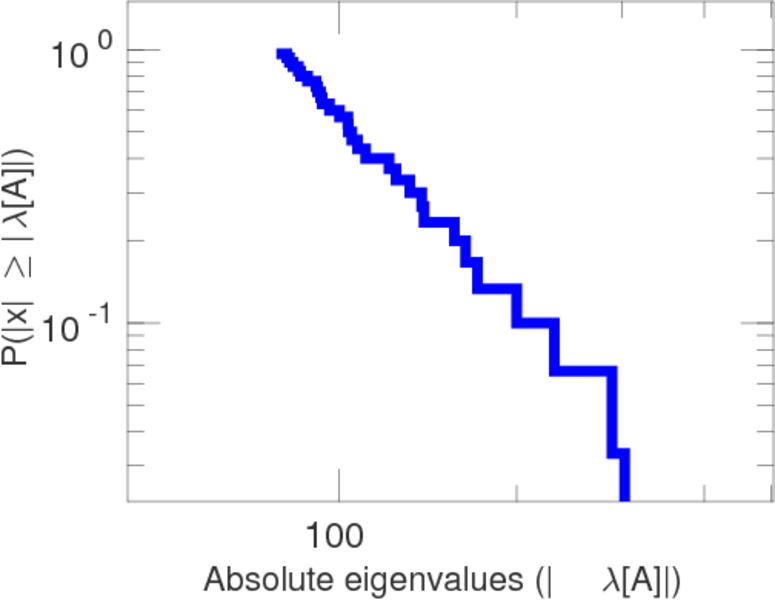
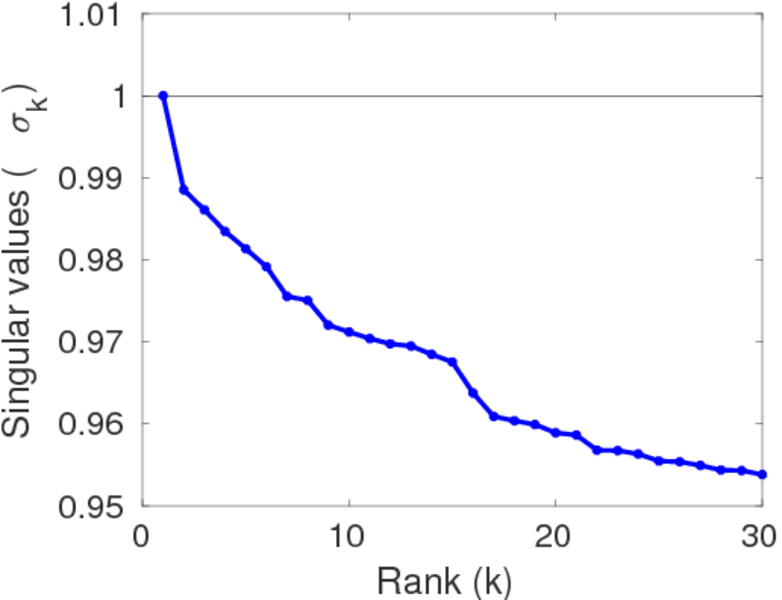
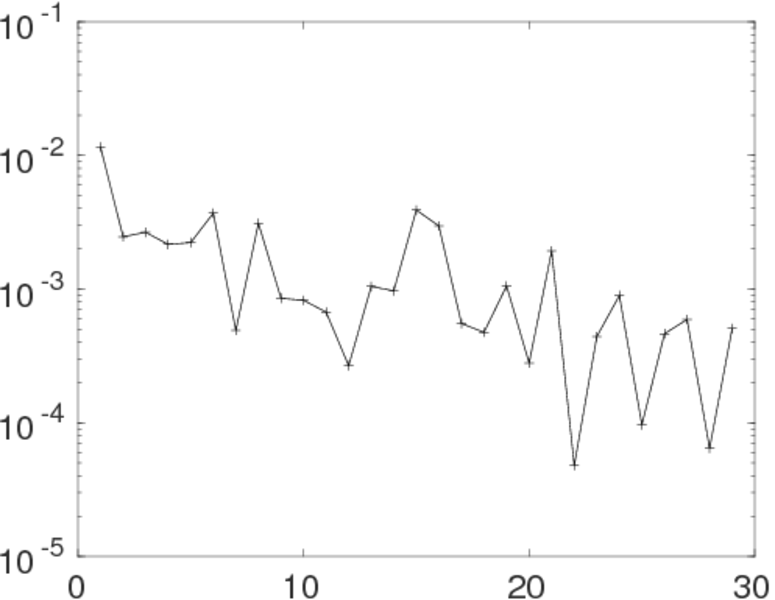
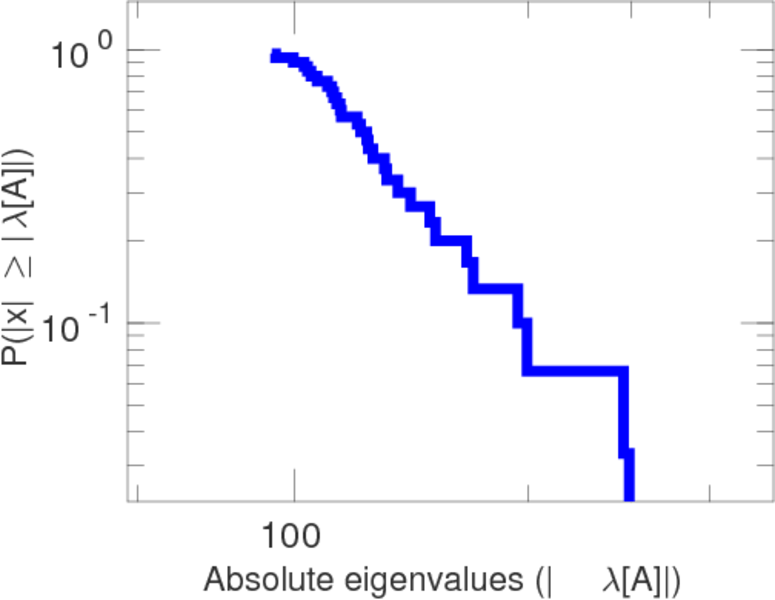
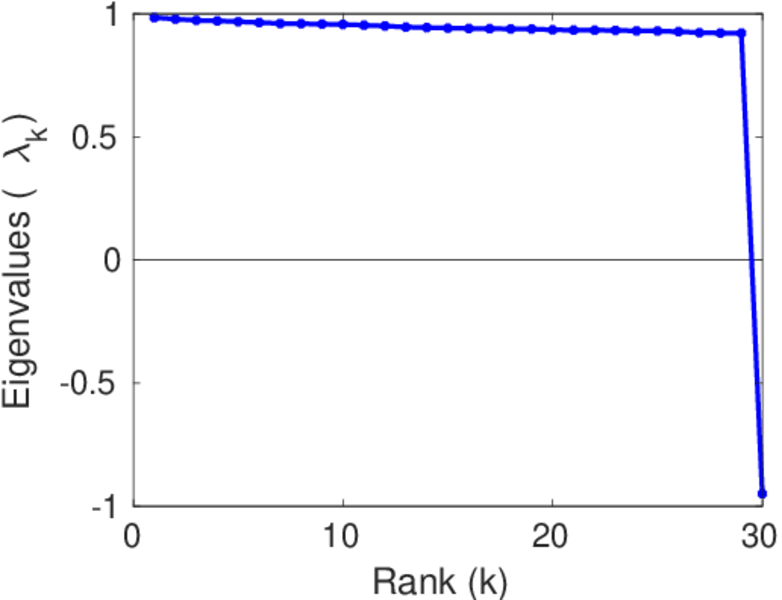
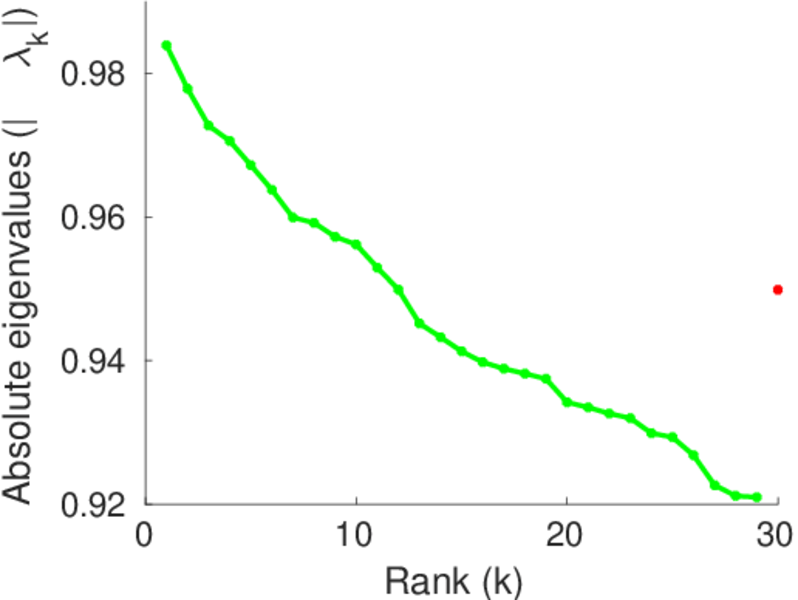
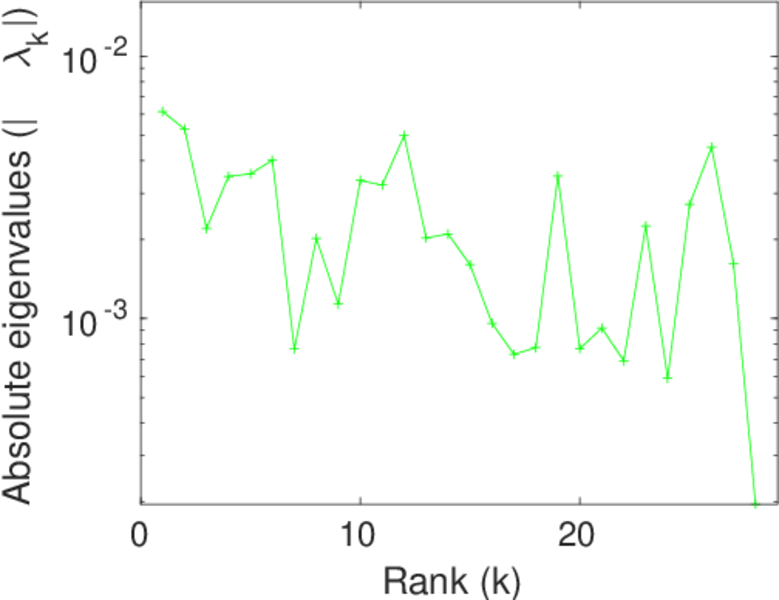
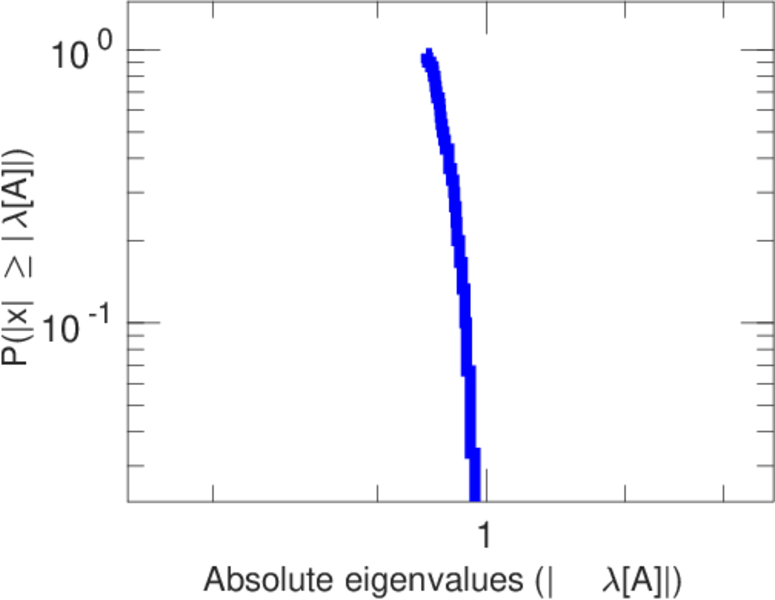
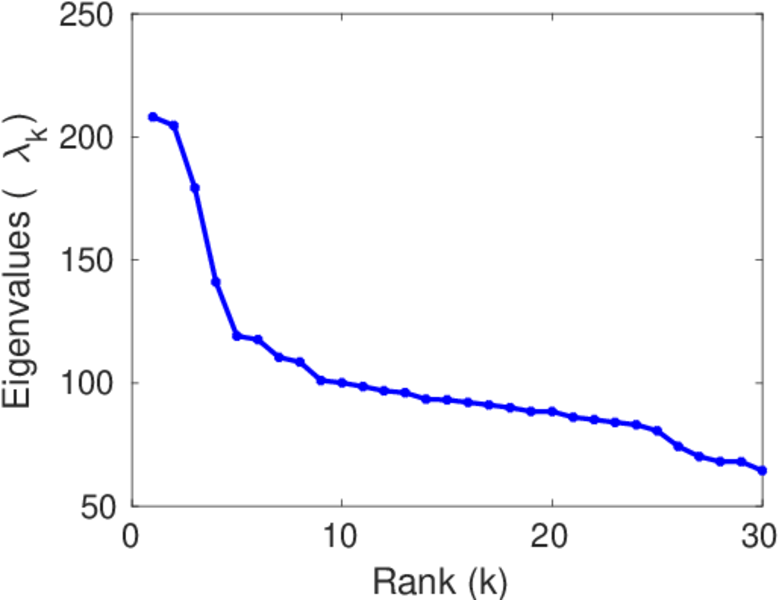
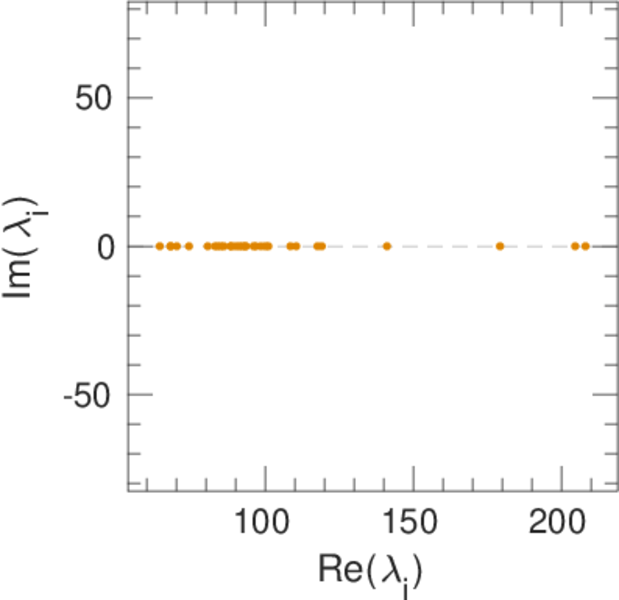
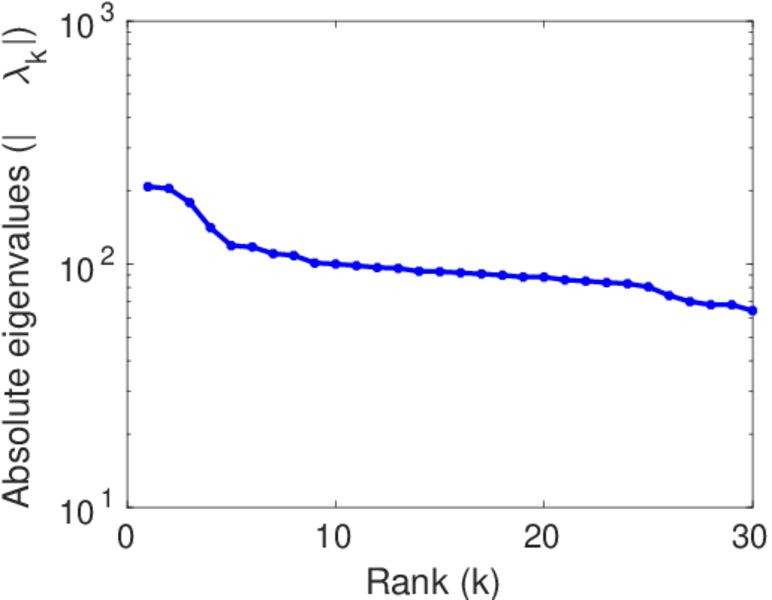
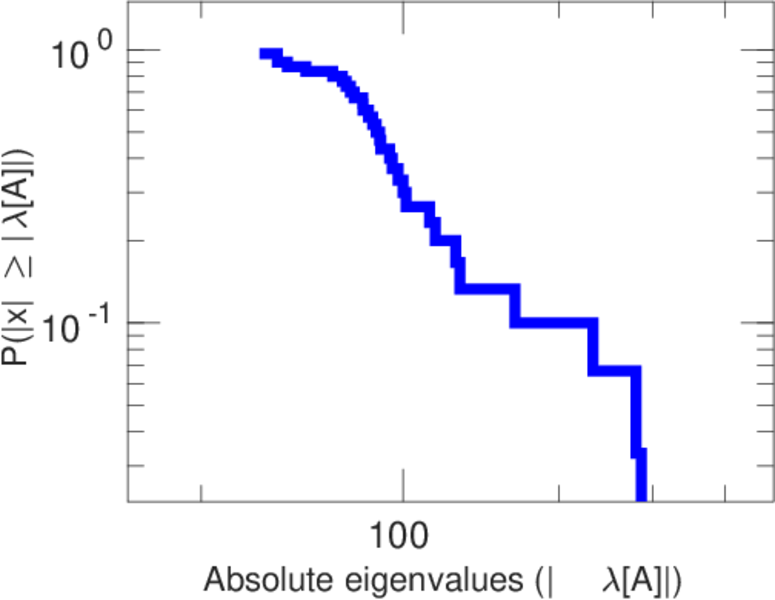
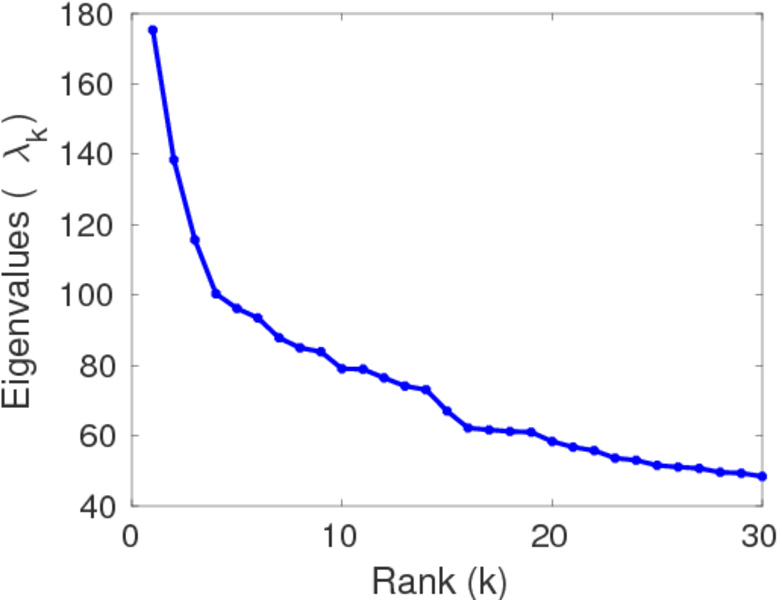
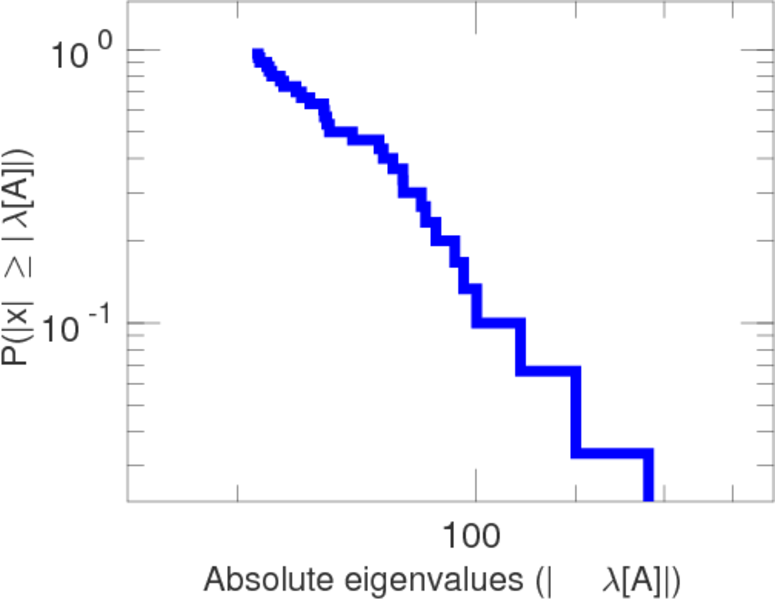
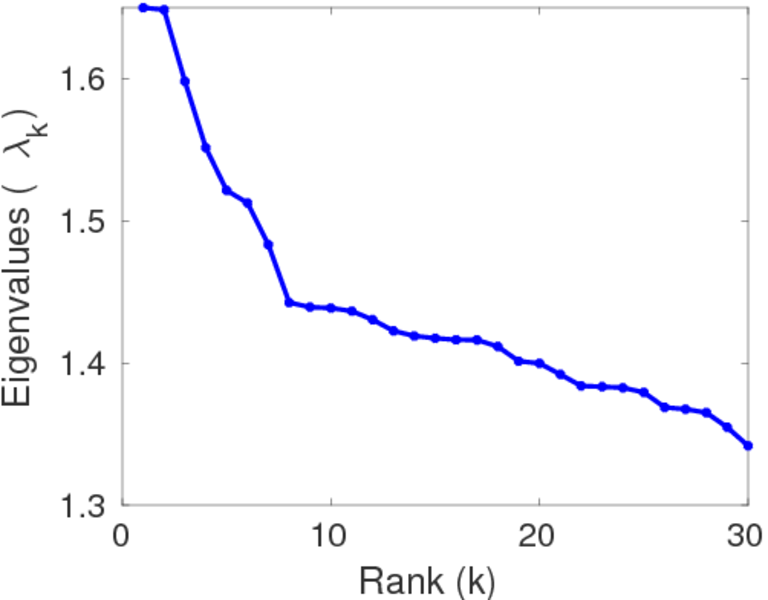
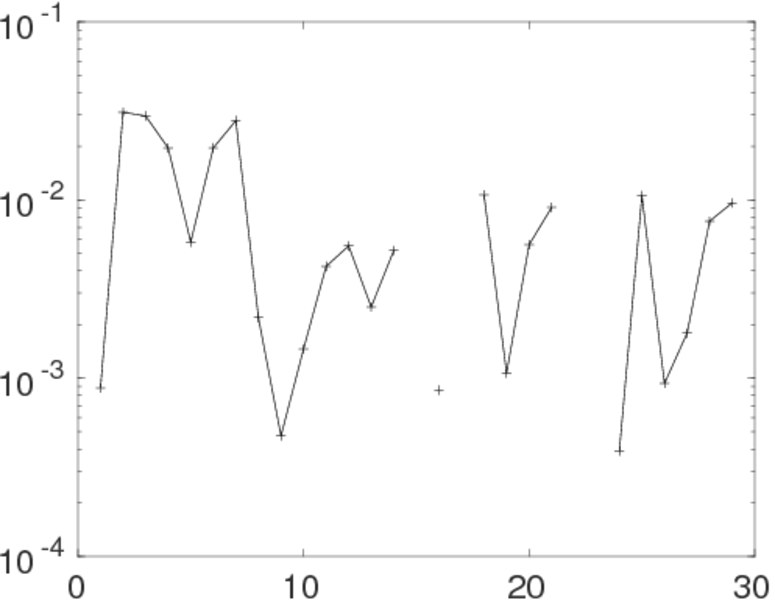
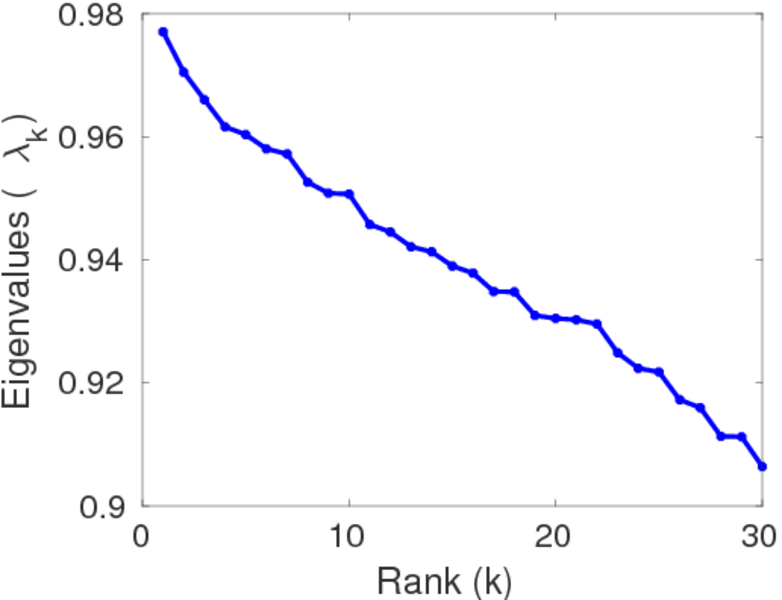
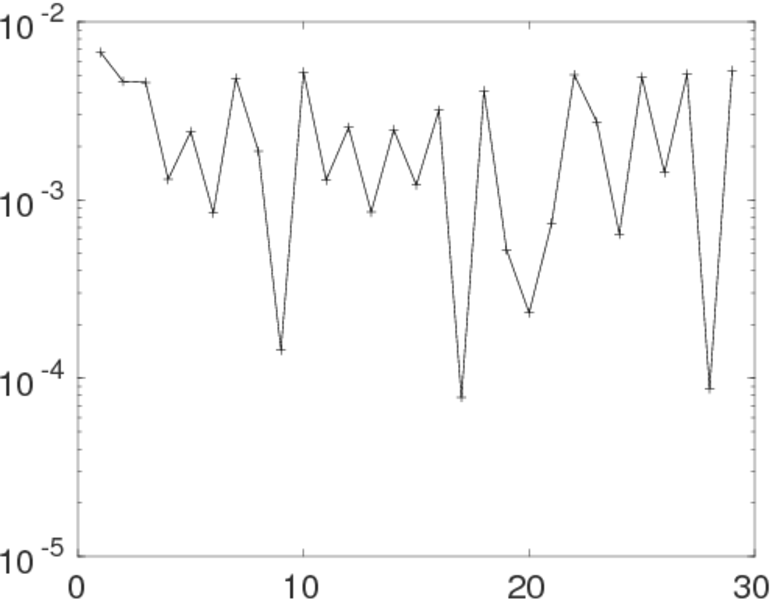
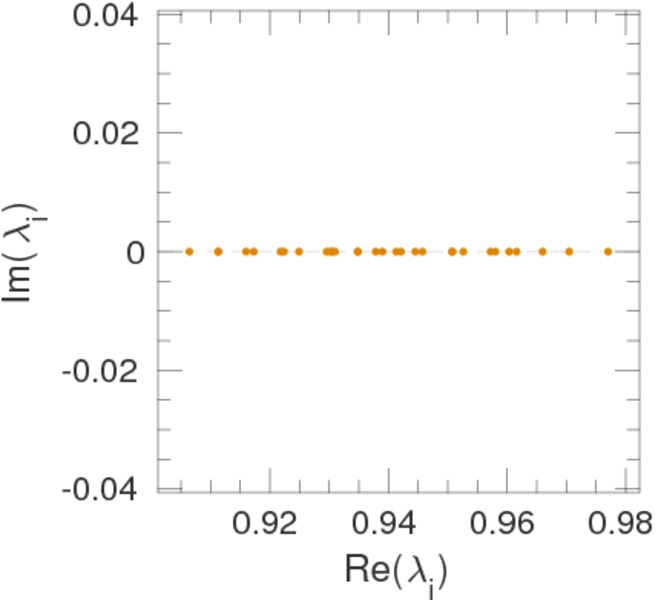
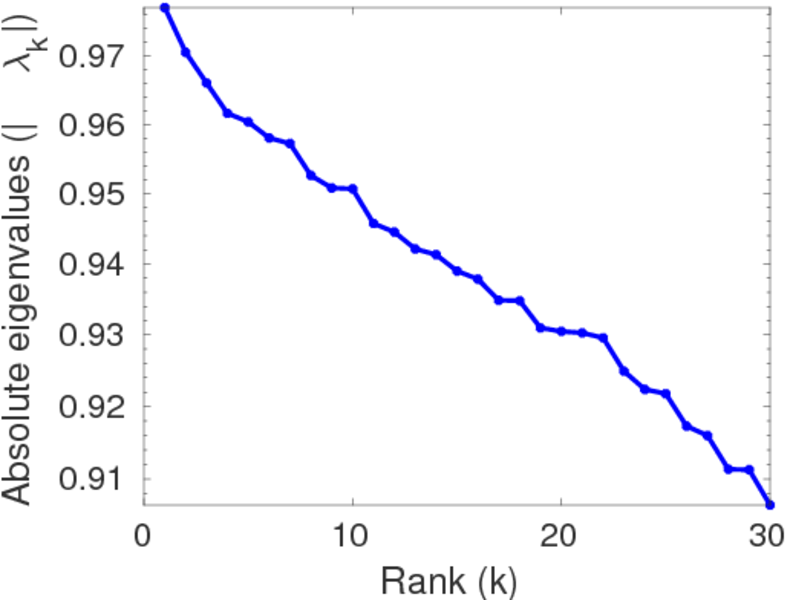
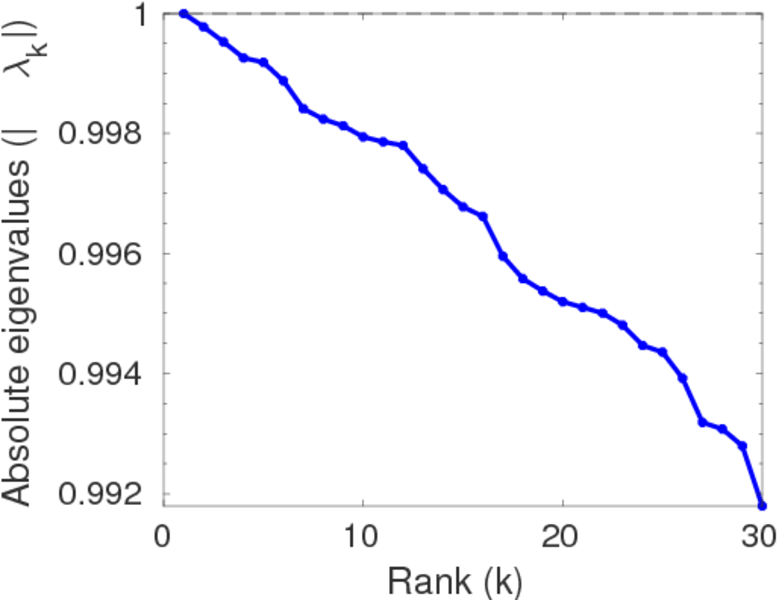
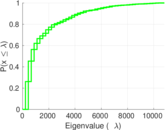
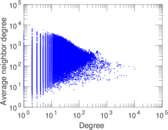
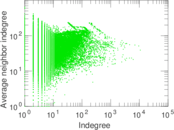
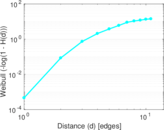
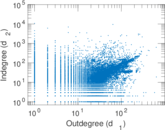
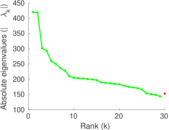
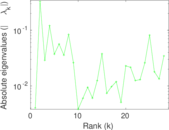
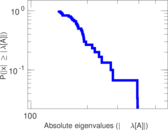
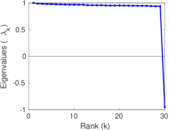
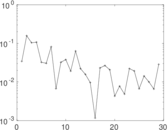
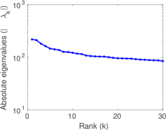
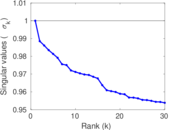
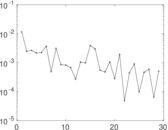
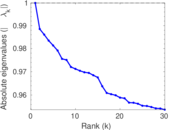
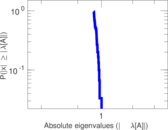
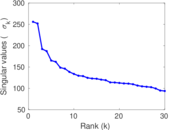
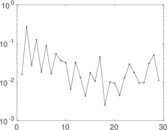
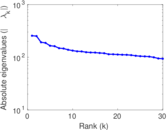
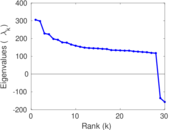
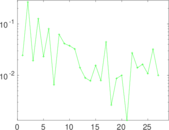
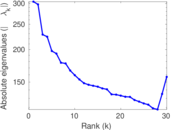
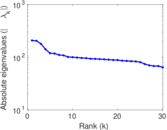
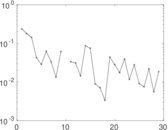
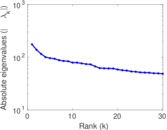
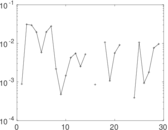
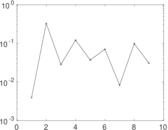
Plots


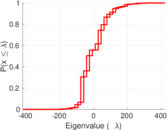
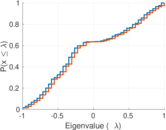
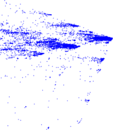


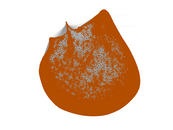

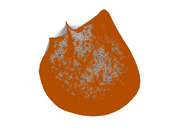

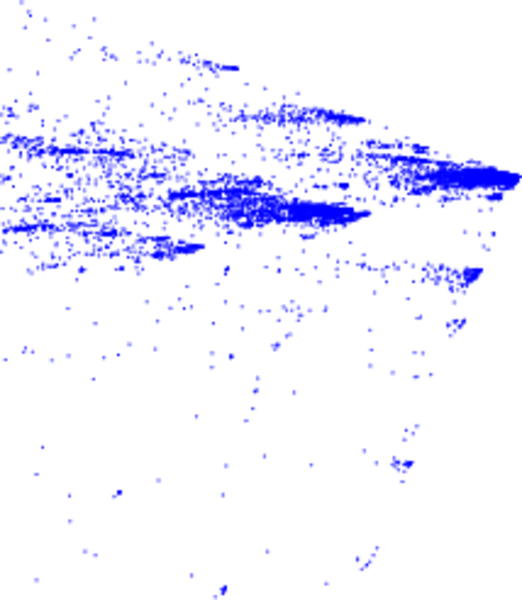
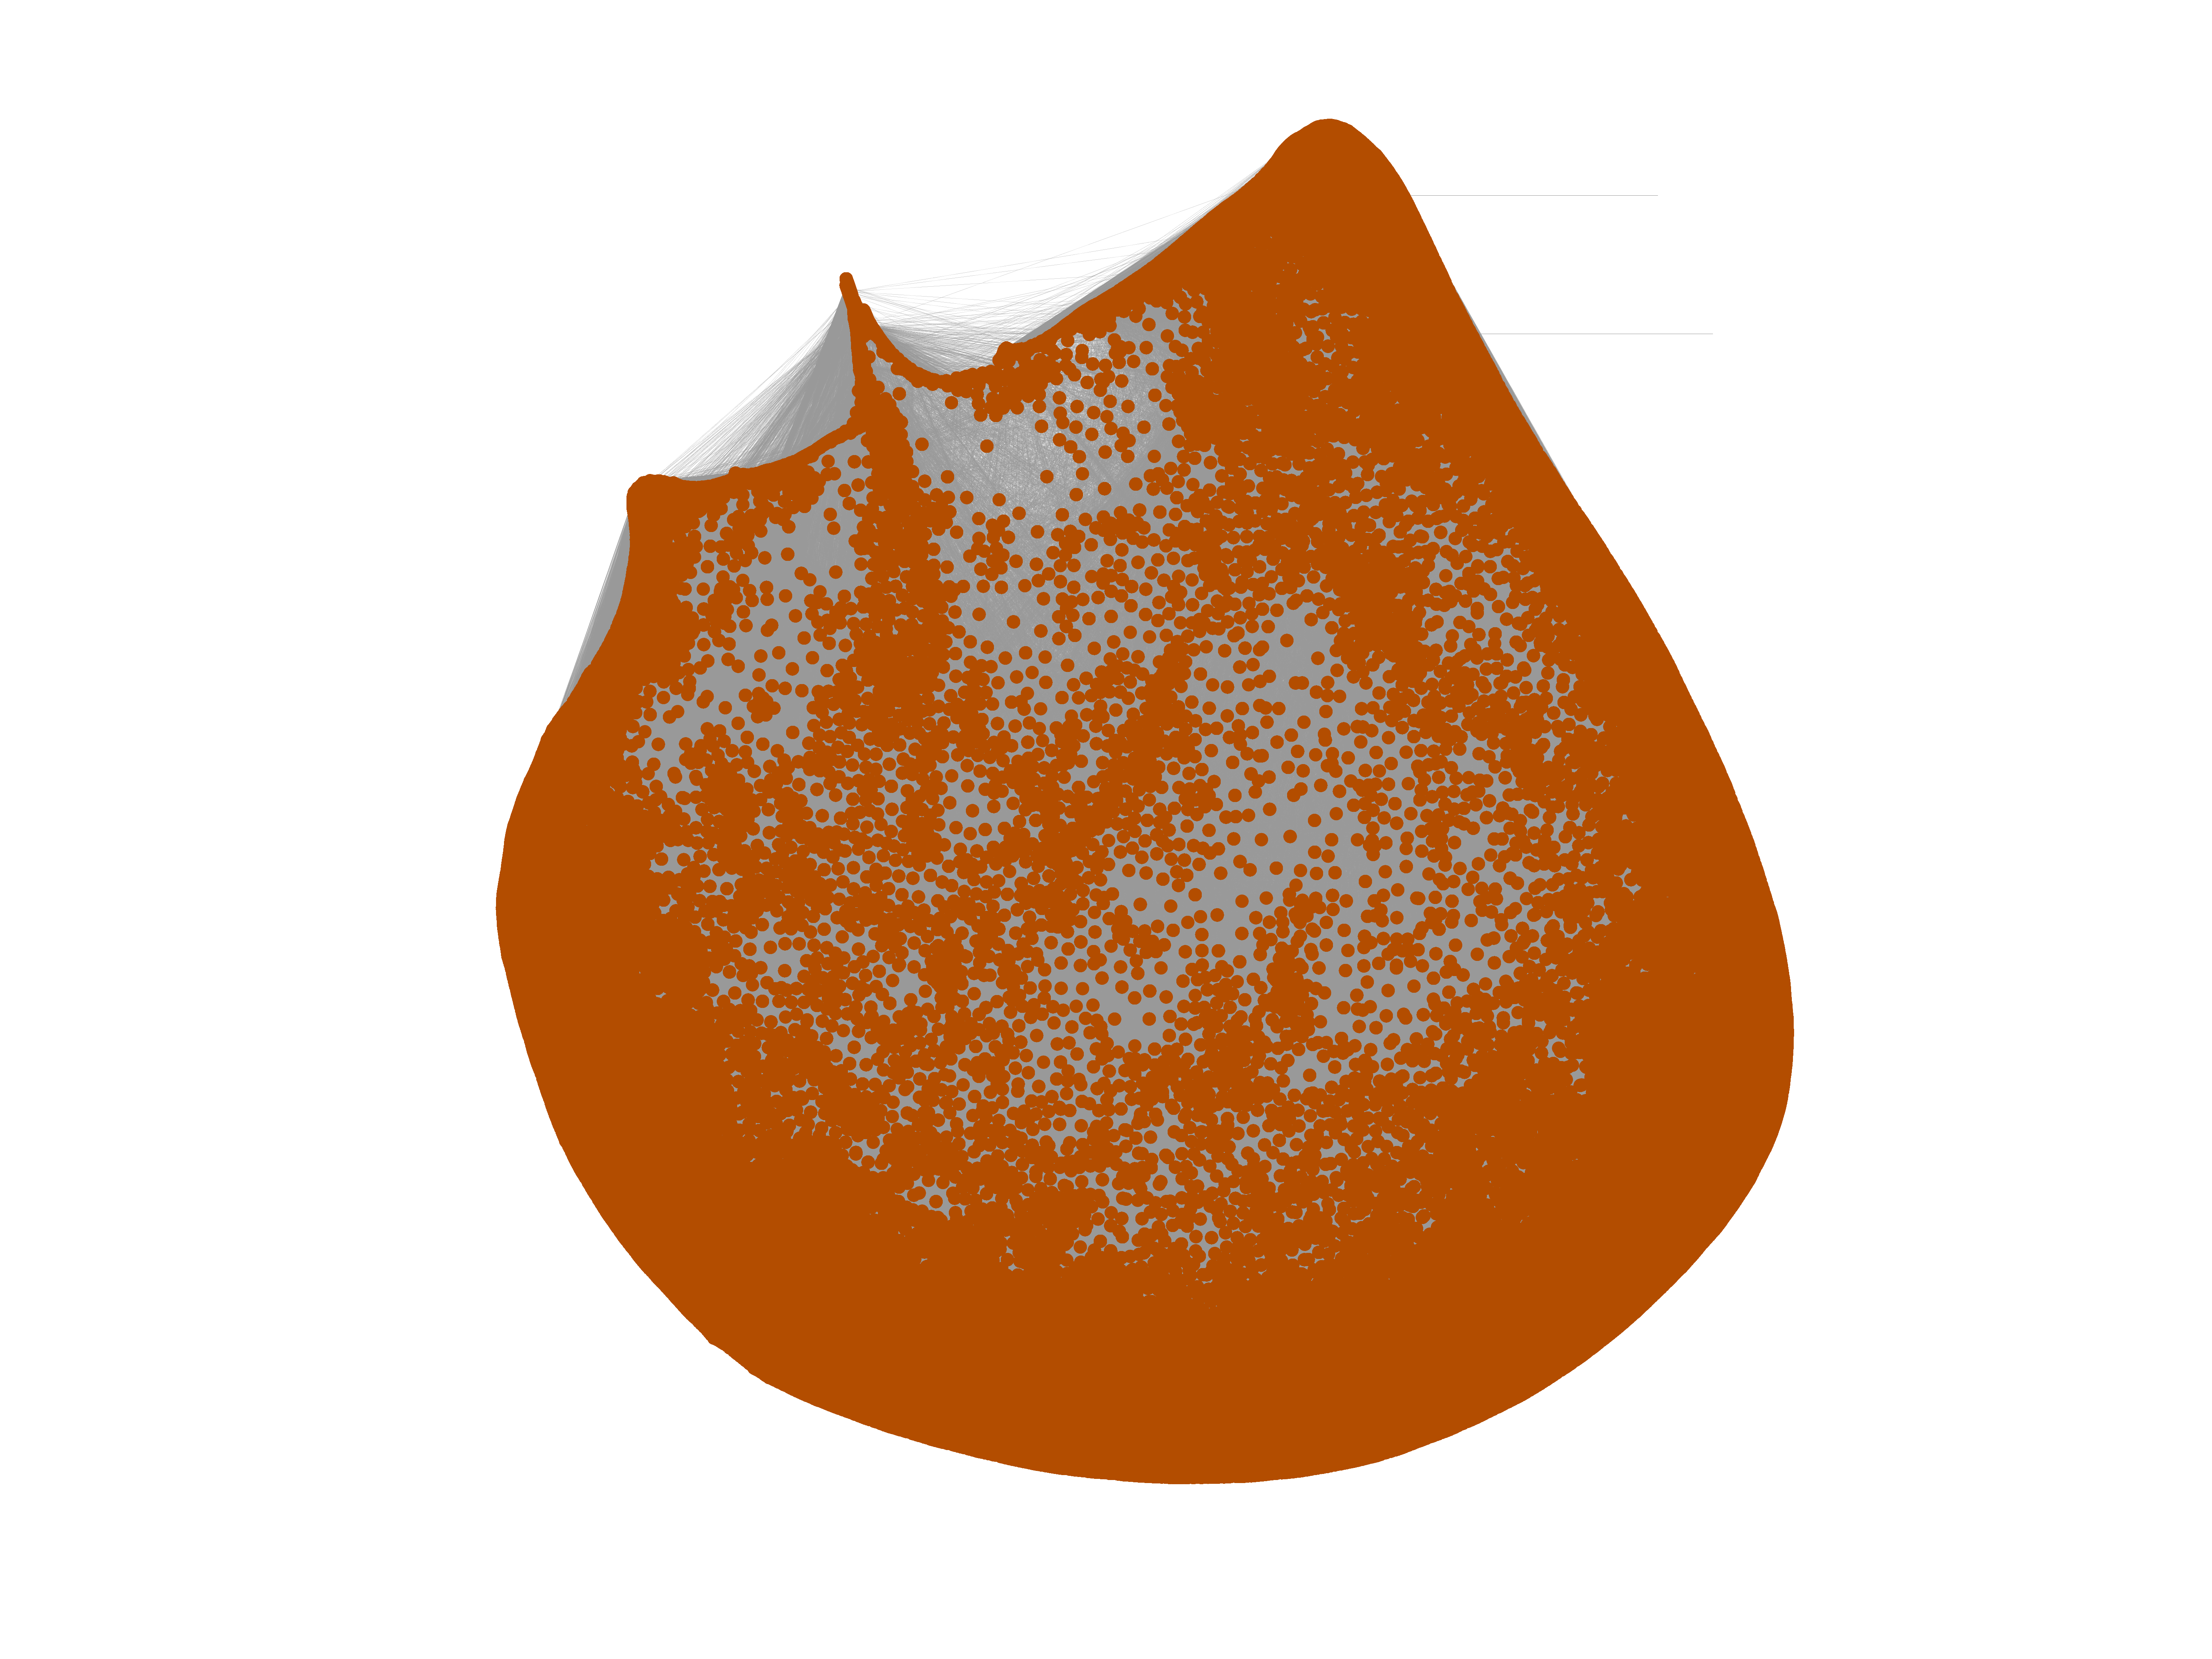
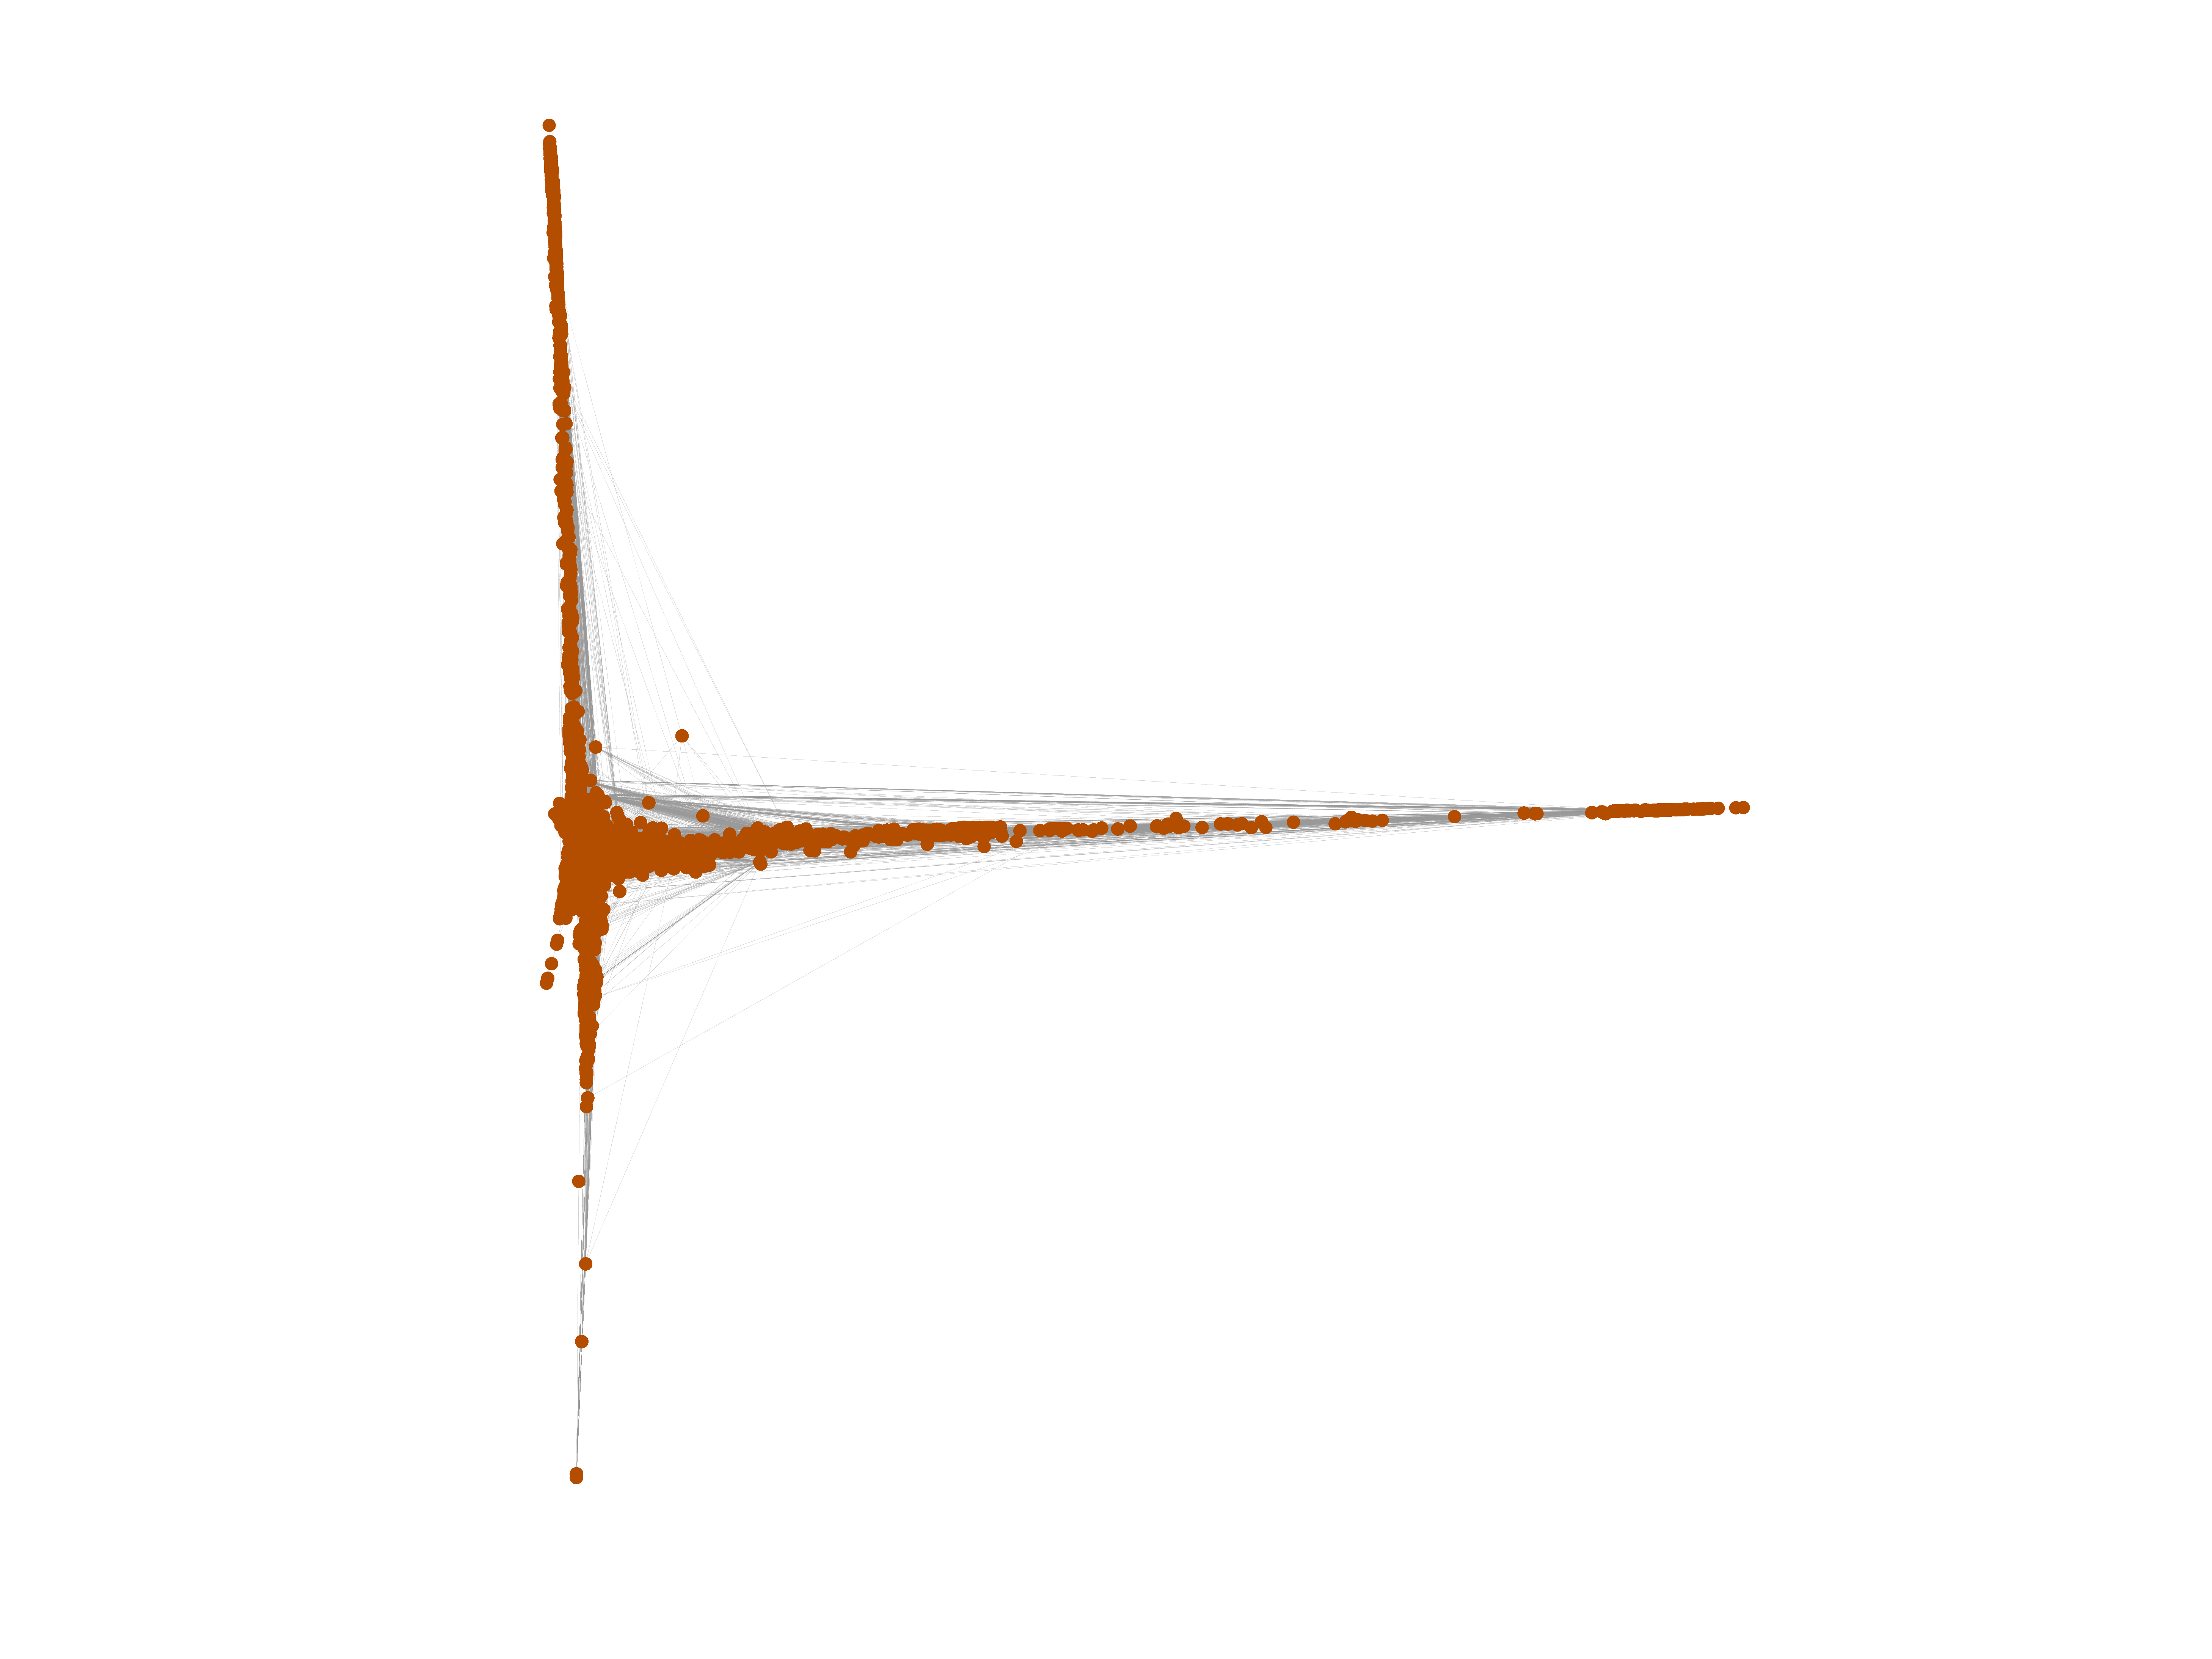
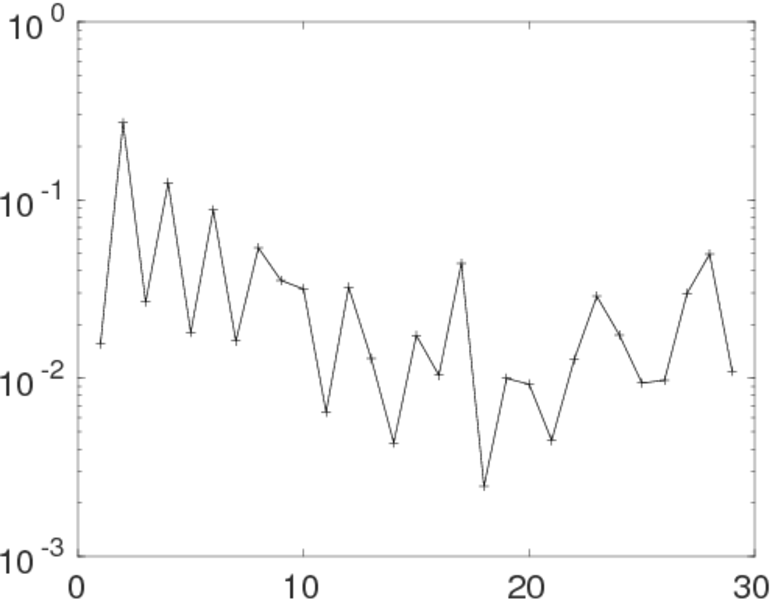
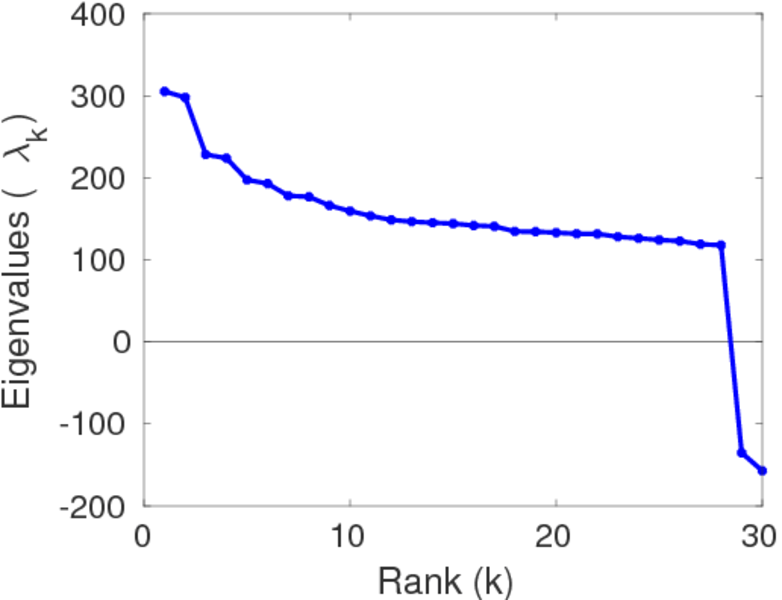
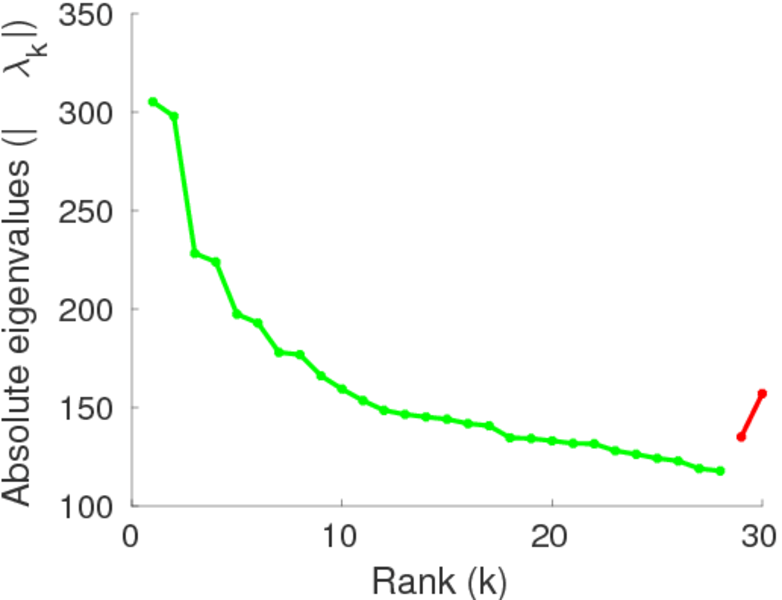
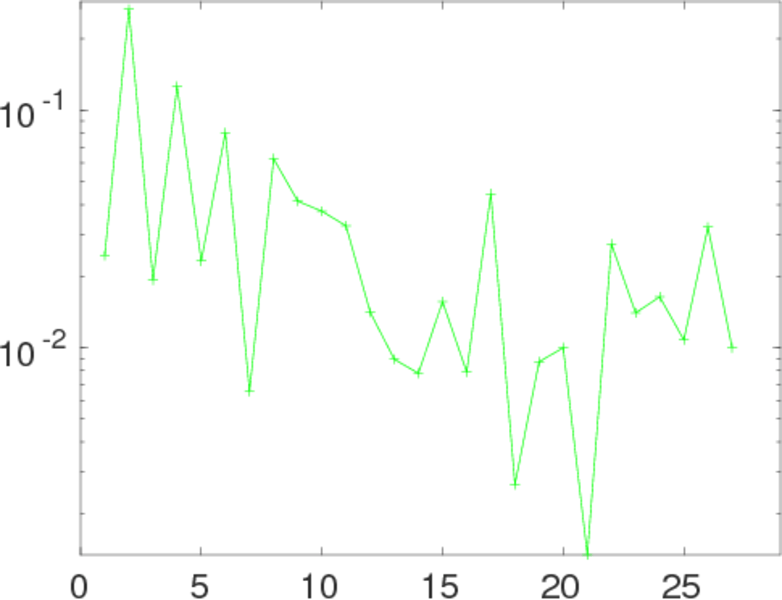
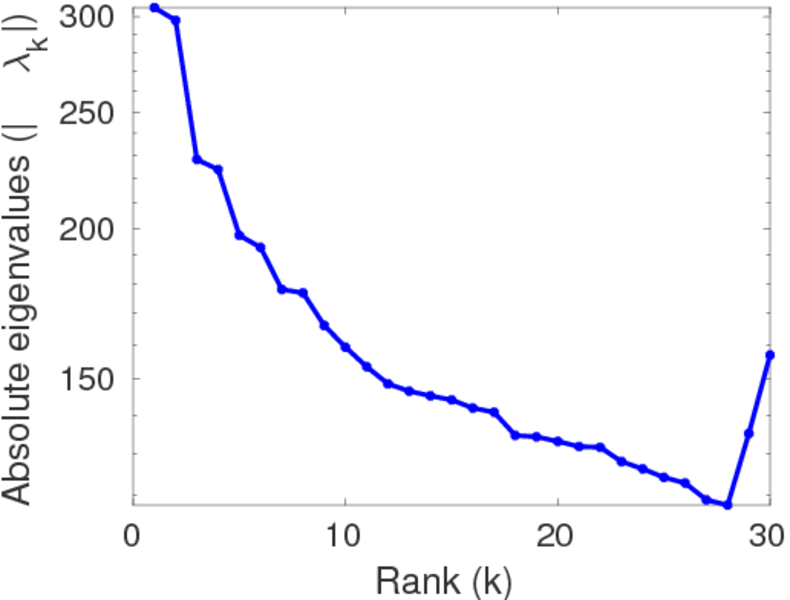
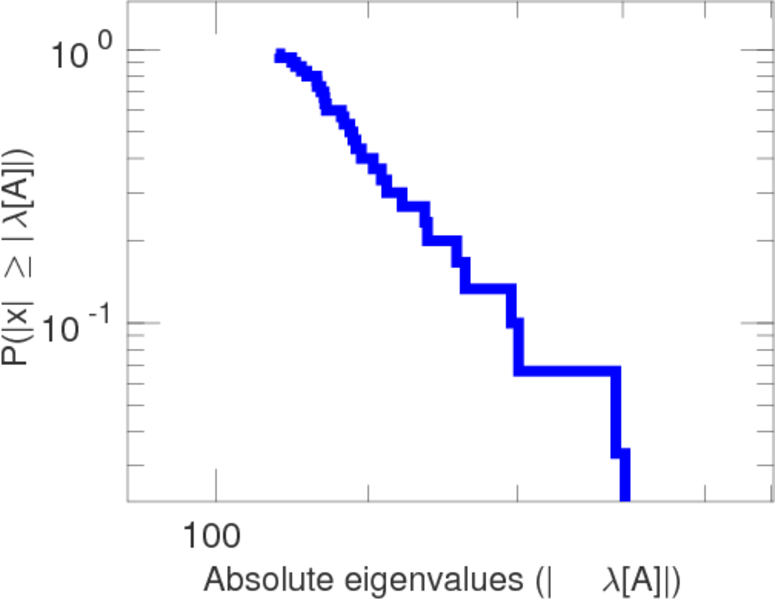
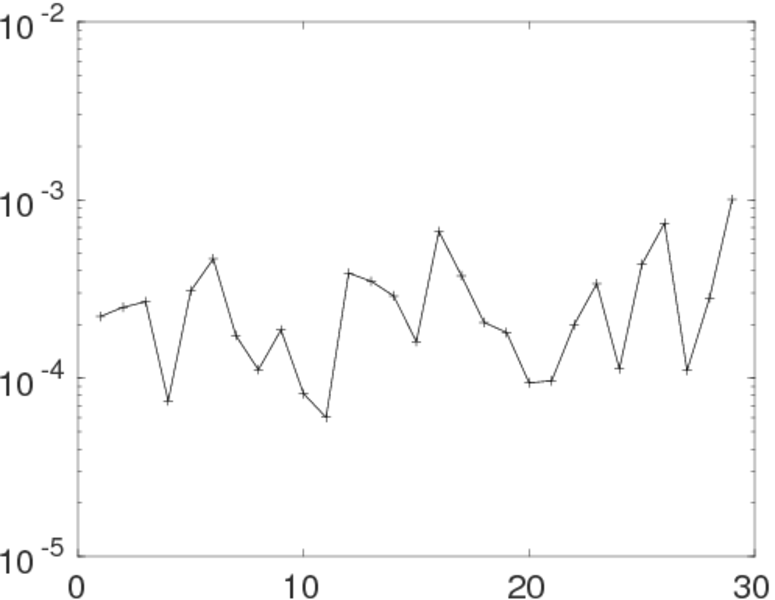
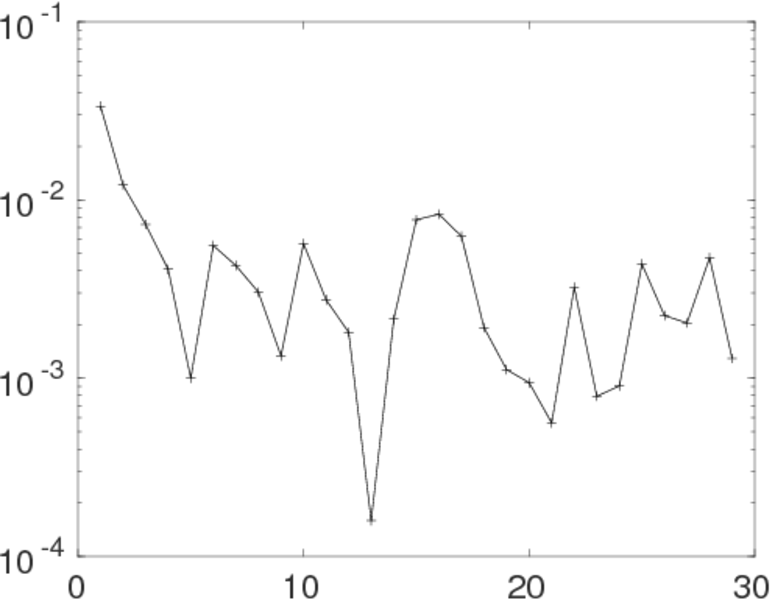
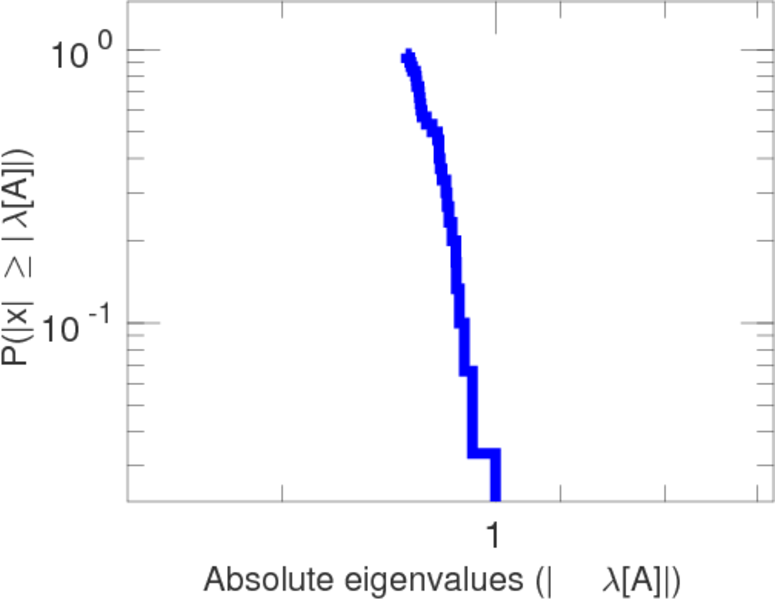
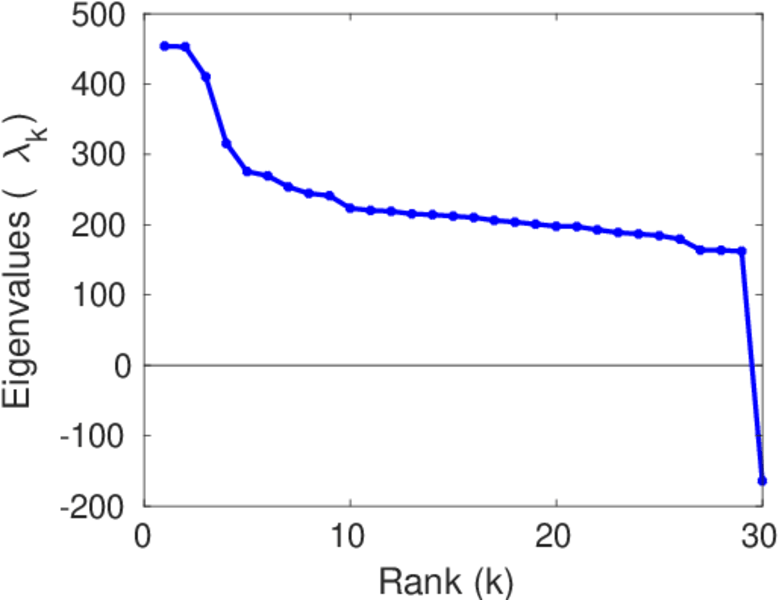
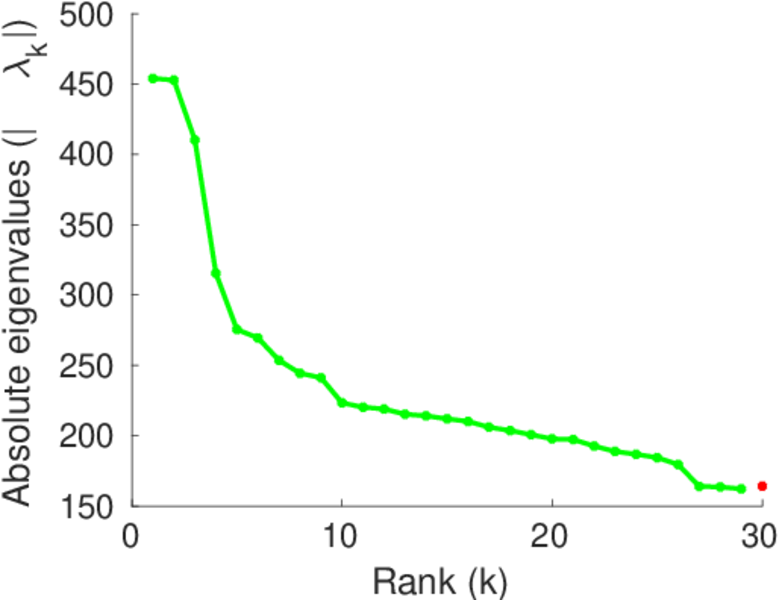
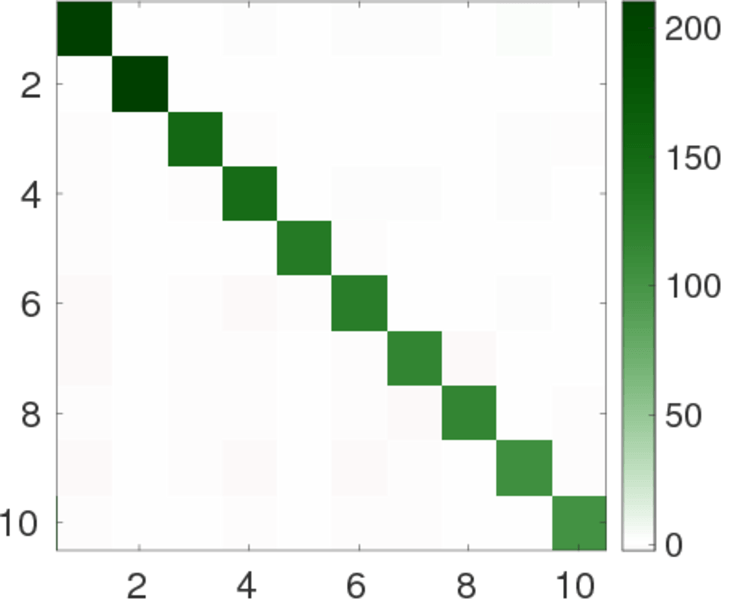
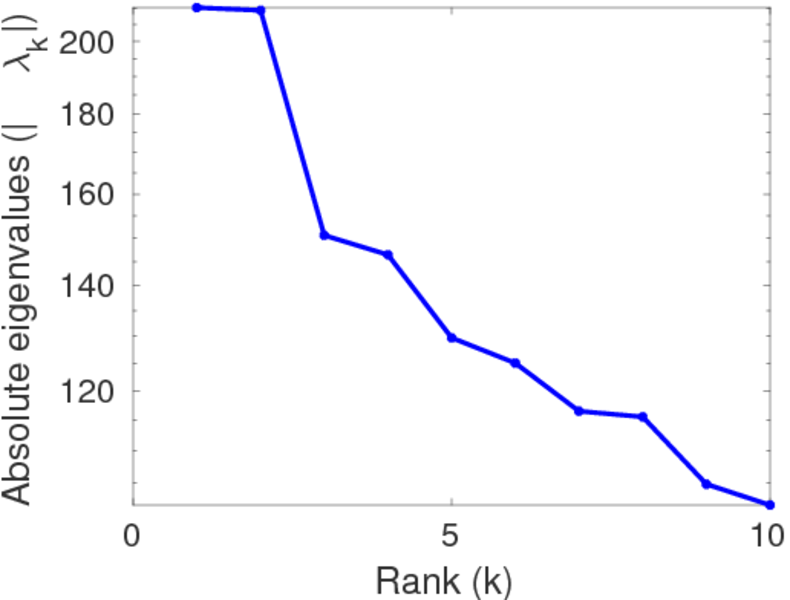
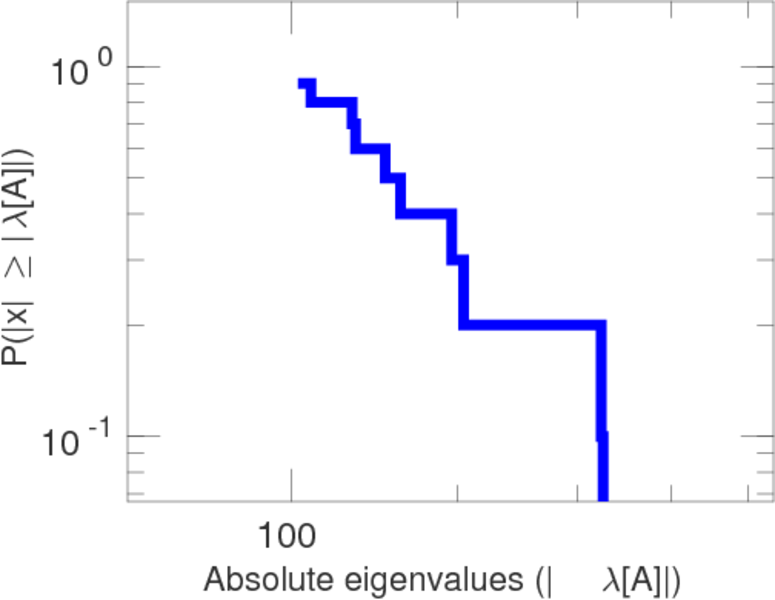
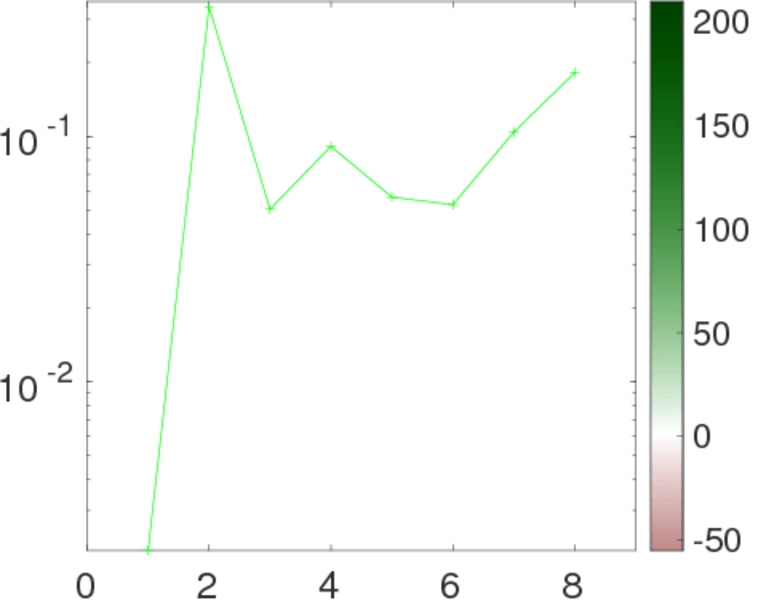
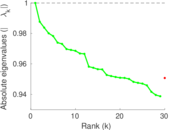
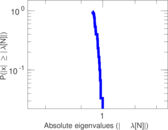
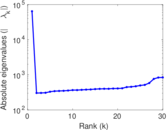
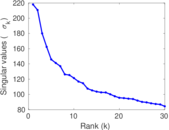
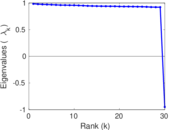
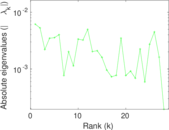
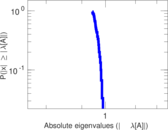
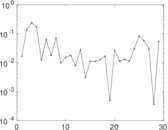
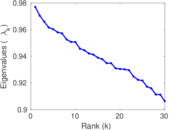
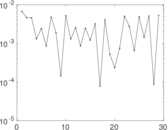
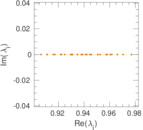
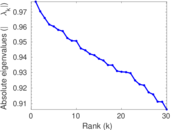
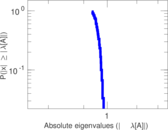
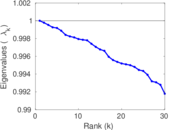
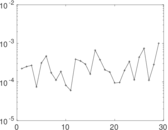
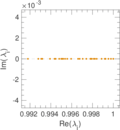
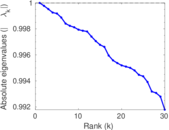
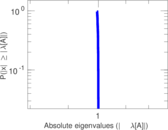
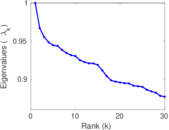
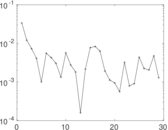
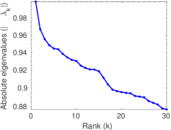
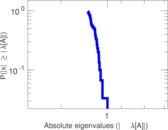
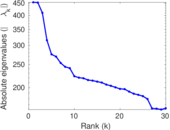
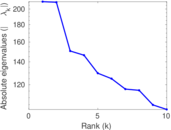
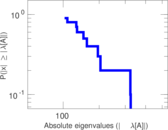
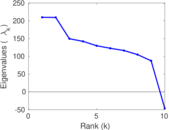
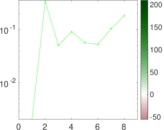
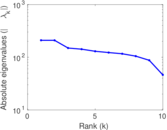
Matrix decompositions plots


Downloads
References
|
[1]
|
Jérôme Kunegis.
KONECT – The Koblenz Network Collection.
In Proc. Int. Conf. on World Wide Web Companion, pages
1343–1350, 2013.
[ http ]
|
 KONECT ‣ Networks ‣
Buy Me a Coffee
KONECT ‣ Networks ‣
Buy Me a Coffee