Wikipedia links (su)
This network consists of the wikilinks of the Wikipedia in the Sundanese
language (su). Nodes are Wikipedia articles, and directed edges are wikilinks,
i.e., hyperlinks within one wiki. In the wiki source, these are indicated with
[[double brackets]]. Only pages in the article namespace are included.
Metadata
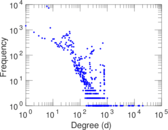
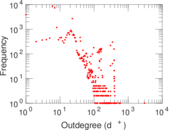
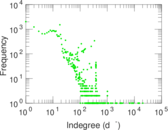
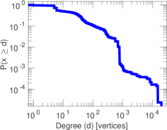
Statistics
| Size | n = | 43,169
|
| Volume | m = | 1,250,082
|
| Wedge count | s = | 1,426,743,671
|
| Claw count | z = | 6,116,979,619,994
|
| Cross count | x = | 23,005,068,147,507,452
|
| Triangle count | t = | 32,279,583
|
| Square count | q = | 10,074,125,230
|
| 4-Tour count | T4 = | 86,301,684,196
|
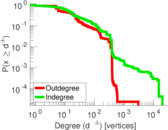
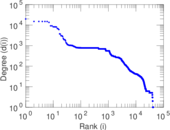
| Maximum degree | dmax = | 20,358
|
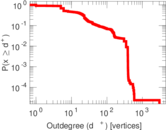
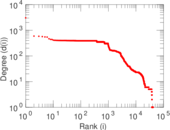
| Maximum outdegree | d+max = | 3,030
|
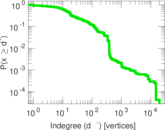
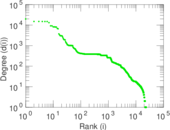
| Maximum indegree | d−max = | 20,358
|
| Average degree | d = | 57.915 7
|
| Fill | p = | 0.000 670 802
|
| Size of LCC | N = | 43,134
|
| Size of LSCC | Ns = | 20,871
|
| Relative size of LSCC | Nrs = | 0.483 472
|
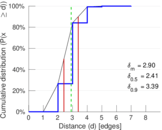
| Diameter | δ = | 10
|
| 50-Percentile effective diameter | δ0.5 = | 2.406 88
|
| 90-Percentile effective diameter | δ0.9 = | 3.387 17
|
| Median distance | δM = | 3
|
| Mean distance | δm = | 2.899 46
|
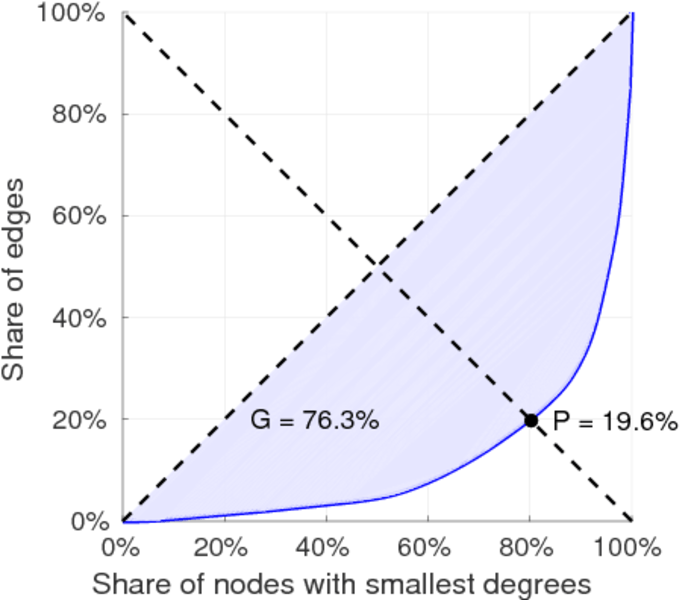
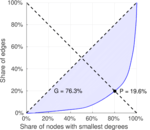
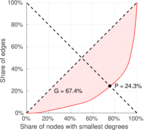
| Gini coefficient | G = | 0.756 340
|
| Balanced inequality ratio | P = | 0.200 564
|
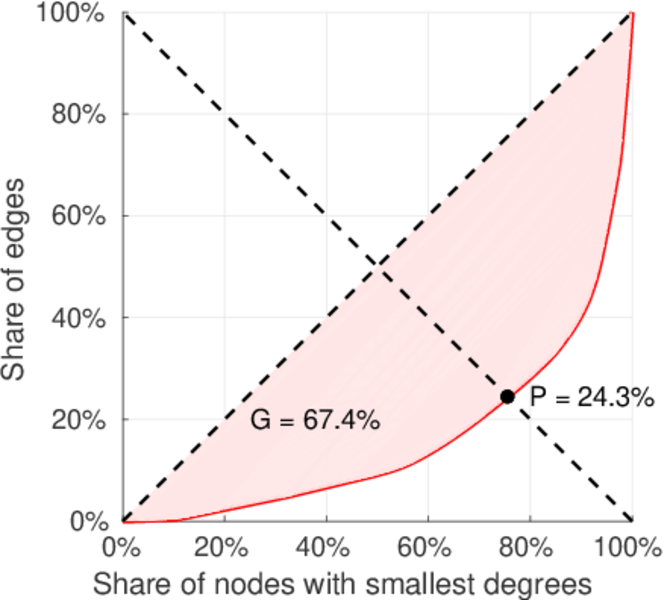
| Outdegree balanced inequality ratio | P+ = | 0.243 202
|
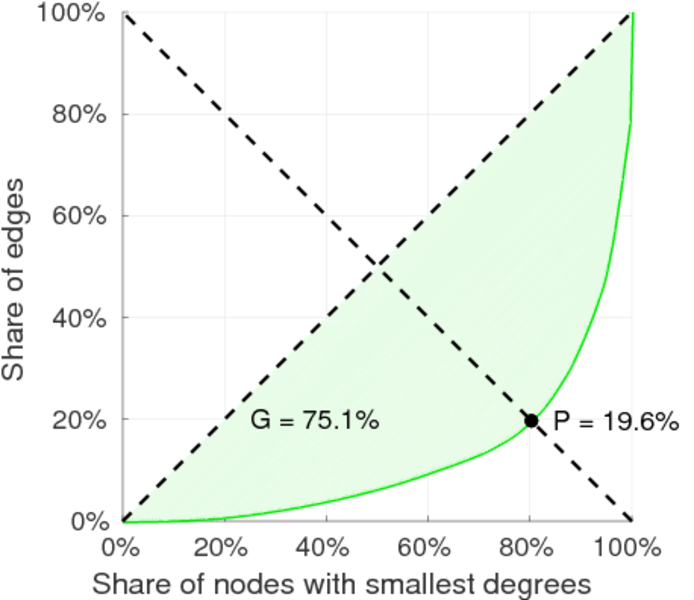
| Indegree balanced inequality ratio | P− = | 0.192 819
|
| Relative edge distribution entropy | Her = | 0.864 975
|
| Tail power law exponent | γt = | 2.051 00
|
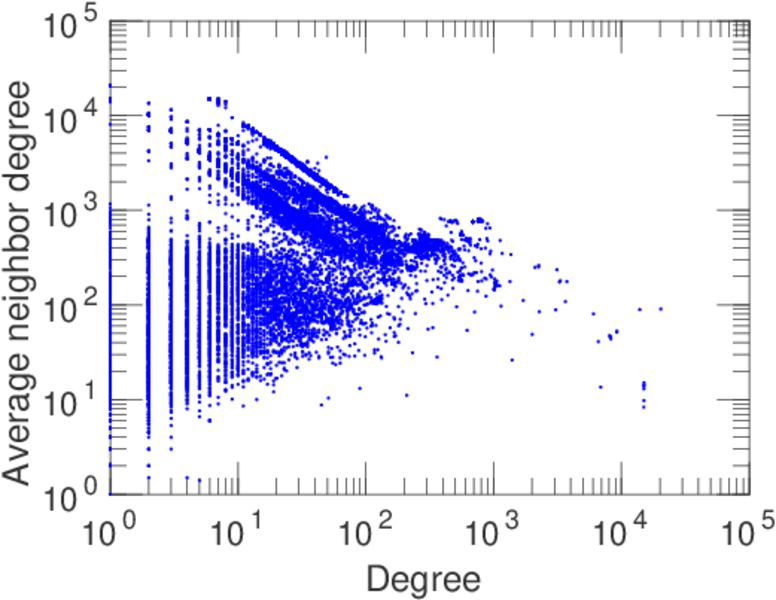
| Degree assortativity | ρ = | −0.146 275
|
| Degree assortativity p-value | pρ = | 0.000 00
|
| Clustering coefficient | c = | 0.067 874 0
|
| Directed clustering coefficient | c± = | 0.797 369
|
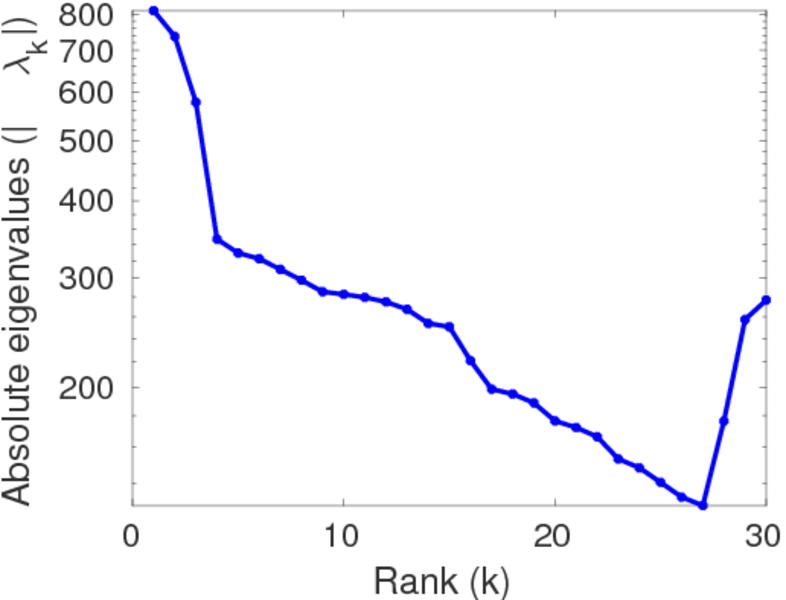
| Spectral norm | α = | 750.371
|
| Operator 2-norm | ν = | 380.563
|
| Cyclic eigenvalue | π = | 369.772
|
| Algebraic connectivity | a = | 0.037 205 3
|
| Spectral separation | |λ1[A] / λ2[A]| = | 1.101 33
|
| Reciprocity | y = | 0.633 900
|
| Non-bipartivity | bA = | 0.596 796
|
| Spectral bipartite frustration | bK = | 0.000 175 393
|
| Controllability | C = | 20,086
|
| Relative controllability | Cr = | 0.465 288
|
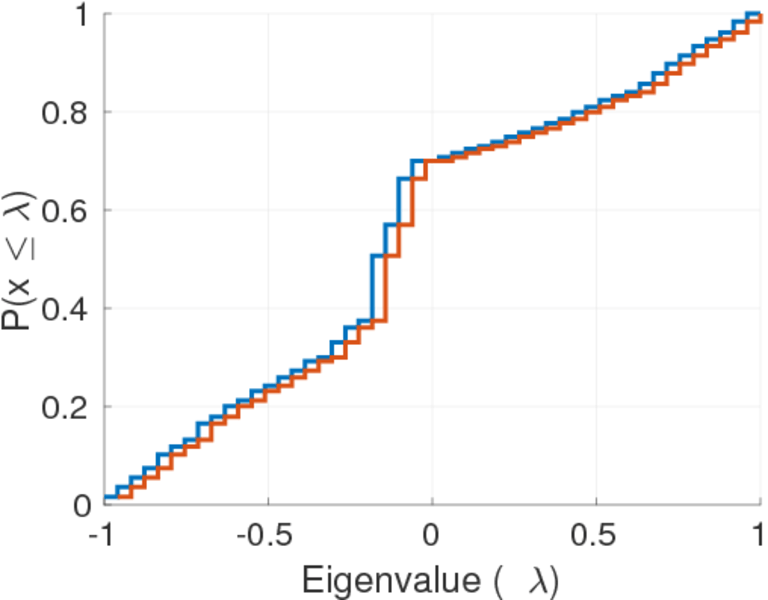
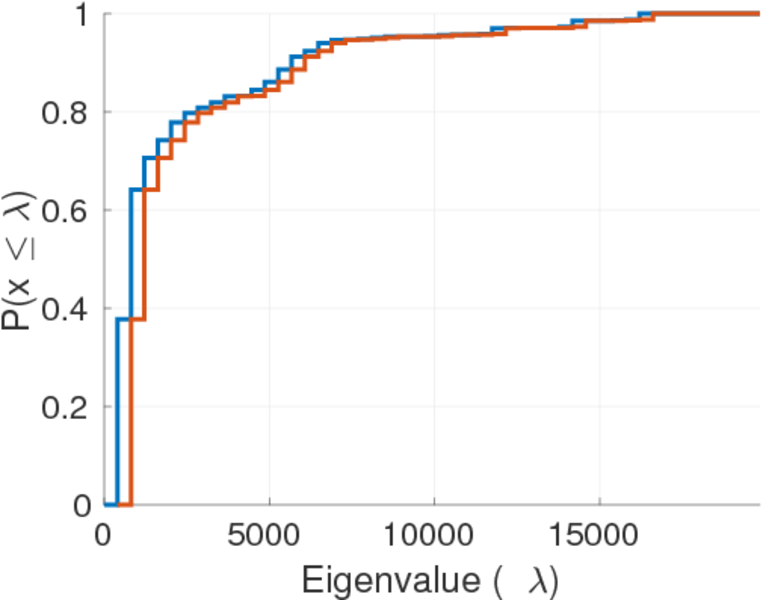
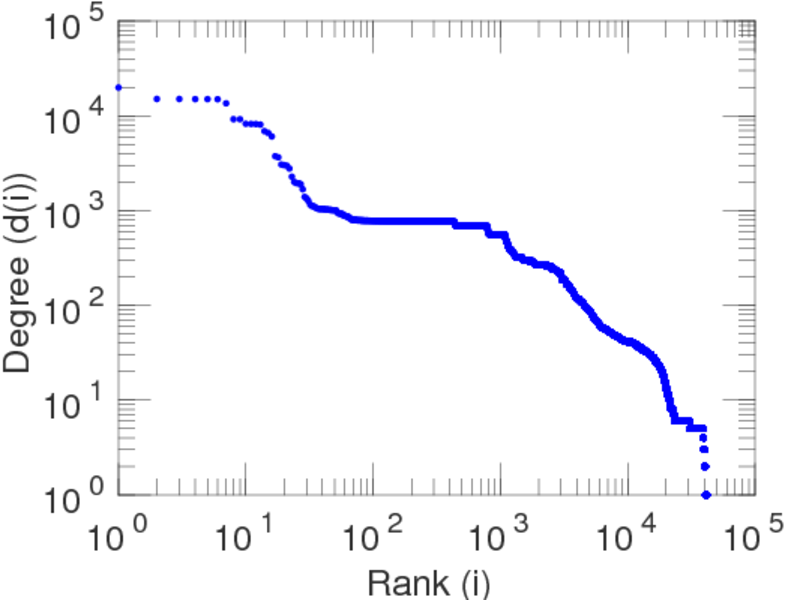
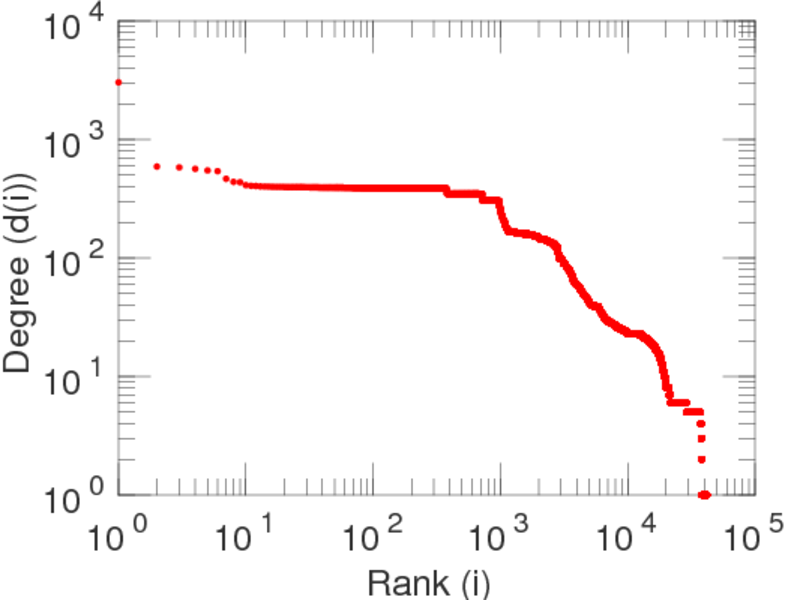
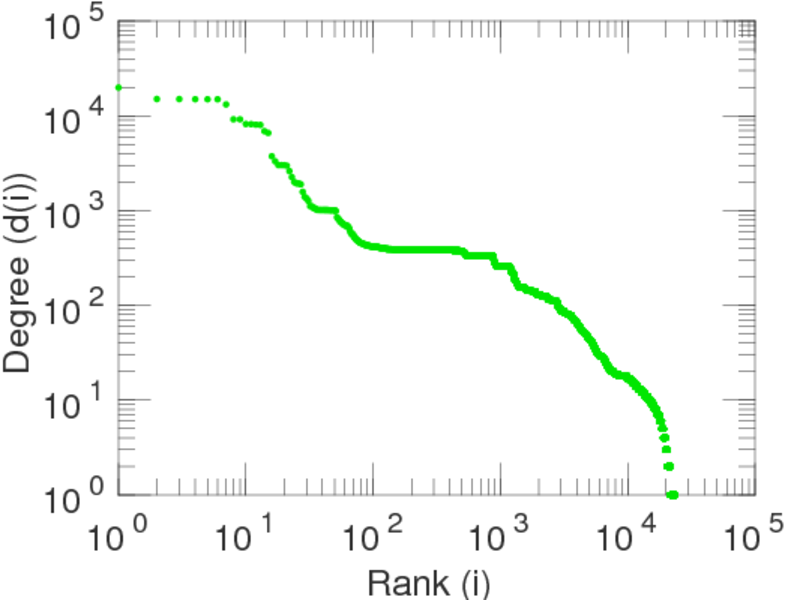
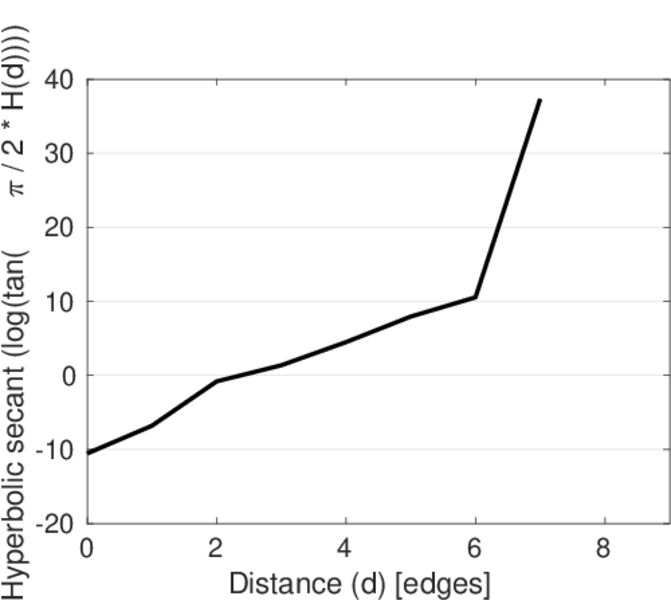
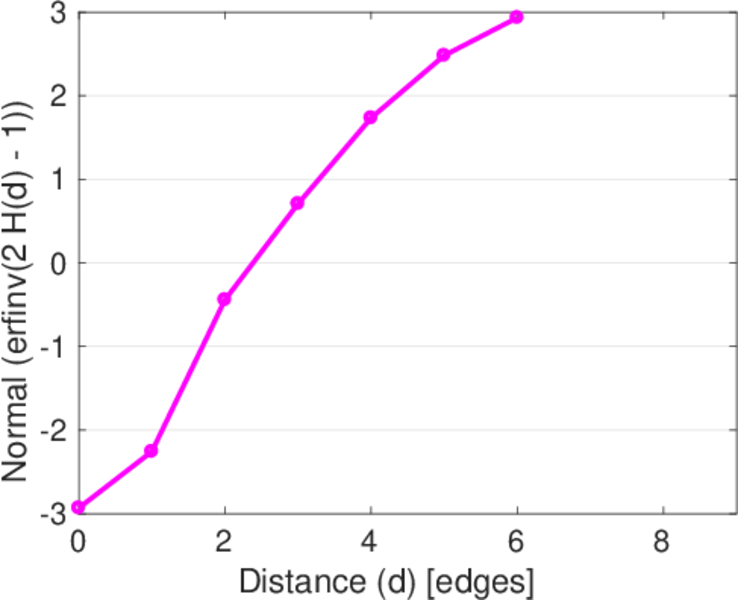
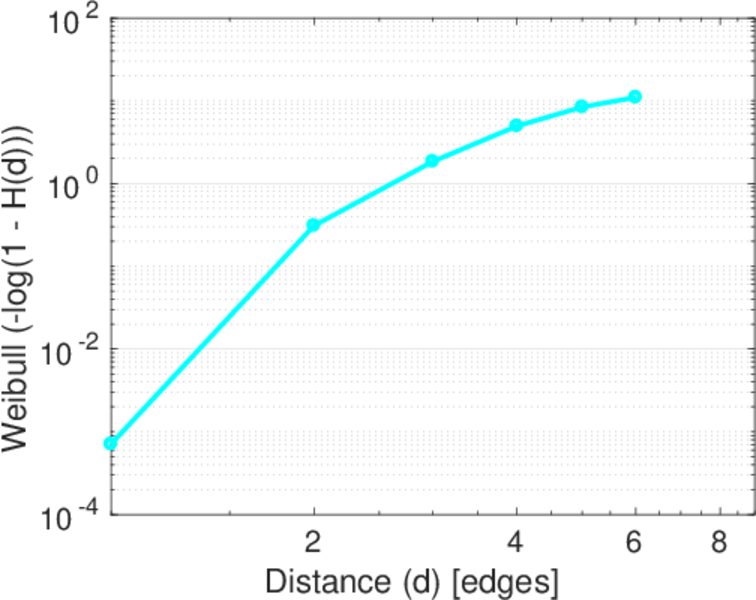
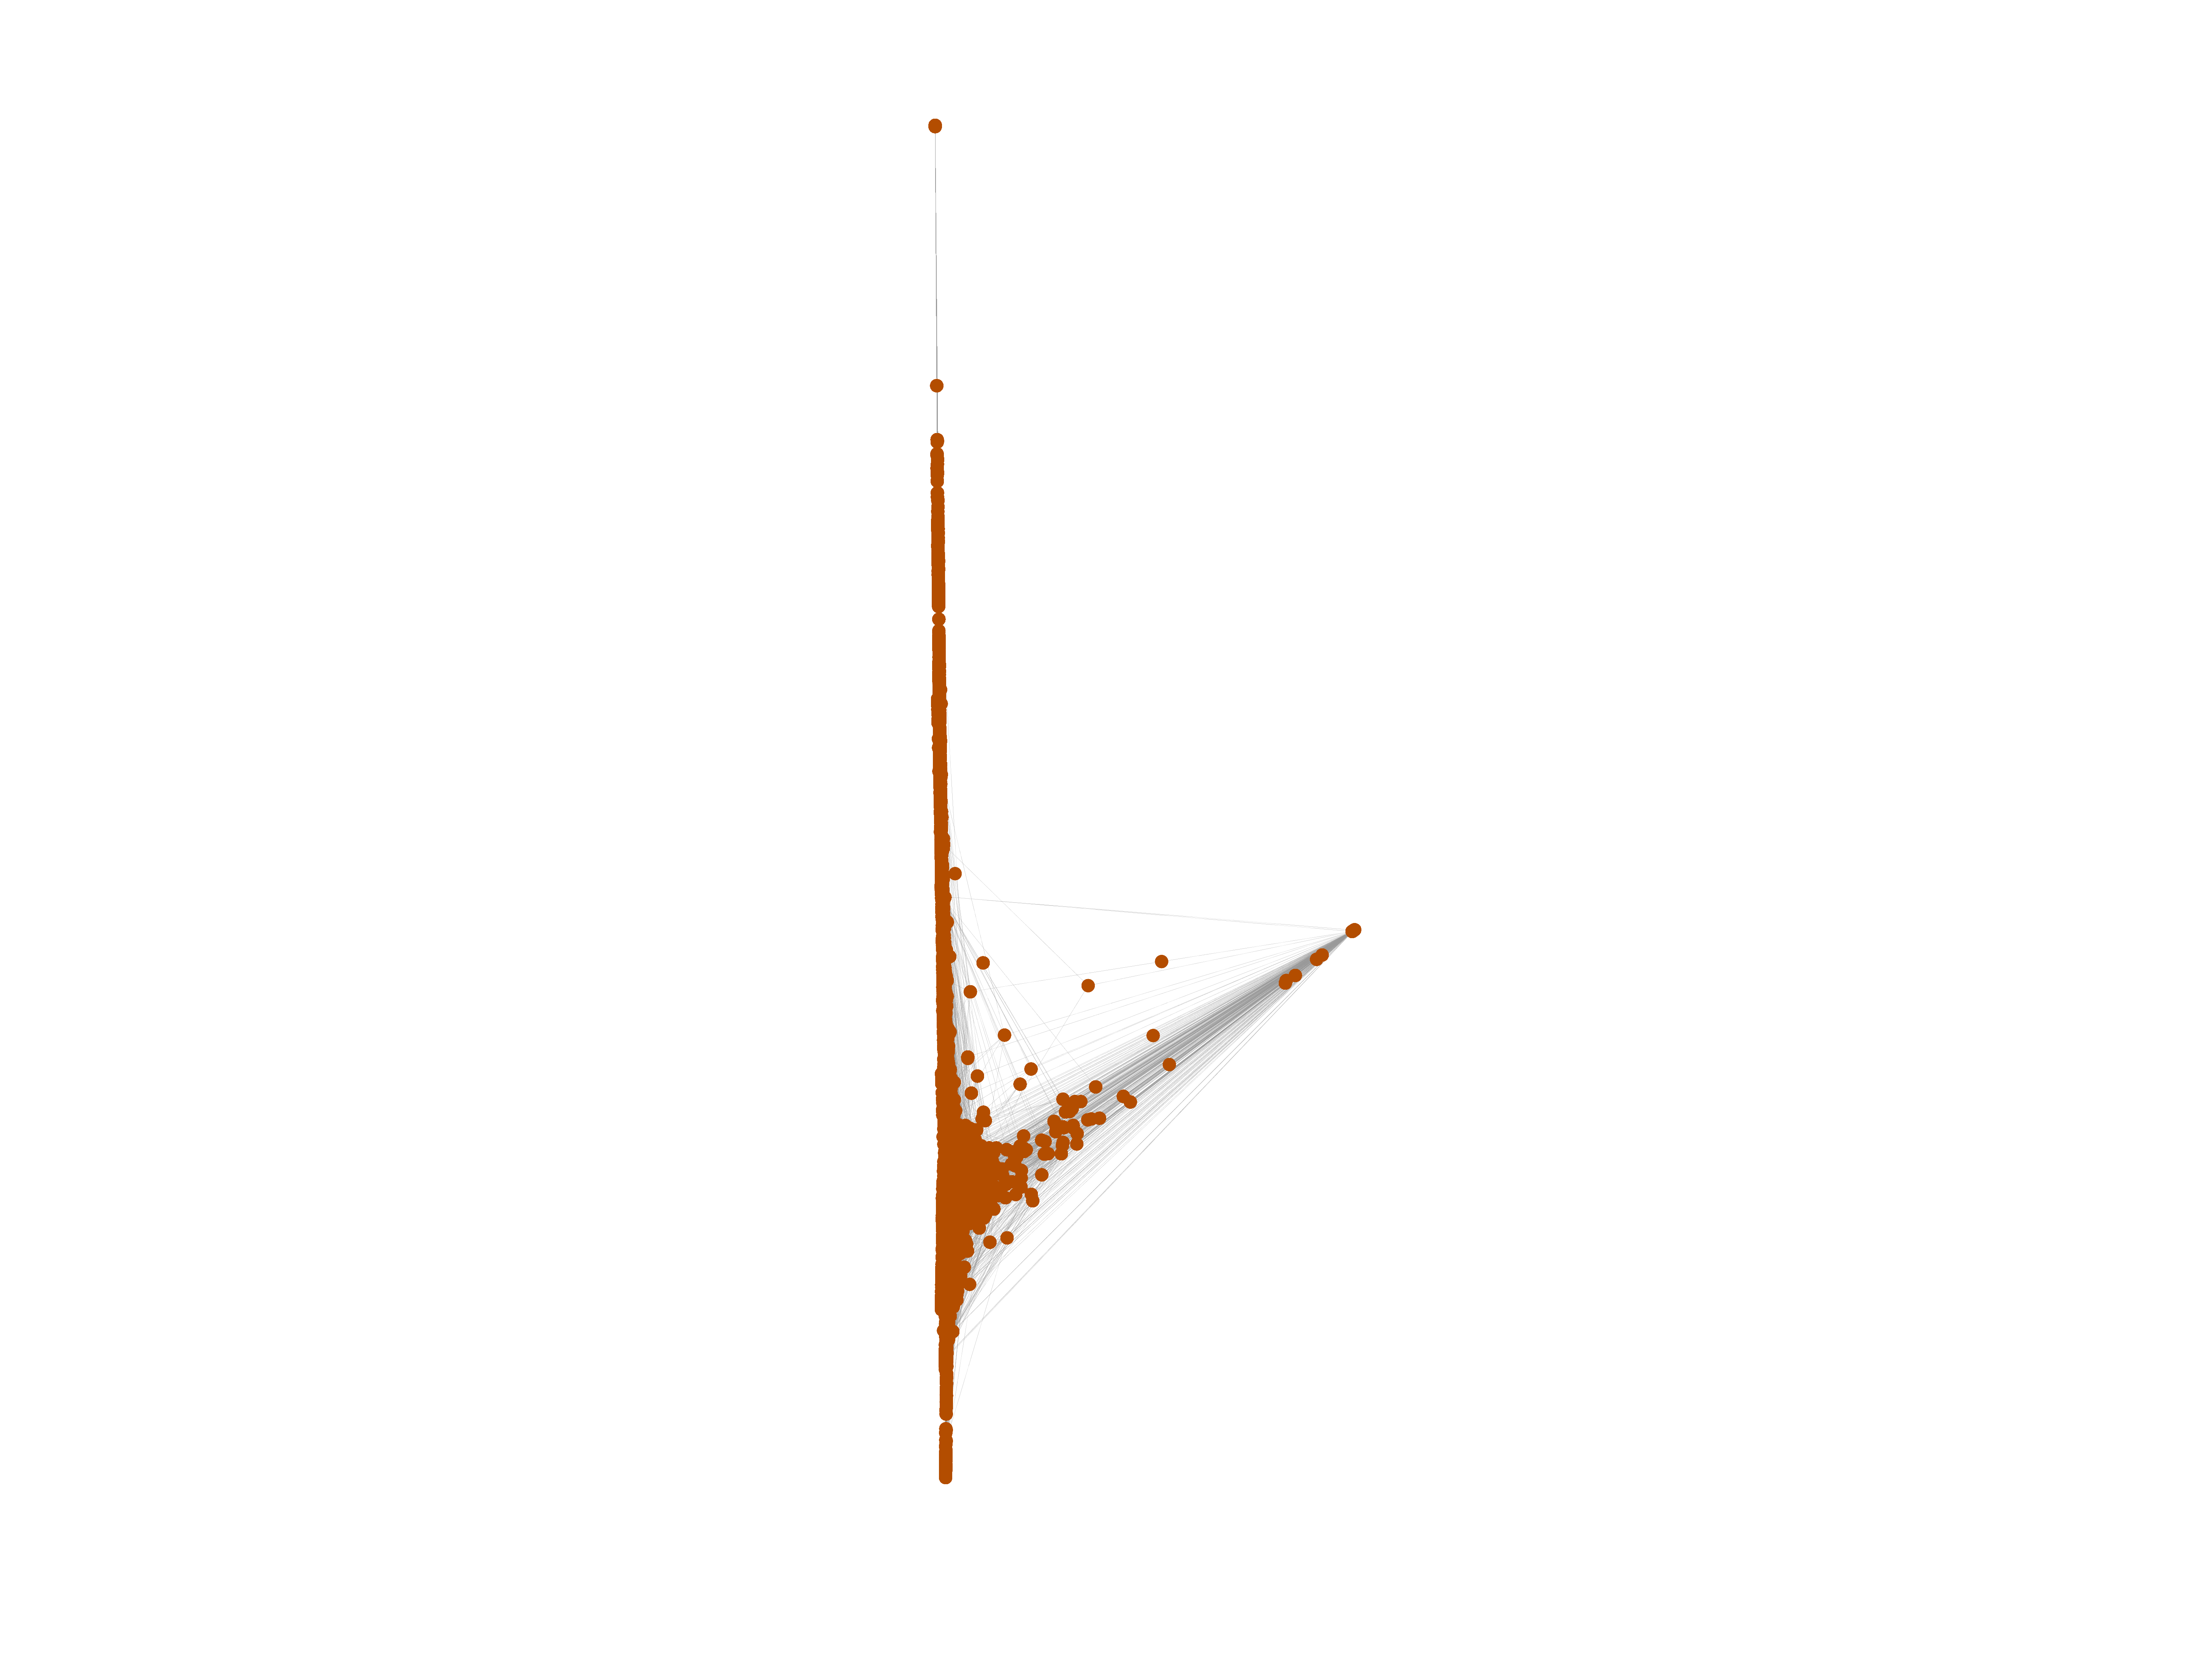
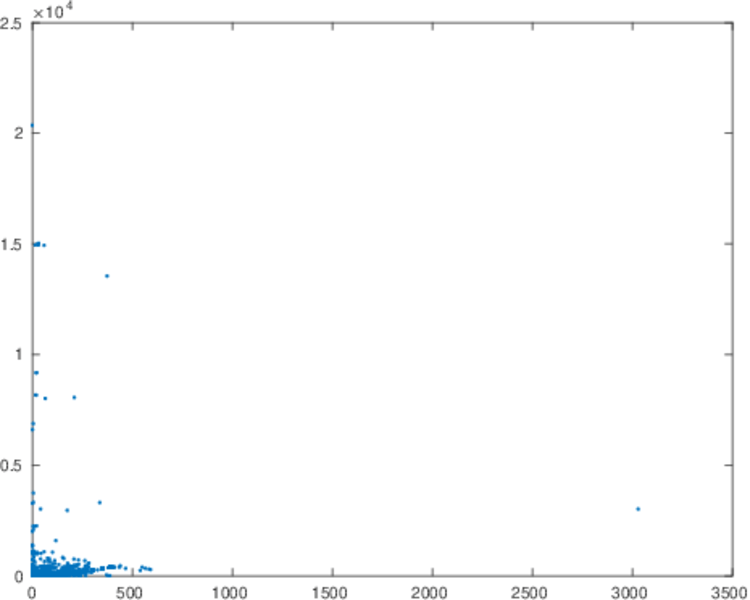
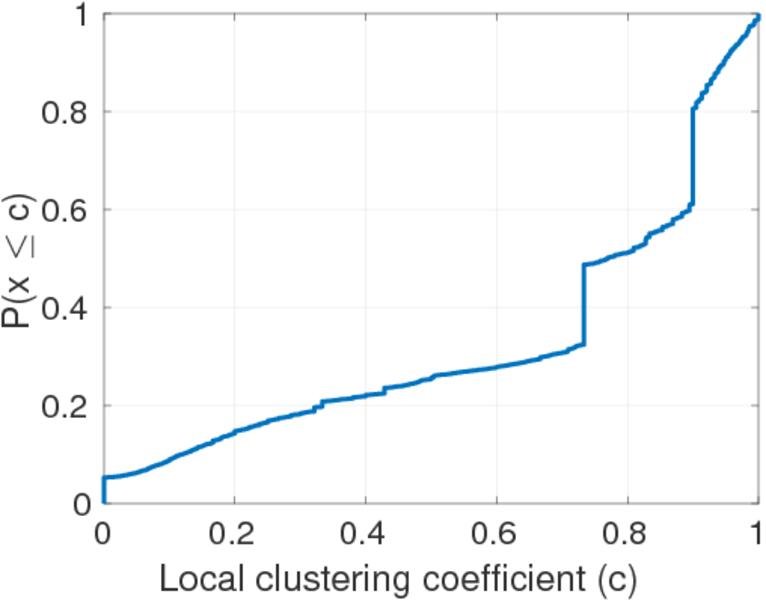
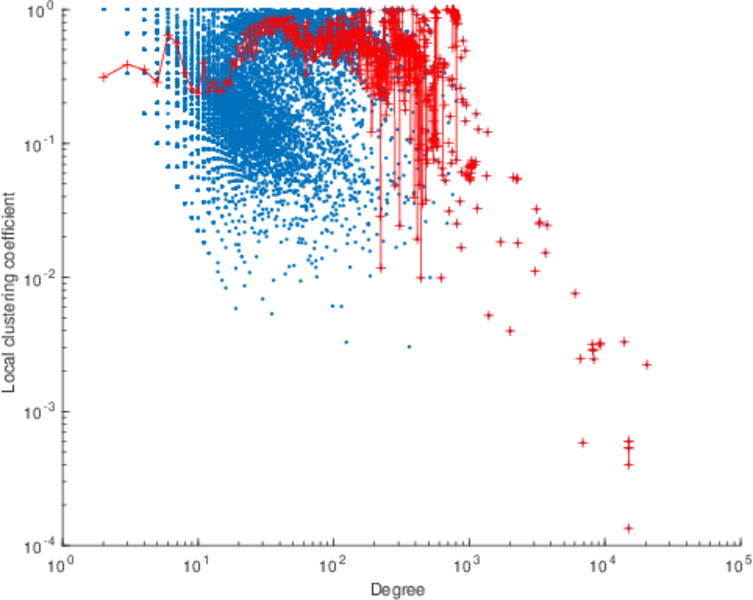
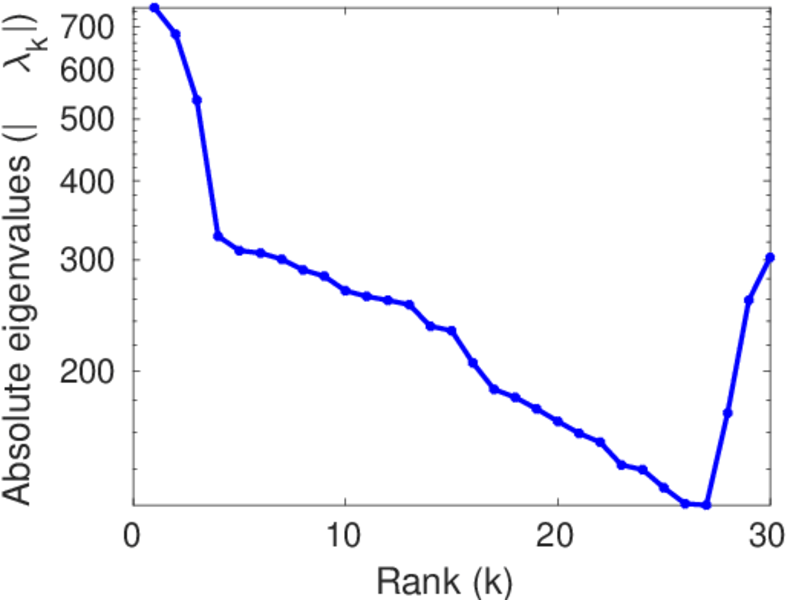
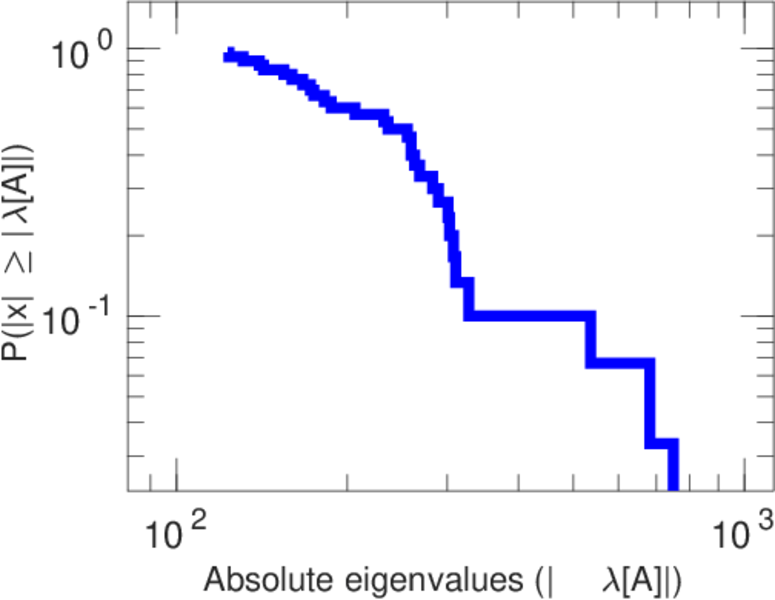
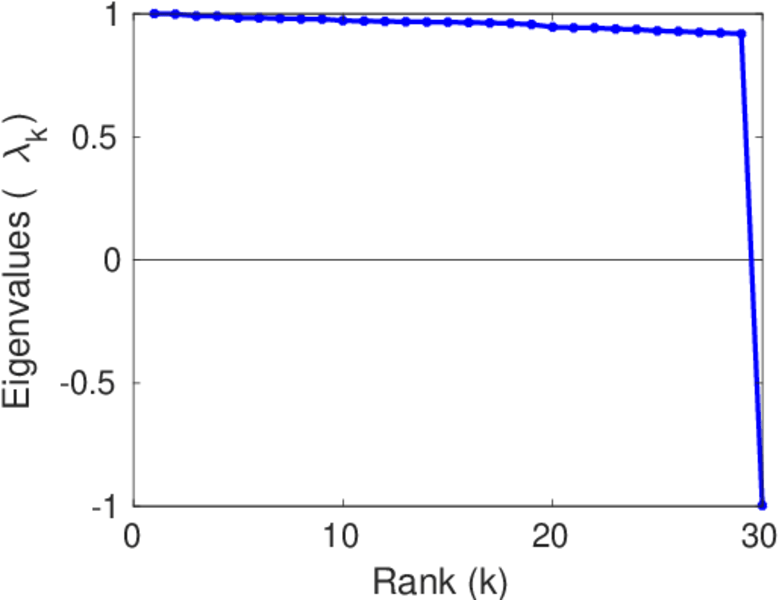
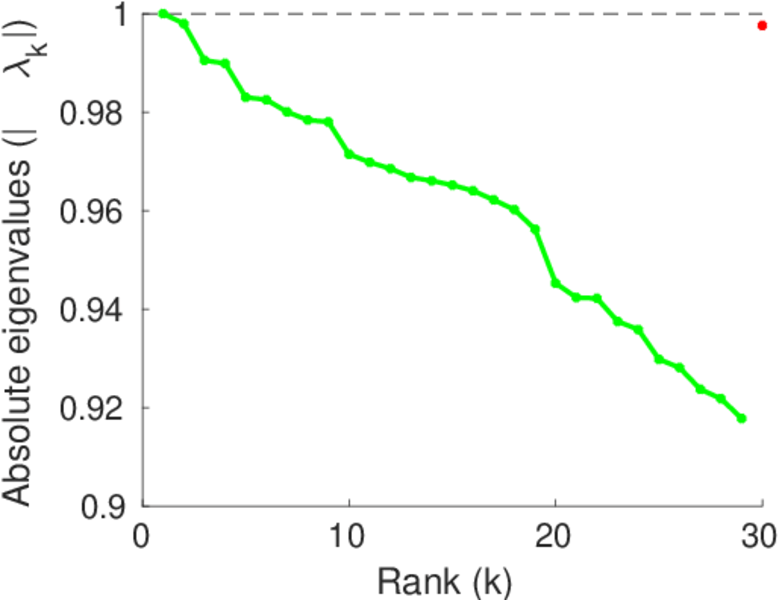
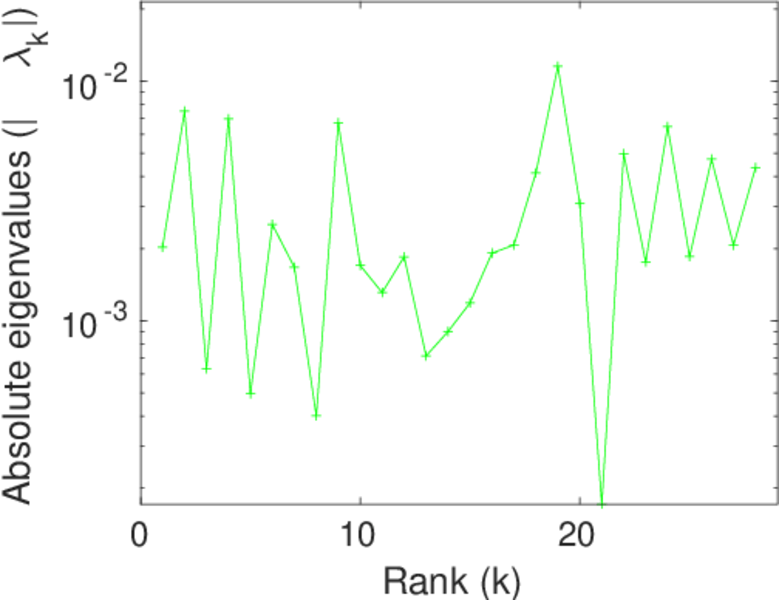
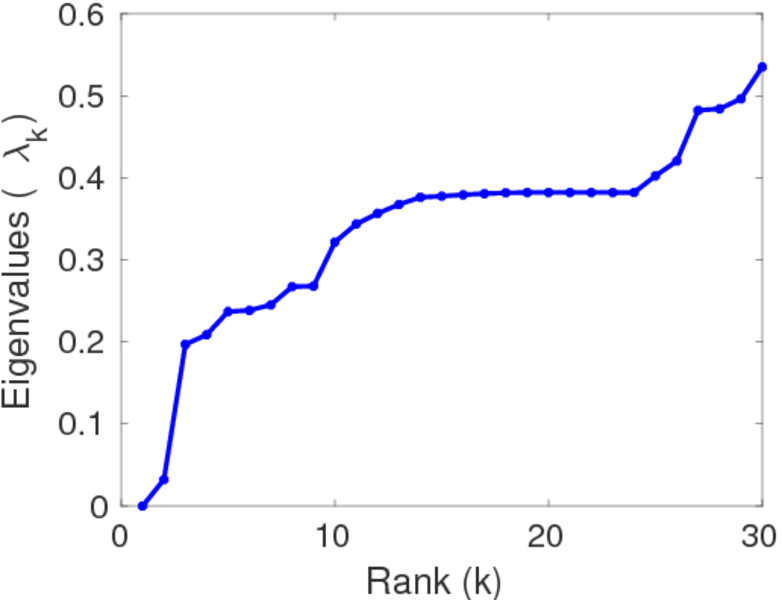
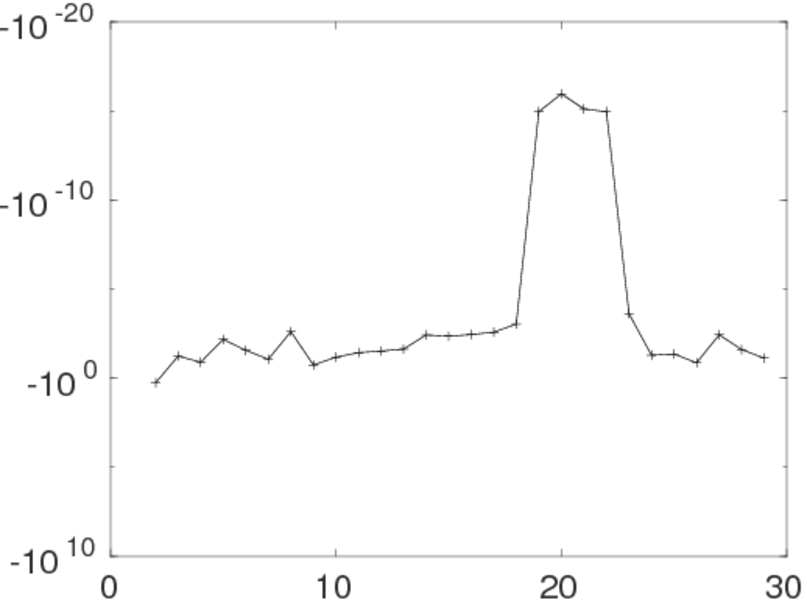
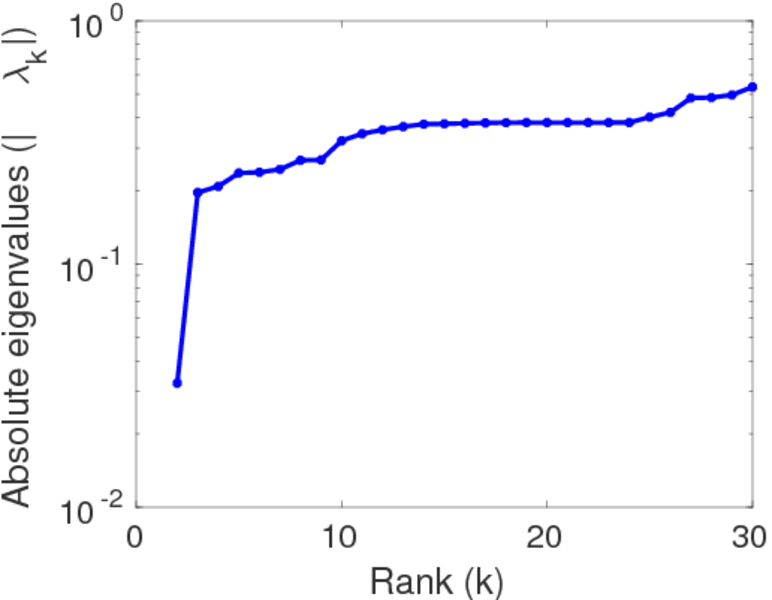
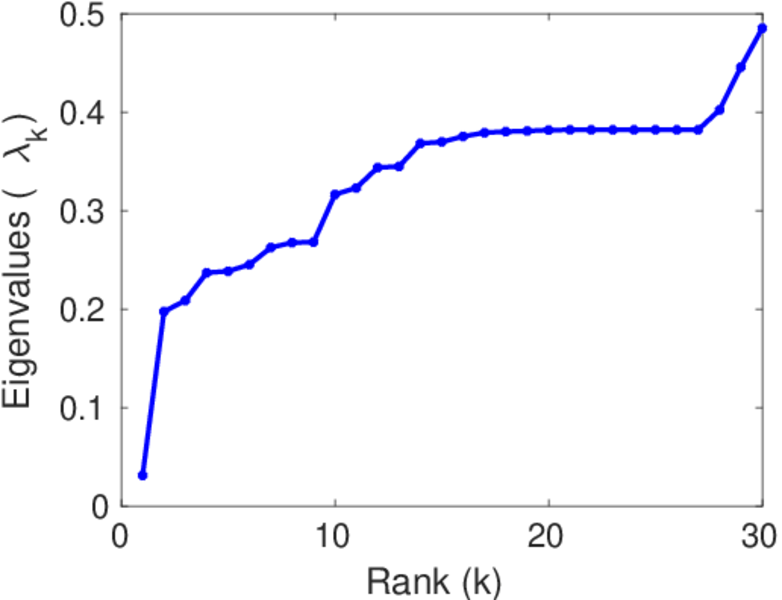
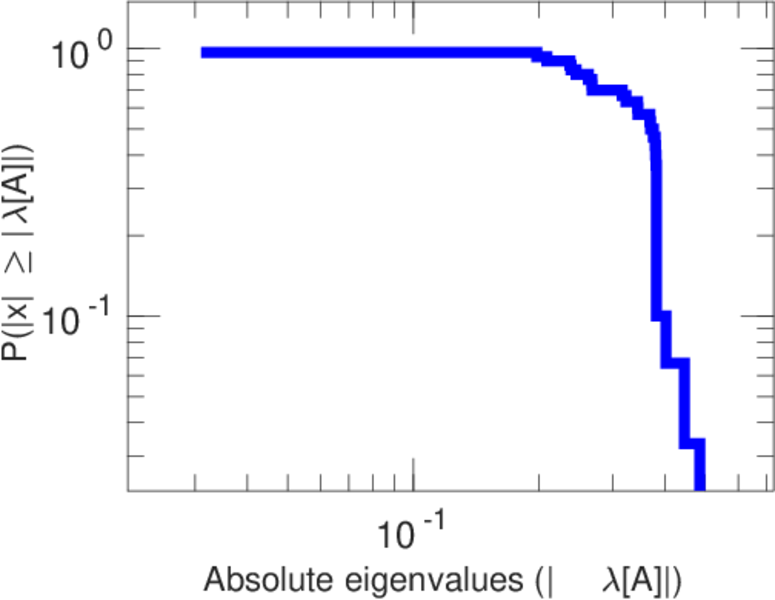
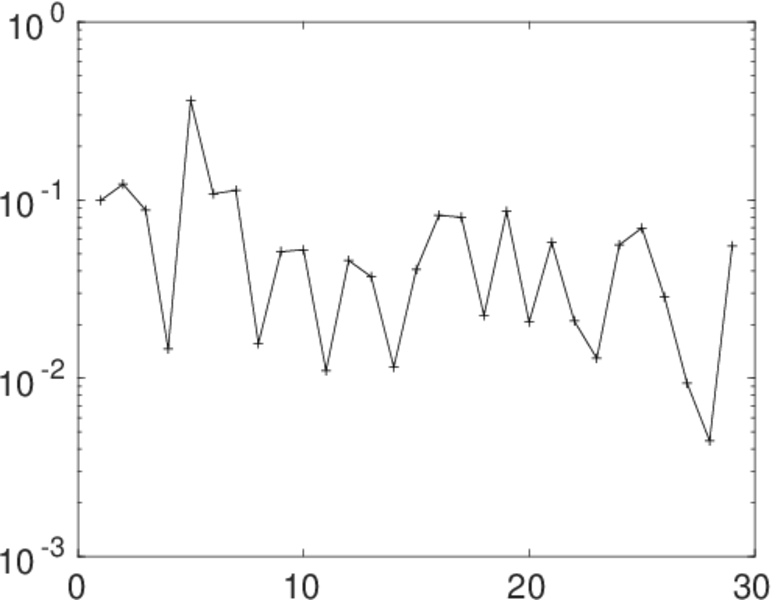
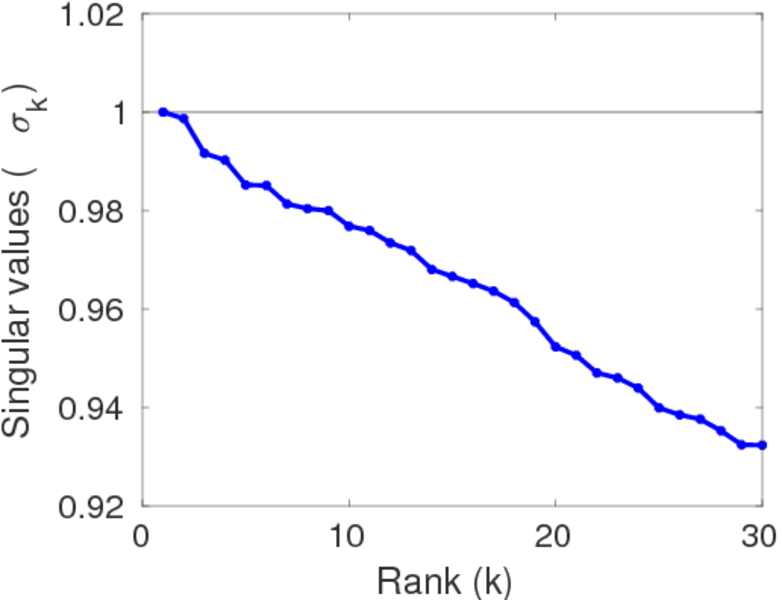
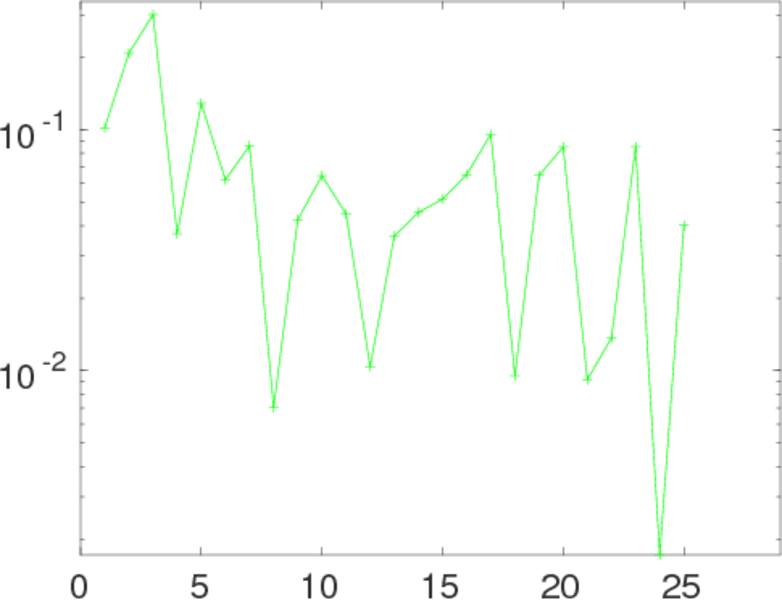
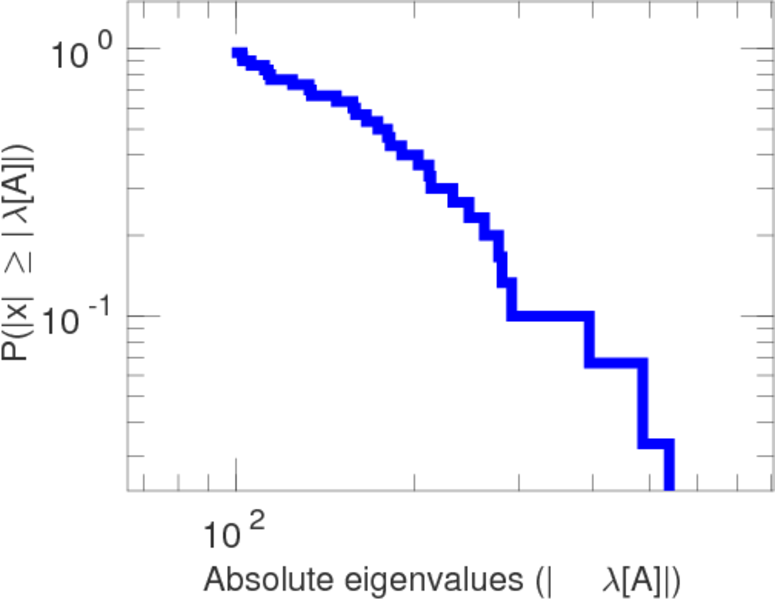
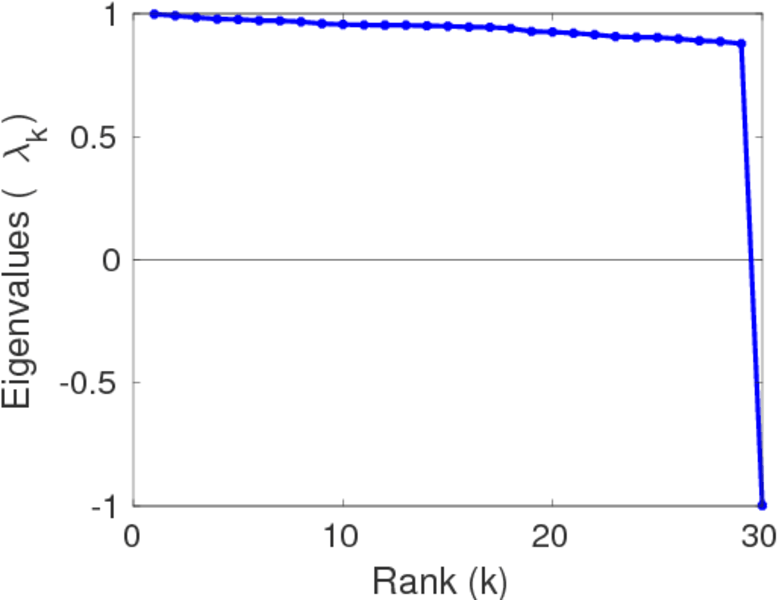
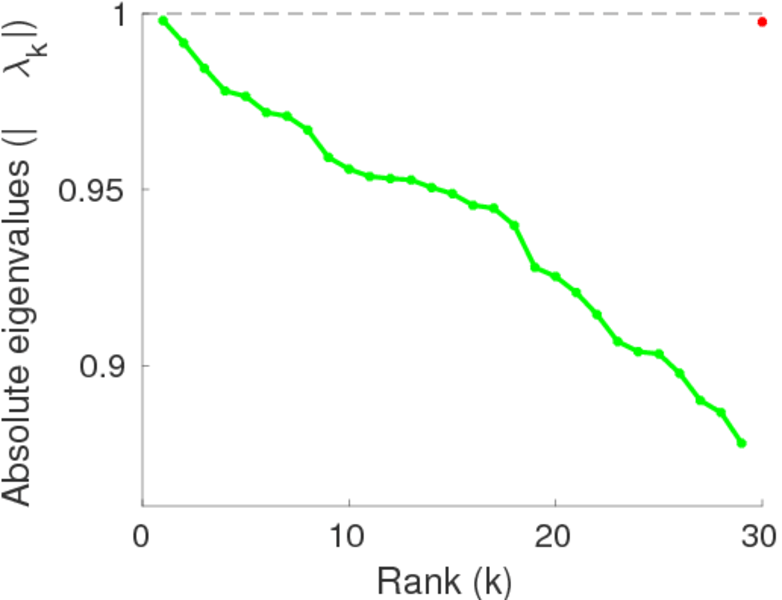
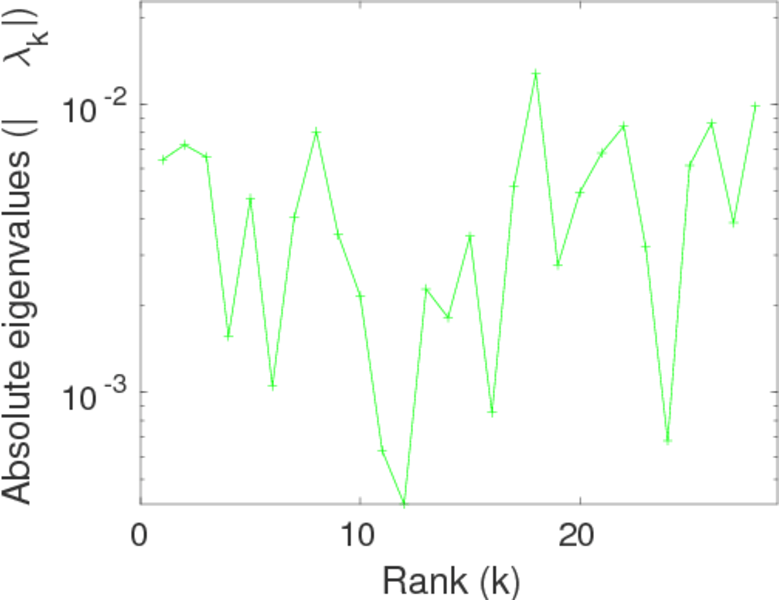
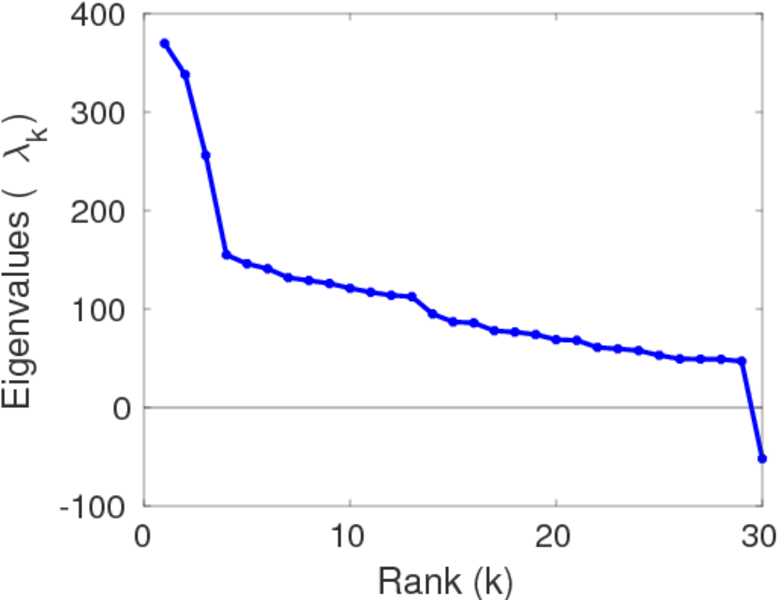
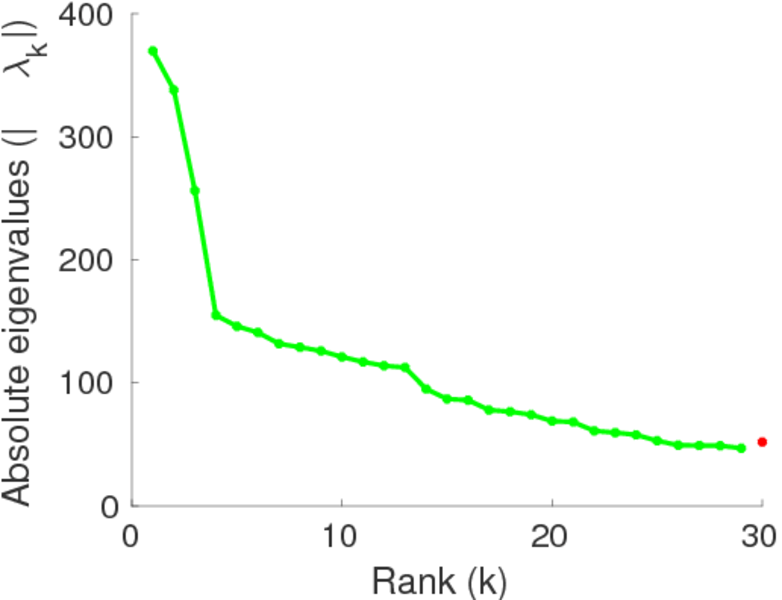
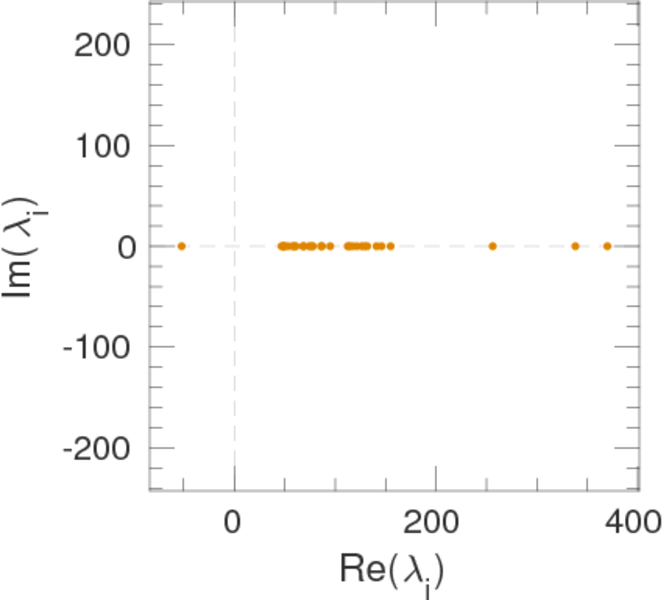
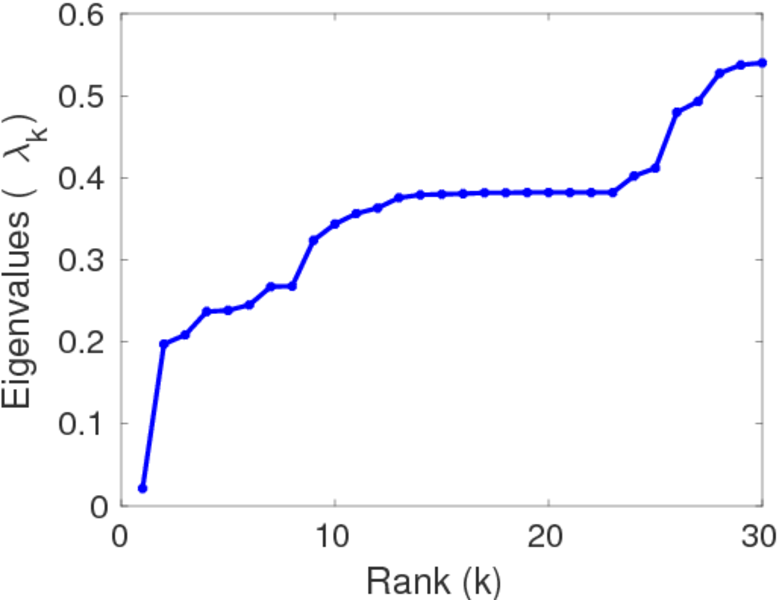
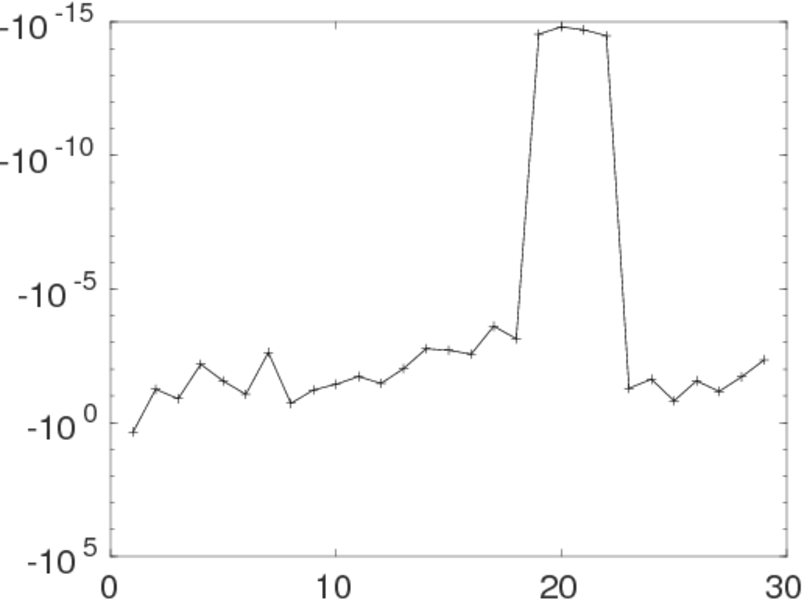
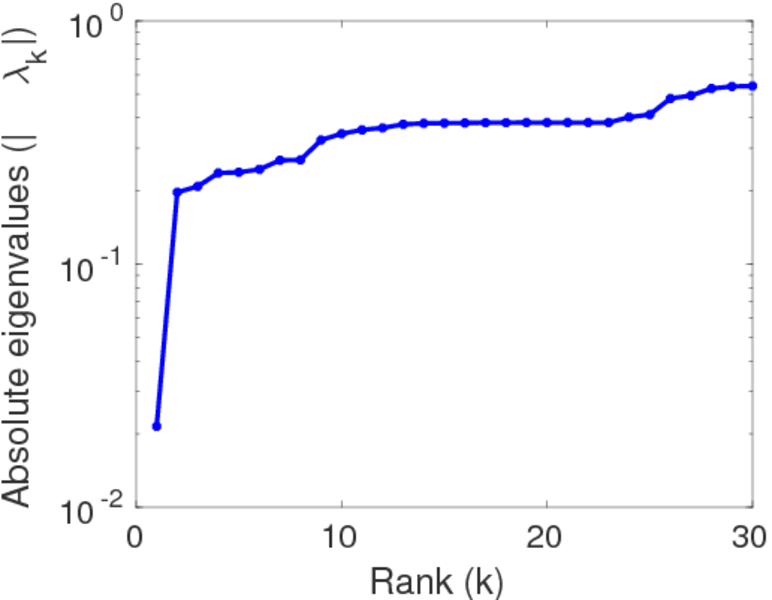
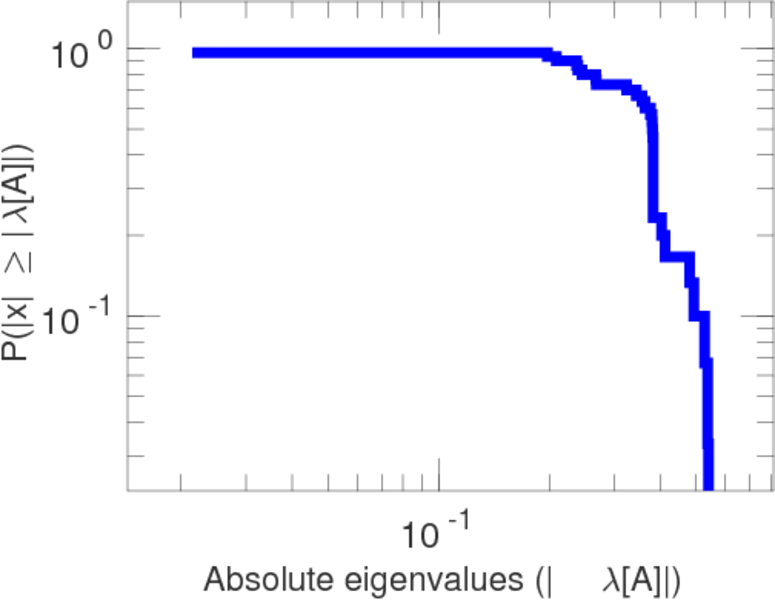
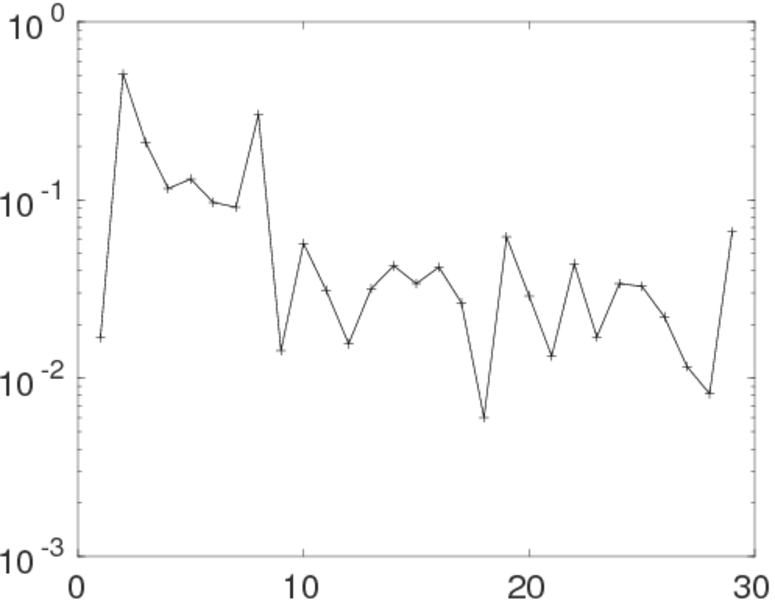
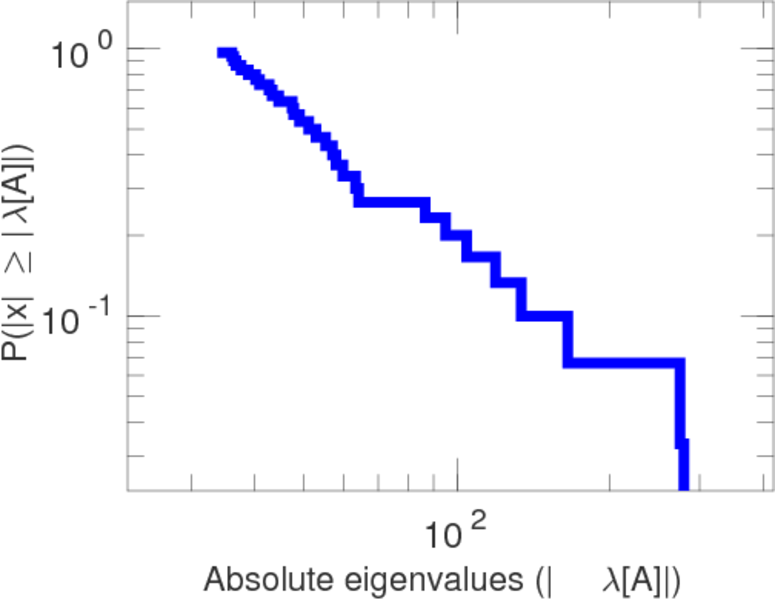
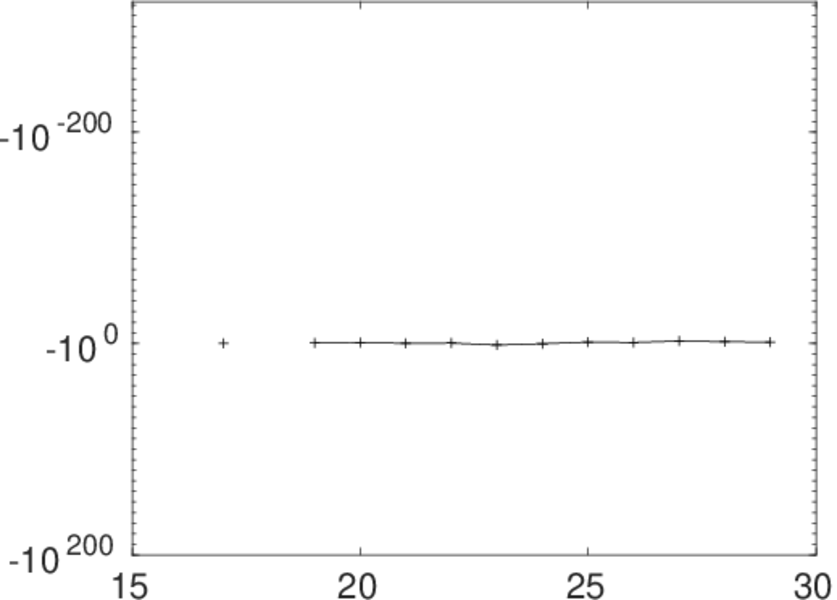
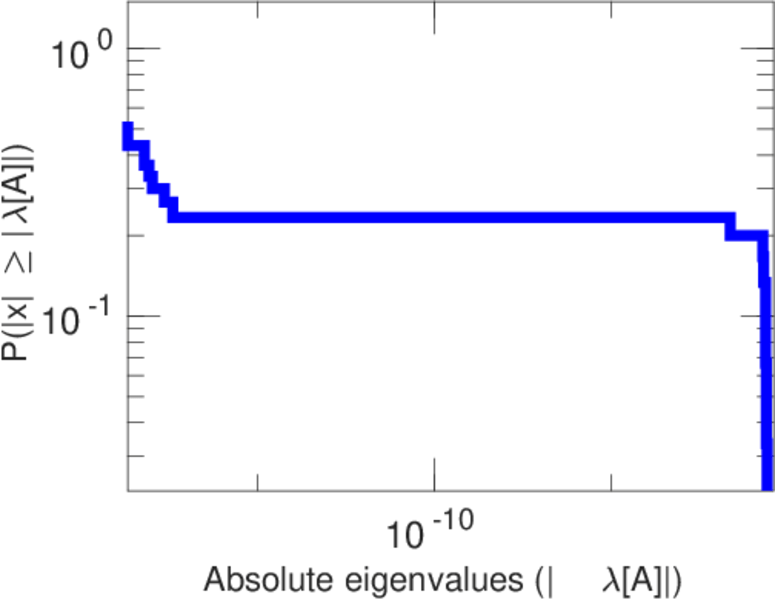
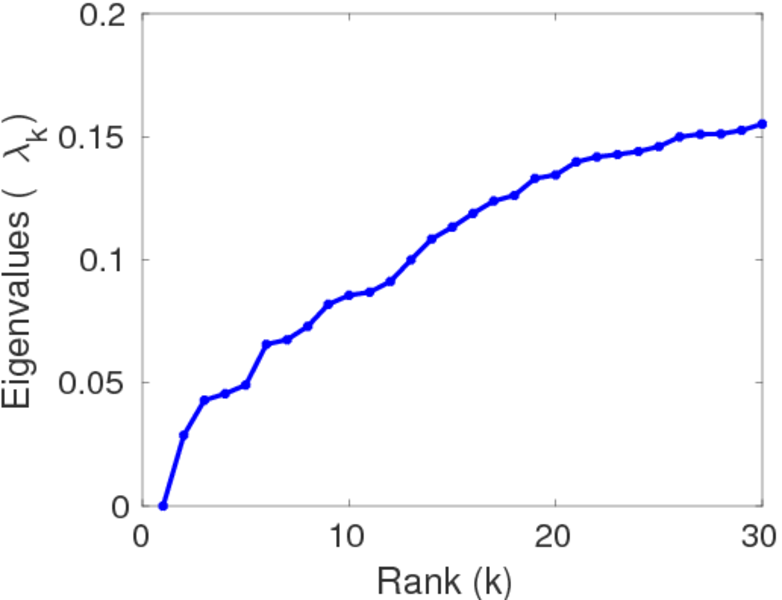
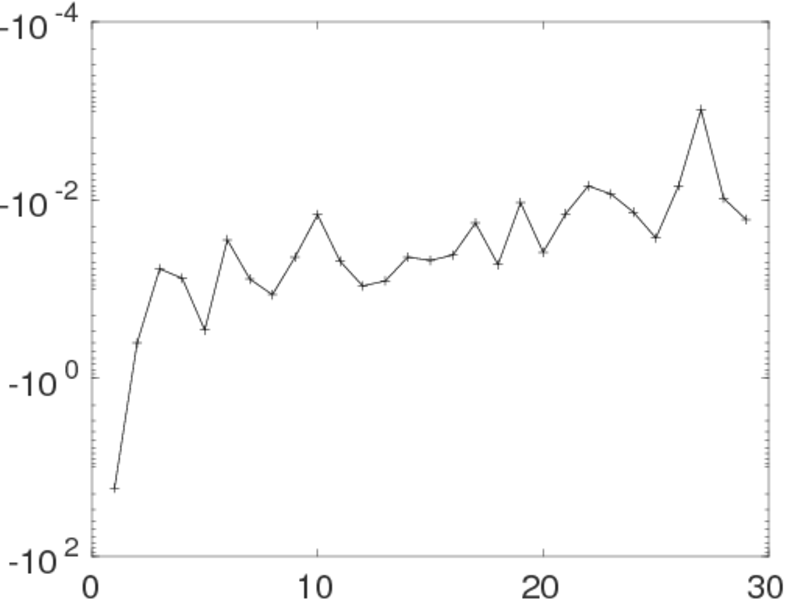
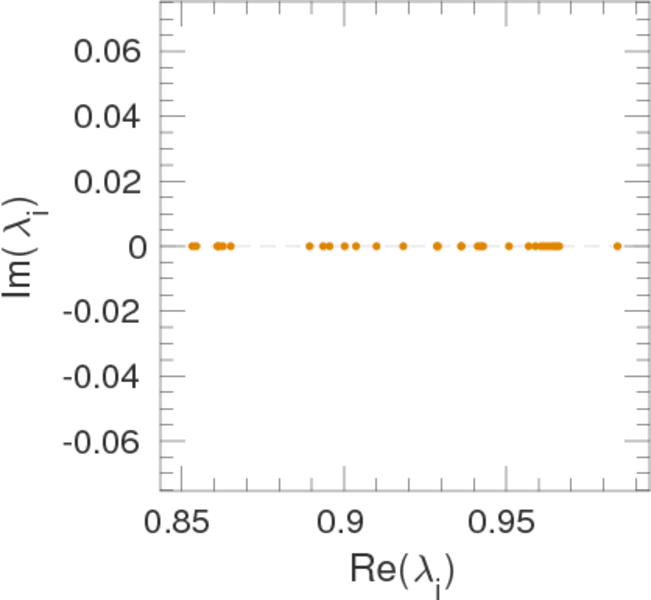
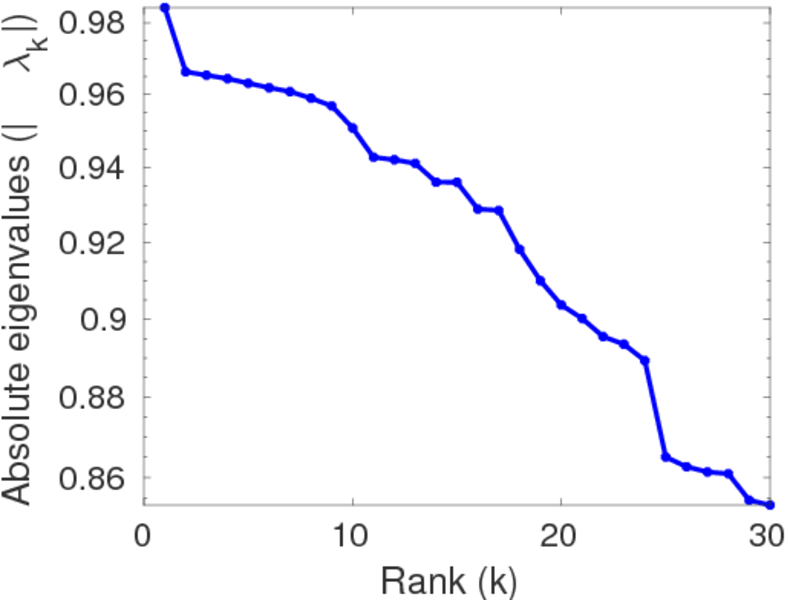
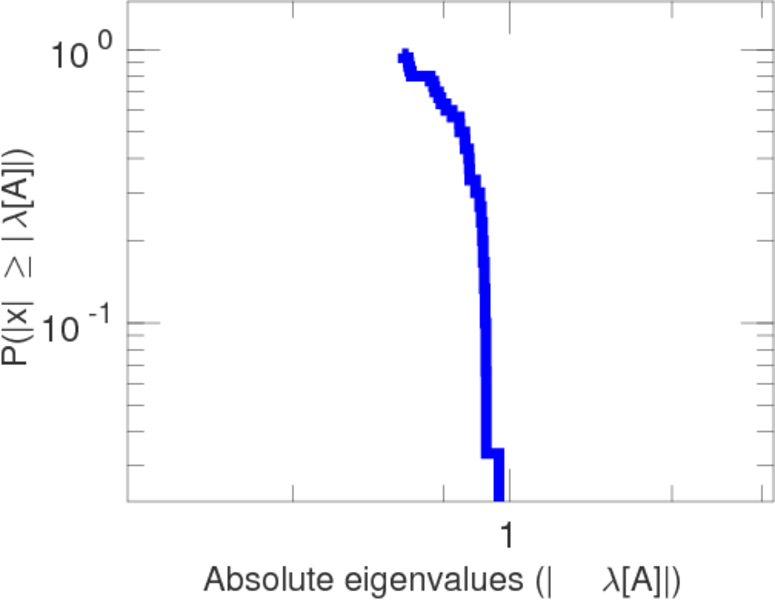
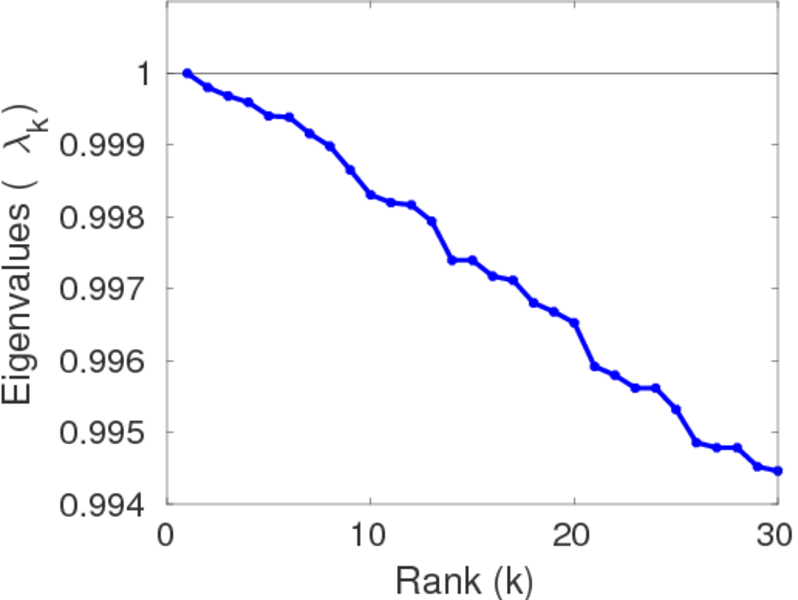
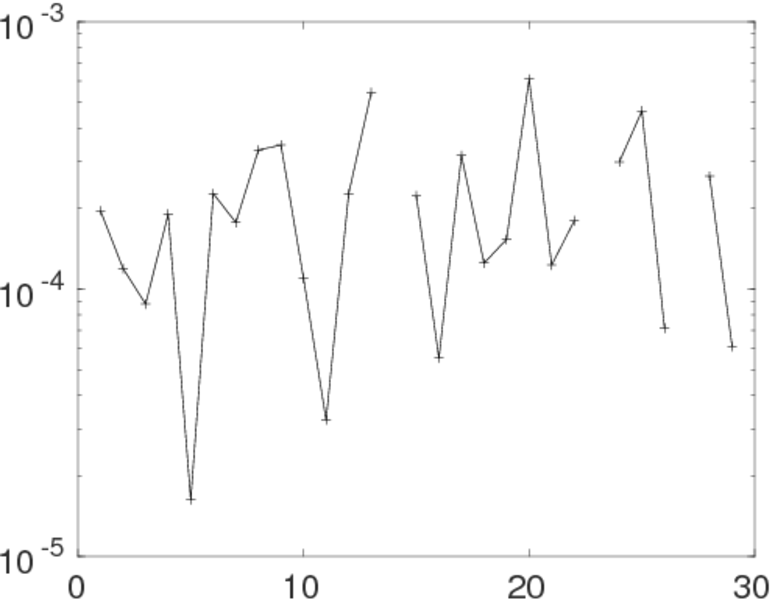
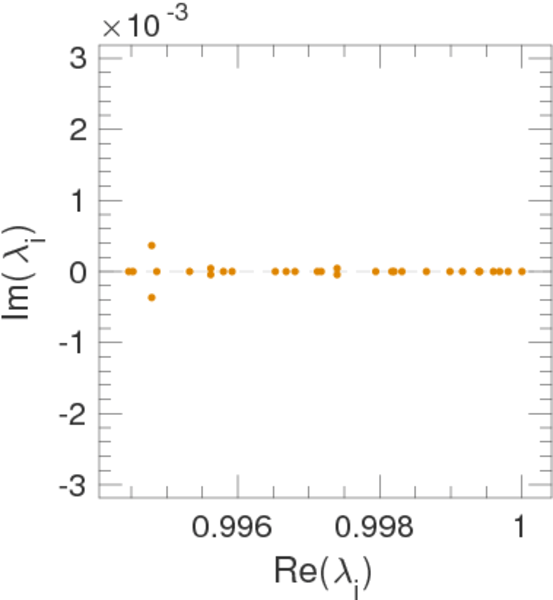
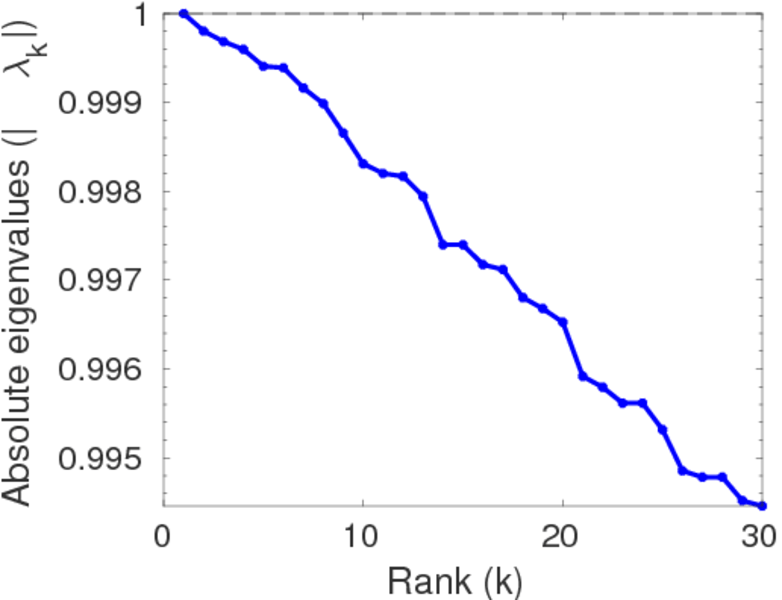
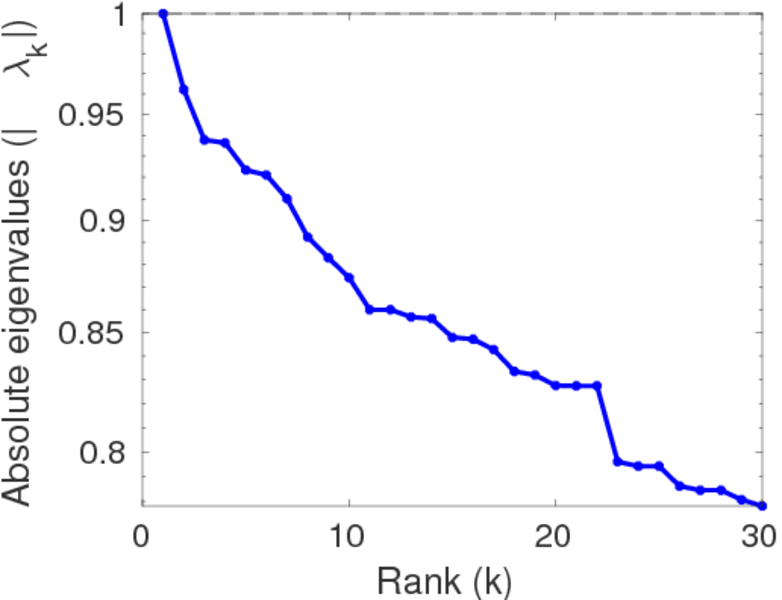
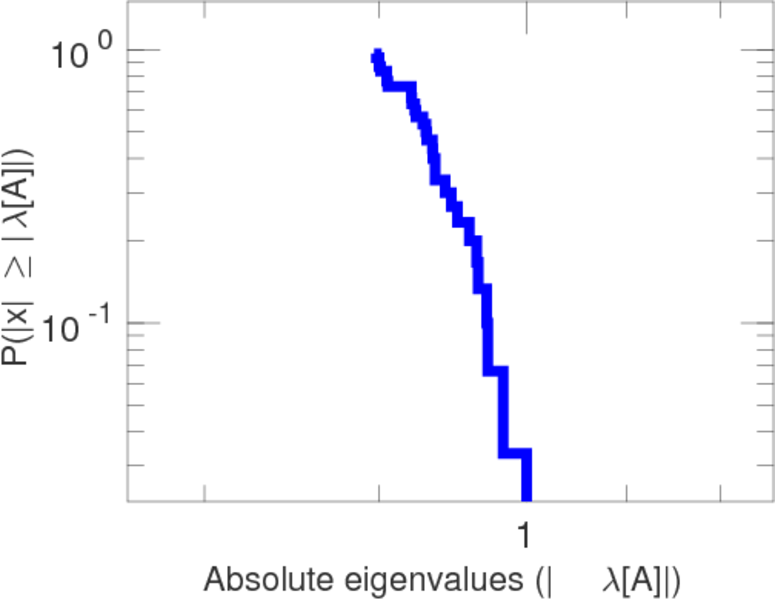
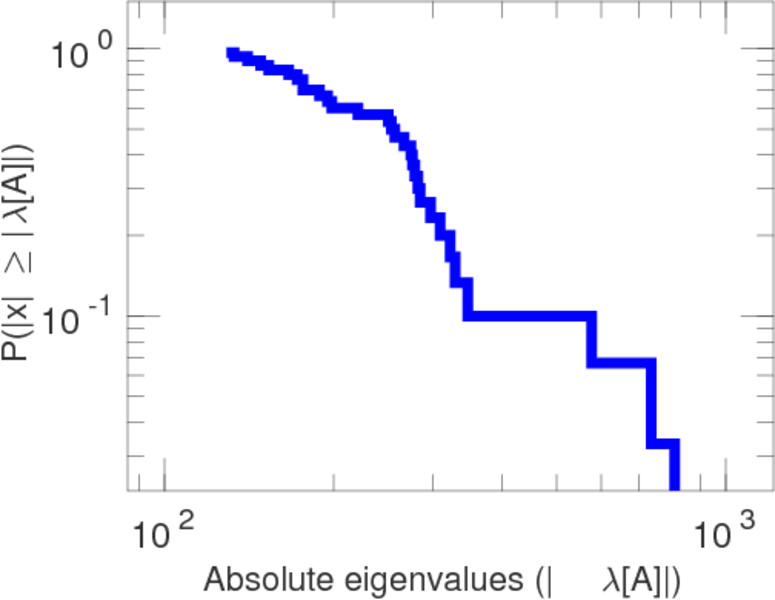
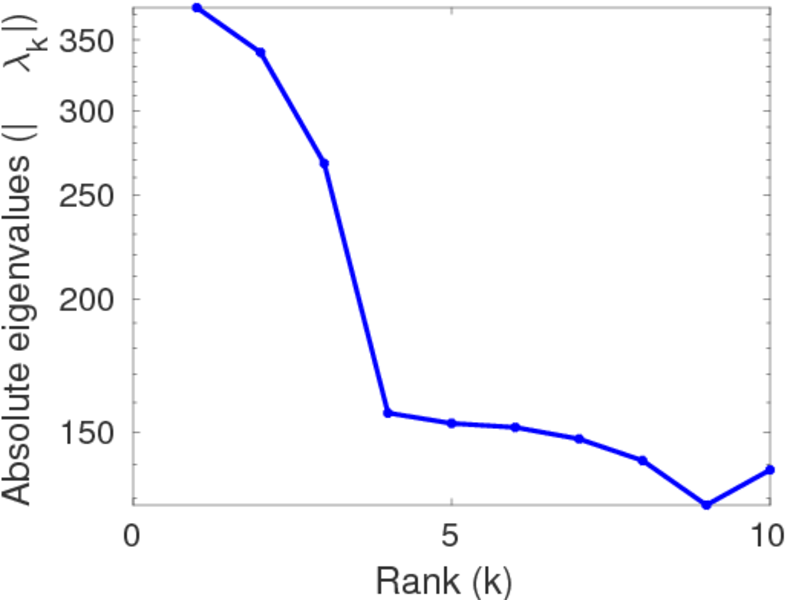
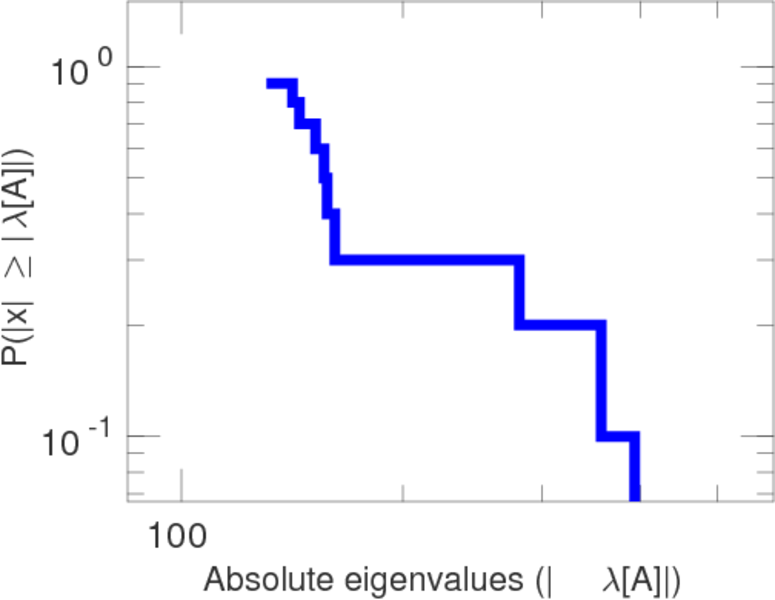
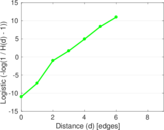
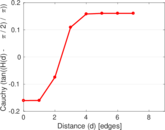
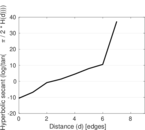
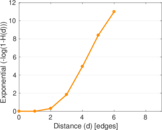
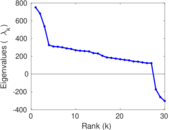
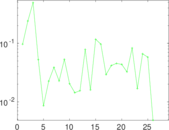
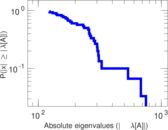
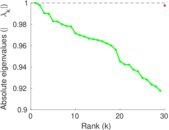
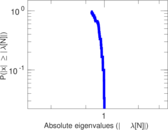
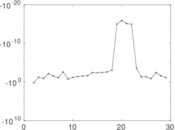
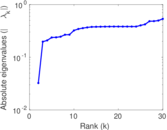
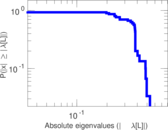
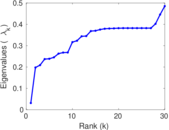
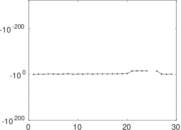
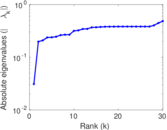
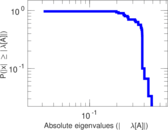
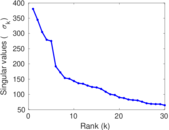
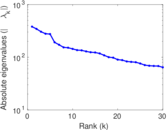
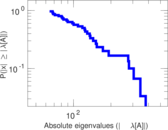
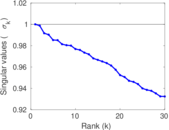
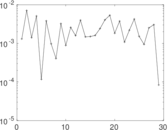
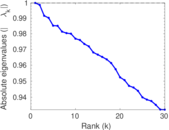
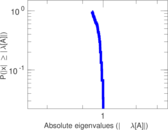
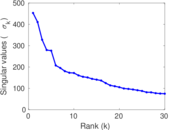
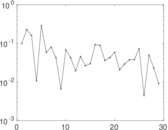
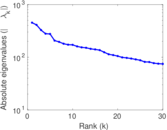
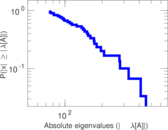
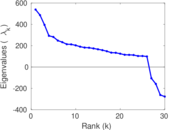
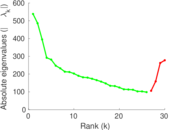
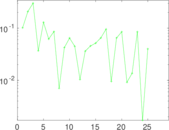
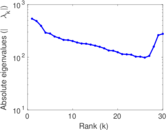
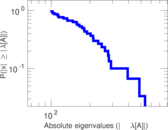
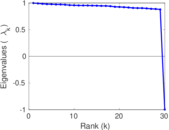
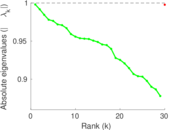
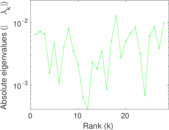
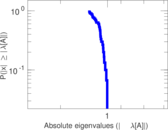
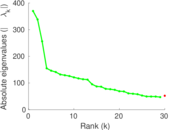
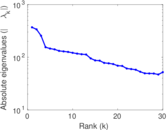
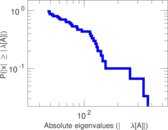
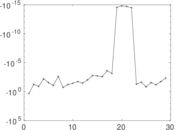
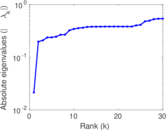
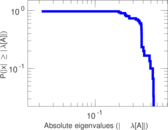
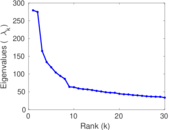
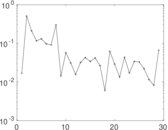
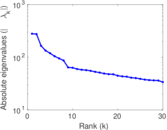
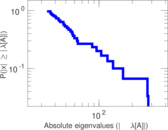
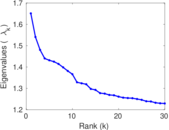
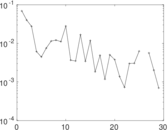
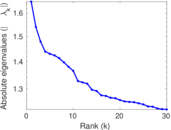
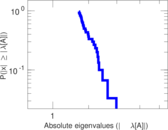
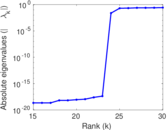
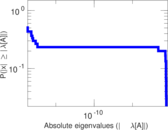
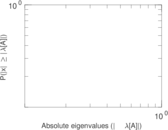
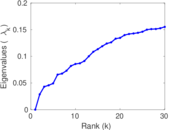
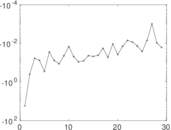
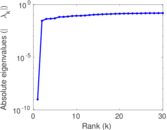
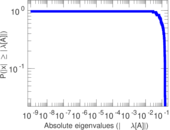
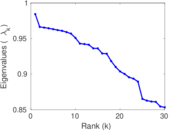
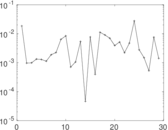
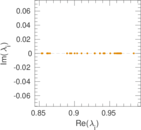
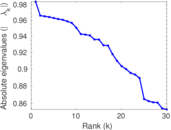
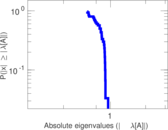
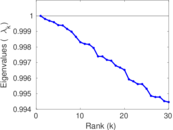
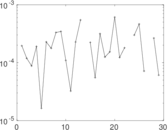
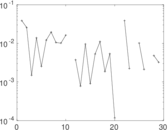
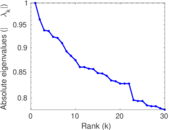
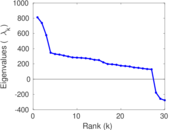
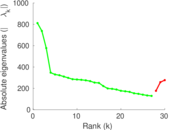
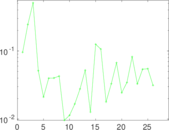
Plots


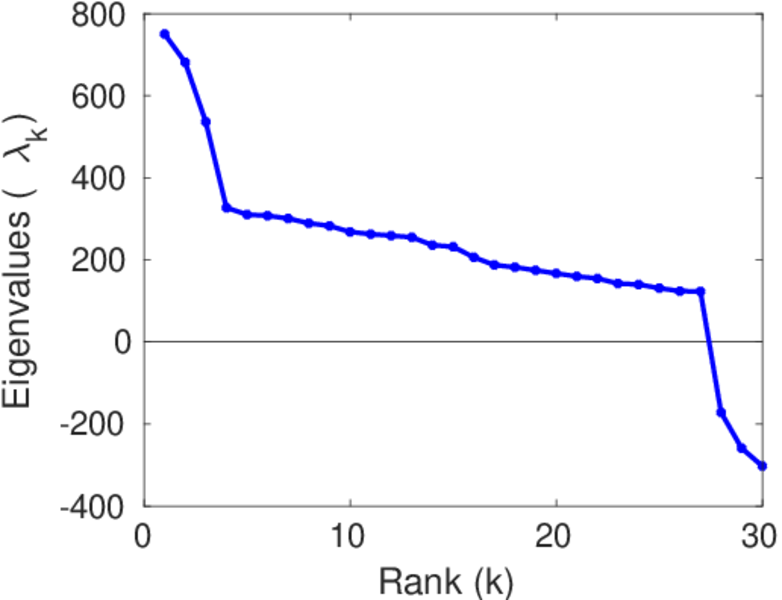
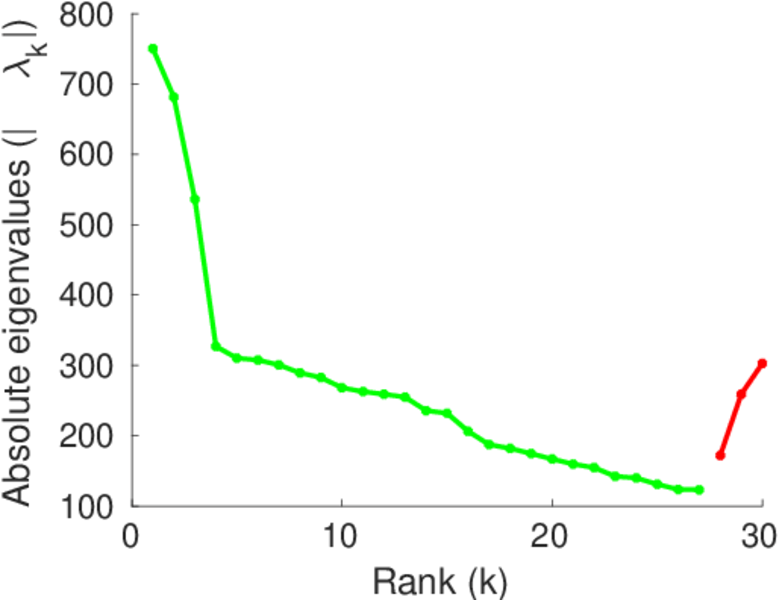
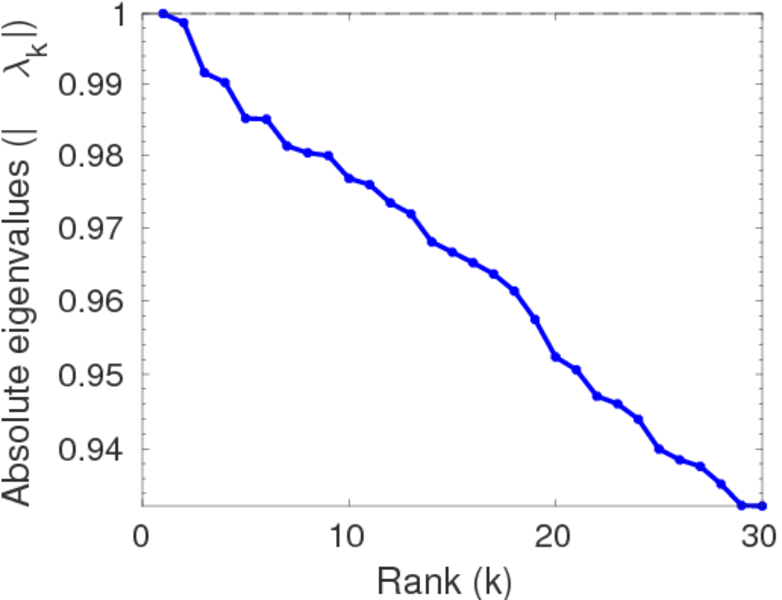
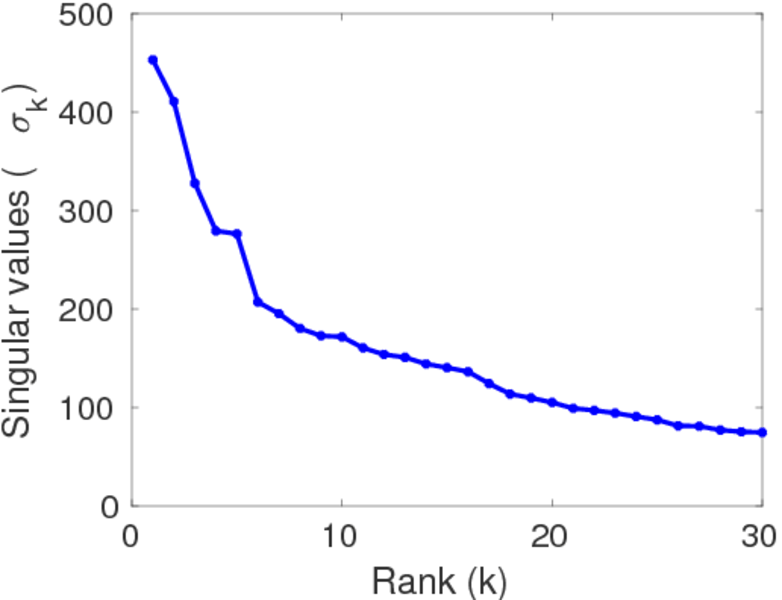
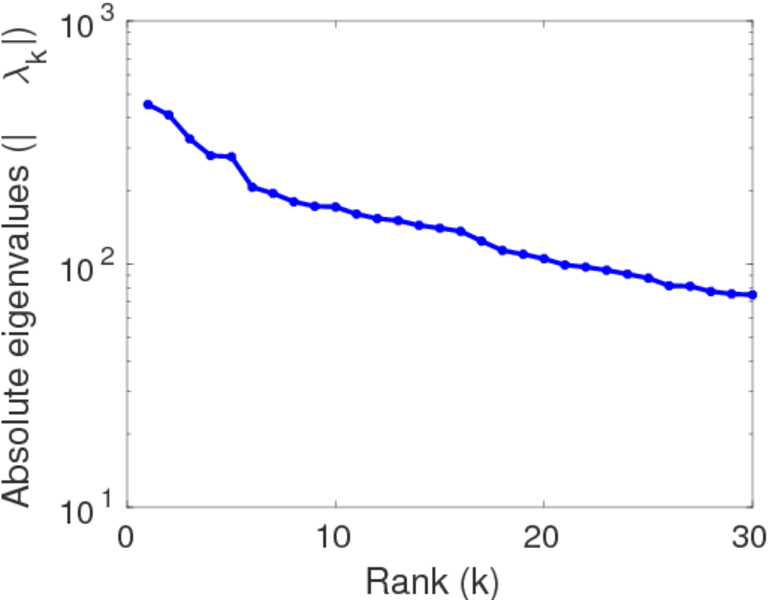
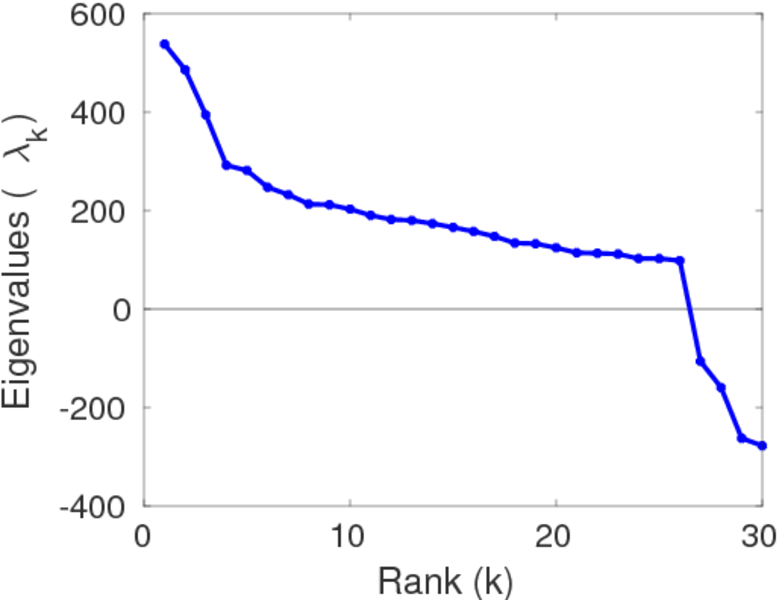
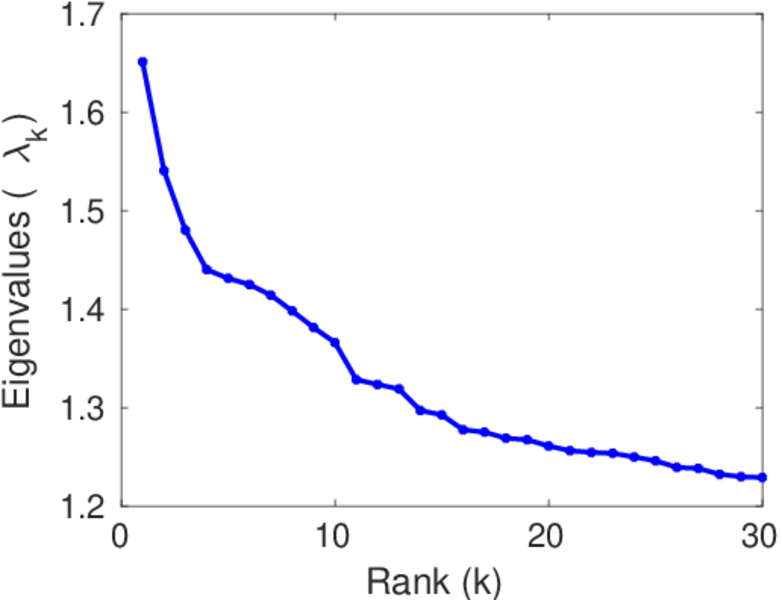
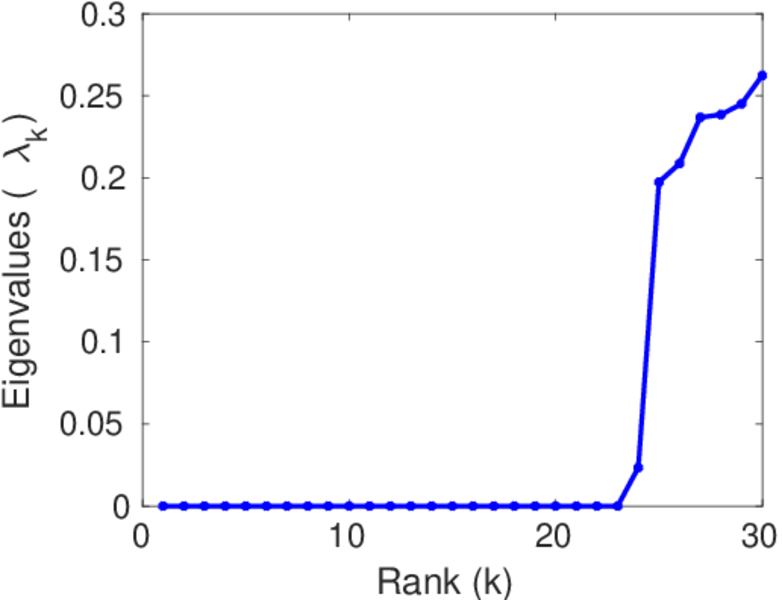
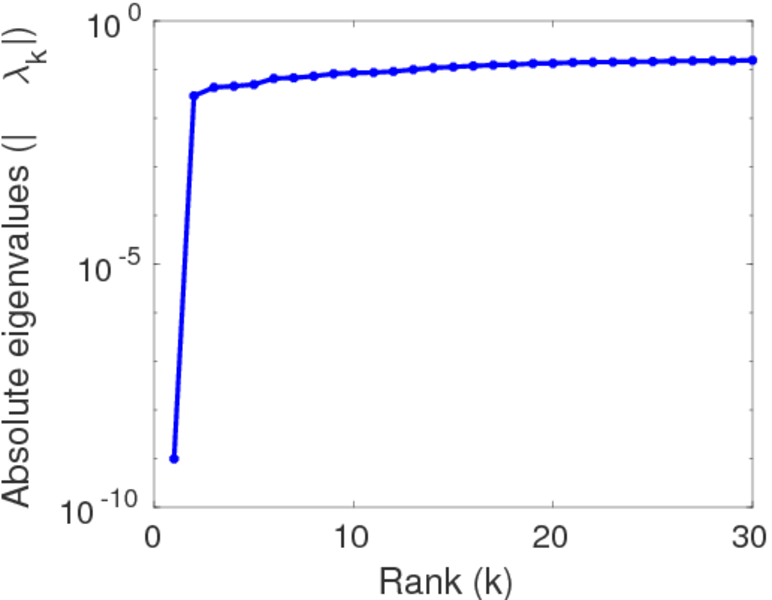
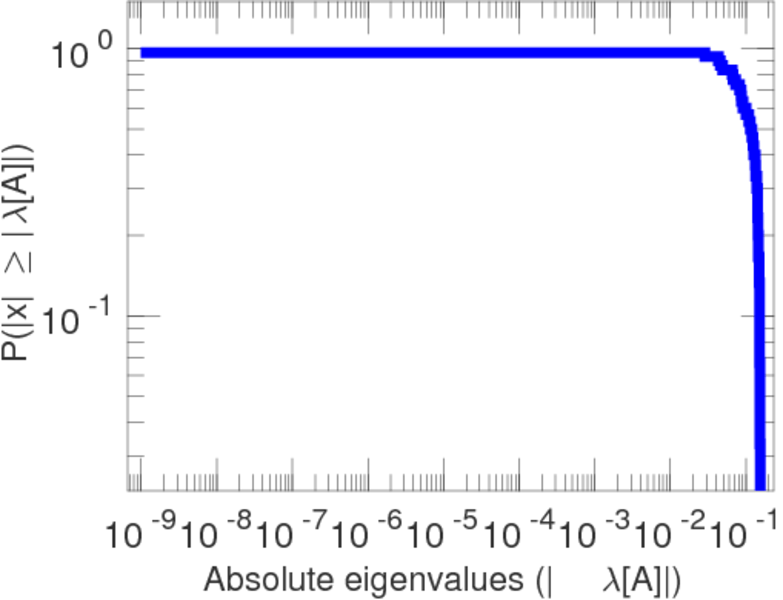
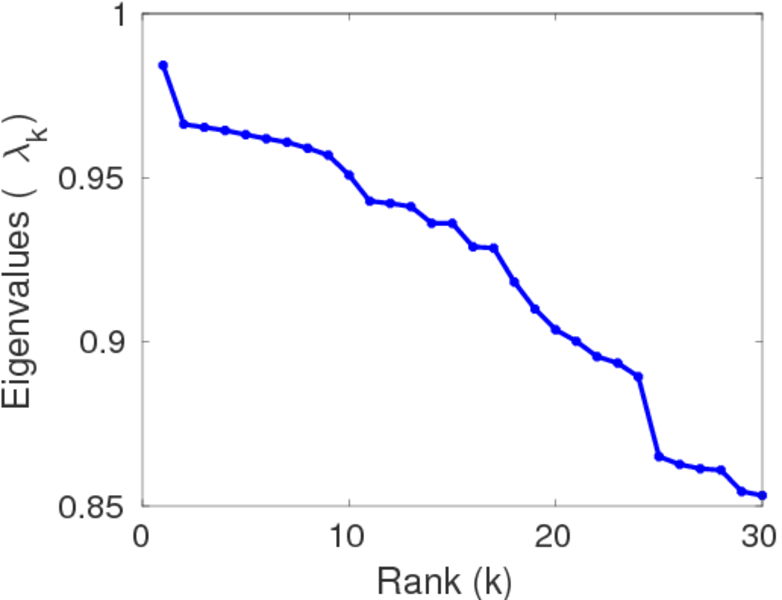
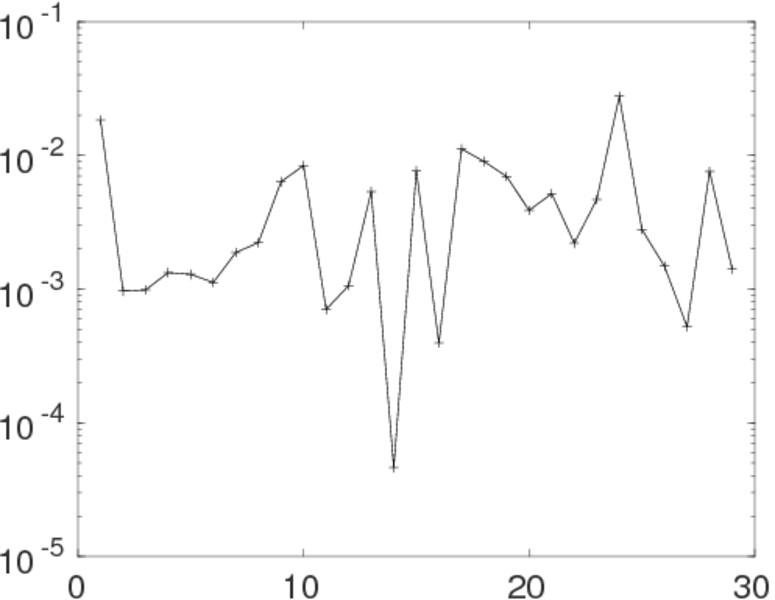
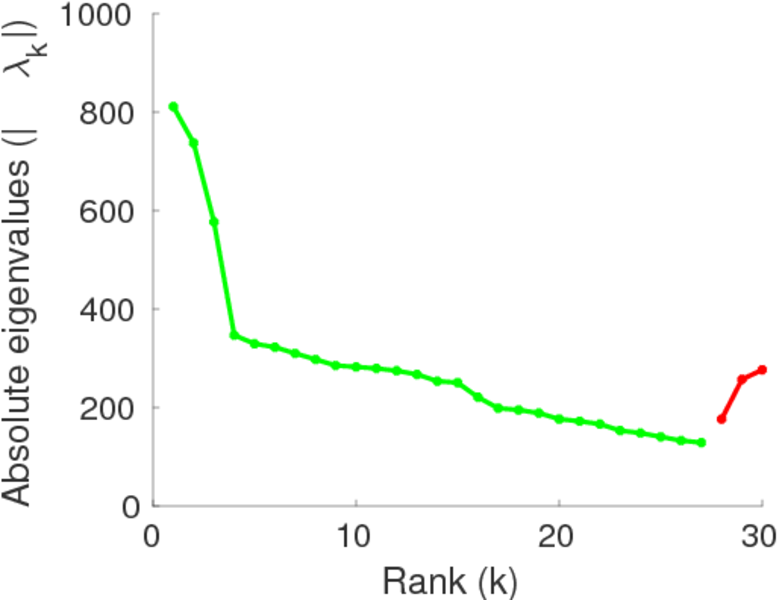
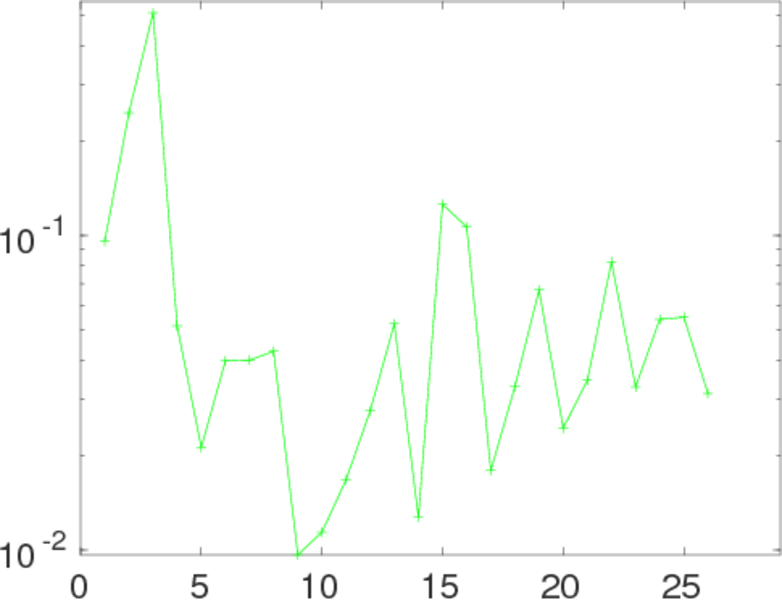
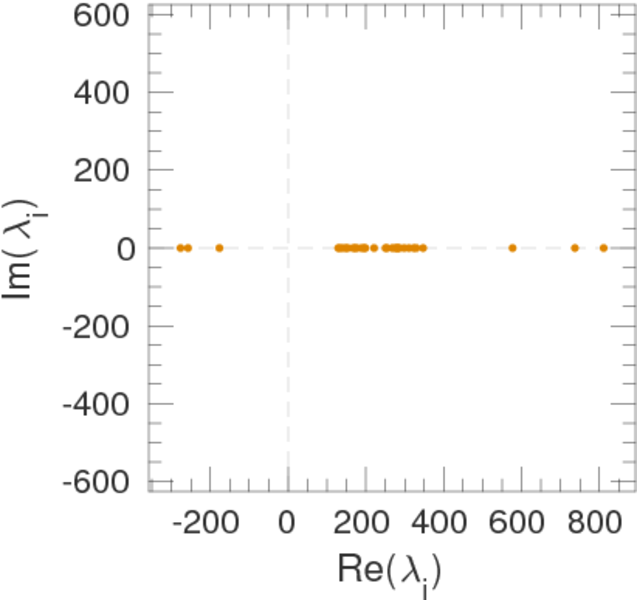
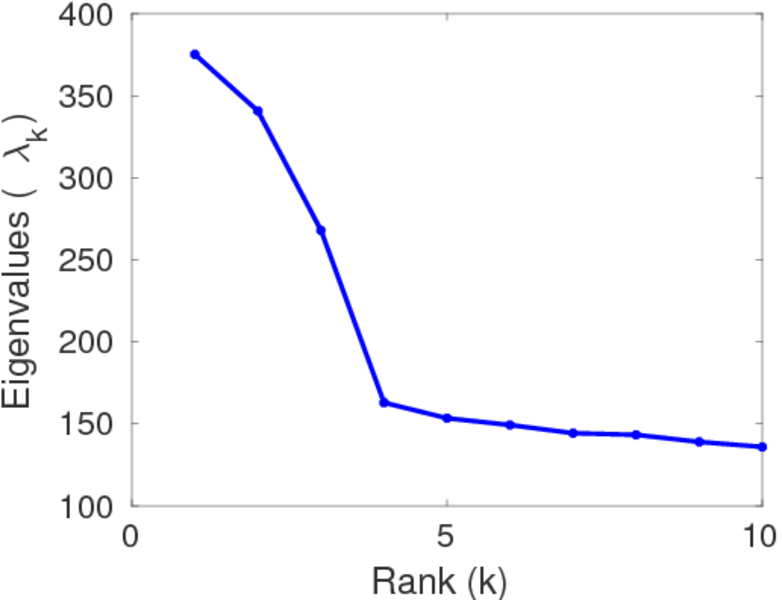
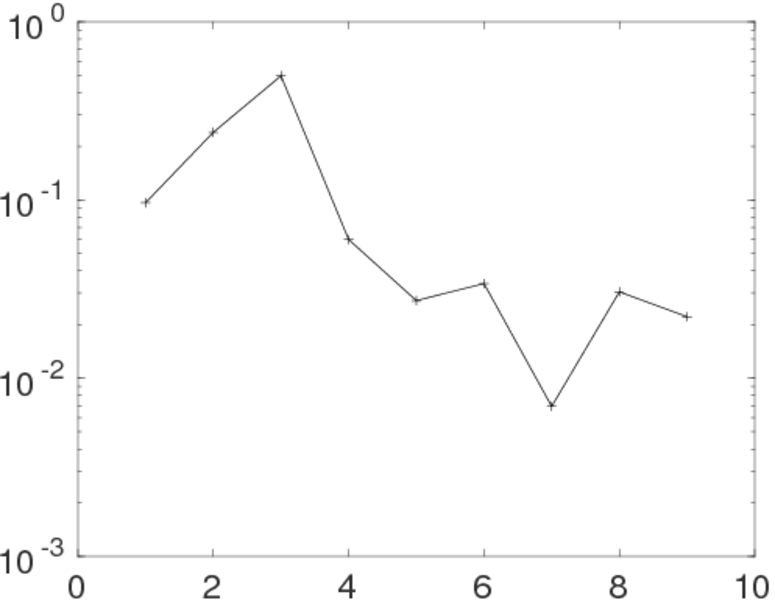
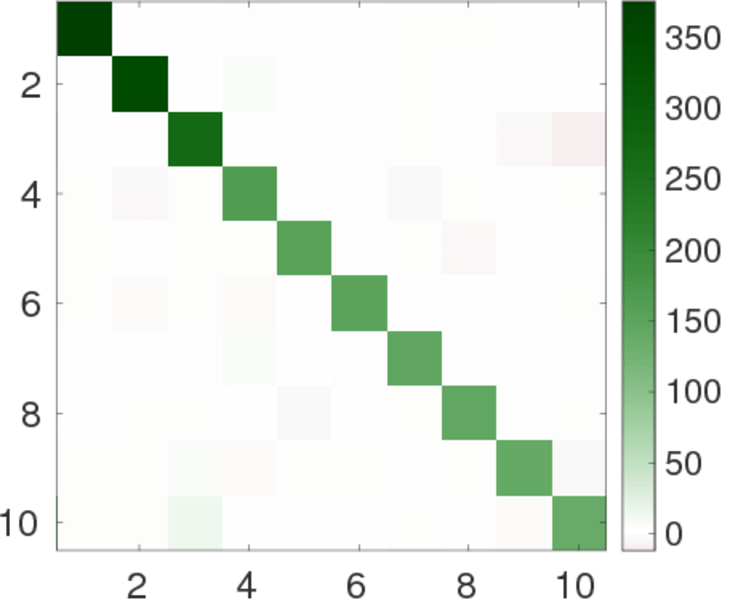
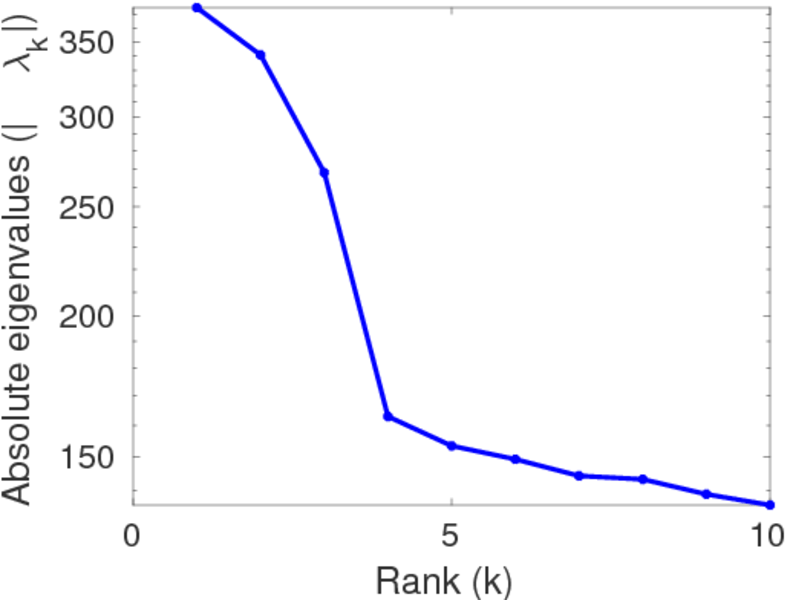
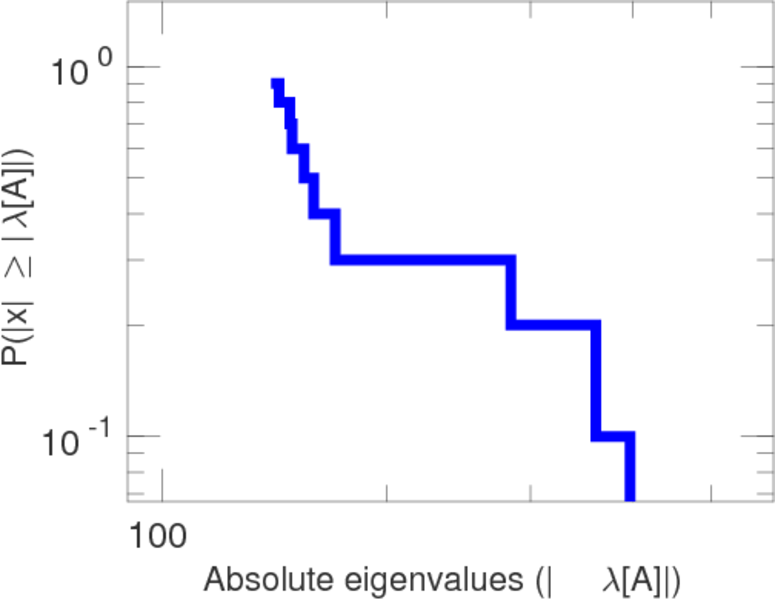
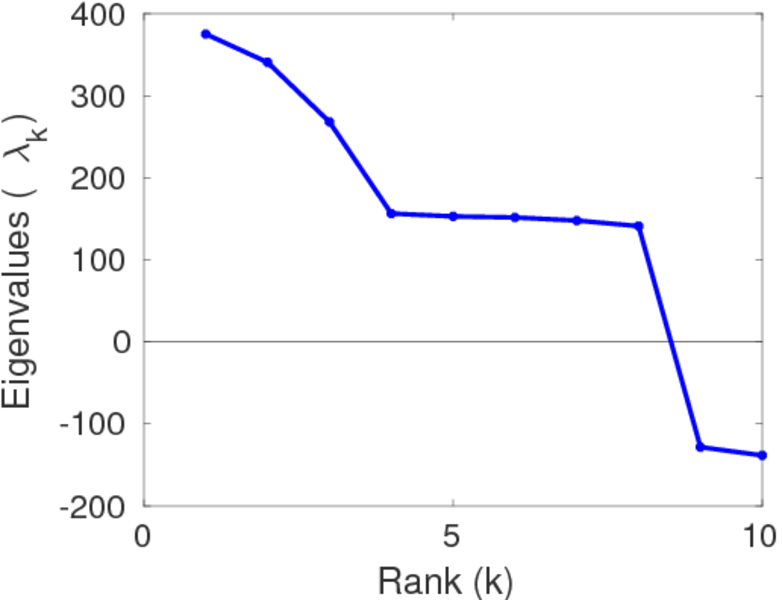
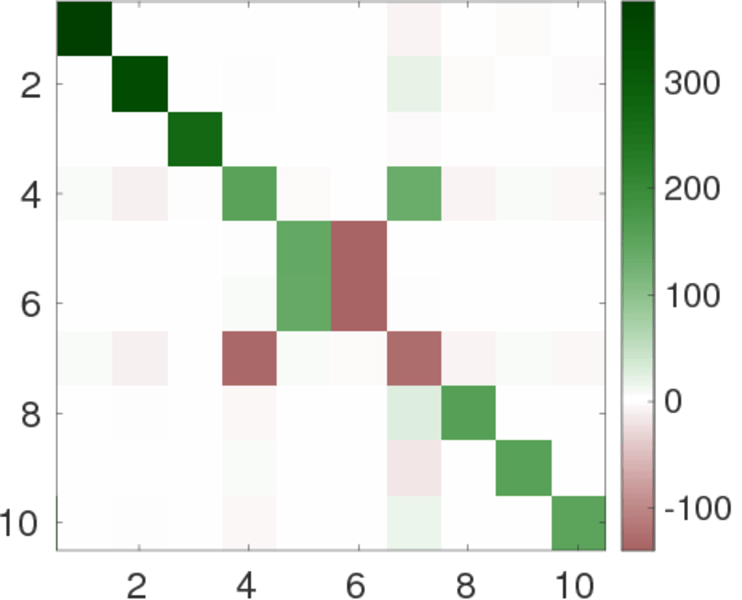
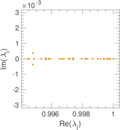
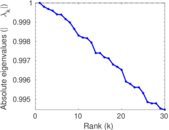
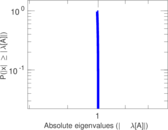
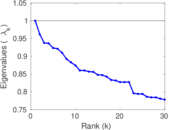
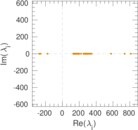
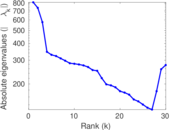
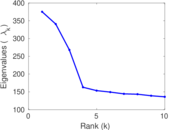
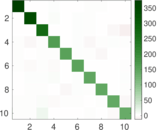
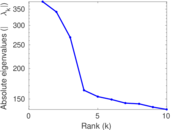
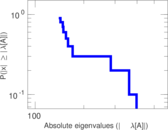
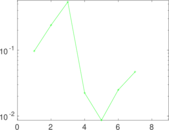
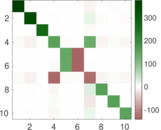
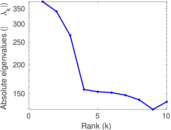
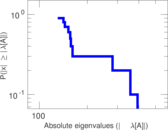
Matrix decompositions plots


Downloads
References
|
[1]
|
Jérôme Kunegis.
KONECT – The Koblenz Network Collection.
In Proc. Int. Conf. on World Wide Web Companion, pages
1343–1350, 2013.
[ http ]
|
 KONECT ‣ Networks ‣
Buy Me a Coffee
KONECT ‣ Networks ‣
Buy Me a Coffee