Wikipedia links (tt)
This network consists of the wikilinks of the Wikipedia in the Tatar language
(tt). Nodes are Wikipedia articles, and directed edges are wikilinks, i.e.,
hyperlinks within one wiki. In the wiki source, these are indicated with
[[double brackets]]. Only pages in the article namespace are included.
Metadata
Statistics
| Size | n = | 136,014
|
| Volume | m = | 4,919,249
|
| Wedge count | s = | 7,103,043,449
|
| Claw count | z = | 63,342,557,443,717
|
| Cross count | x = | 583,847,747,059,359,360
|
| Triangle count | t = | 195,246,386
|
| Square count | q = | 79,401,198,933
|
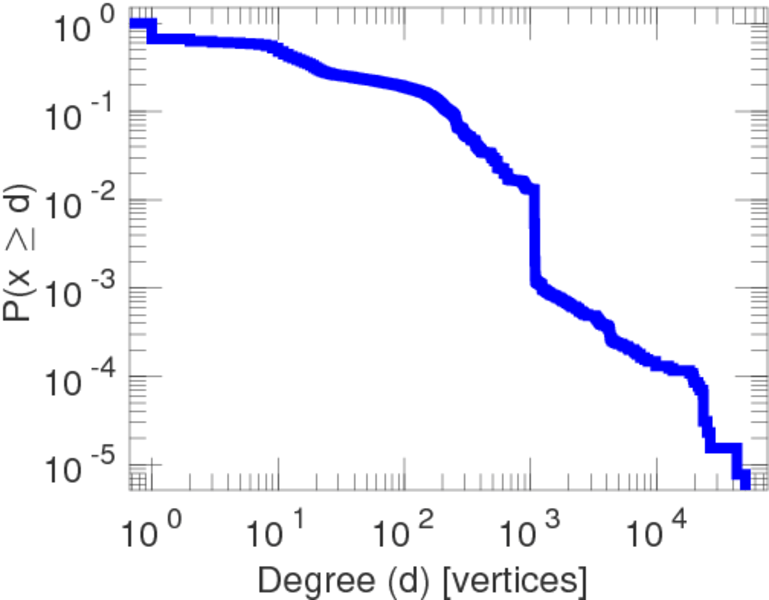
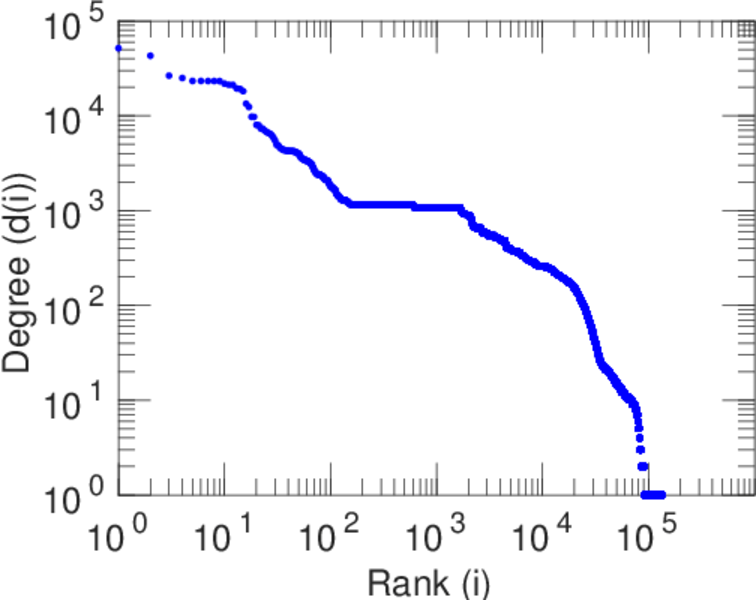
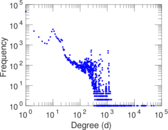
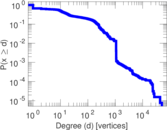
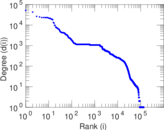
| Maximum degree | dmax = | 51,641
|
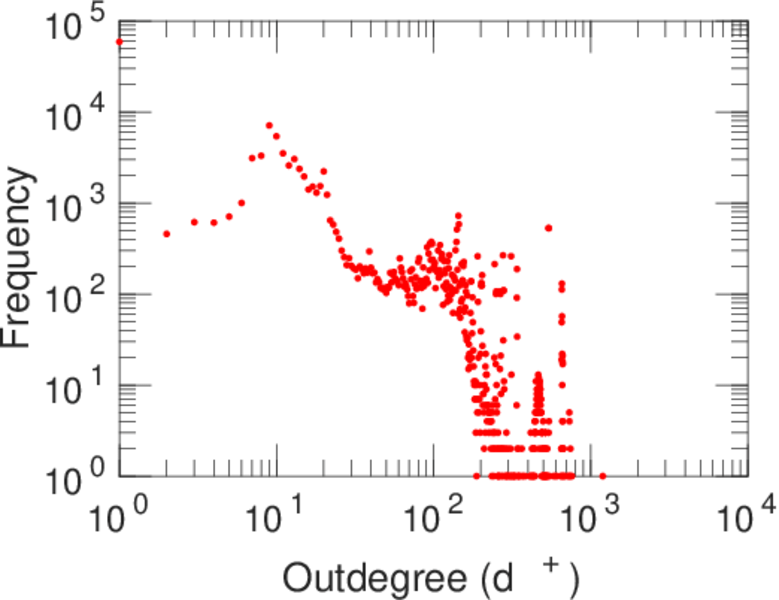
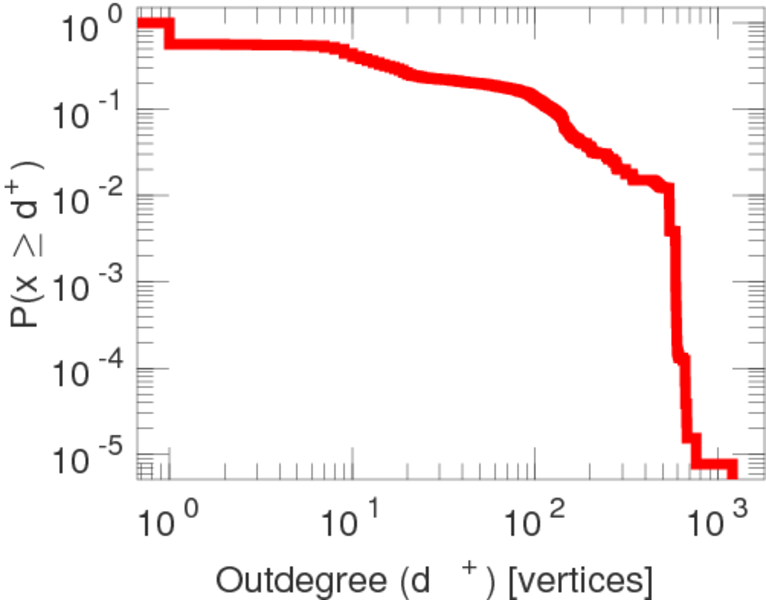
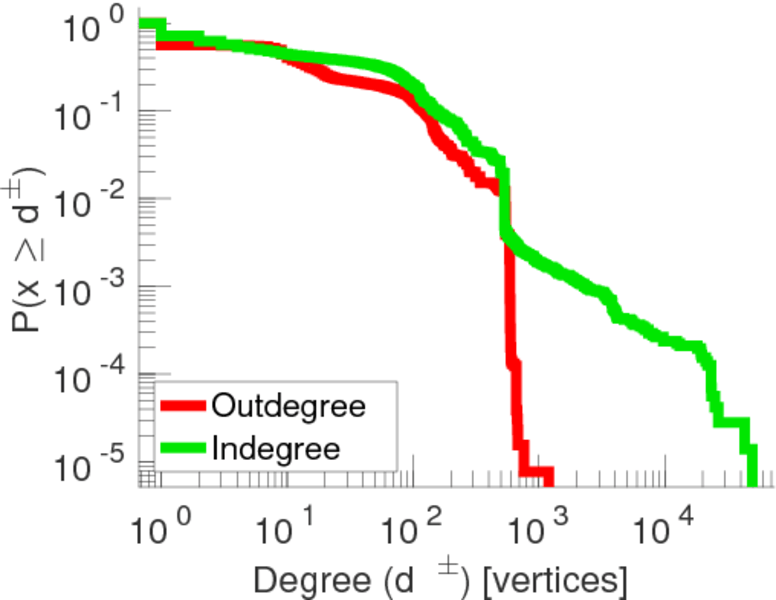
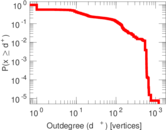
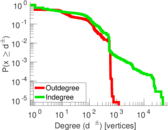
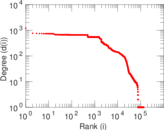
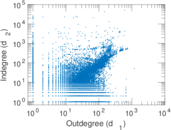
| Maximum outdegree | d+max = | 1,196
|
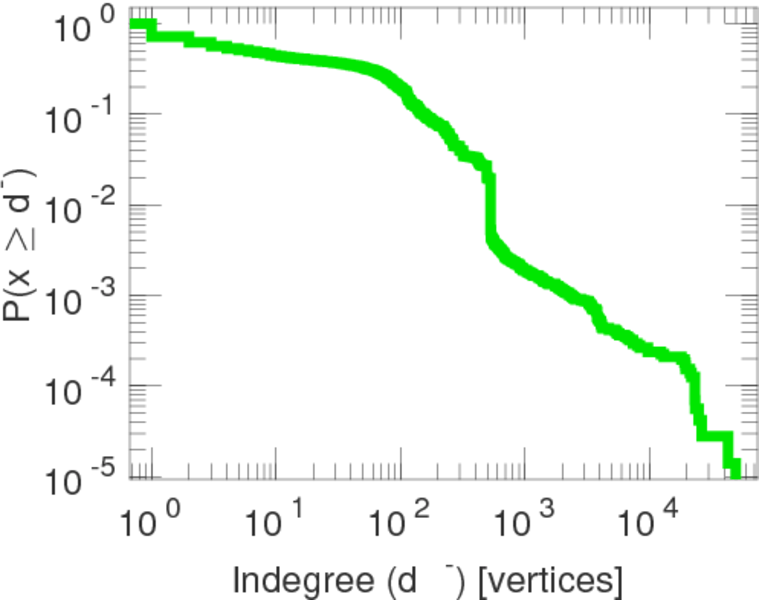
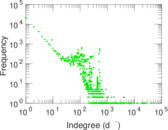
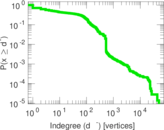
| Maximum indegree | d−max = | 51,042
|
| Average degree | d = | 72.334 5
|
| Size of LCC | N = | 135,985
|
| Size of LSCC | Ns = | 55,229
|
| Relative size of LSCC | Nrs = | 0.406 054
|
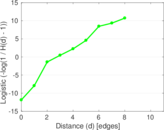
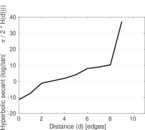
| Diameter | δ = | 11
|
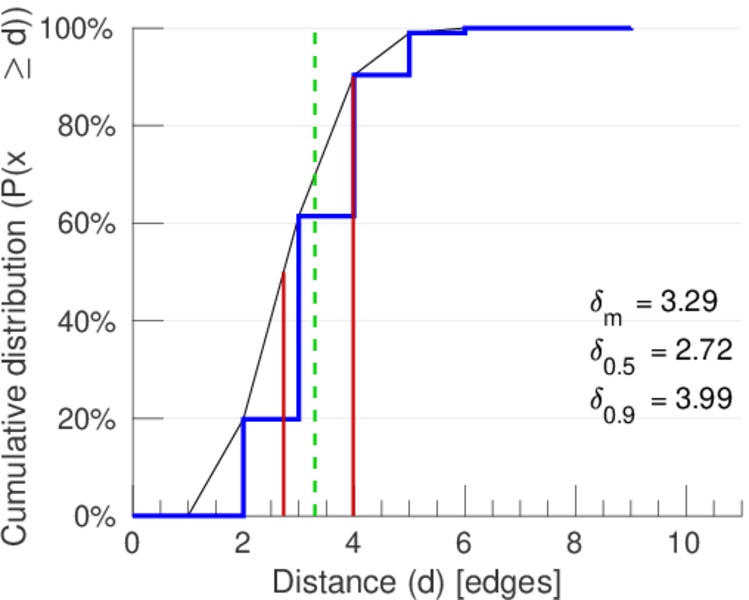
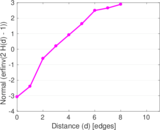
| 50-Percentile effective diameter | δ0.5 = | 2.724 76
|
| 90-Percentile effective diameter | δ0.9 = | 3.987 35
|
| Median distance | δM = | 3
|
| Mean distance | δm = | 3.293 46
|
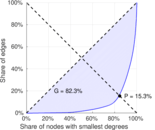
| Gini coefficient | G = | 0.823 460
|
| Balanced inequality ratio | P = | 0.152 561
|
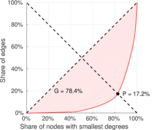
| Outdegree balanced inequality ratio | P+ = | 0.171 547
|
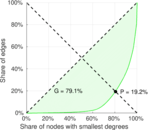
| Indegree balanced inequality ratio | P− = | 0.191 852
|
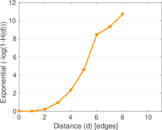
| Relative edge distribution entropy | Her = | 0.863 332
|
| Power law exponent | γ = | 1.471 06
|
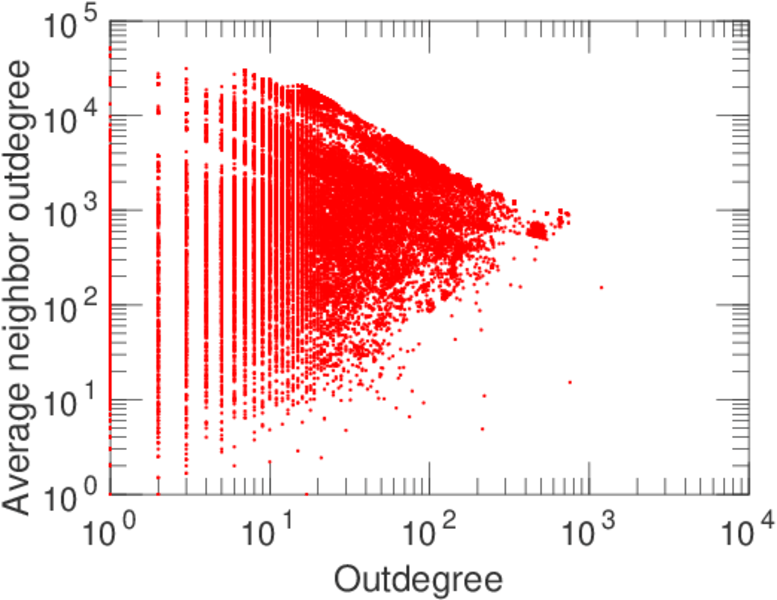
| Degree assortativity | ρ = | −0.080 891 6
|
| Degree assortativity p-value | pρ = | 0.000 00
|
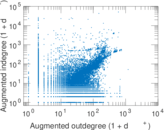
| In/outdegree correlation | ρ± = | +0.769 205
|
| Clustering coefficient | c = | 0.082 463 1
|
| Directed clustering coefficient | c± = | 0.839 557
|
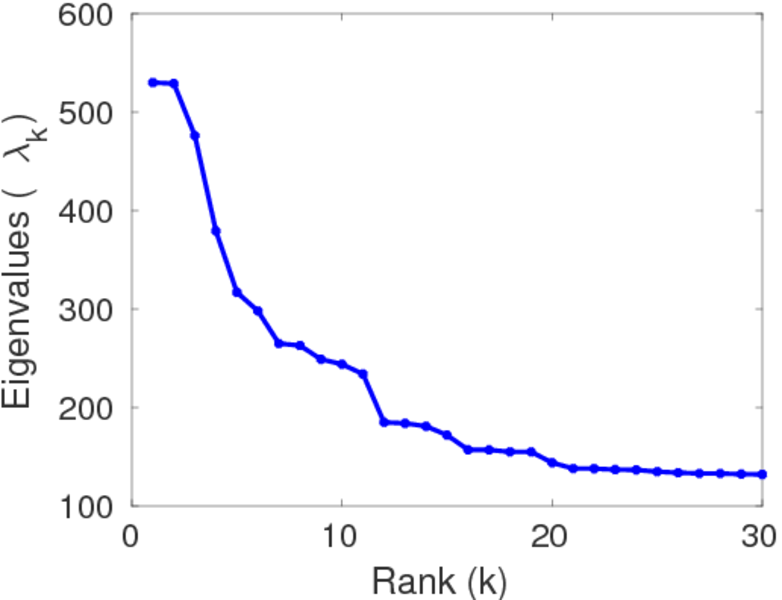
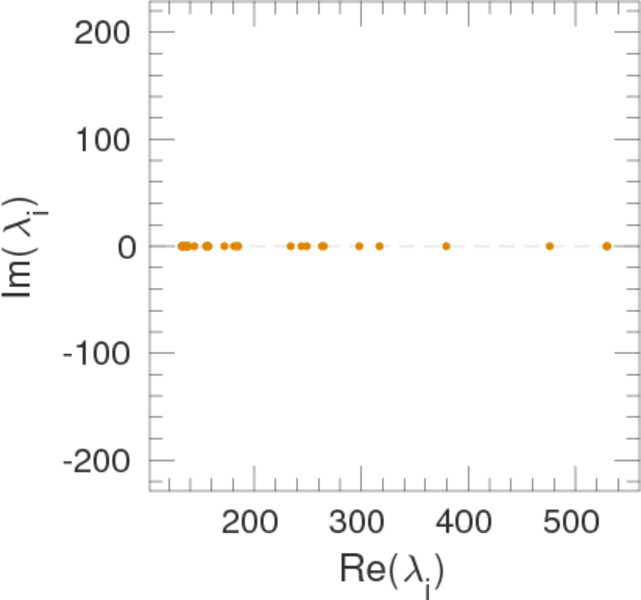
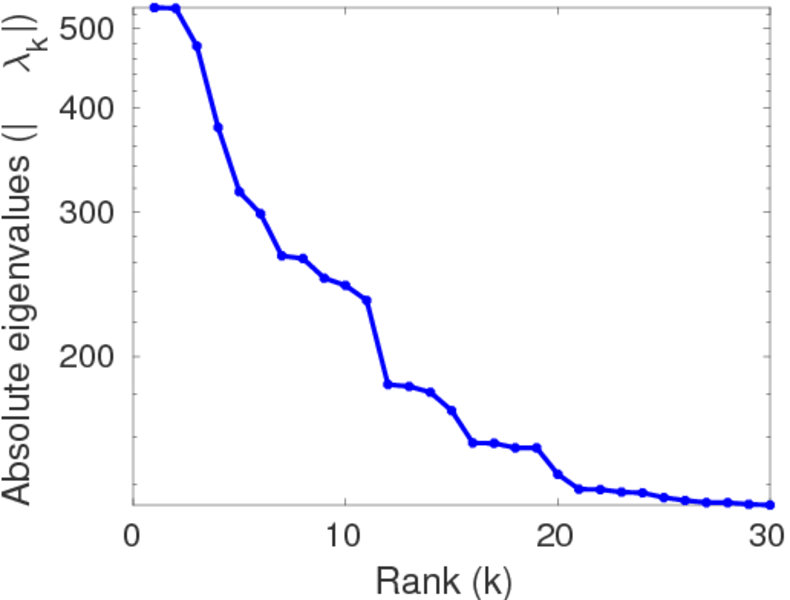
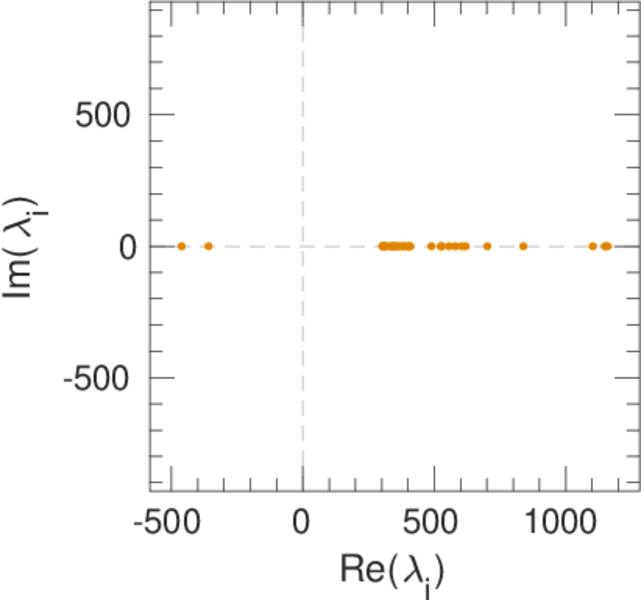
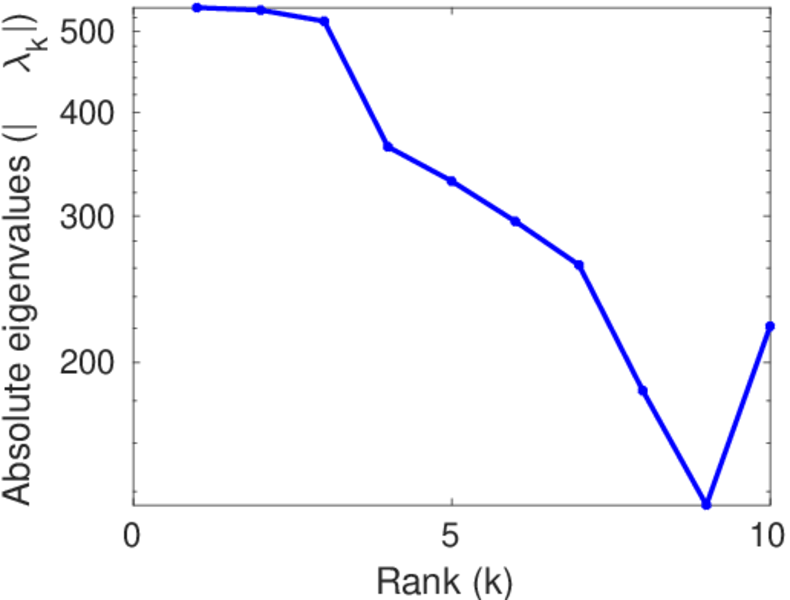
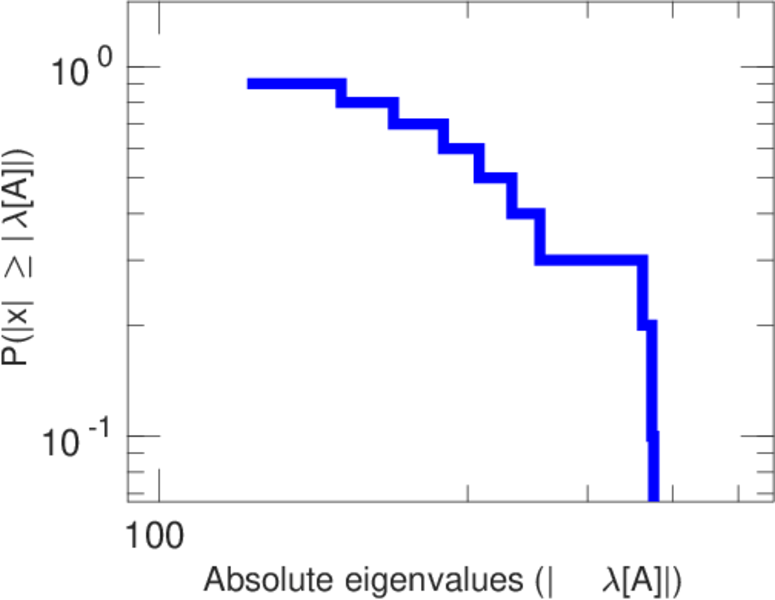
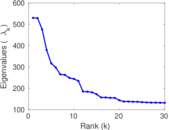
| Operator 2-norm | ν = | 578.389
|
| Cyclic eigenvalue | π = | 530.008
|
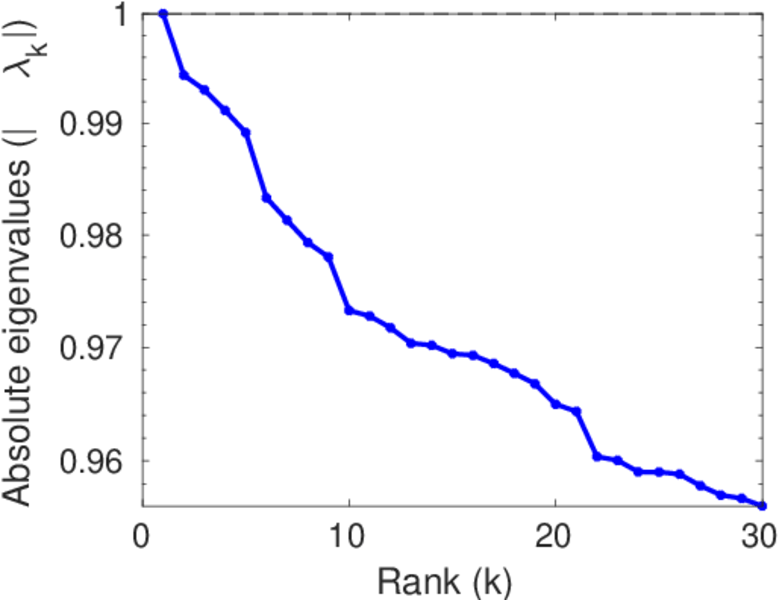
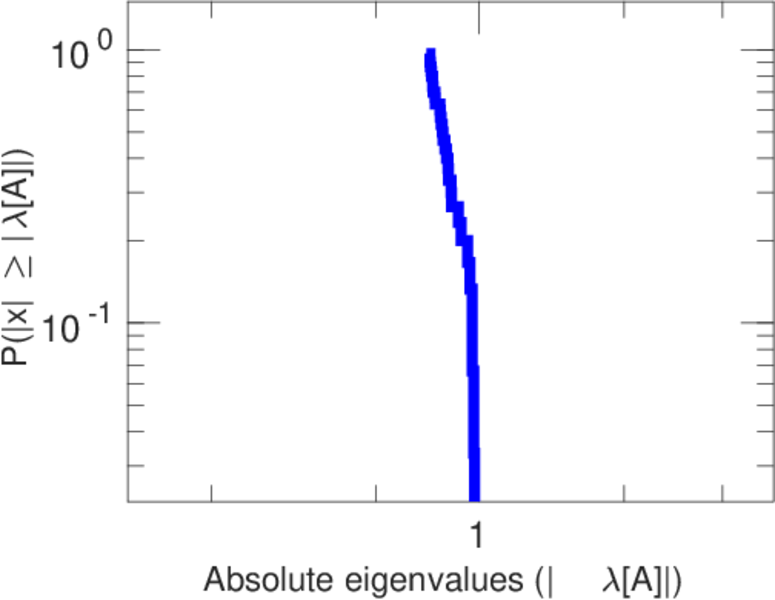
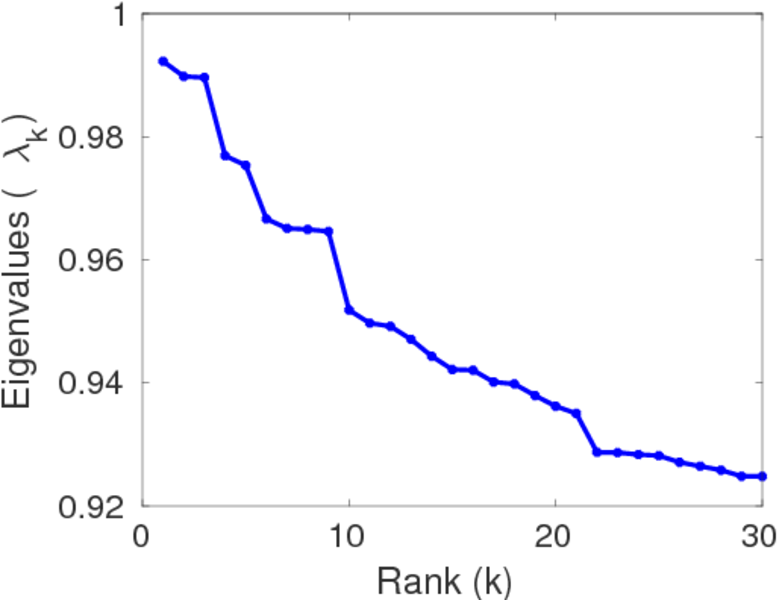
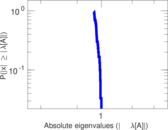
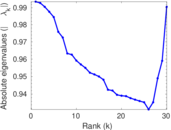
| Spectral separation | |λ1[A] / λ2[A]| = | 1.009 92
|
| Reciprocity | y = | 0.654 513
|
| Non-bipartivity | bA = | 0.567 452
|
| Normalized non-bipartivity | bN = | 0.009 434 73
|
| Algebraic non-bipartivity | χ = | 0.018 108 5
|
| Spectral bipartite frustration | bK = | 9.301 06 × 10−5
|
| Controllability | C = | 67,448
|
| Relative controllability | Cr = | 0.495 890
|
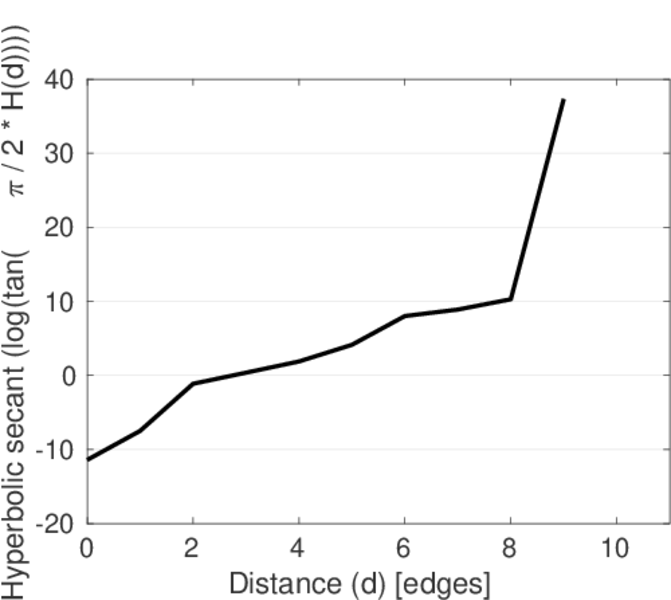
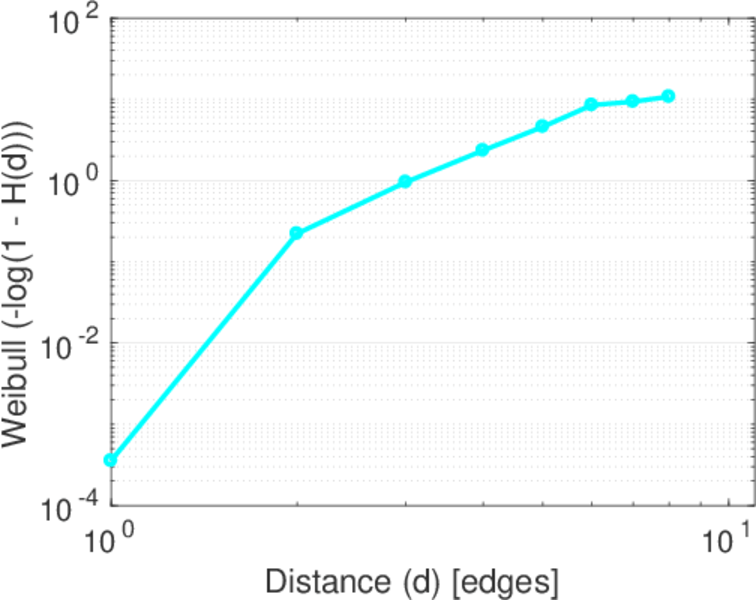
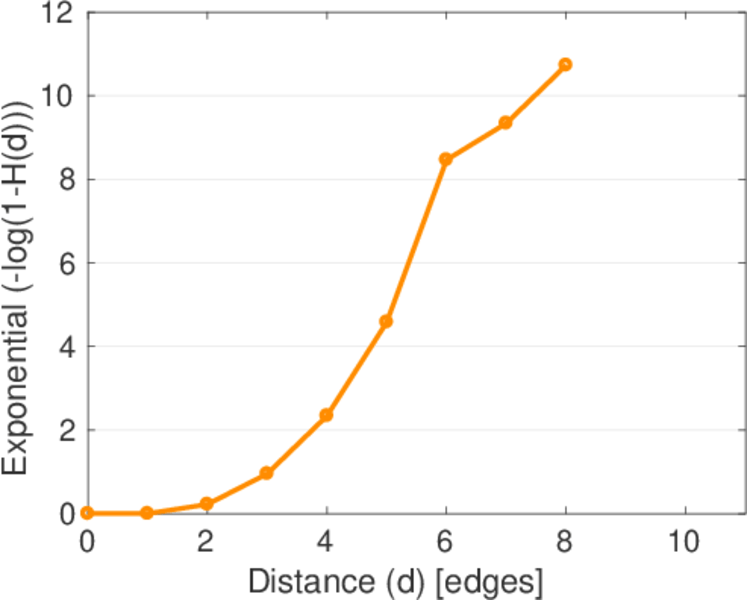
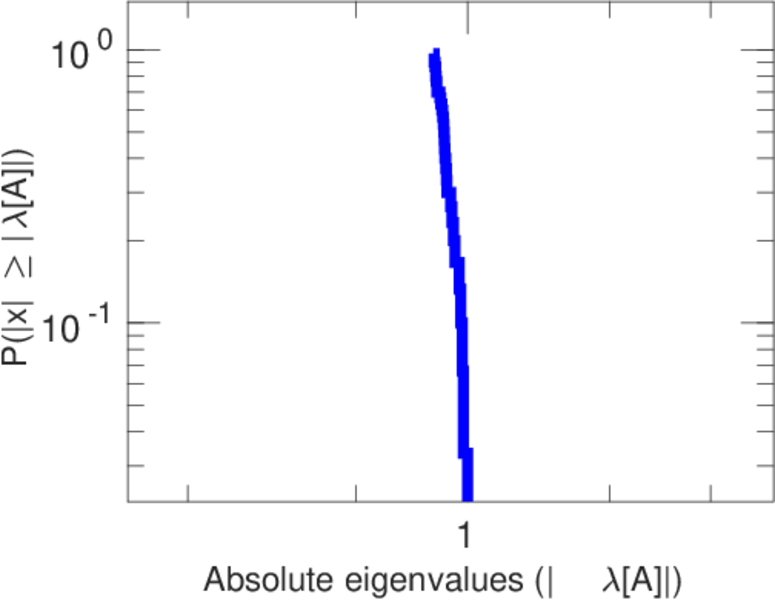
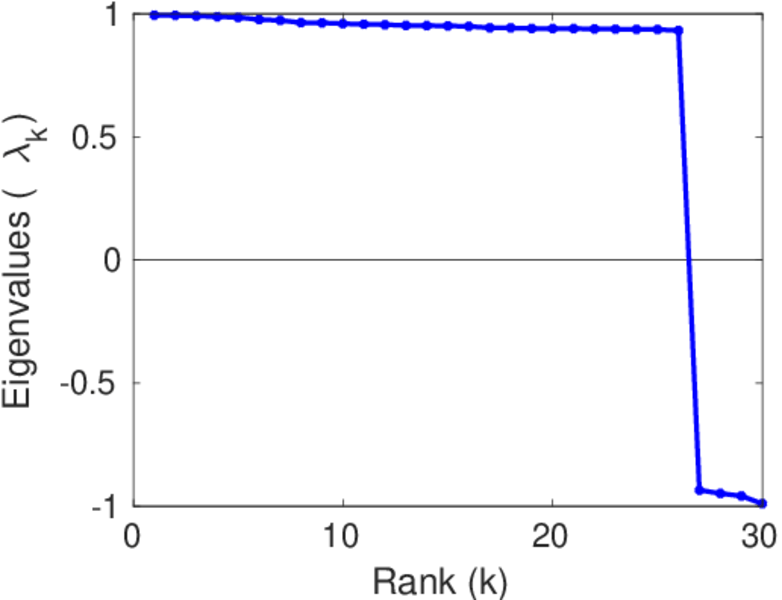
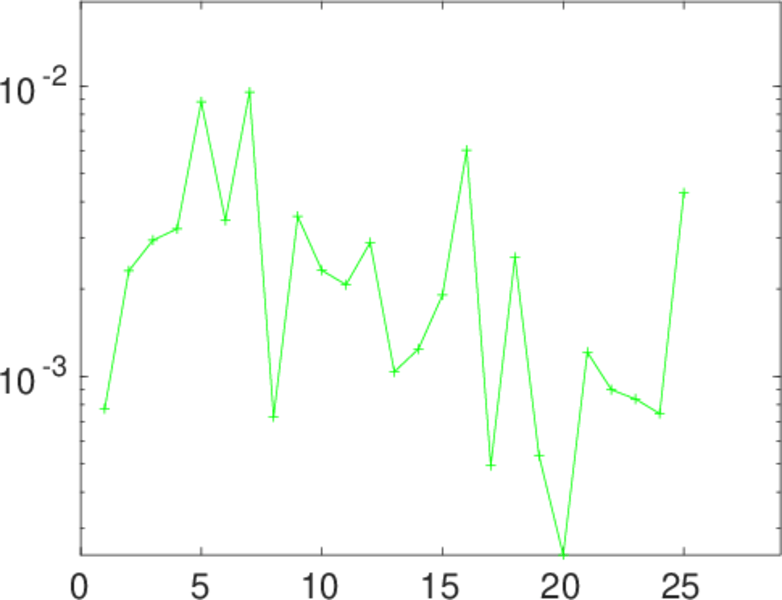
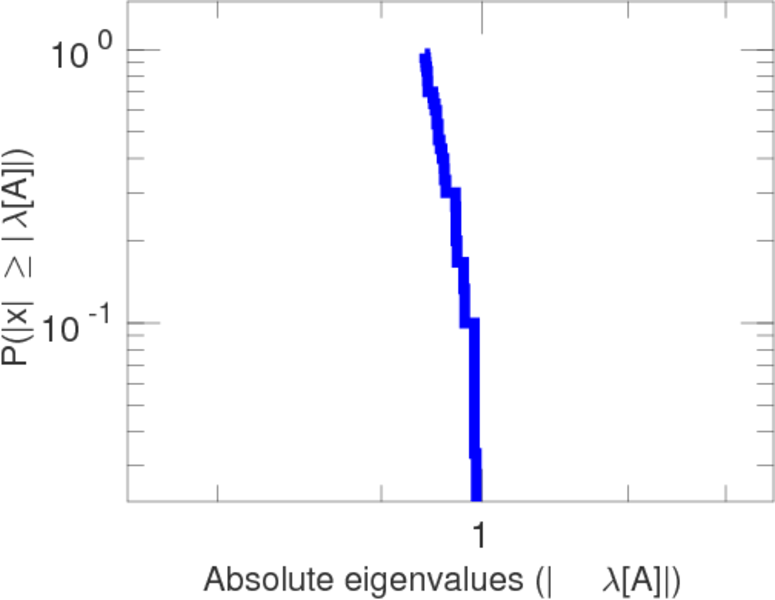
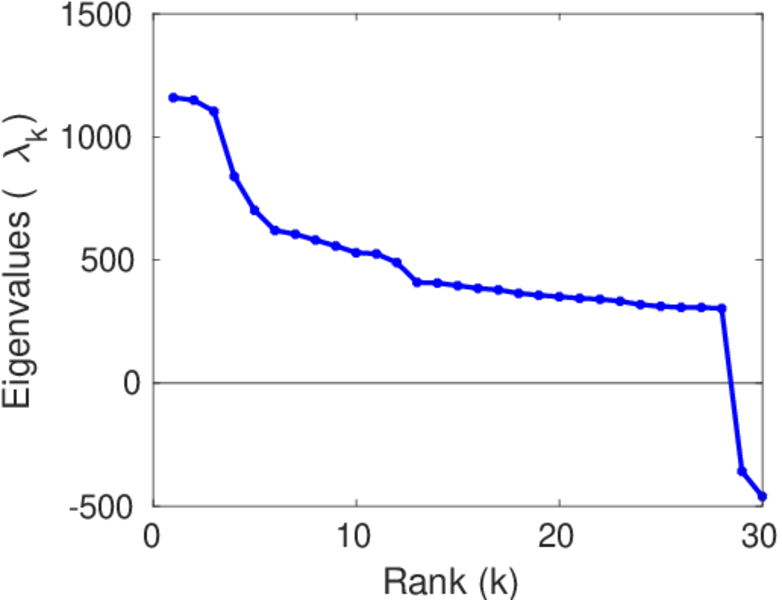
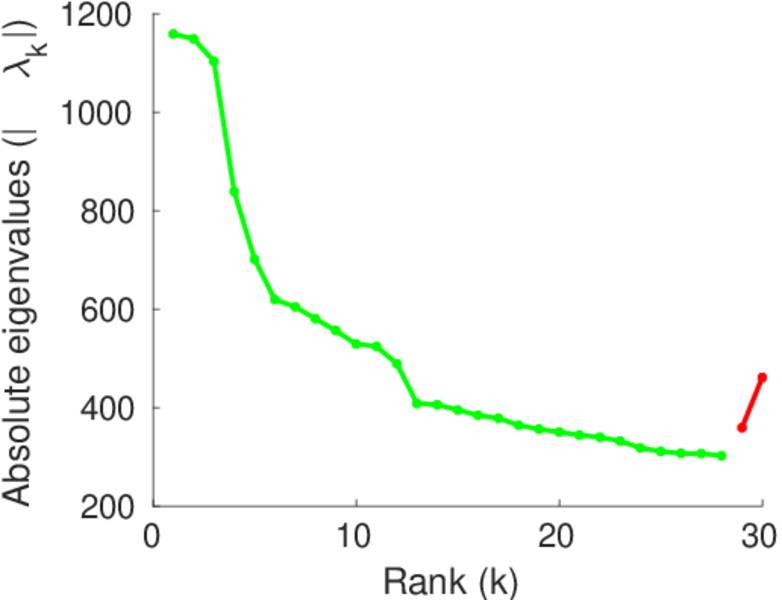
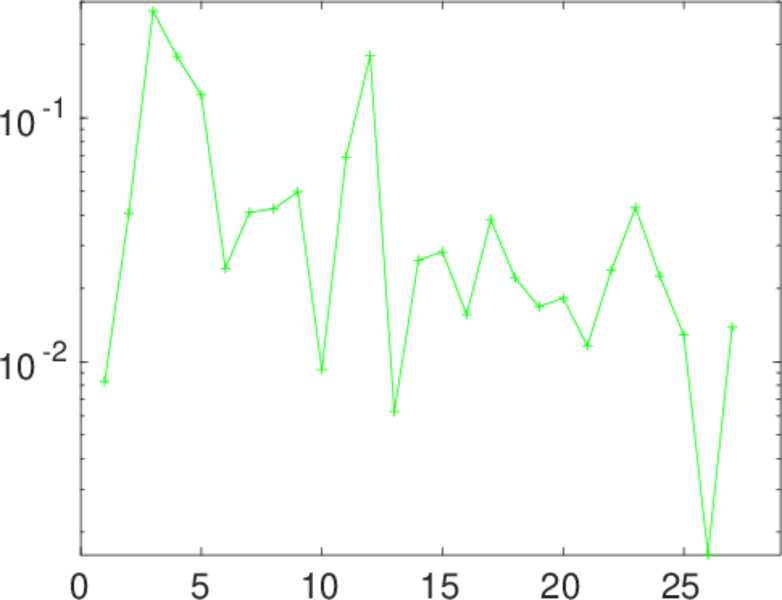
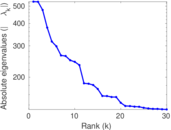
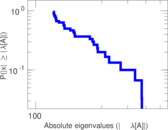
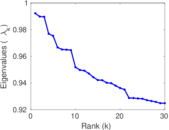
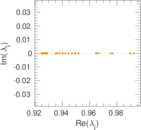
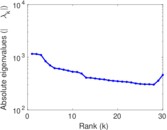
Plots


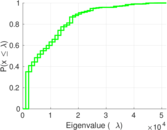


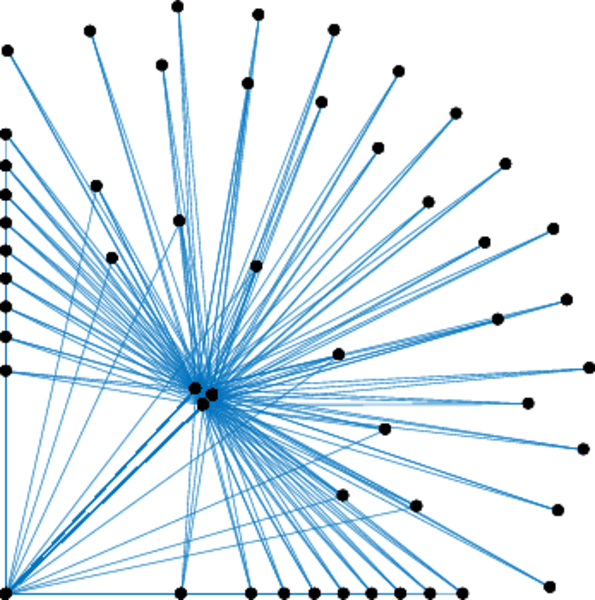
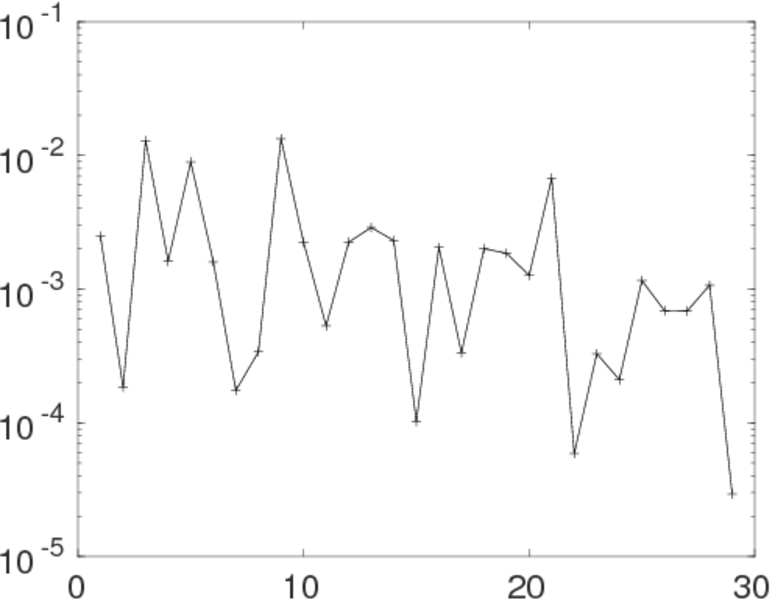
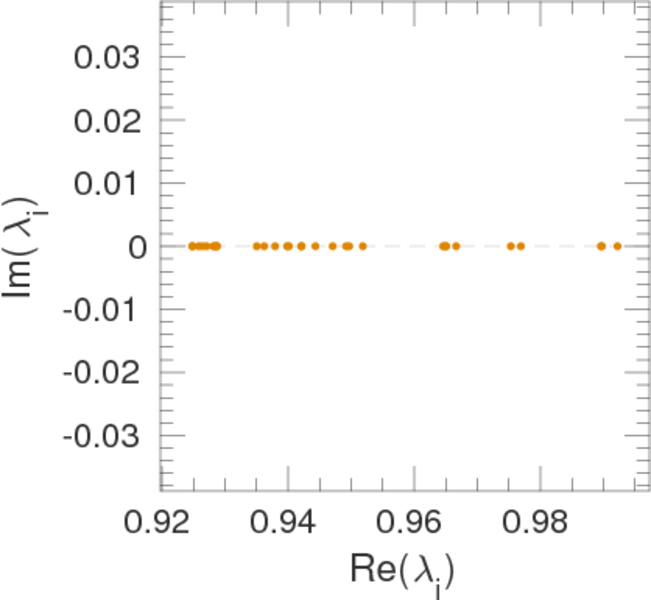
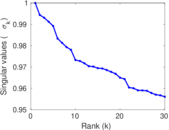
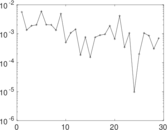
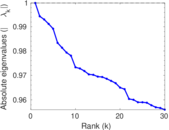
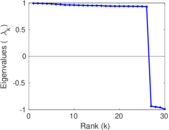
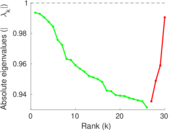
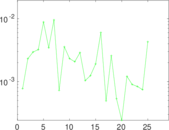
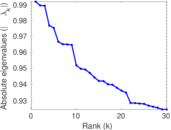
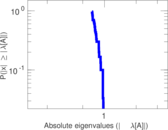
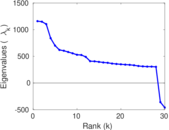
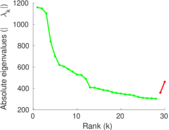
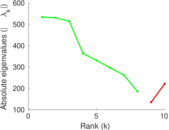
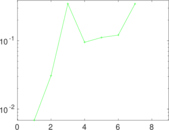
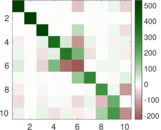
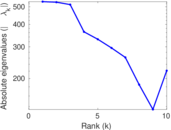
Matrix decompositions plots


Downloads
References
|
[1]
|
Jérôme Kunegis.
KONECT – The Koblenz Network Collection.
In Proc. Int. Conf. on World Wide Web Companion, pages
1343–1350, 2013.
[ http ]
|
 KONECT ‣ Networks ‣
Buy Me a Coffee
KONECT ‣ Networks ‣
Buy Me a Coffee