Wikipedia links (zh-yue)
This network consists of the wikilinks of the Wikipedia in the Cantonese
language (zh-yue). Nodes are Wikipedia articles, and directed edges are
wikilinks, i.e., hyperlinks within one wiki. In the wiki source, these are
indicated with [[double brackets]]. Only pages in the article namespace are
included.
Metadata
Statistics
| Size | n = | 110,749
|
| Volume | m = | 1,718,542
|
| Loop count | l = | 73
|
| Wedge count | s = | 418,856,065
|
| Claw count | z = | 565,973,244,092
|
| Triangle count | t = | 24,329,606
|
| Square count | q = | 3,393,448,057
|
| 4-Tour count | T4 = | 26,920,010,832
|
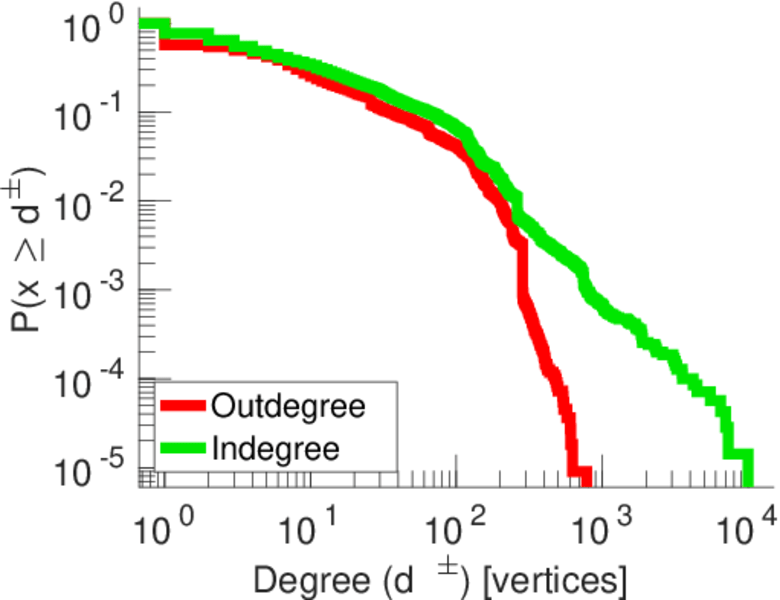
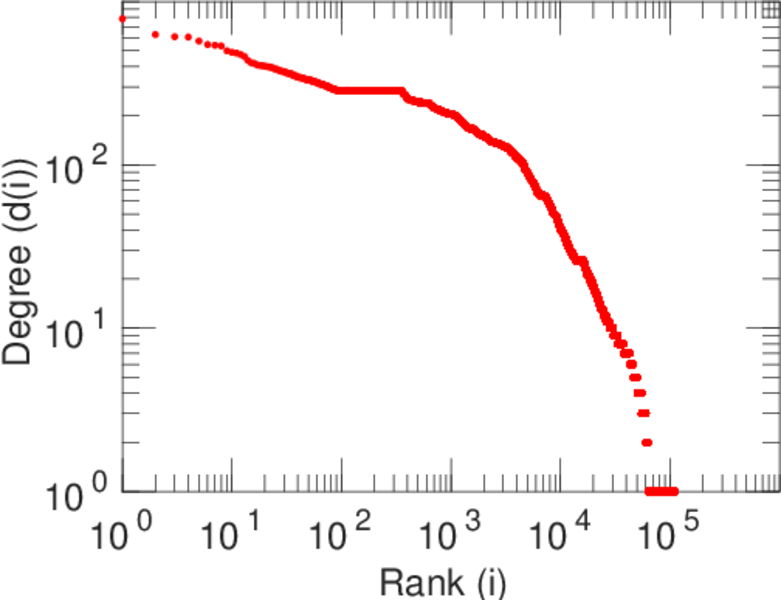
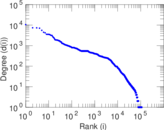
| Maximum degree | dmax = | 10,564
|
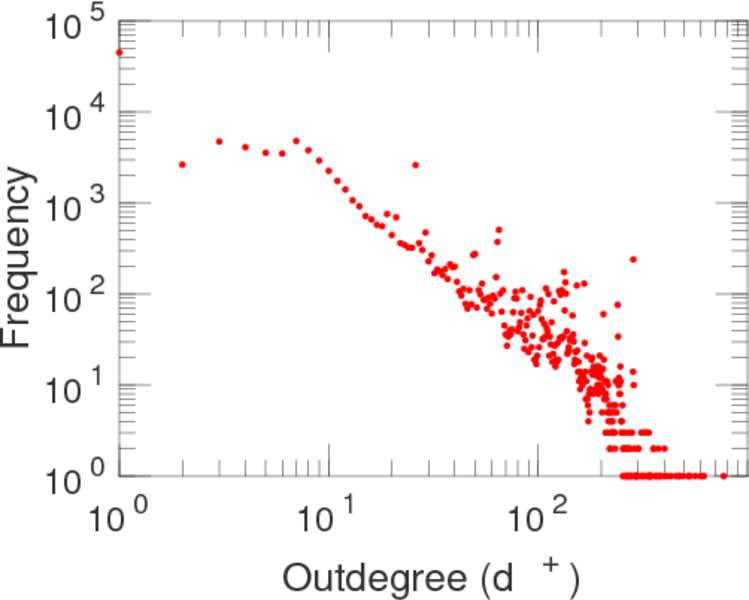
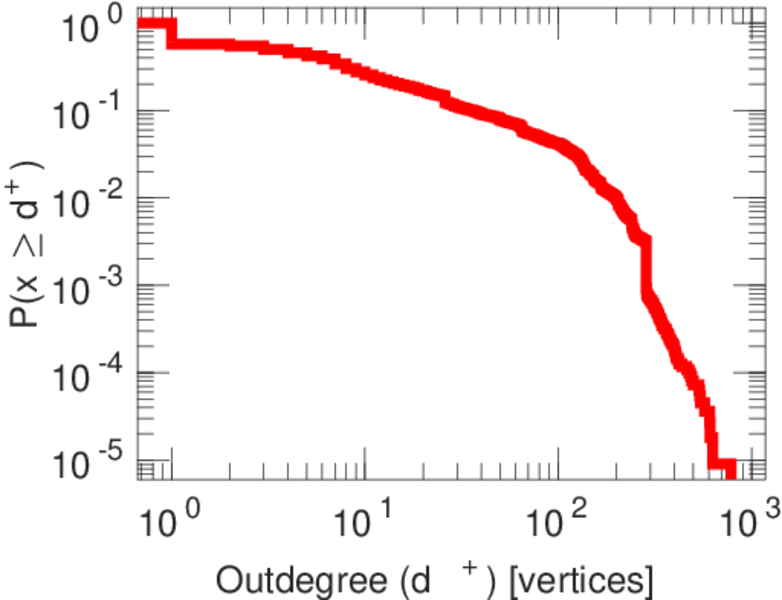
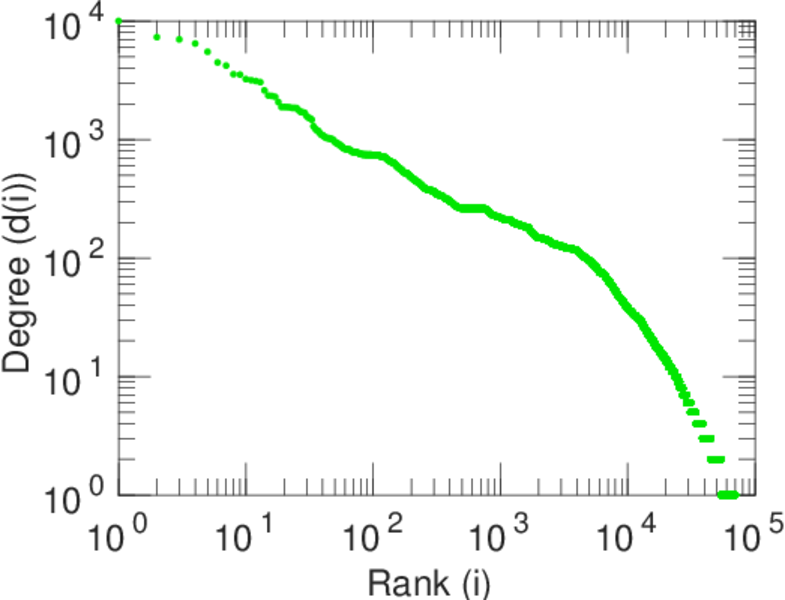
| Maximum outdegree | d+max = | 784
|
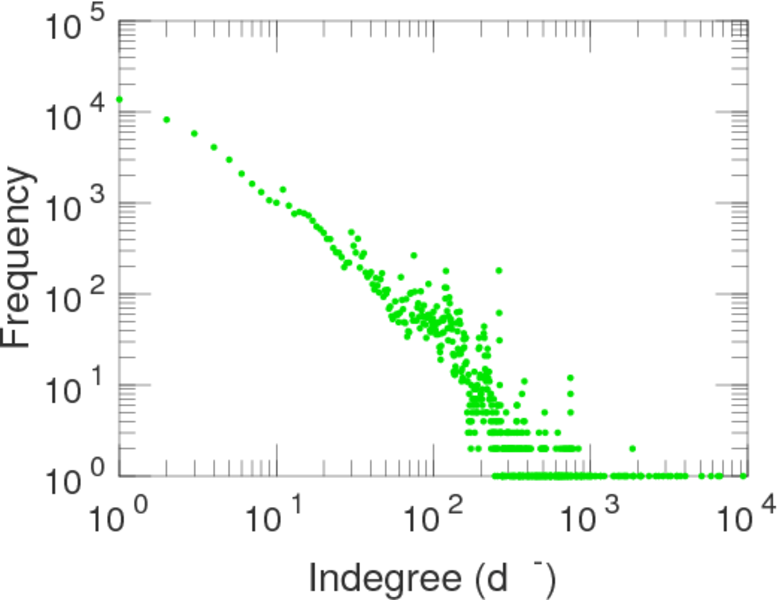
| Maximum indegree | d−max = | 10,024
|
| Average degree | d = | 31.034 9
|
| Size of LCC | N = | 110,614
|
| Size of LSCC | Ns = | 64,339
|
| Relative size of LSCC | Nrs = | 0.580 944
|
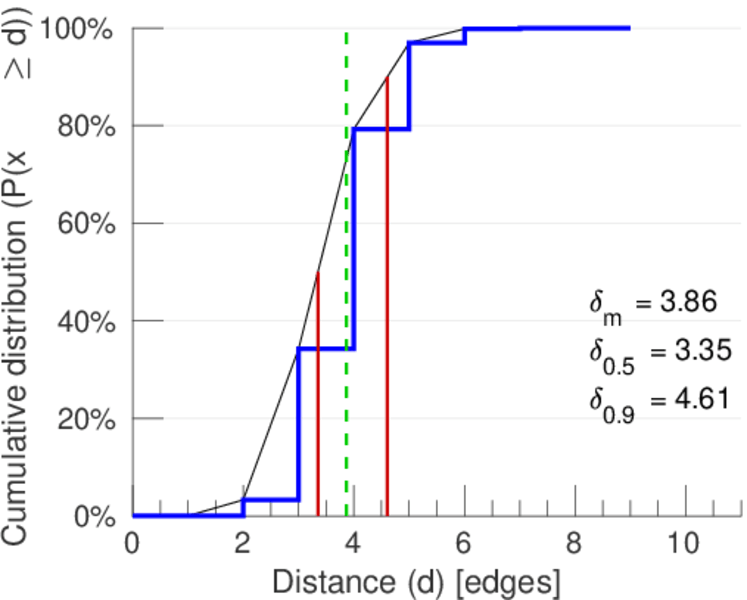
| Diameter | δ = | 10
|
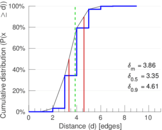
| 50-Percentile effective diameter | δ0.5 = | 3.350 28
|
| 90-Percentile effective diameter | δ0.9 = | 4.606 52
|
| Median distance | δM = | 4
|
| Mean distance | δm = | 3.864 43
|
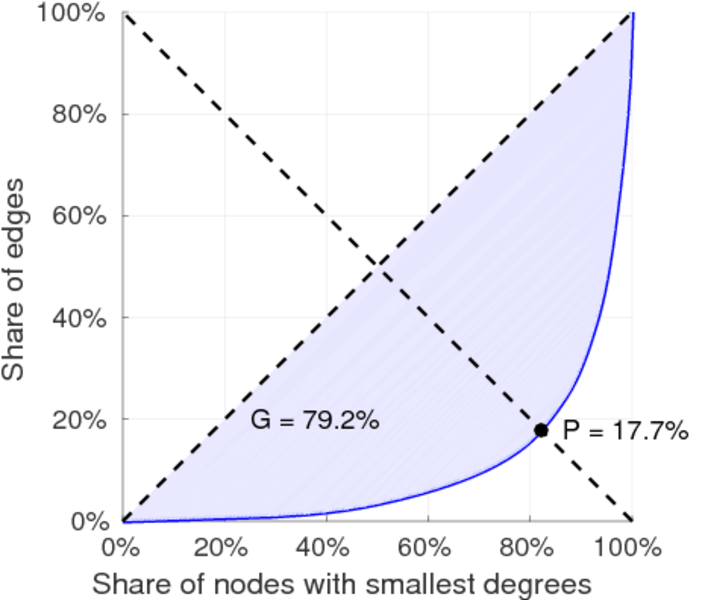
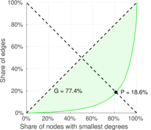
| Gini coefficient | G = | 0.791 840
|
| Balanced inequality ratio | P = | 0.177 373
|
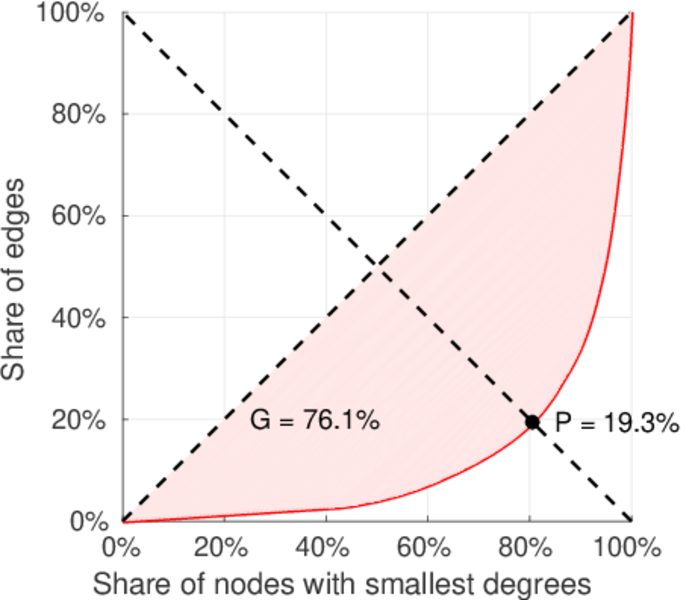
| Outdegree balanced inequality ratio | P+ = | 0.193 059
|
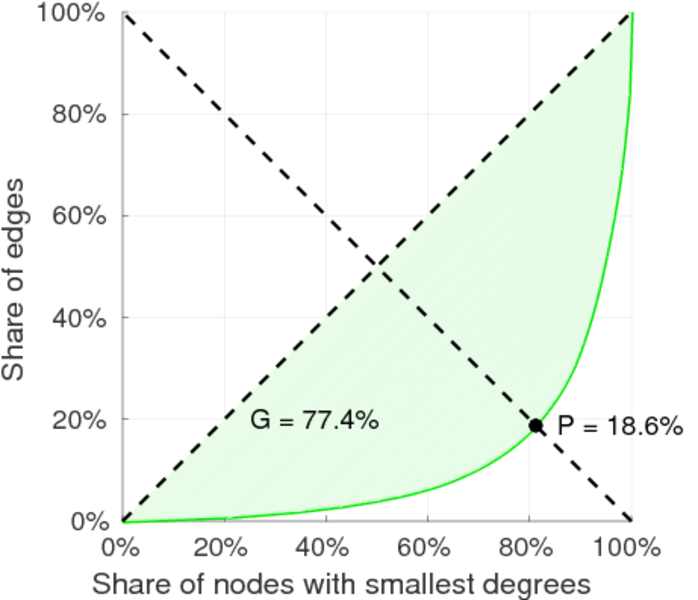
| Indegree balanced inequality ratio | P− = | 0.181 773
|
| Relative edge distribution entropy | Her = | 0.877 591
|
| Tail power law exponent | γt = | 1.761 00
|
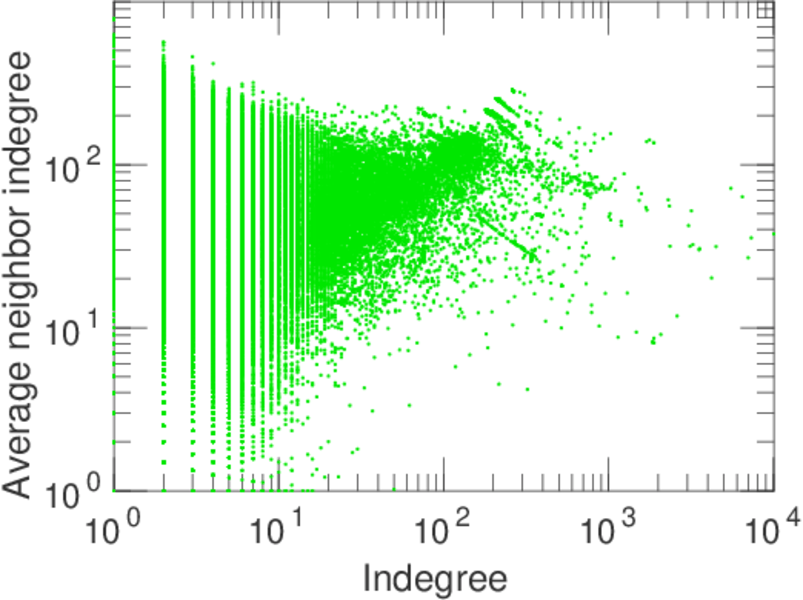
| Degree assortativity | ρ = | −0.063 867 7
|
| Degree assortativity p-value | pρ = | 0.000 00
|
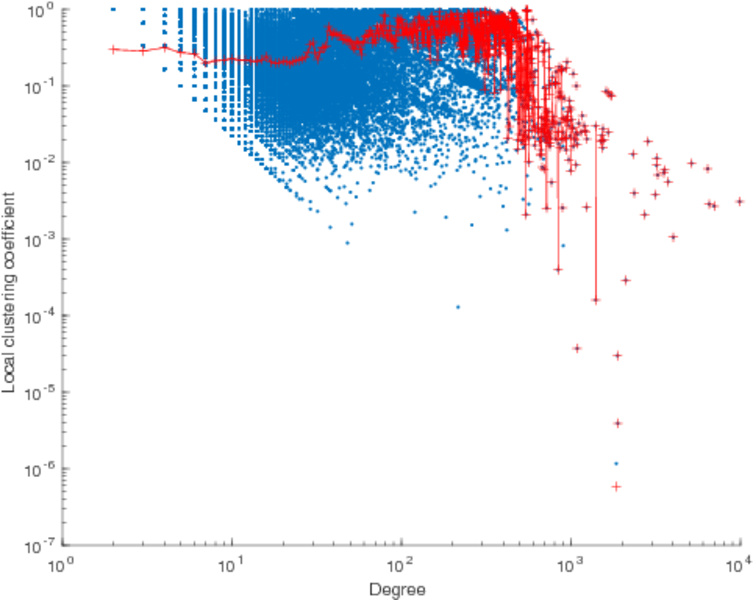
| Clustering coefficient | c = | 0.174 258
|
| Directed clustering coefficient | c± = | 0.598 667
|
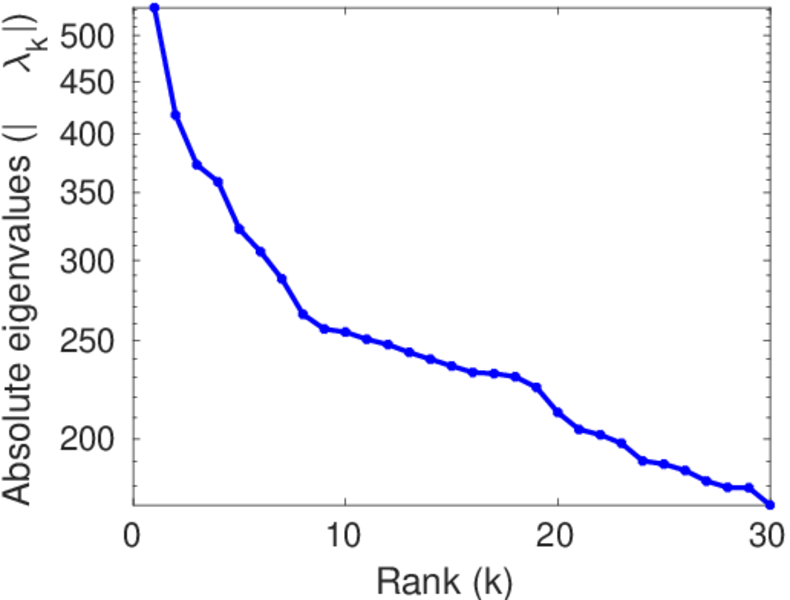
| Spectral norm | α = | 532.345
|
| Operator 2-norm | ν = | 272.265
|
| Cyclic eigenvalue | π = | 260.084
|
| Non-bipartivity | bA = | 0.766 130
|
| Normalized non-bipartivity | bN = | 0.036 670 9
|
| Spectral bipartite frustration | bK = | 0.000 732 701
|
| Controllability | C = | 51,536
|
| Relative controllability | Cr = | 0.465 341
|
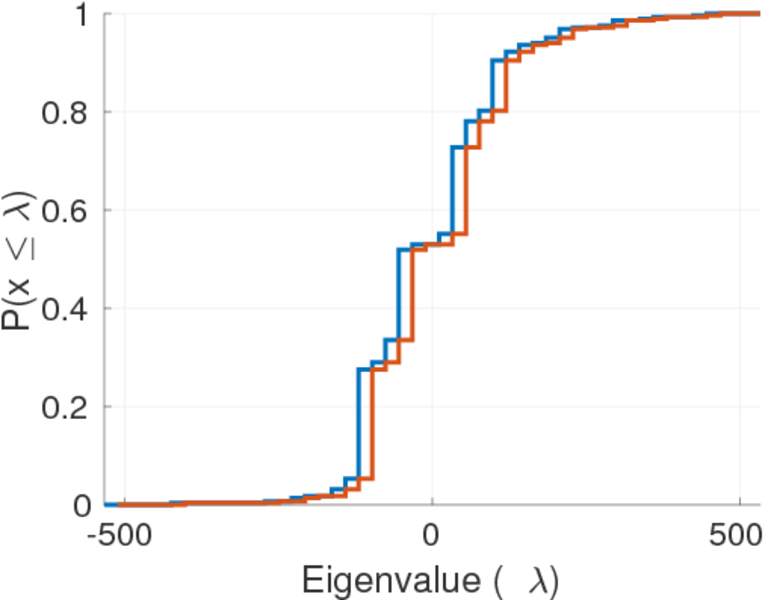
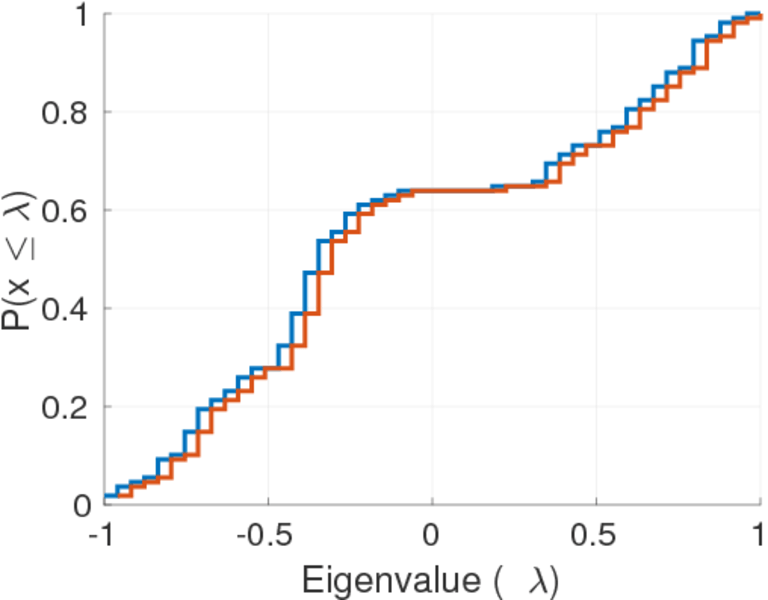
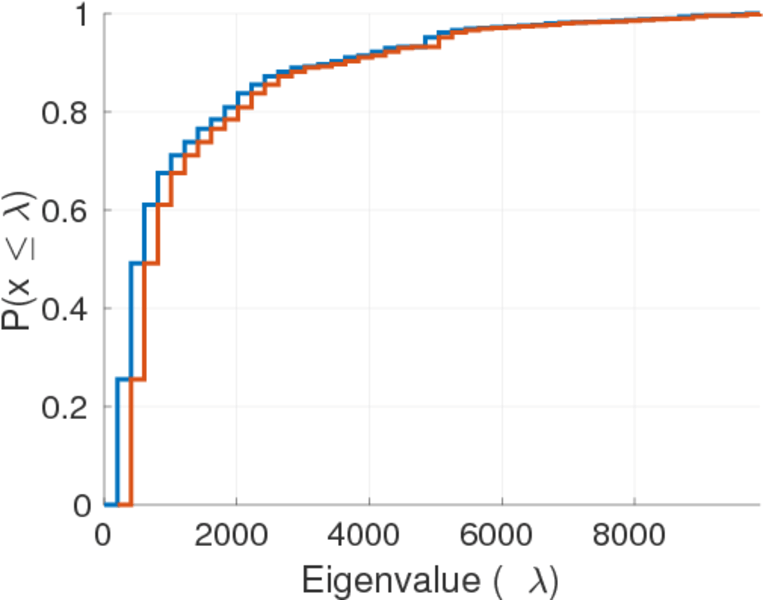
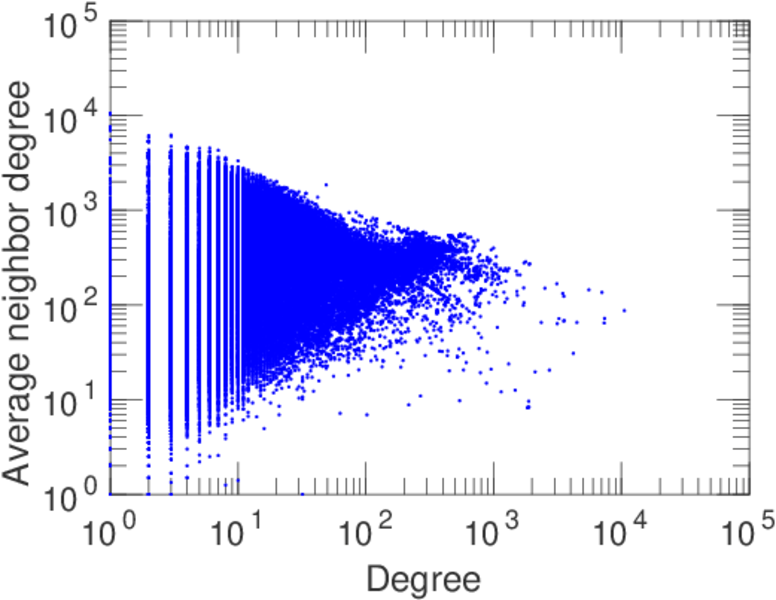
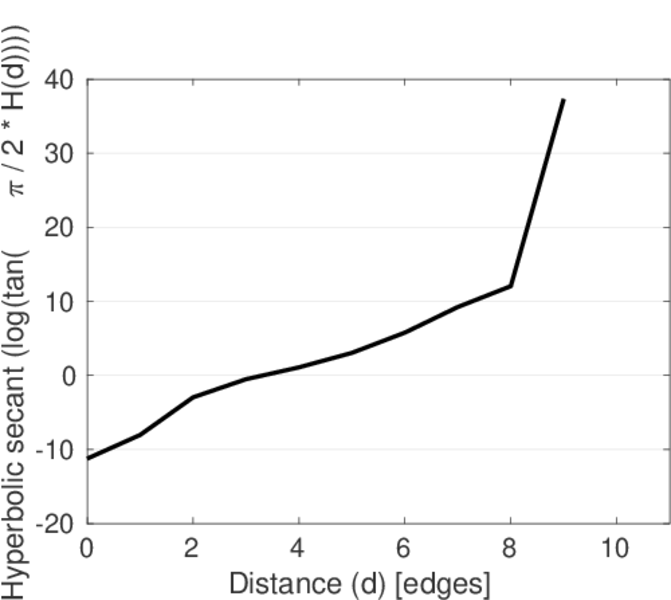
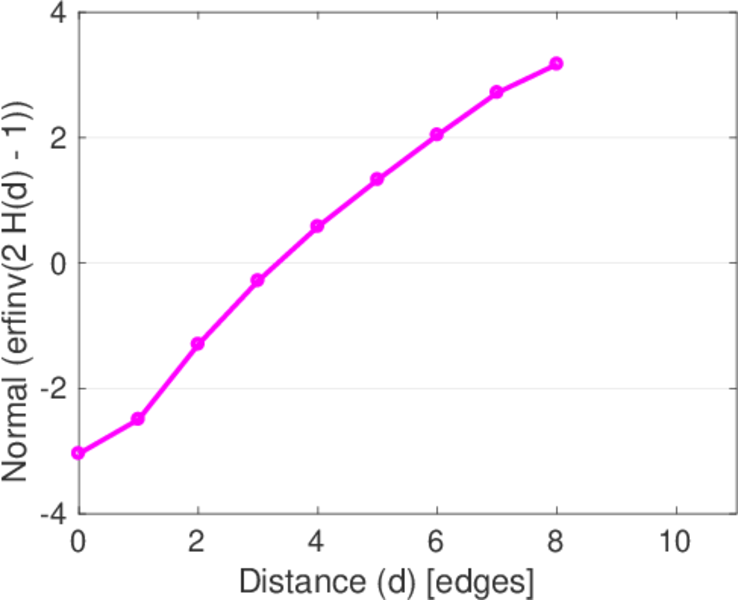
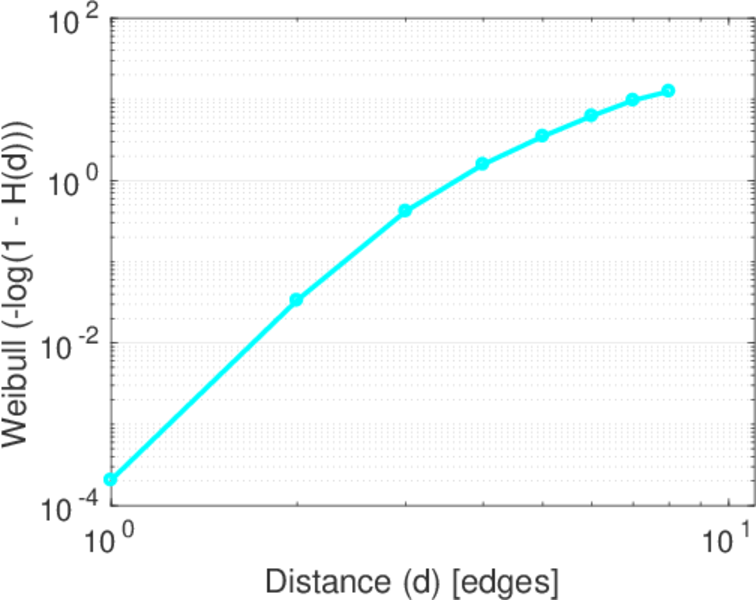
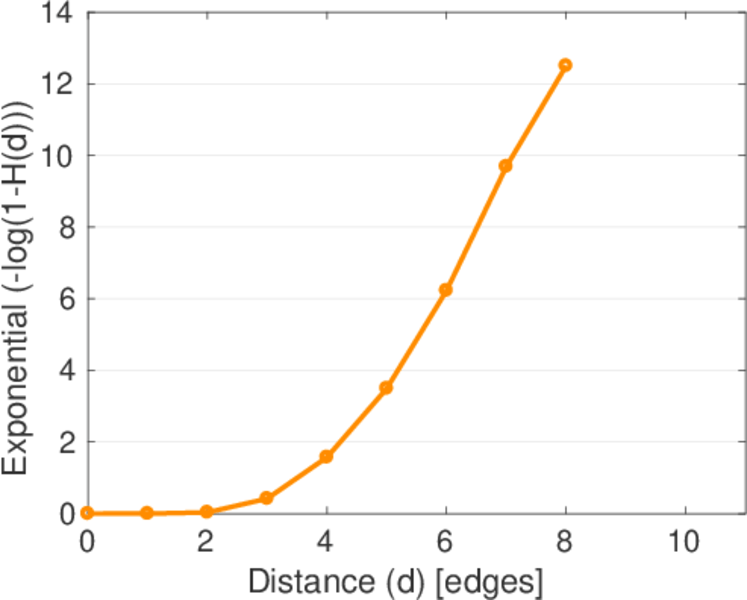
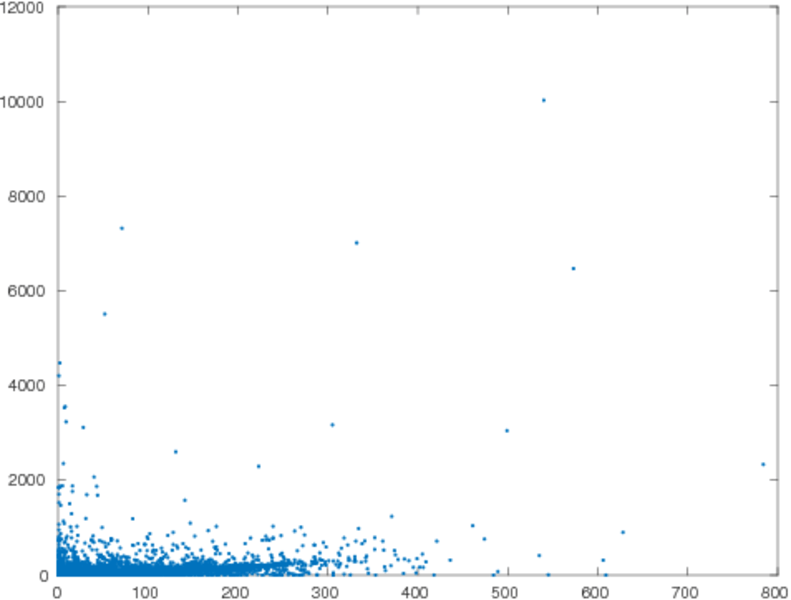
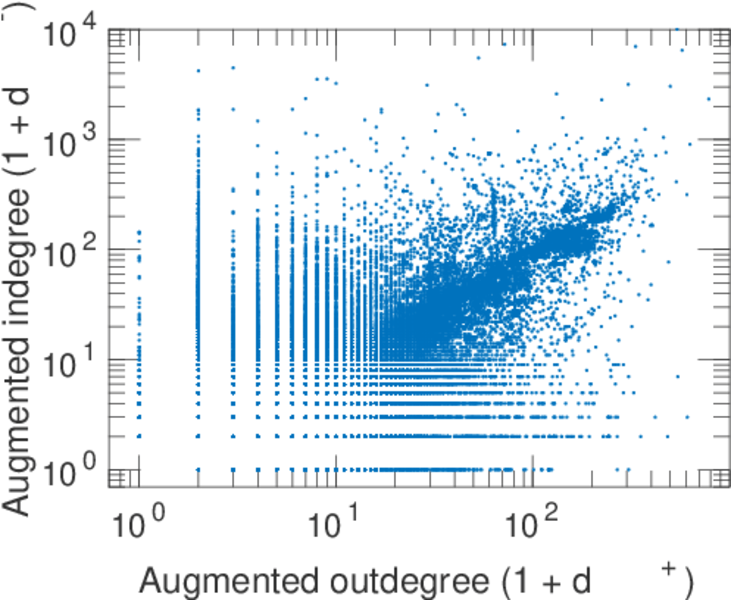
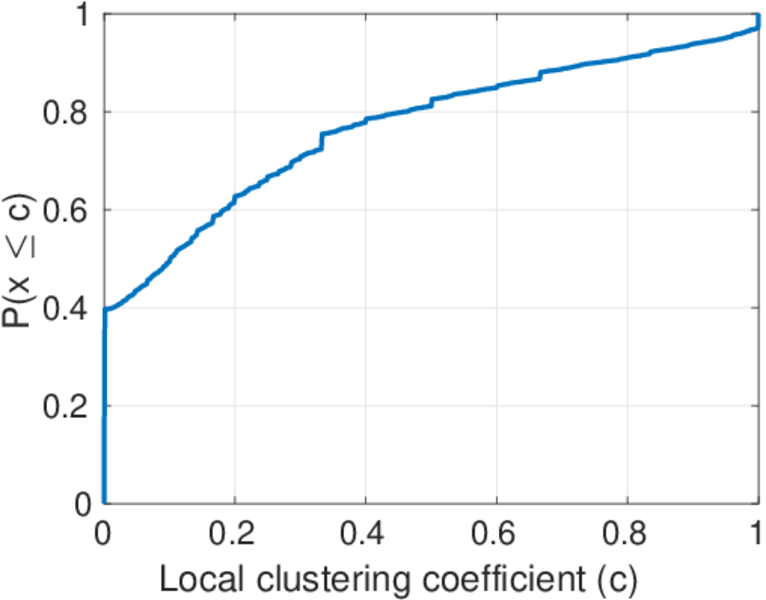
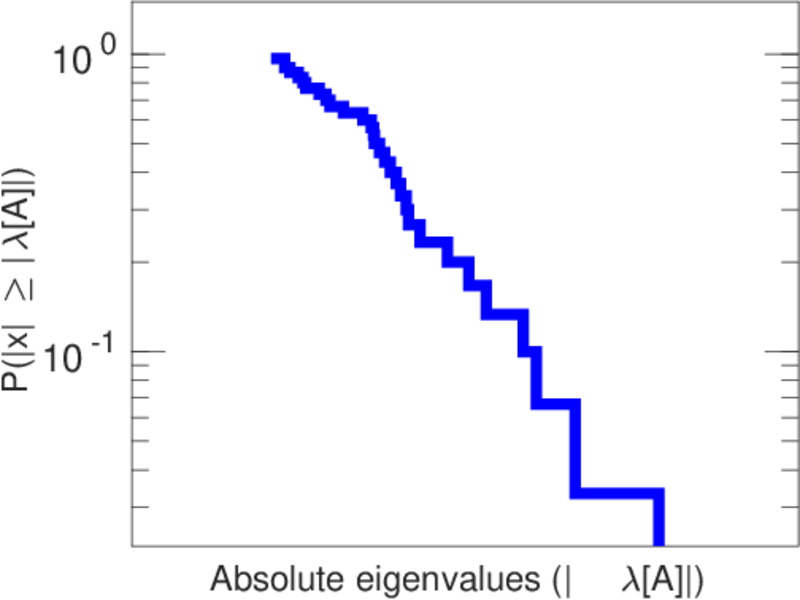
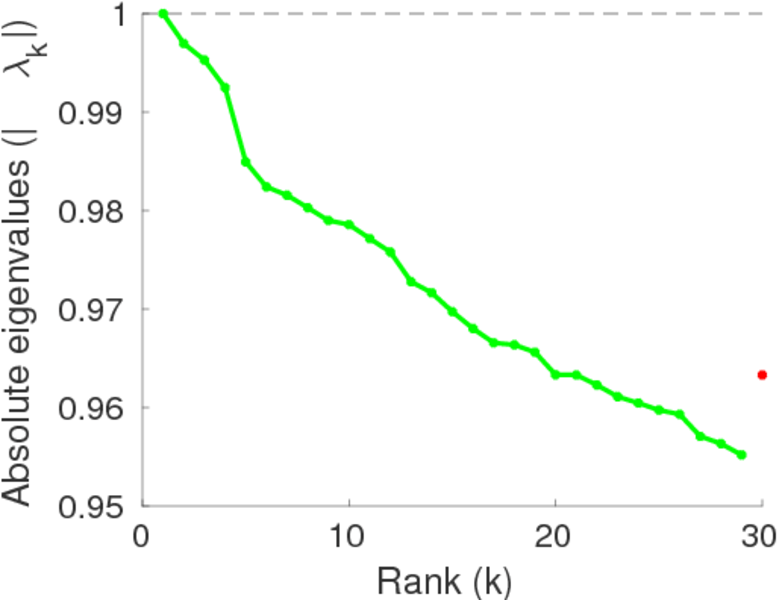
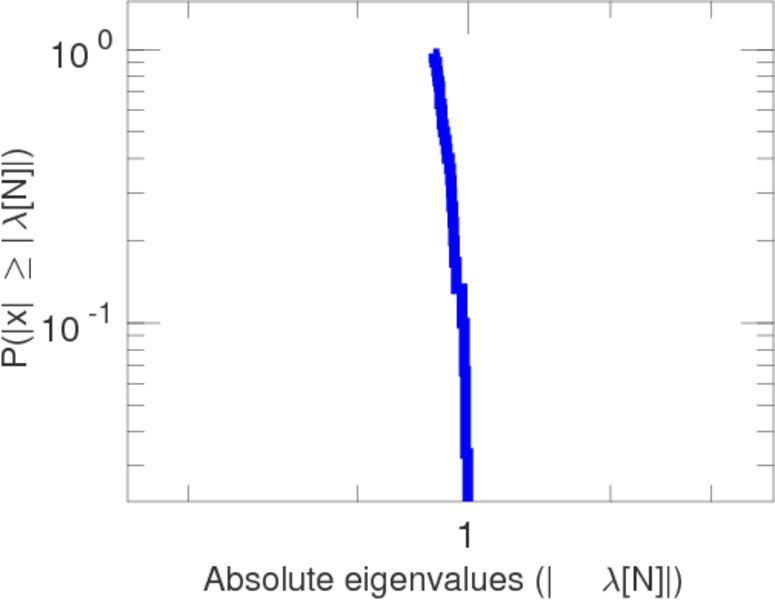
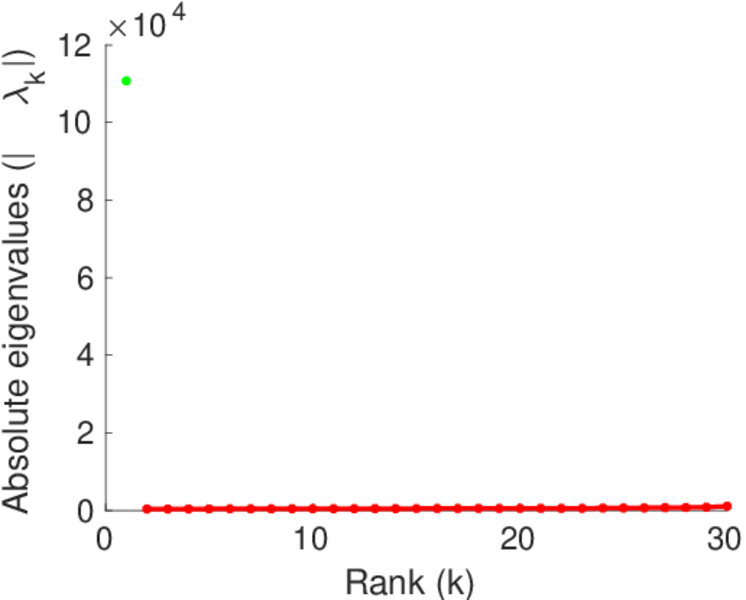
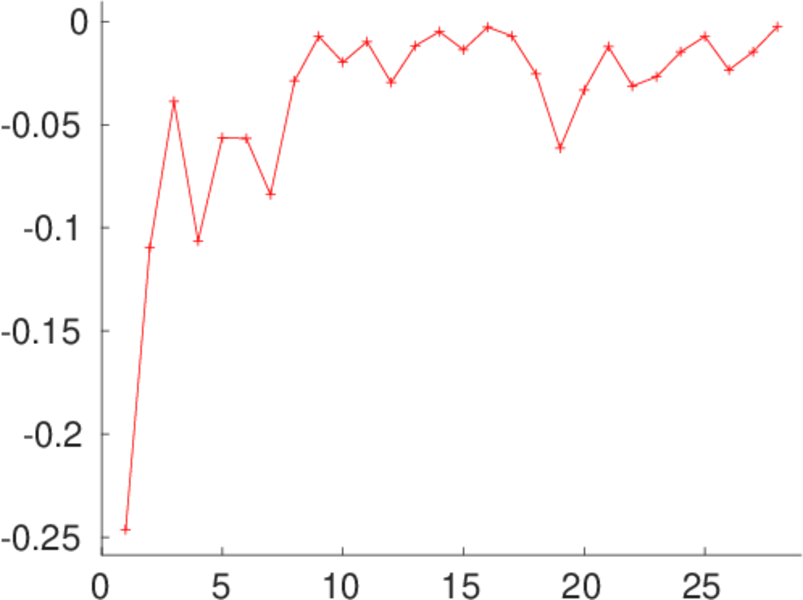
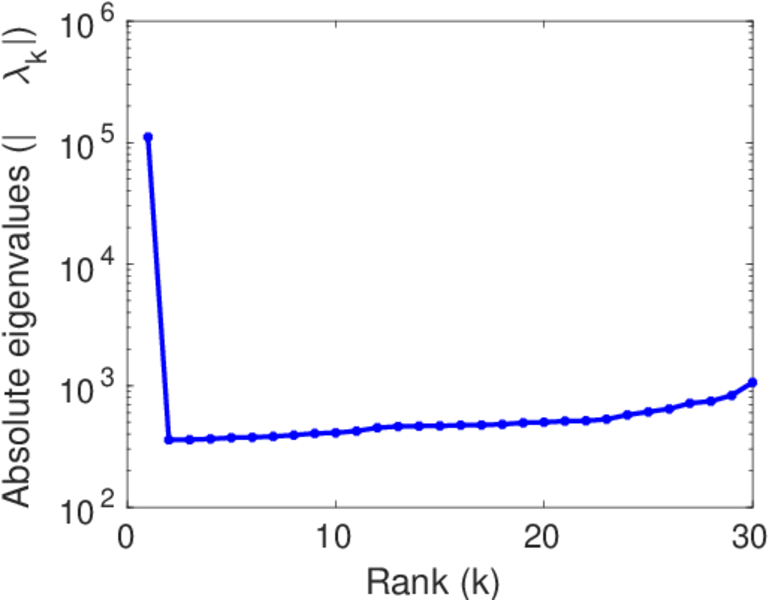
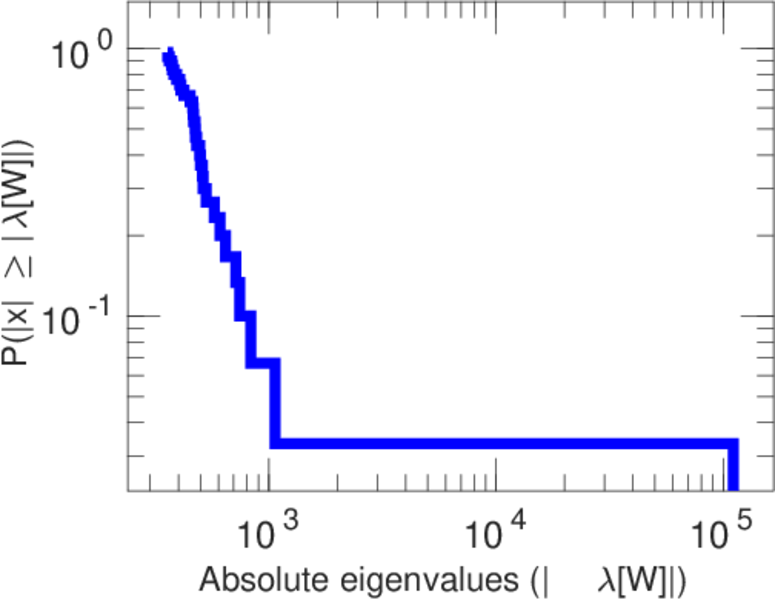
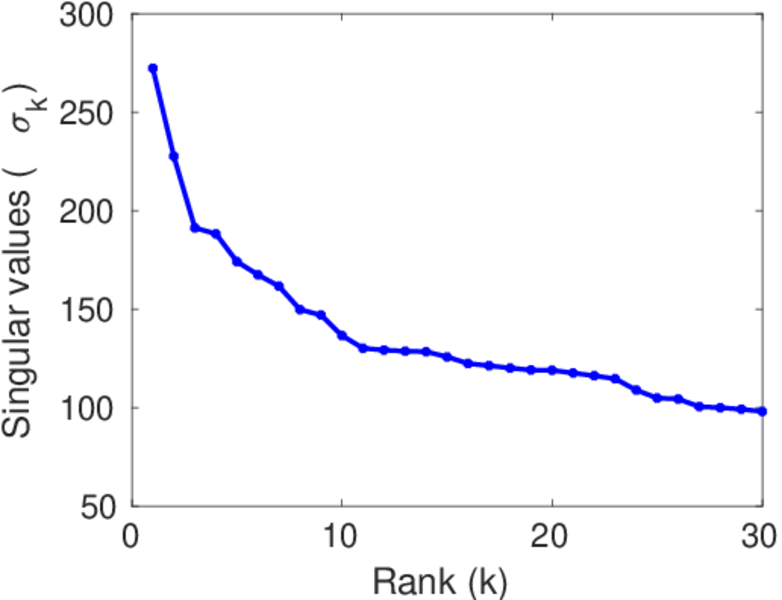
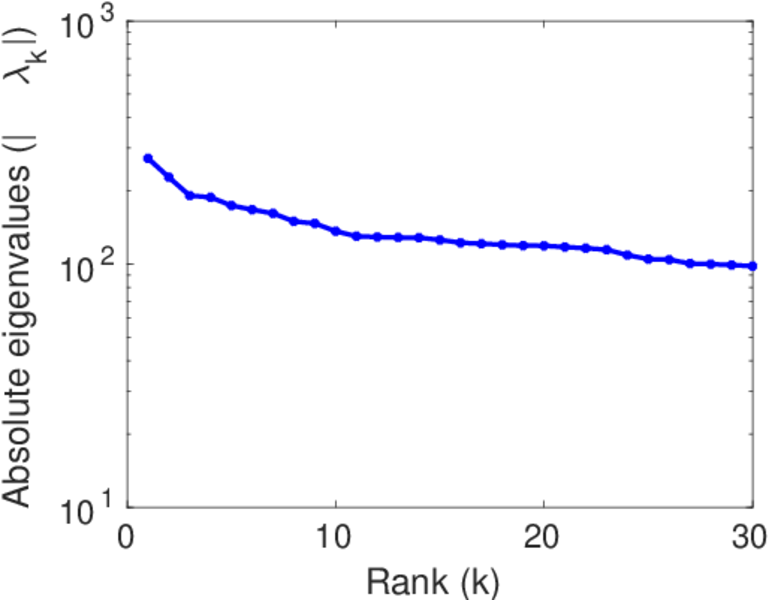
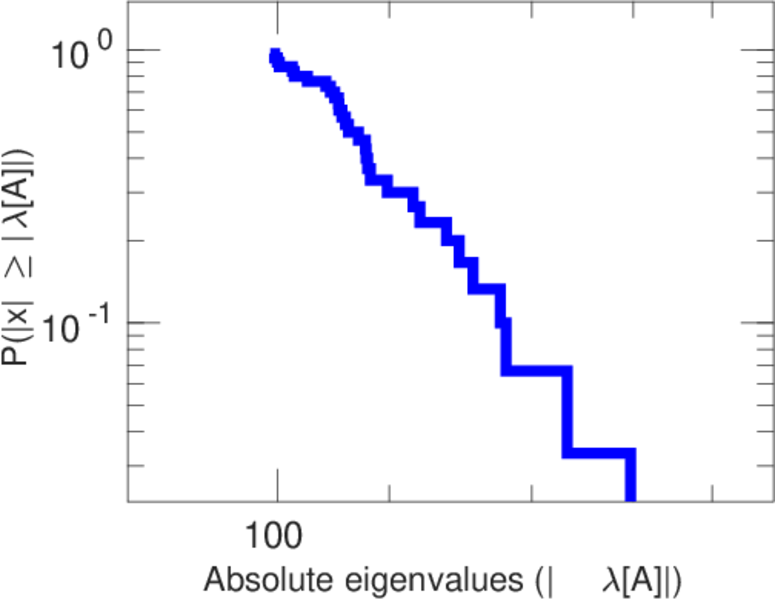
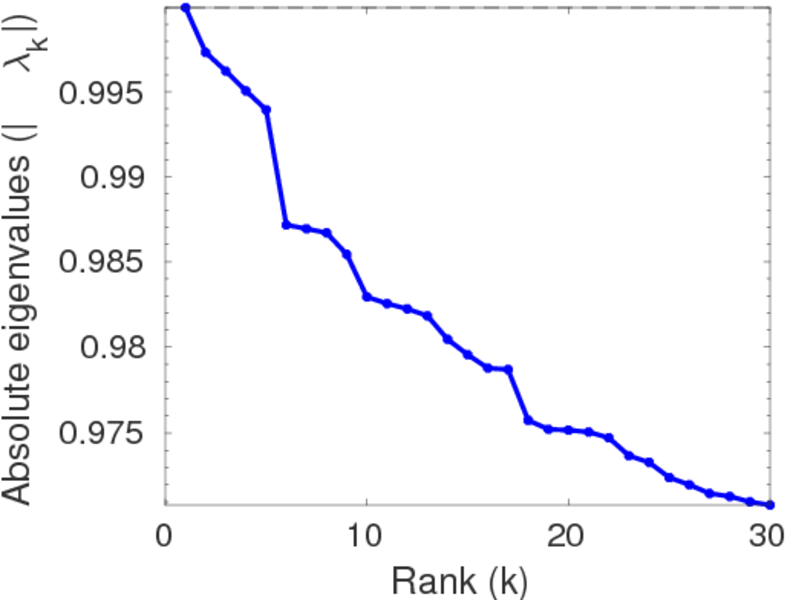
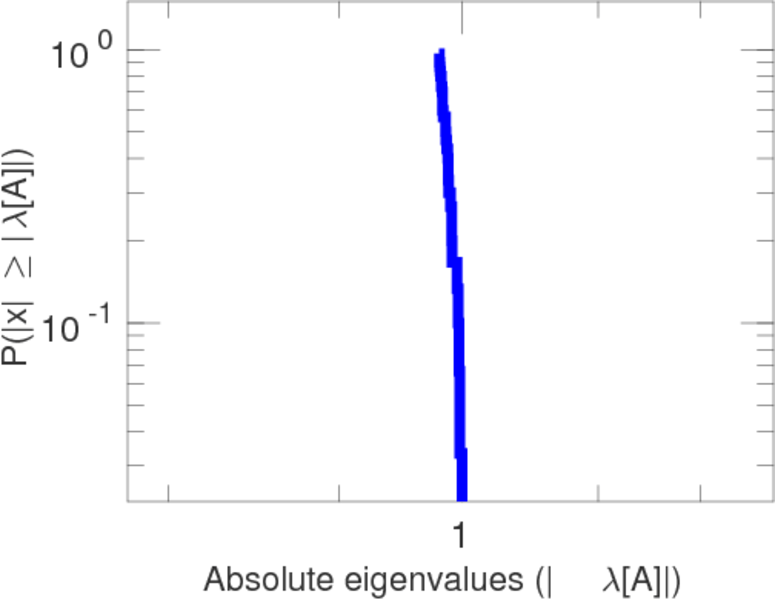
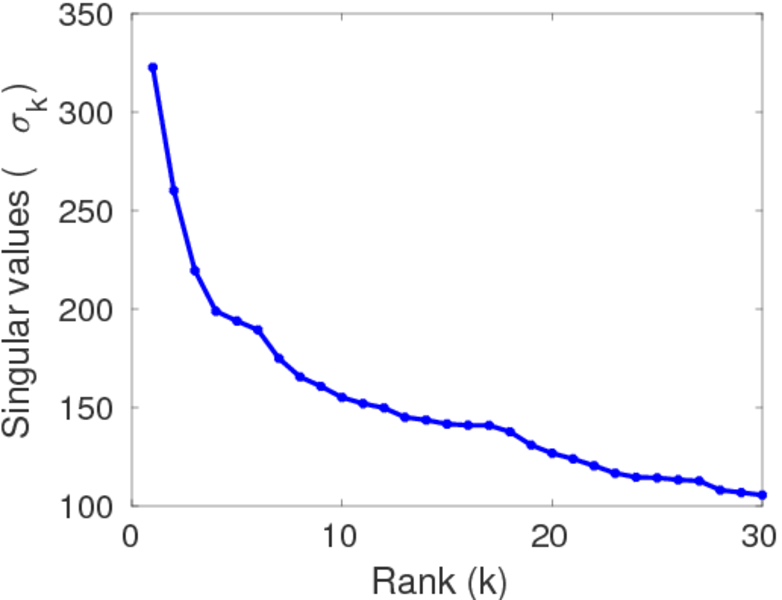
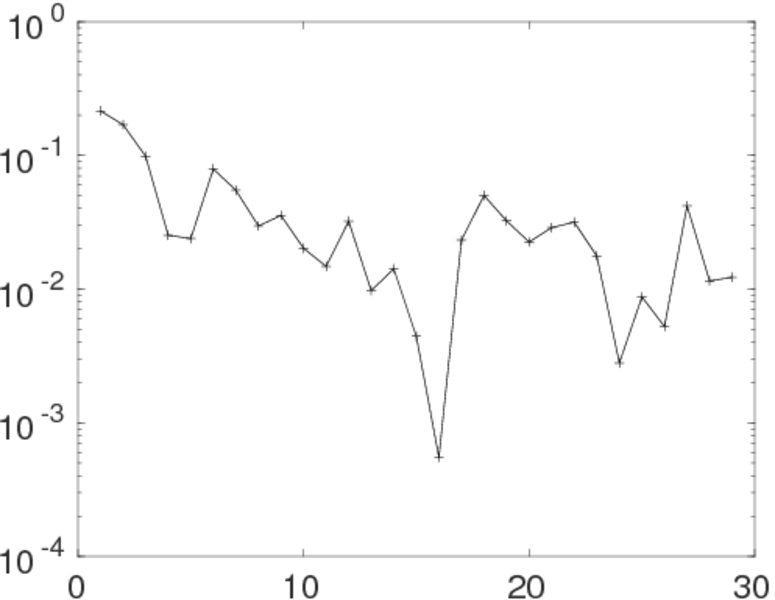
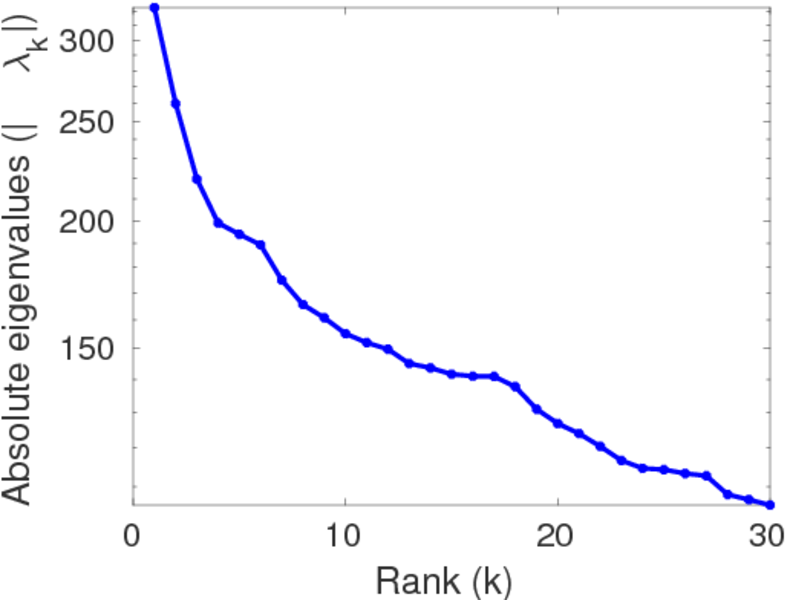
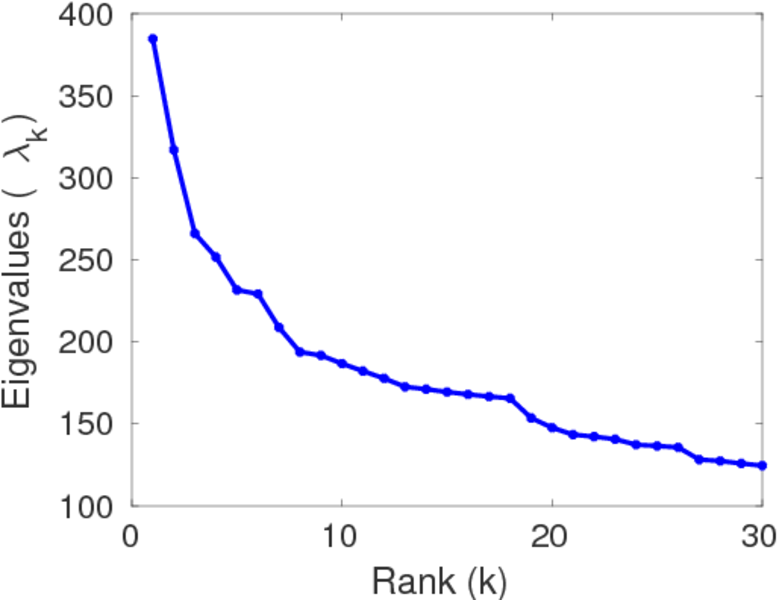
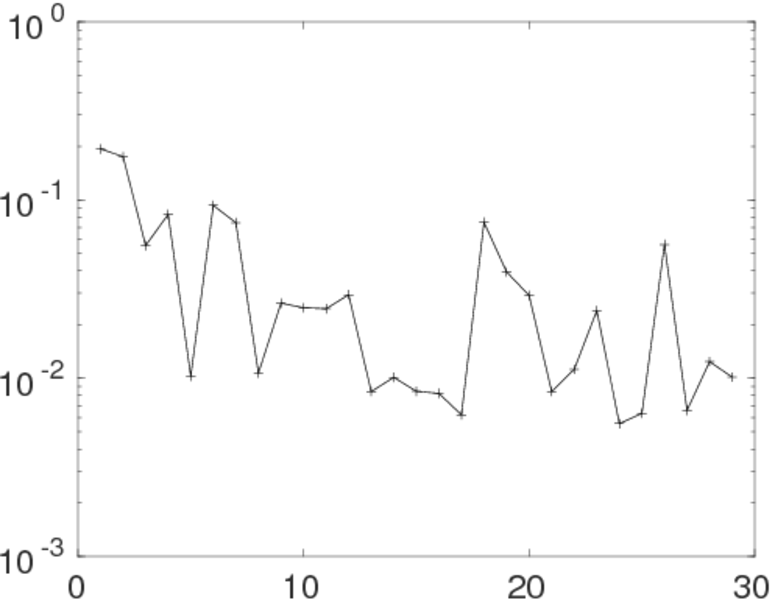
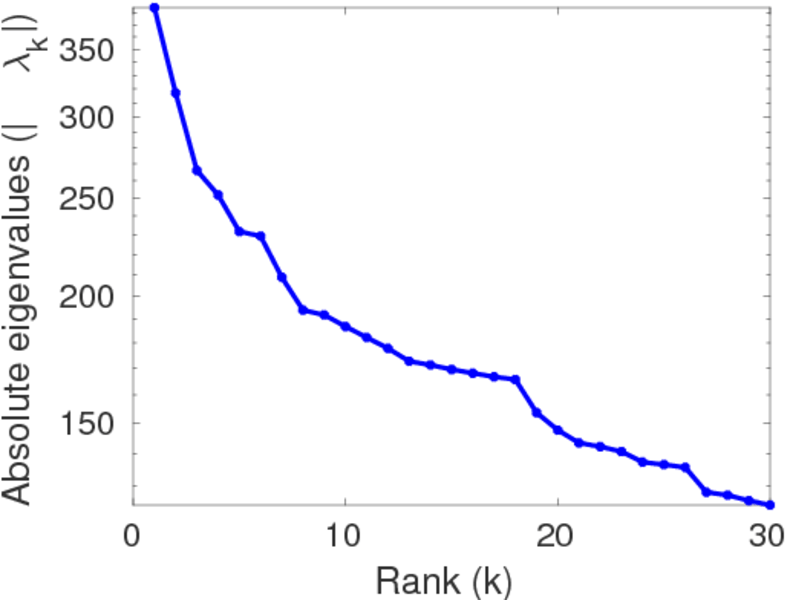
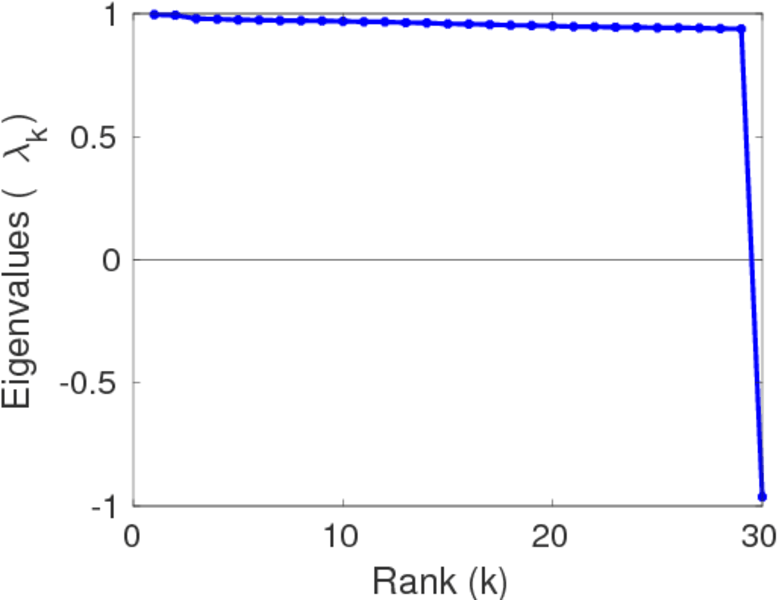
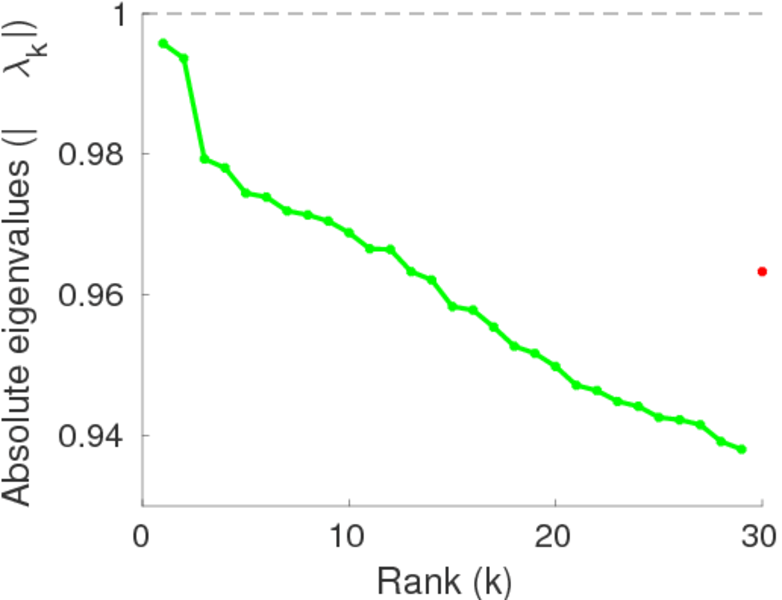
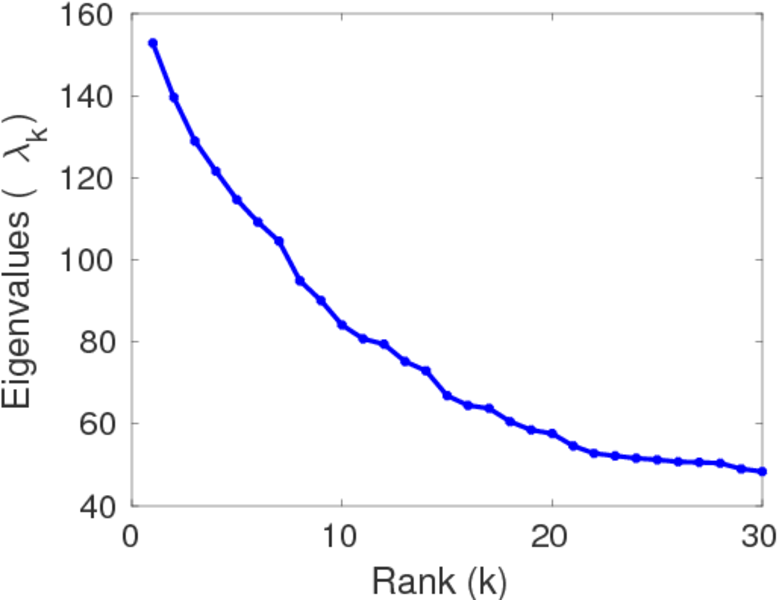
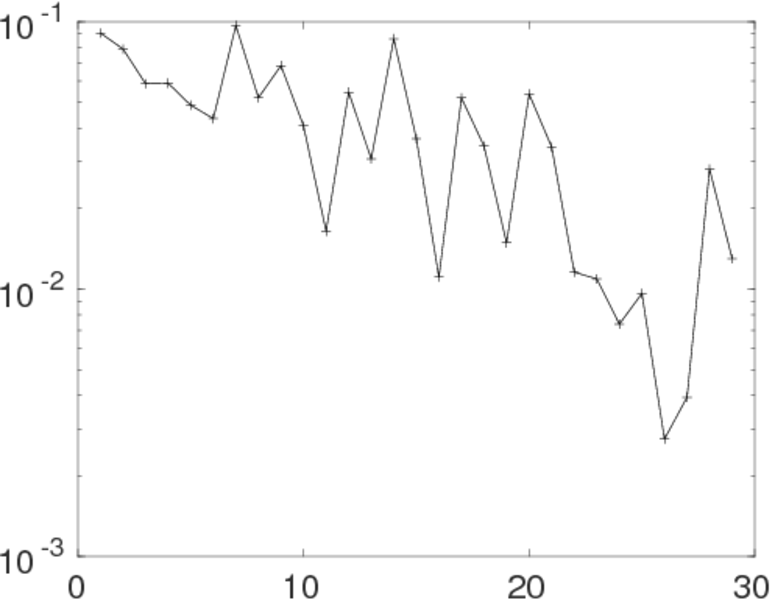
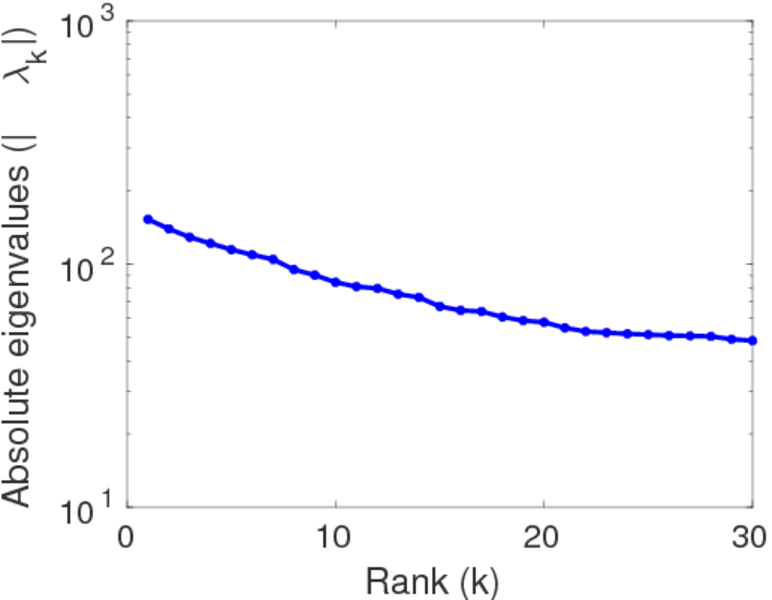
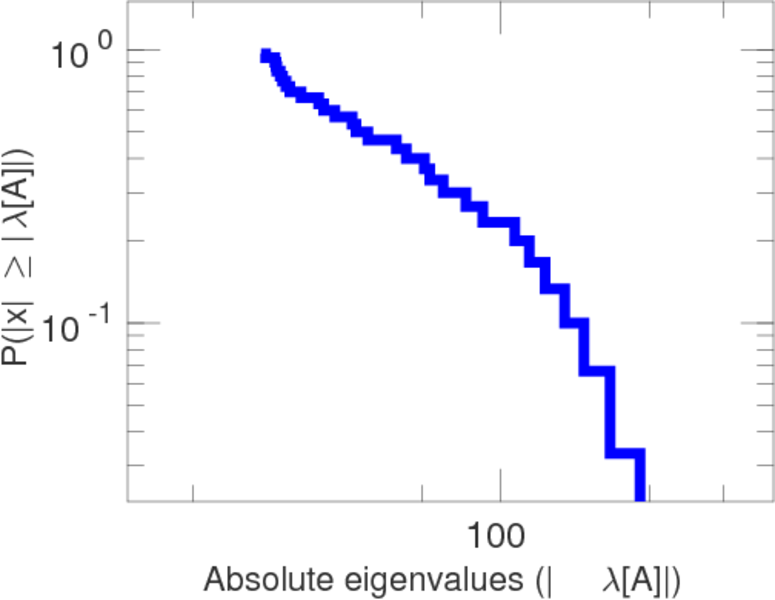
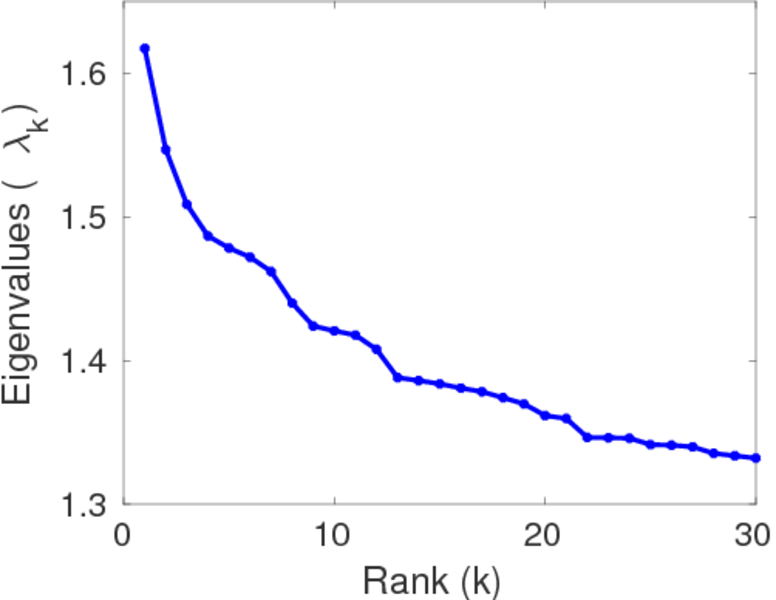
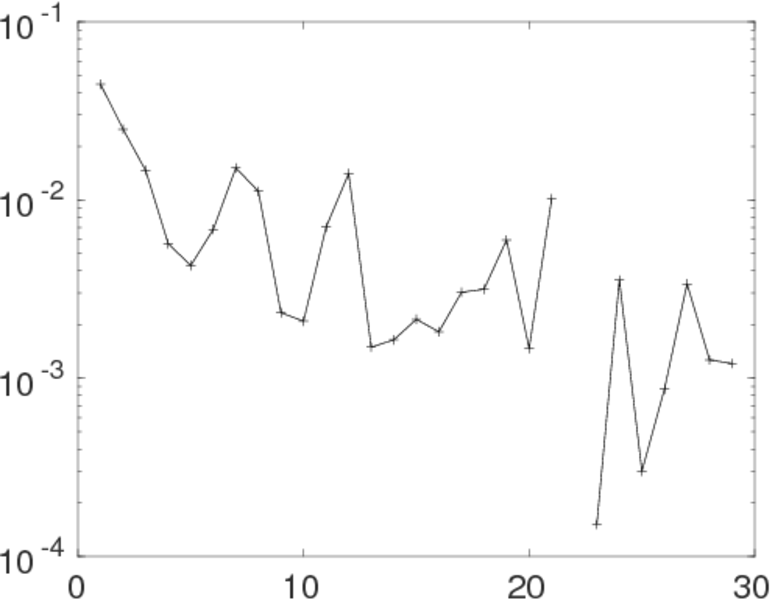
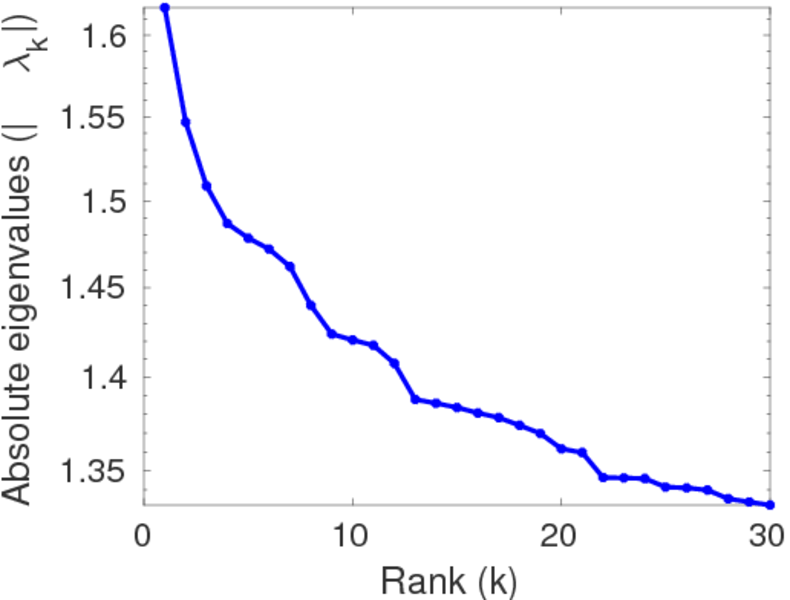
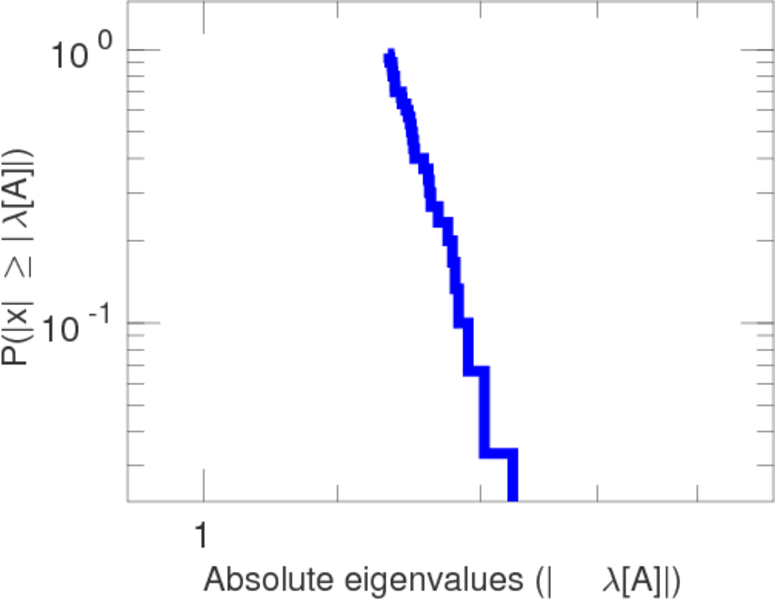
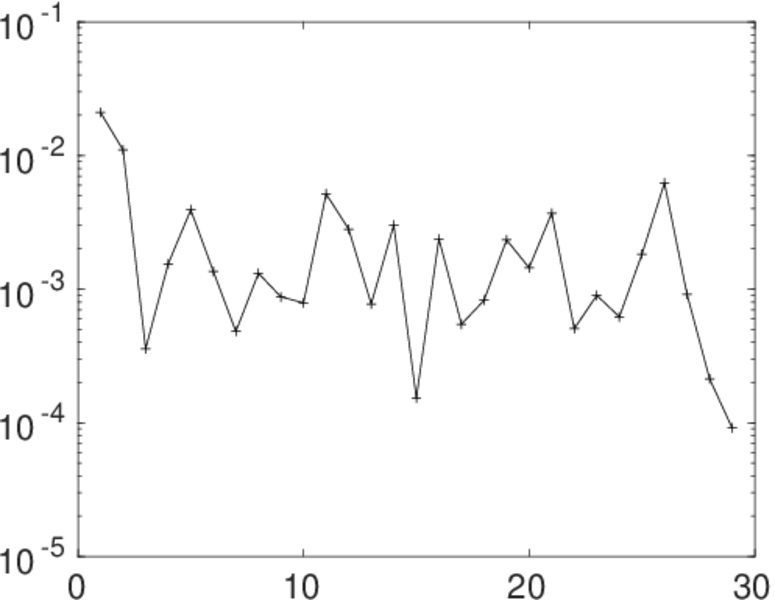
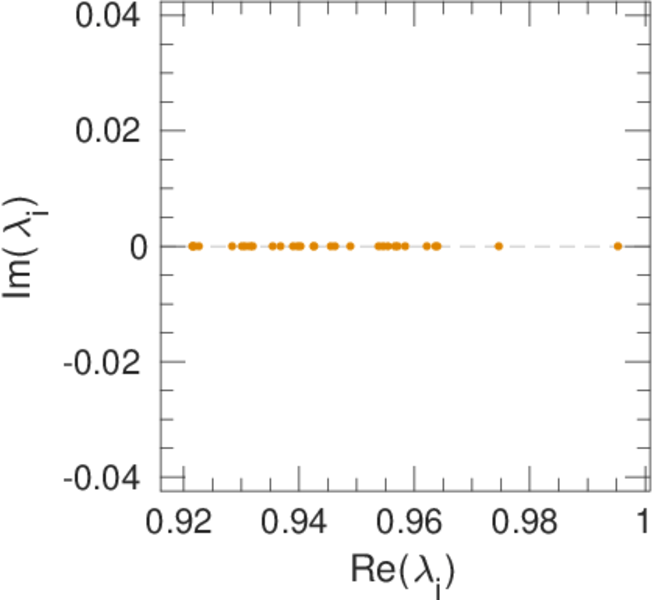
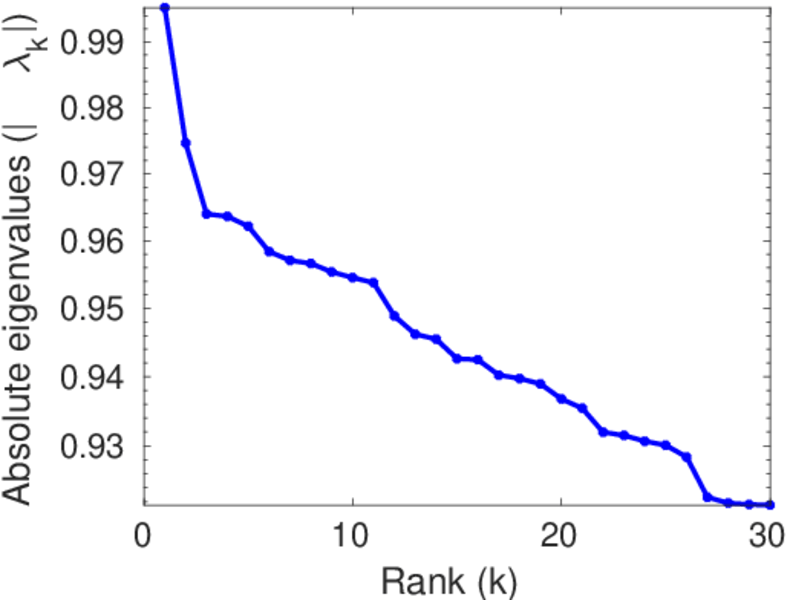
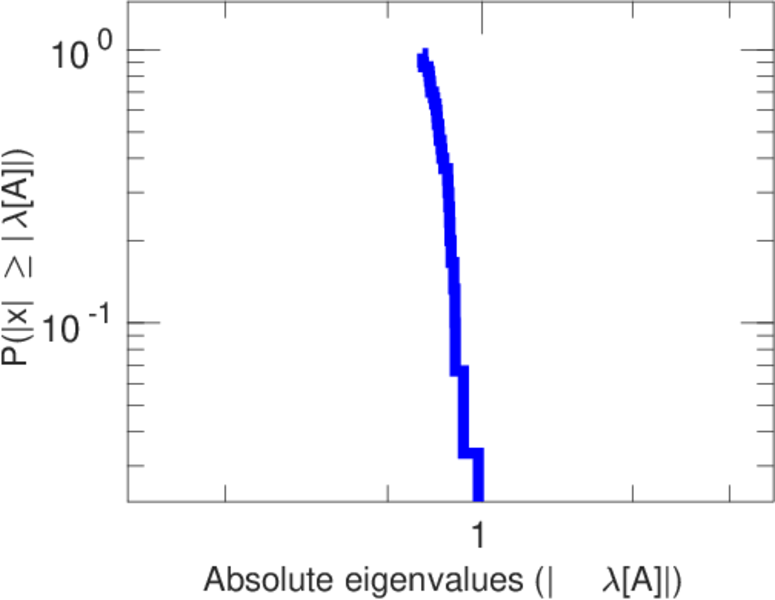
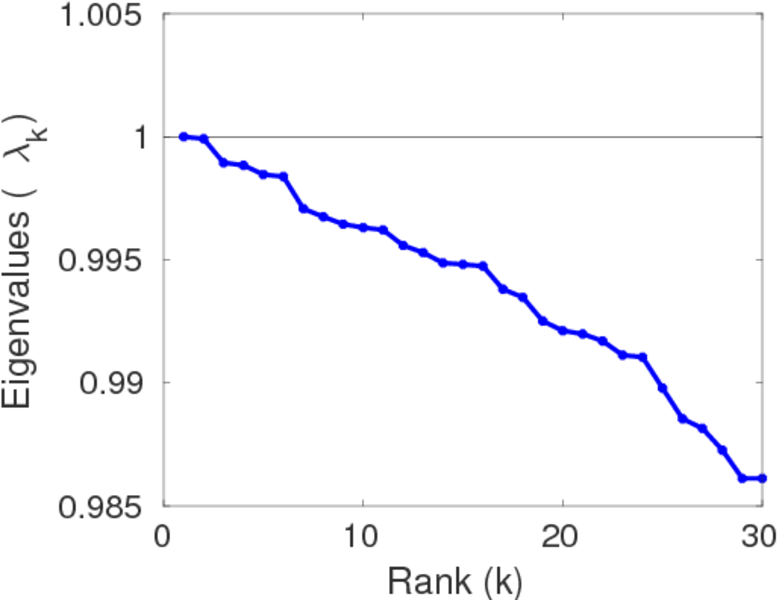
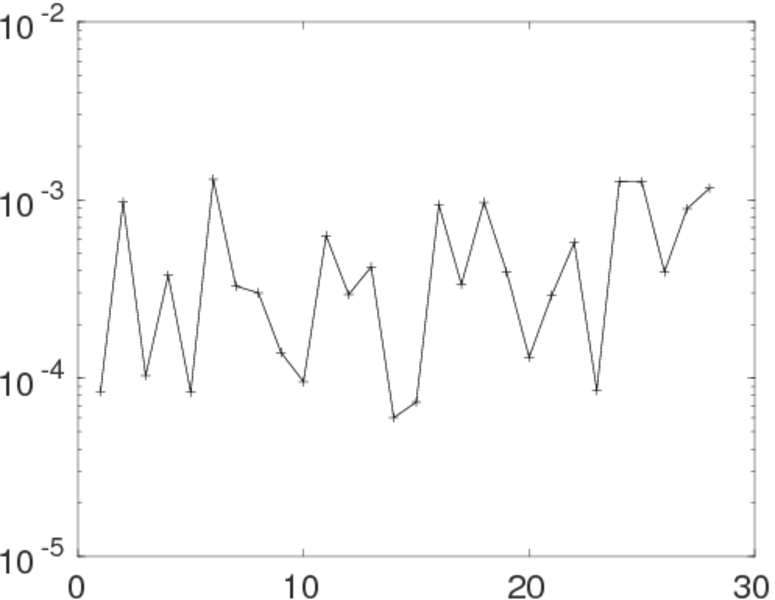
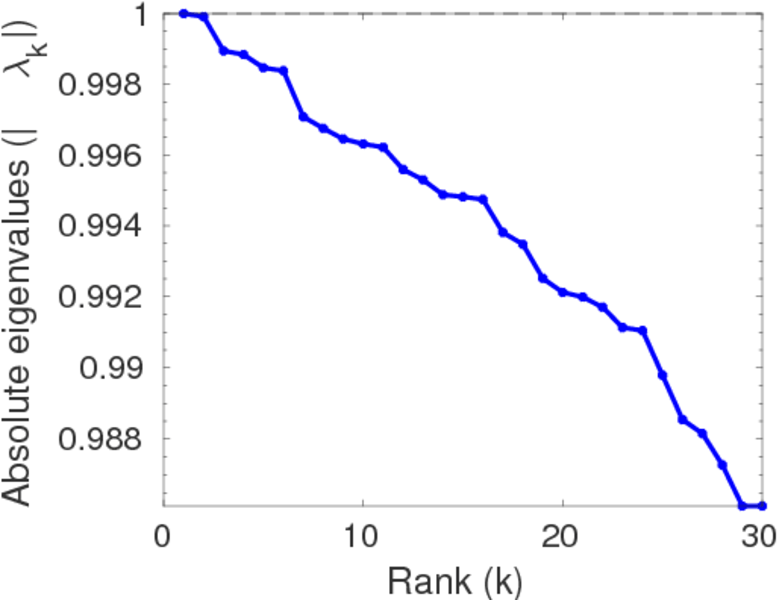
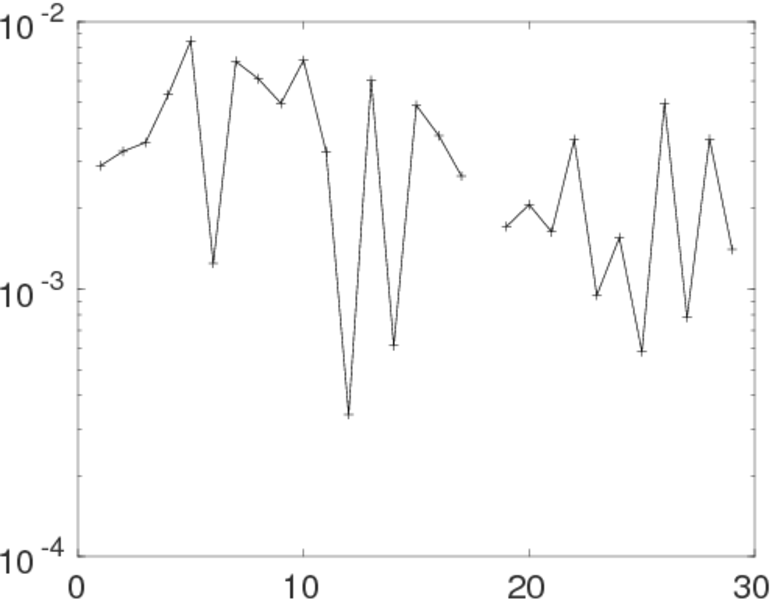
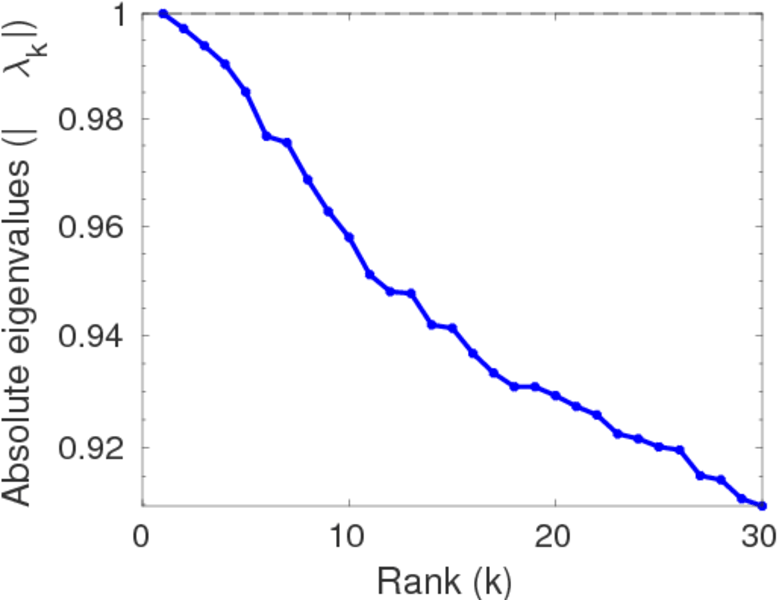
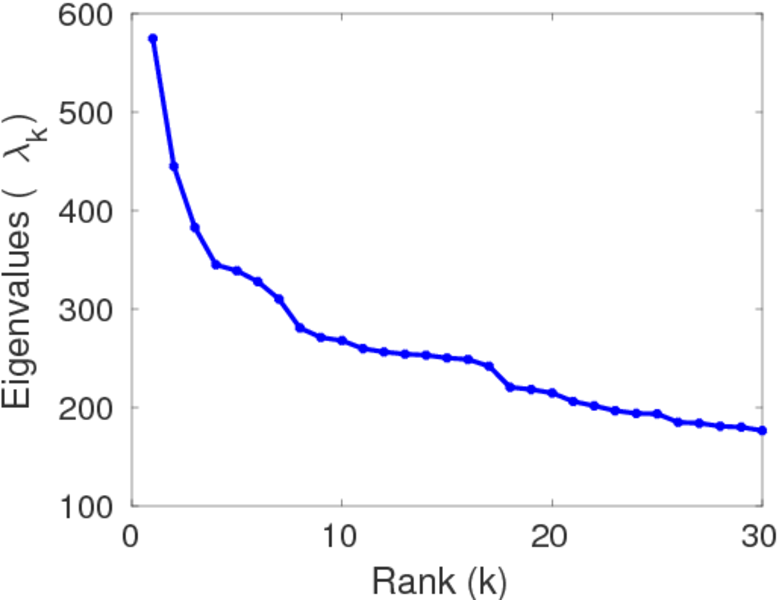
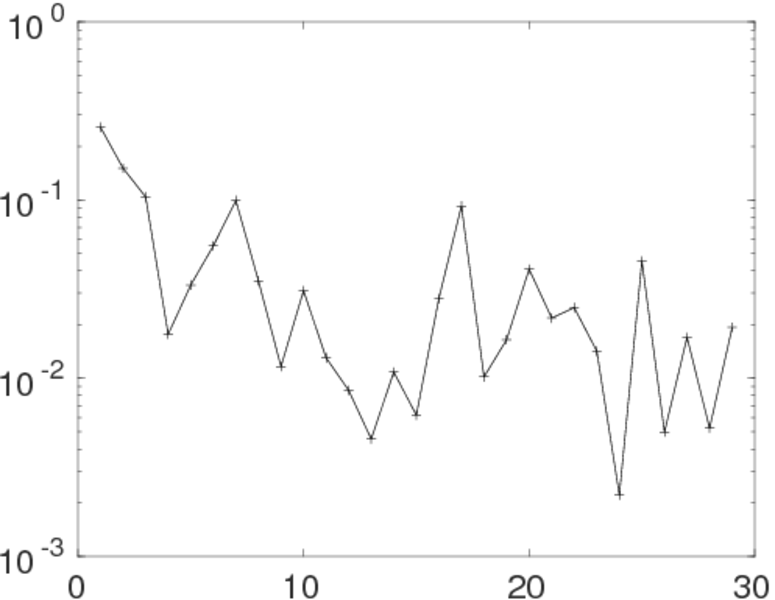
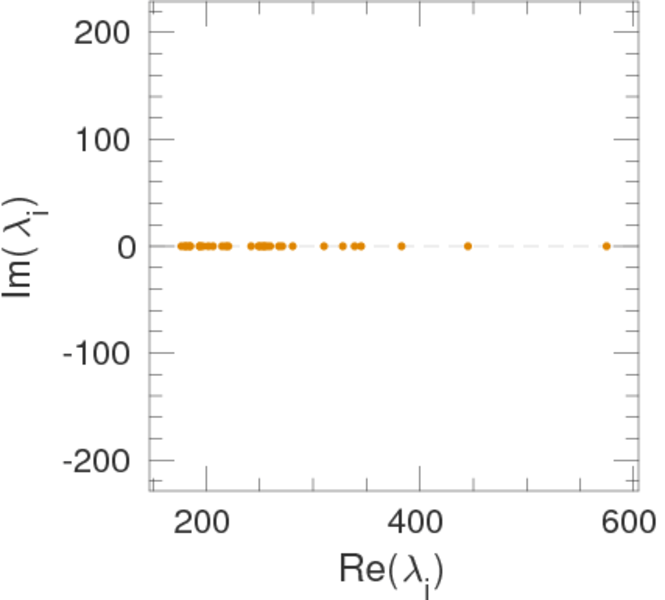
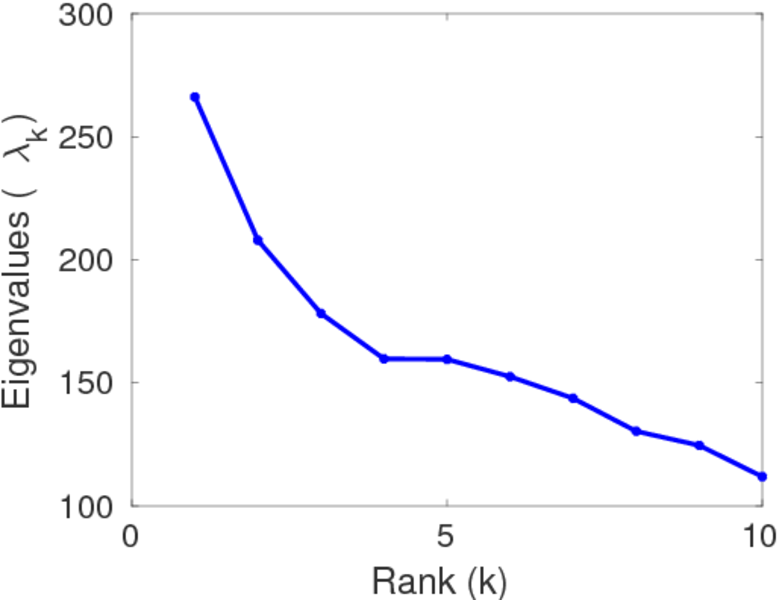
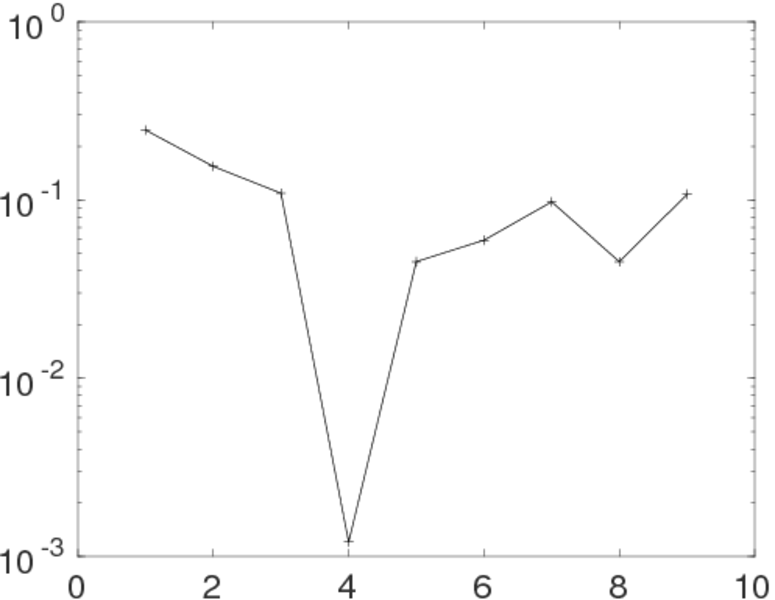
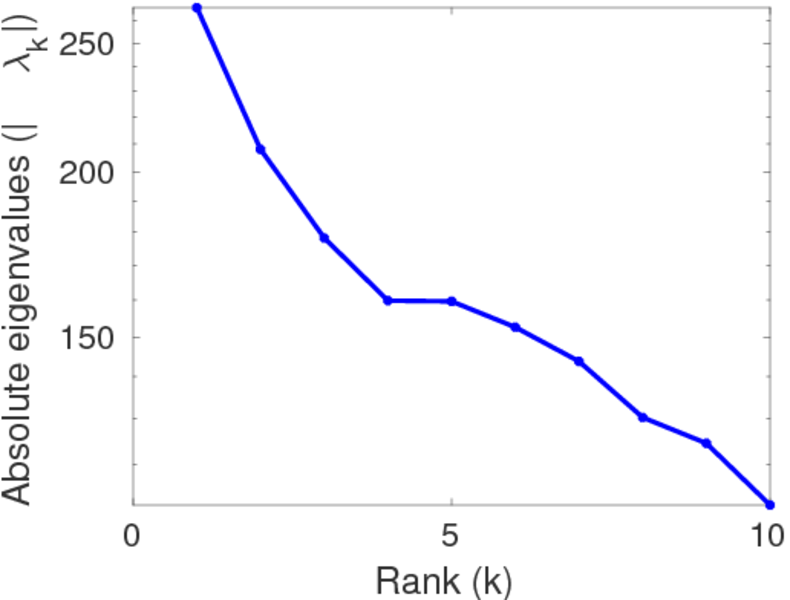
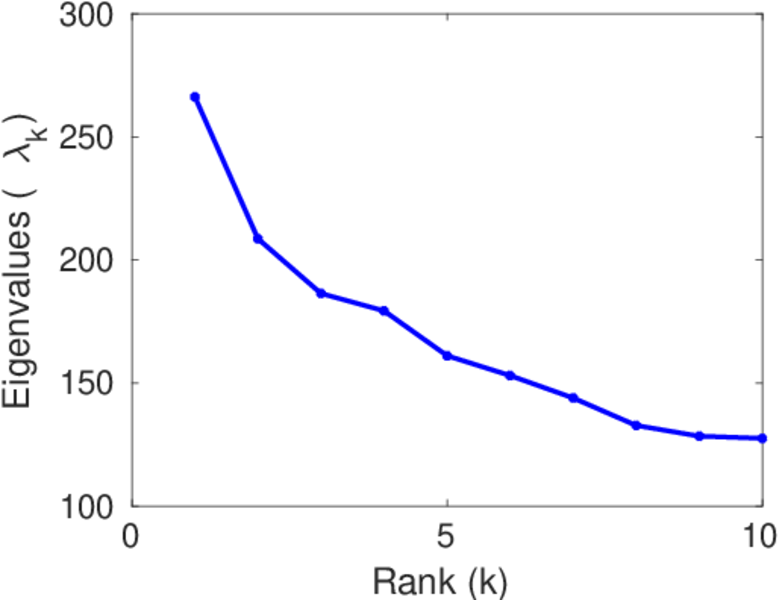
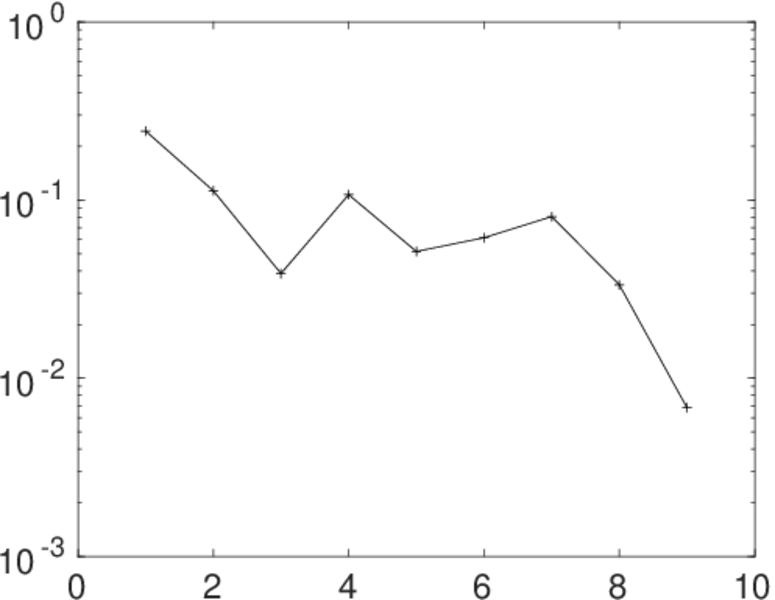
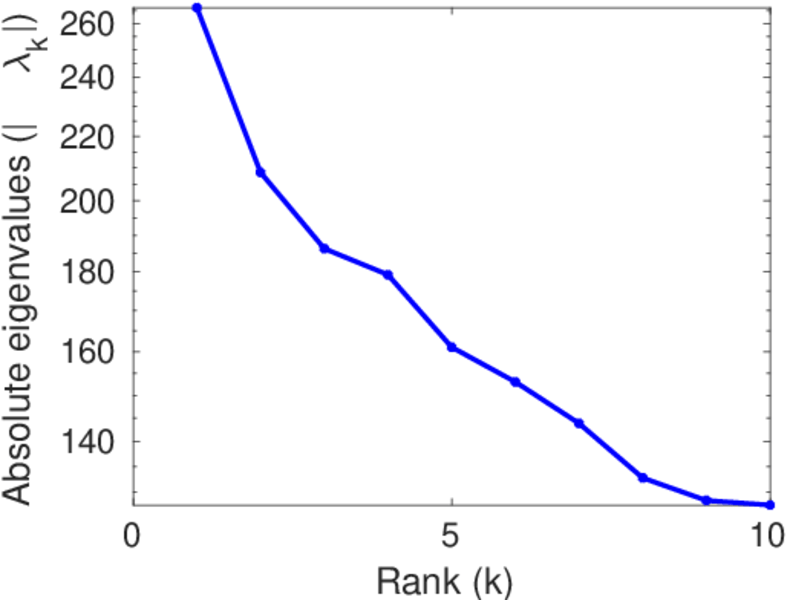
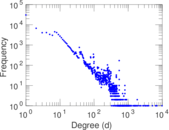
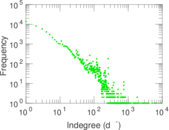
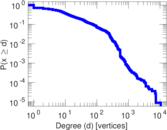
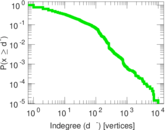
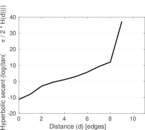
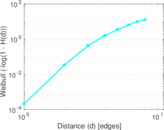
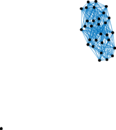
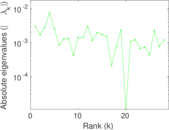
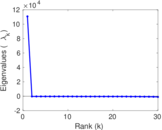
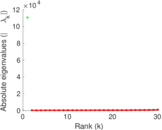
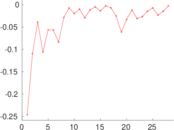
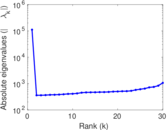
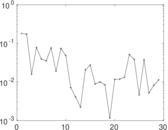
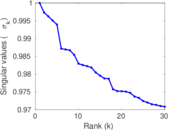
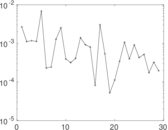
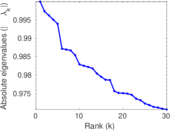
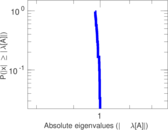
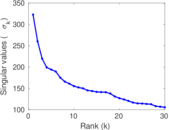
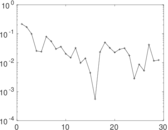
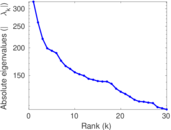
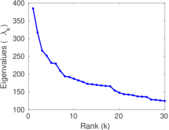
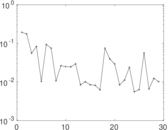
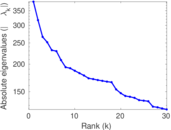
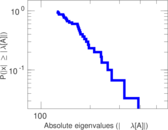
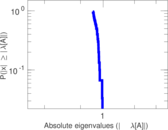
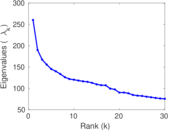
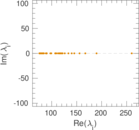
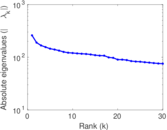
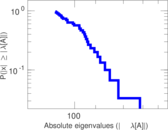
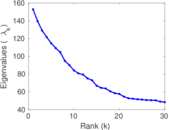
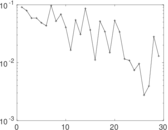
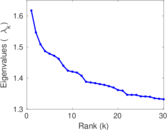
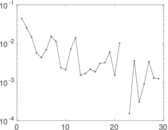
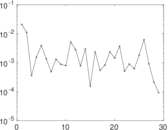
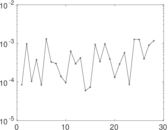
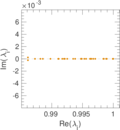
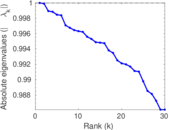
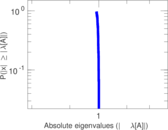
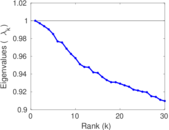
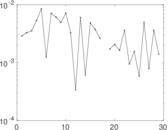
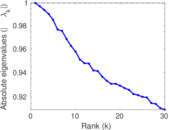
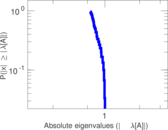
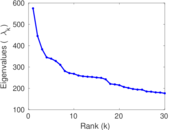
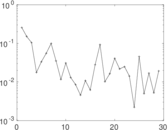
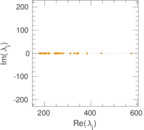
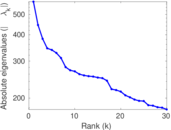
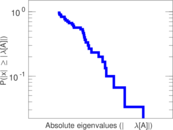
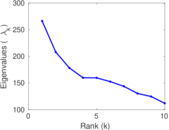
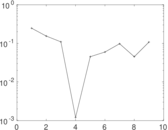
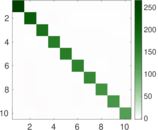
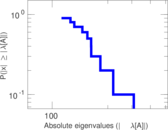
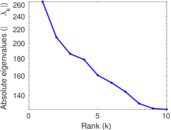
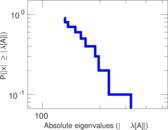
Plots


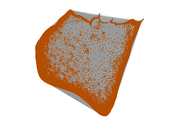
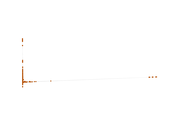


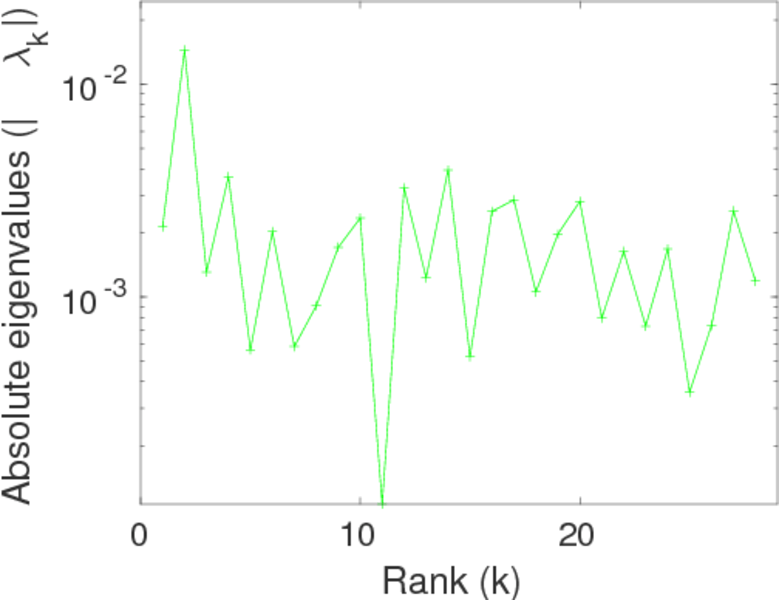
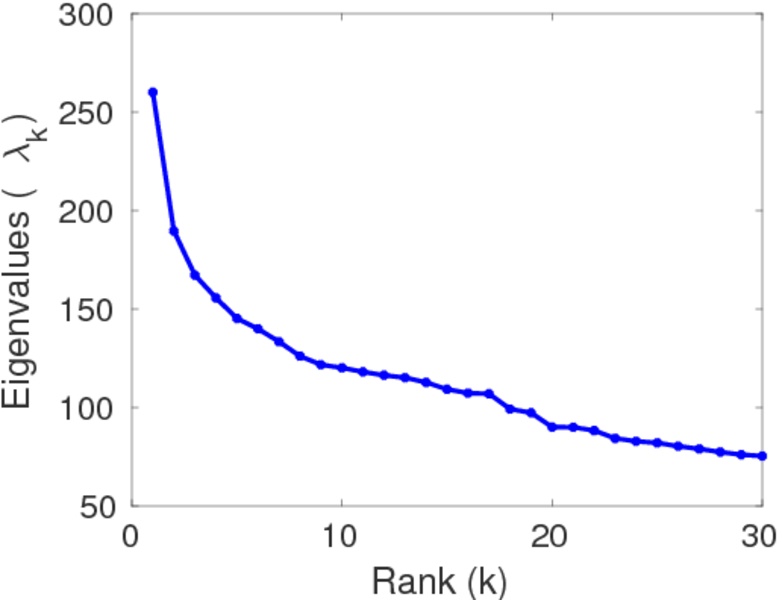
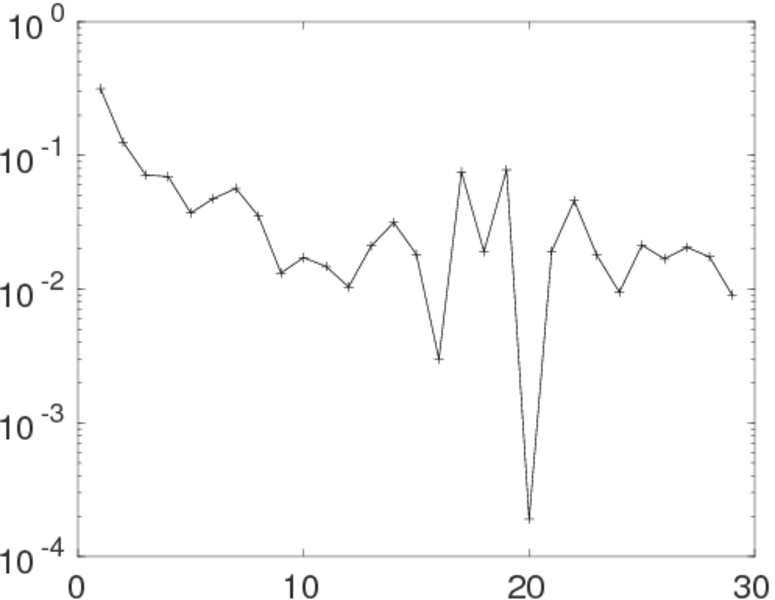
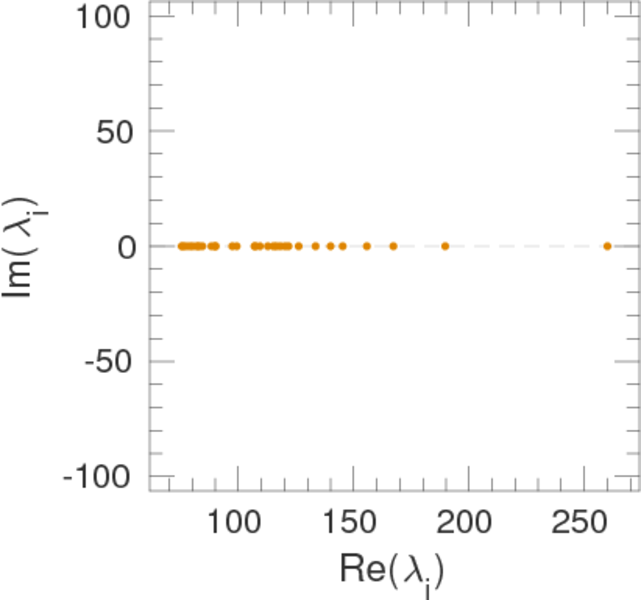
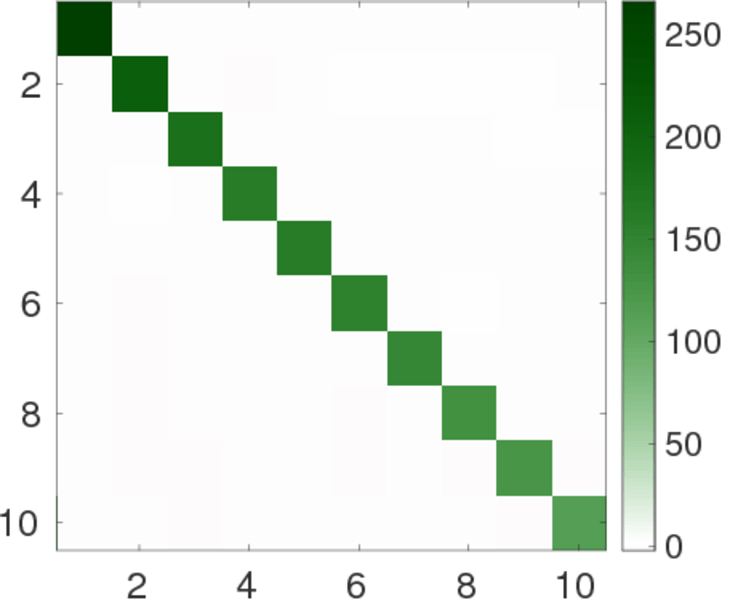
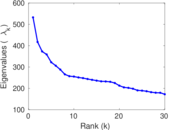
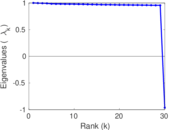
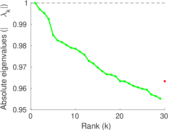
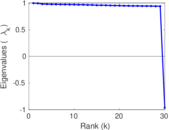
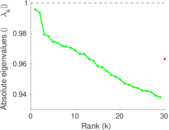
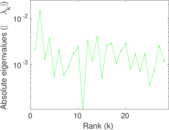
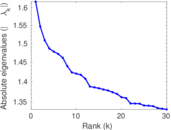
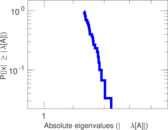
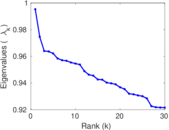
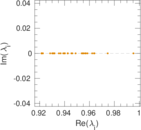
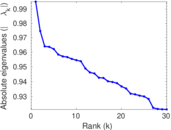
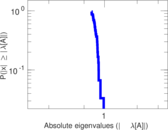
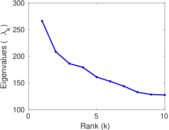
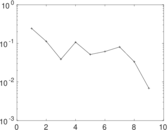
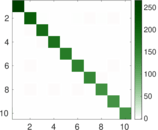
Matrix decompositions plots


Downloads
References
|
[1]
|
Jérôme Kunegis.
KONECT – The Koblenz Network Collection.
In Proc. Int. Conf. on World Wide Web Companion, pages
1343–1350, 2013.
[ http ]
|
 KONECT ‣ Networks ‣
Buy Me a Coffee
KONECT ‣ Networks ‣
Buy Me a Coffee