WordNet
This is the lexical network of words from the WordNet dataset. Nodes in the
network are English words, and links are relationships between them, such as
synonymy, antonymy, meronymy, etc. All relationships present in the WordNet
dataset are included. The resulting network is undirected.
Metadata
Statistics
| Size | n = | 146,005
|
| Volume | m = | 656,999
|
| Loop count | l = | 0
|
| Wedge count | s = | 35,863,116
|
| Claw count | z = | 4,063,487,782
|
| Cross count | x = | 624,320,669,873
|
| Triangle count | t = | 1,144,910
|
| Square count | q = | 32,926,054
|
| 4-Tour count | T4 = | 408,174,894
|
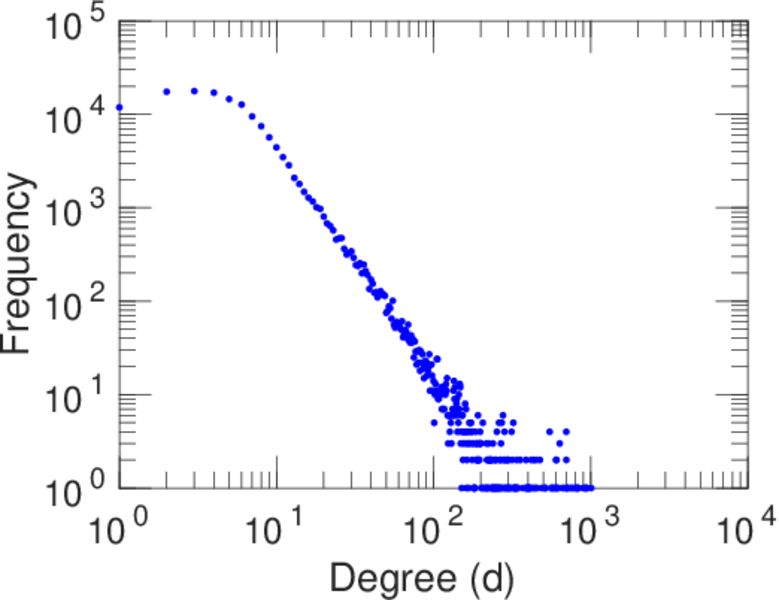
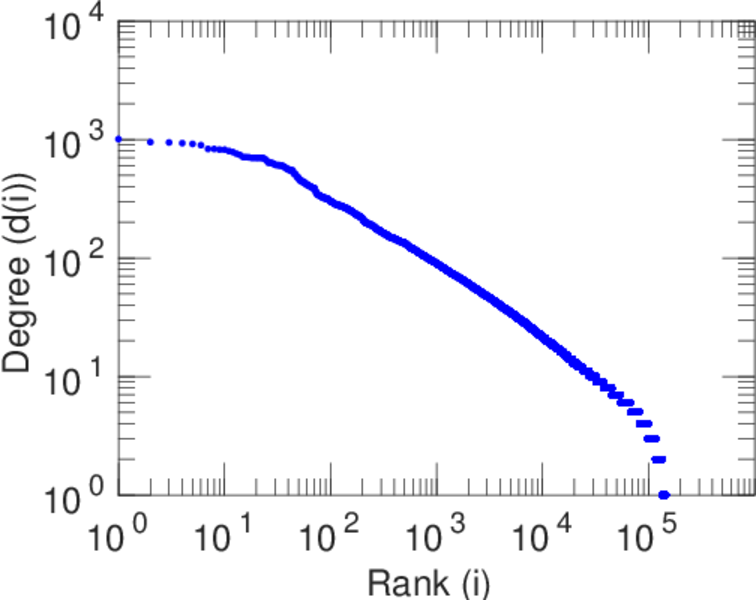
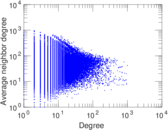
| Maximum degree | dmax = | 1,008
|
| Average degree | d = | 8.999 68
|
| Fill | p = | 6.163 99 × 10−5
|
| Size of LCC | N = | 145,145
|
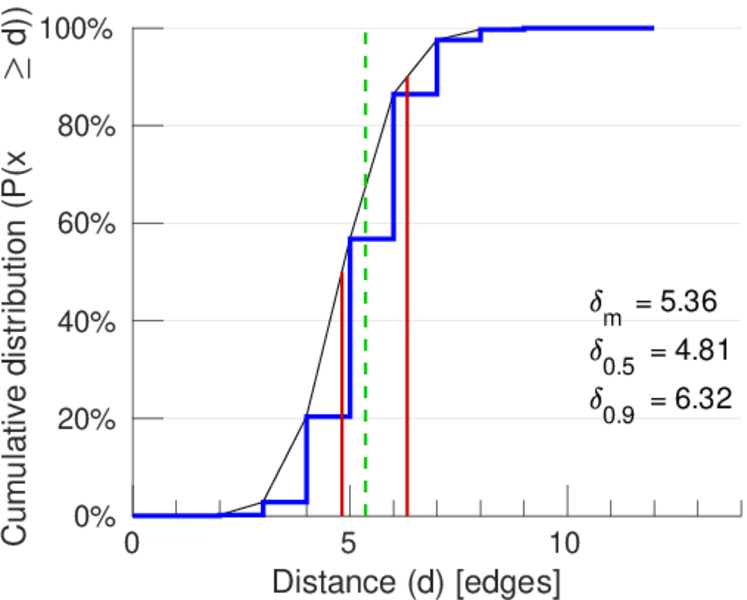
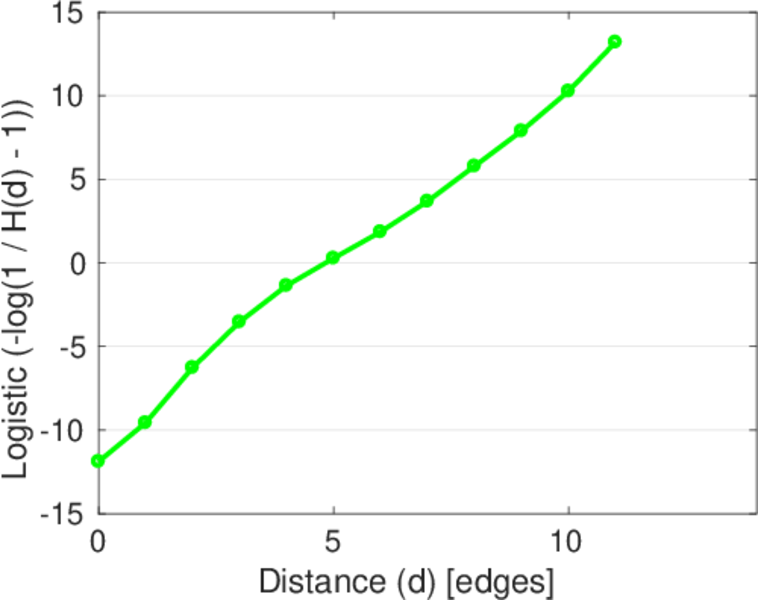
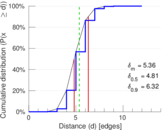
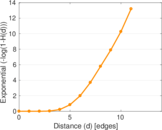
| Diameter | δ = | 16
|
| 50-Percentile effective diameter | δ0.5 = | 4.813 85
|
| 90-Percentile effective diameter | δ0.9 = | 6.318 86
|
| Median distance | δM = | 5
|
| Mean distance | δm = | 5.362 01
|
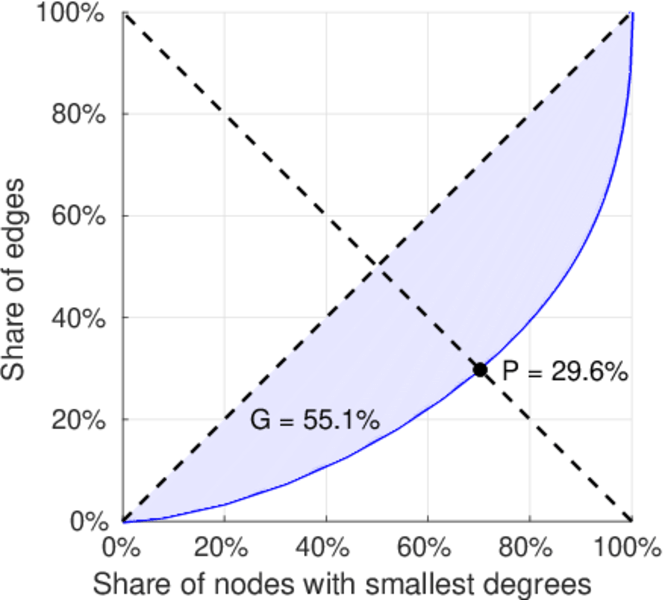
| Gini coefficient | G = | 0.551 182
|
| Balanced inequality ratio | P = | 0.295 863
|
| Relative edge distribution entropy | Her = | 0.940 450
|
| Power law exponent | γ = | 1.603 75
|
| Tail power law exponent | γt = | 2.471 00
|
| Tail power law exponent with p | γ3 = | 2.471 00
|
| p-value | p = | 0.000 00
|
| Degree assortativity | ρ = | −0.062 324 8
|
| Degree assortativity p-value | pρ = | 0.000 00
|
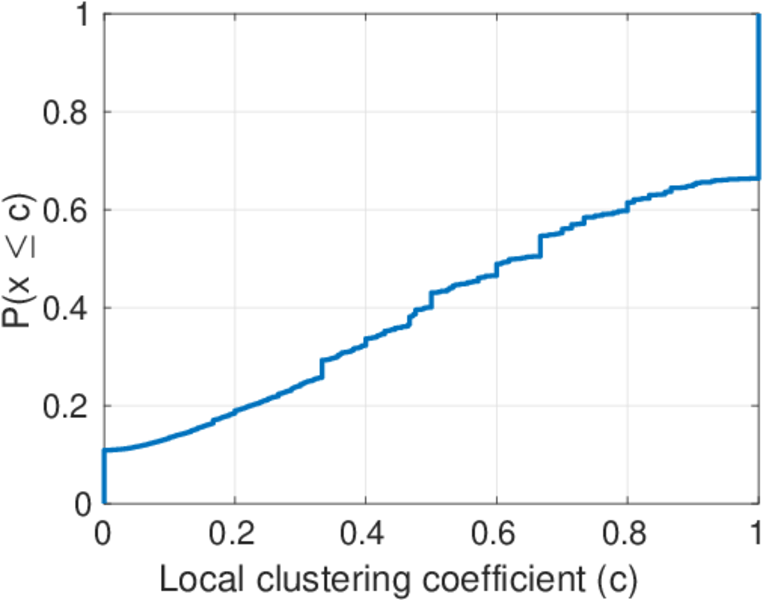
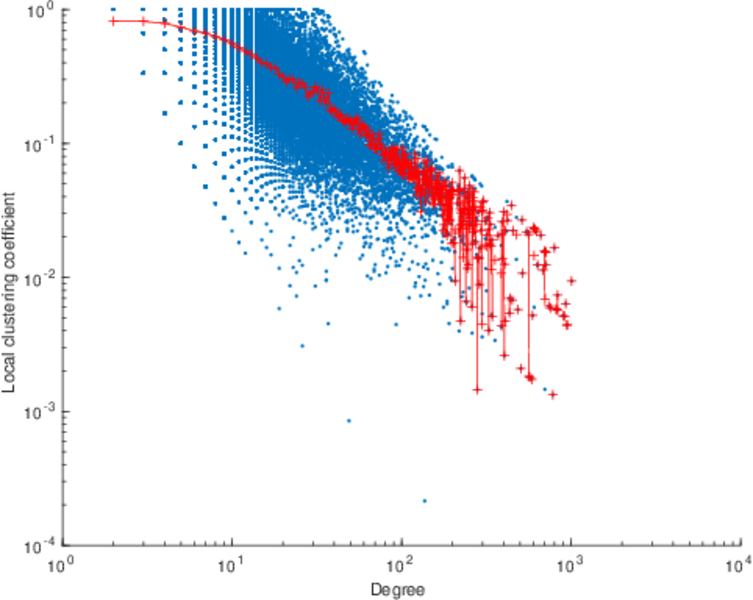
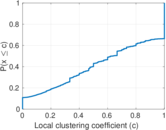
| Clustering coefficient | c = | 0.095 773 3
|
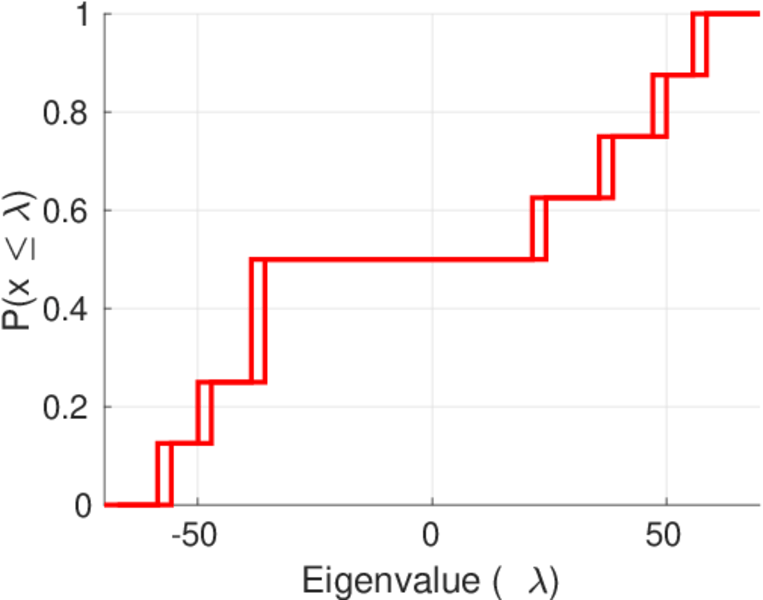
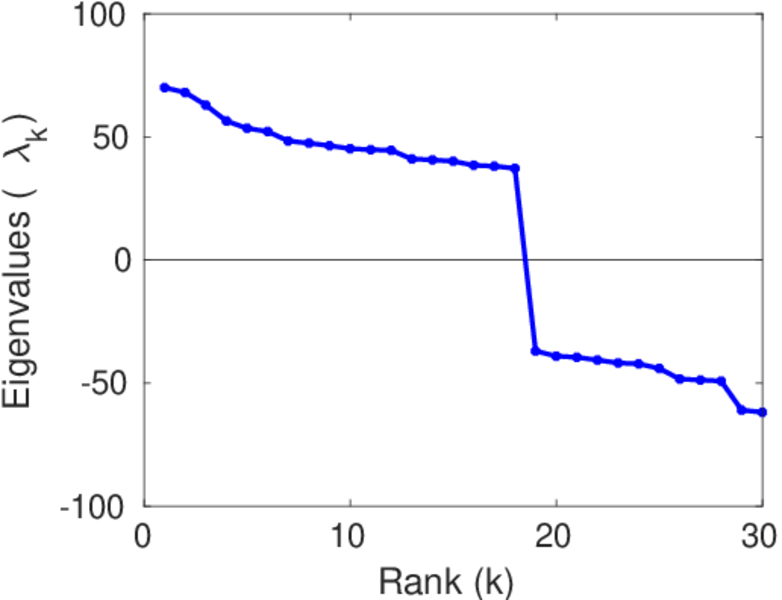
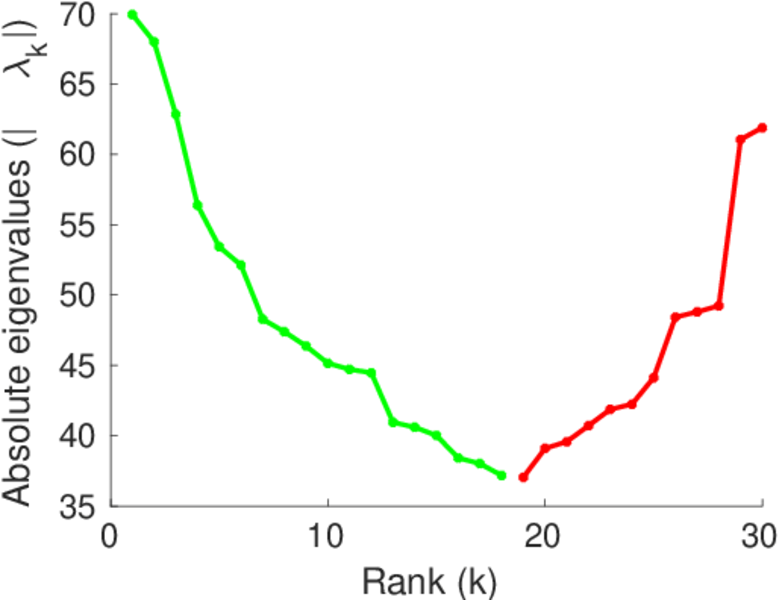
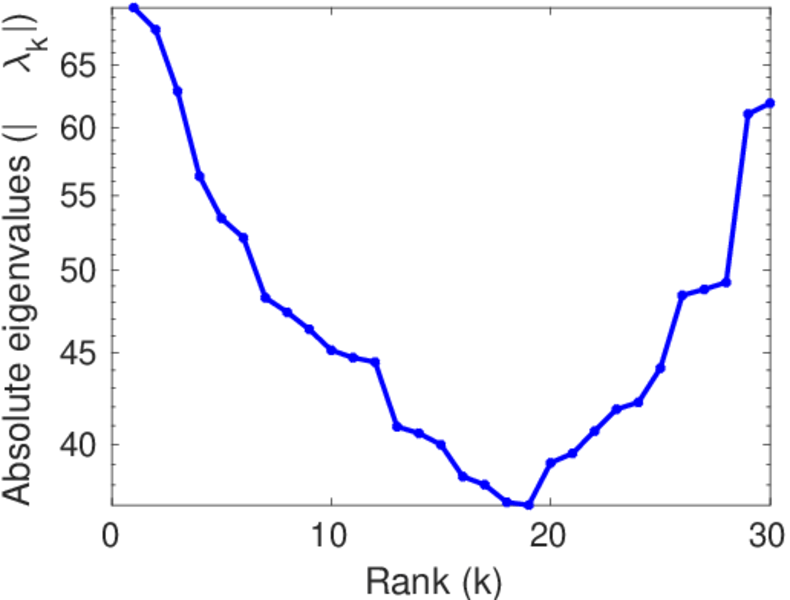
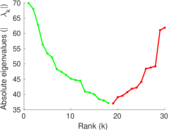
| Spectral norm | α = | 69.934 4
|
| Algebraic connectivity | a = | 0.022 464 9
|
| Spectral separation | |λ1[A] / λ2[A]| = | 1.028 53
|
| Non-bipartivity | bA = | 0.114 963
|
| Normalized non-bipartivity | bN = | 0.046 198 2
|
| Algebraic non-bipartivity | χ = | 0.079 502 3
|
| Spectral bipartite frustration | bK = | 0.002 198 04
|
| Controllability | C = | 15,096
|
| Relative controllability | Cr = | 0.103 394
|
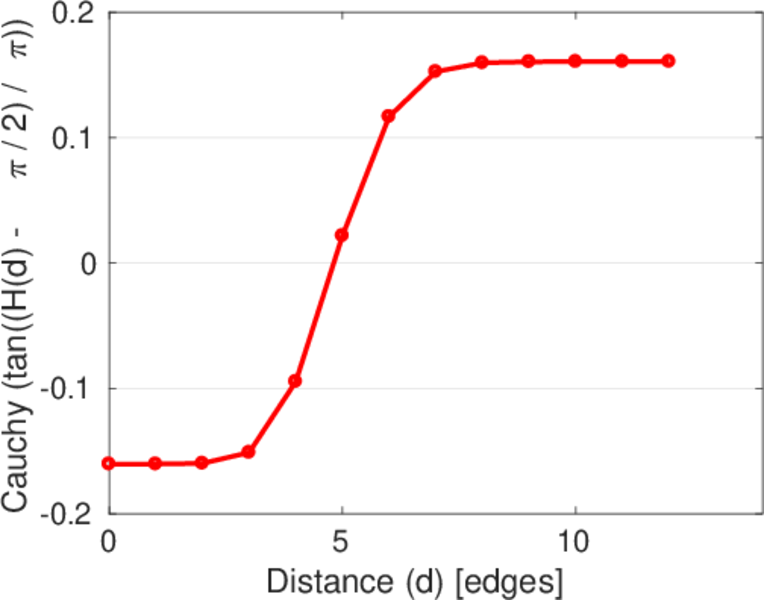
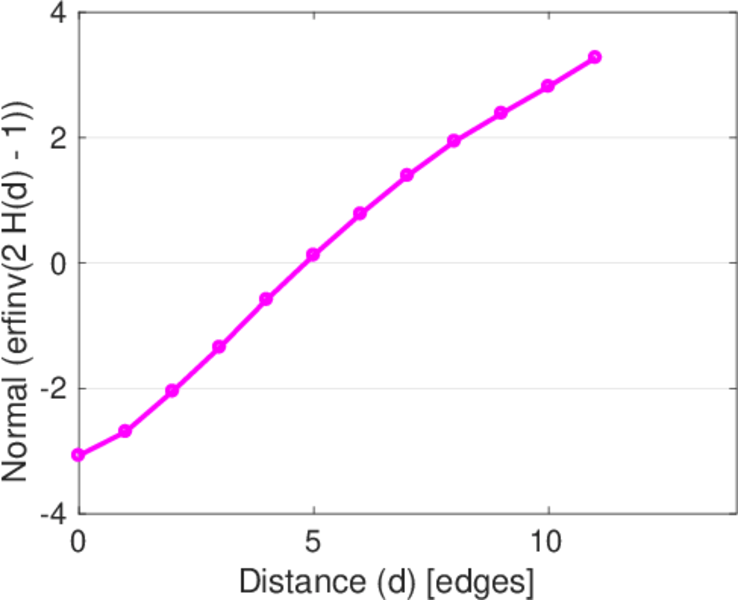
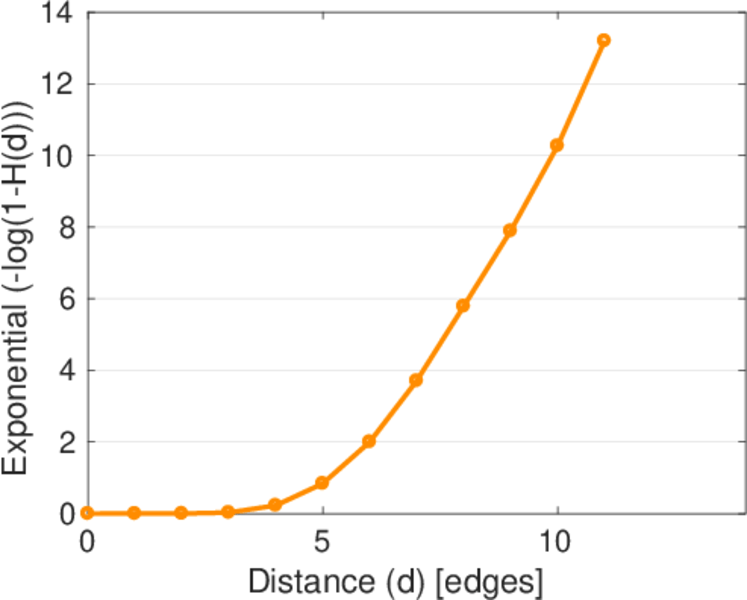
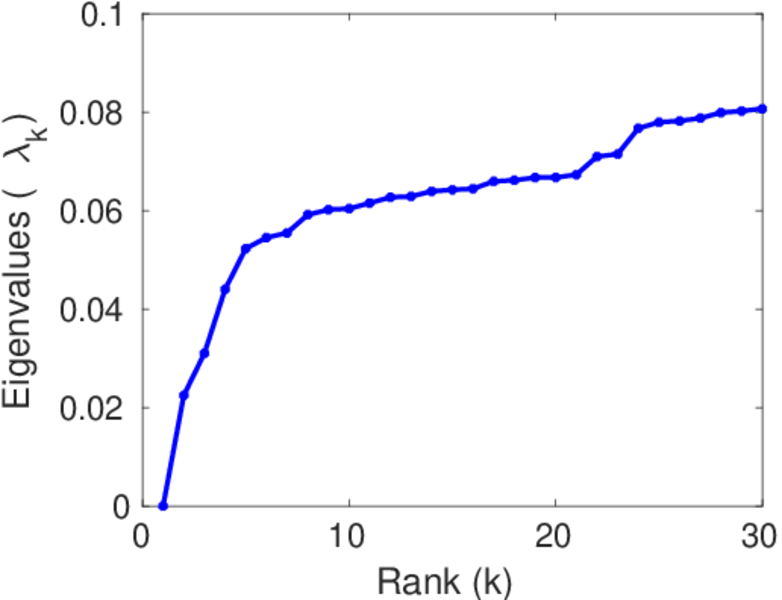
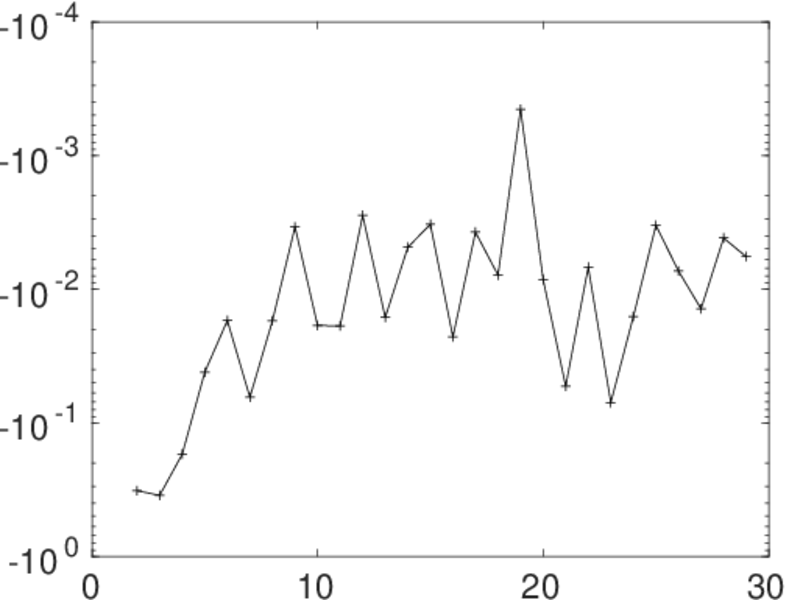
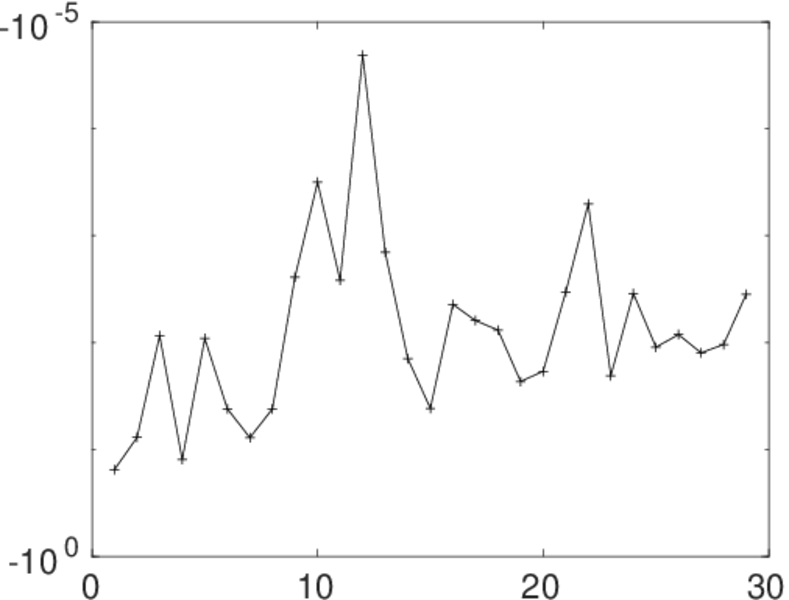
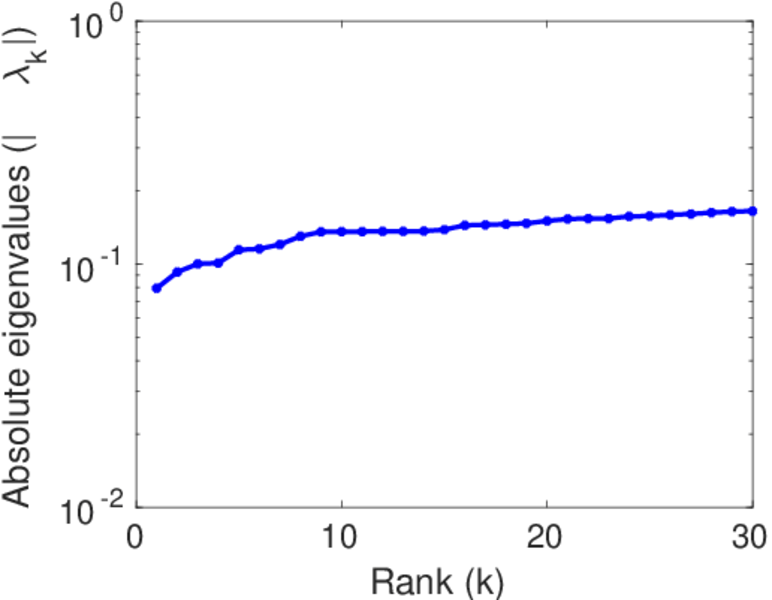
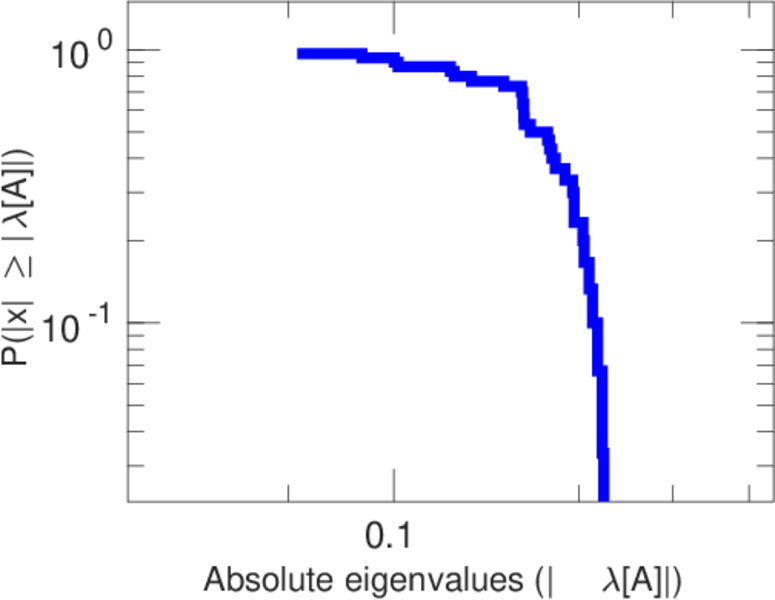
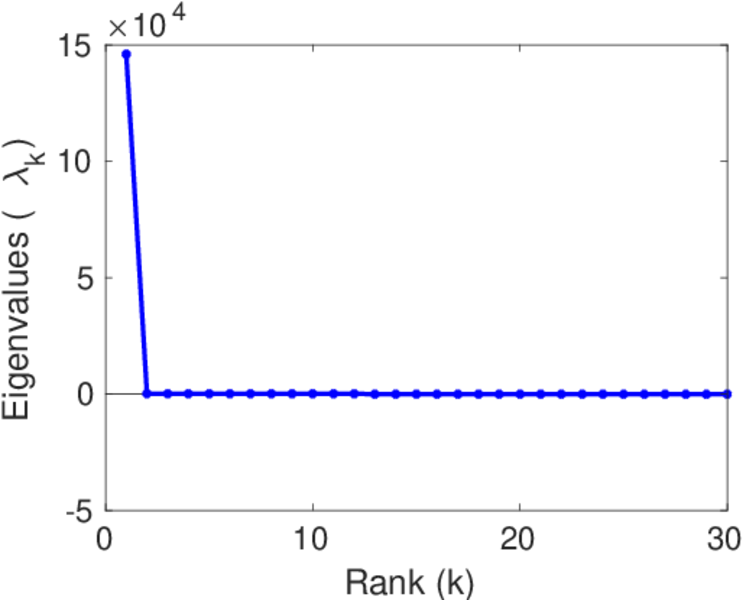
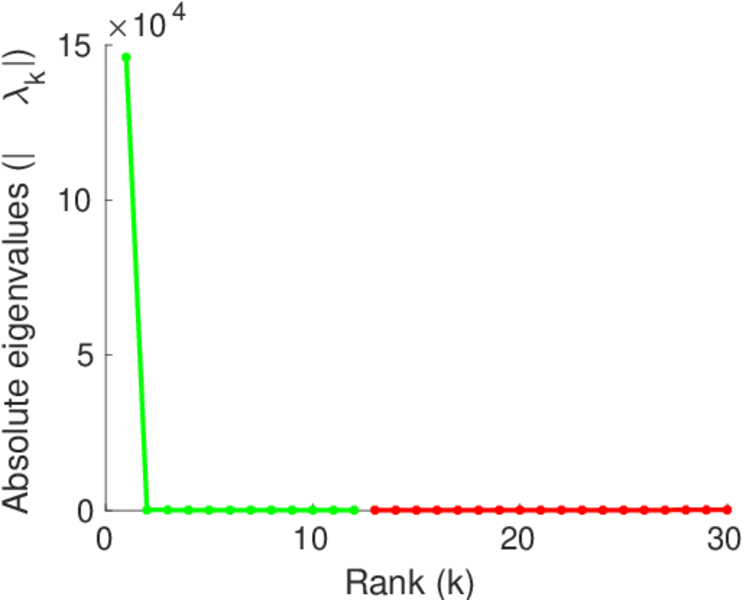
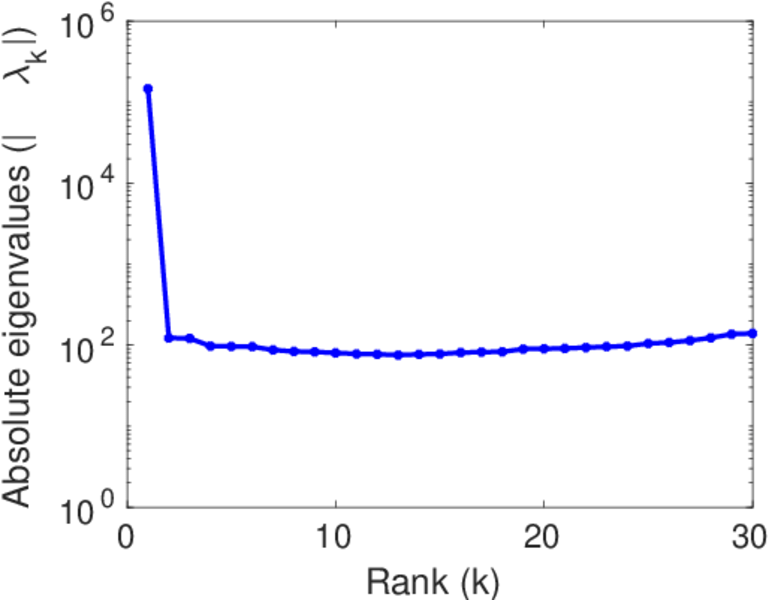
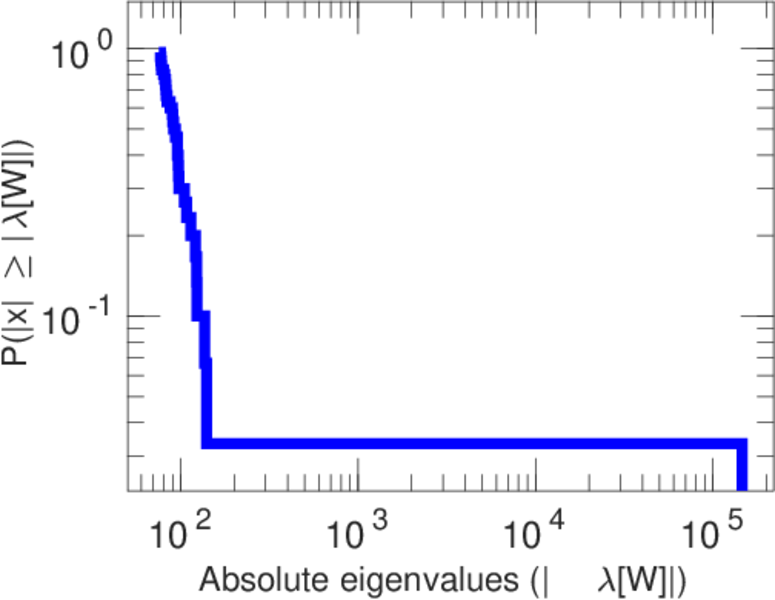
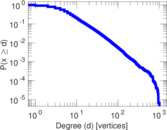
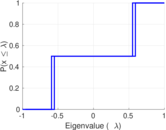
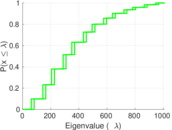
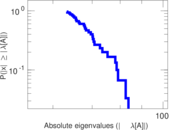
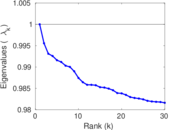
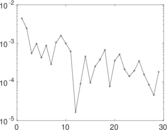
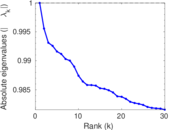
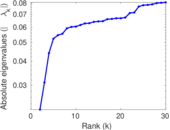
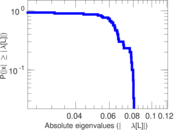
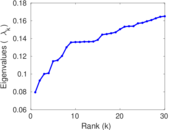
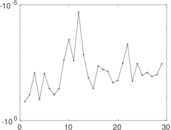
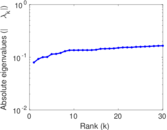
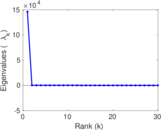
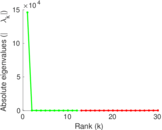
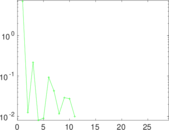
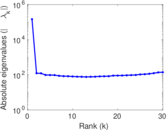
Plots


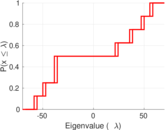

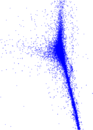
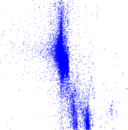


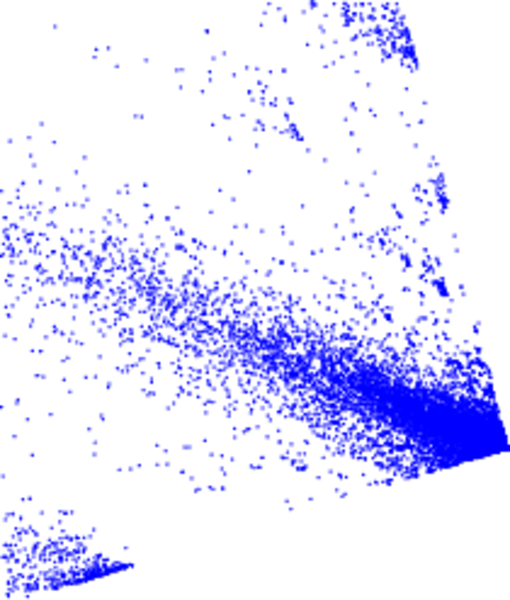
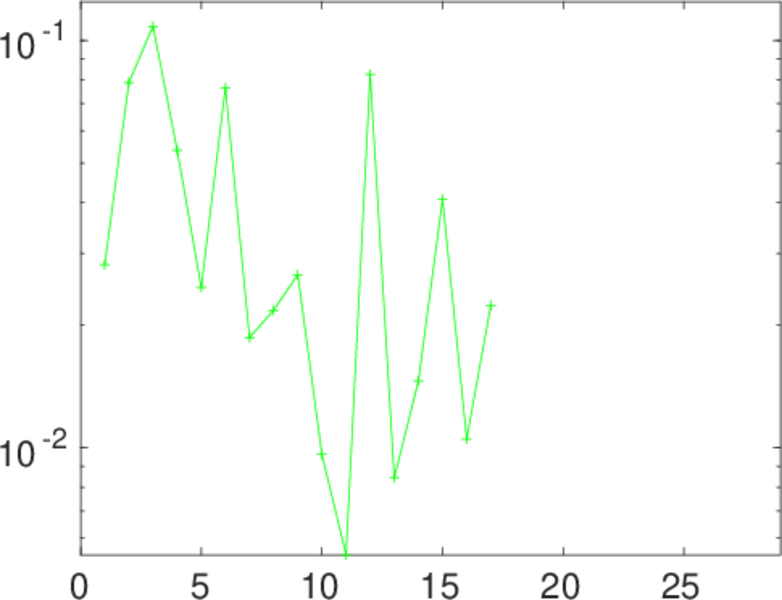
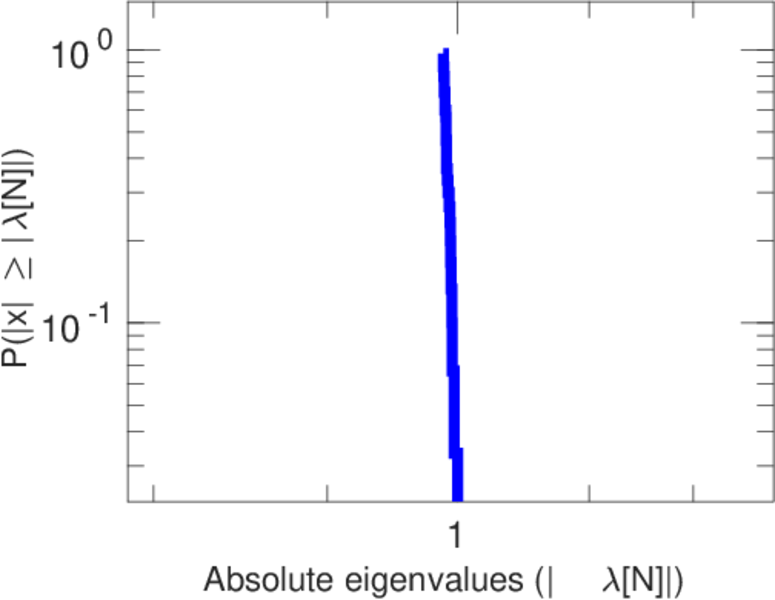
Matrix decompositions plots


Downloads
References
|
[1]
|
Jérôme Kunegis.
KONECT – The Koblenz Network Collection.
In Proc. Int. Conf. on World Wide Web Companion, pages
1343–1350, 2013.
[ http ]
|
|
[2]
|
Christiane Fellbaum, editor.
WordNet: an Electronic Lexical Database.
MIT Press, 1998.
|
 KONECT ‣ Networks ‣
Buy Me a Coffee
KONECT ‣ Networks ‣
Buy Me a Coffee