YouTube
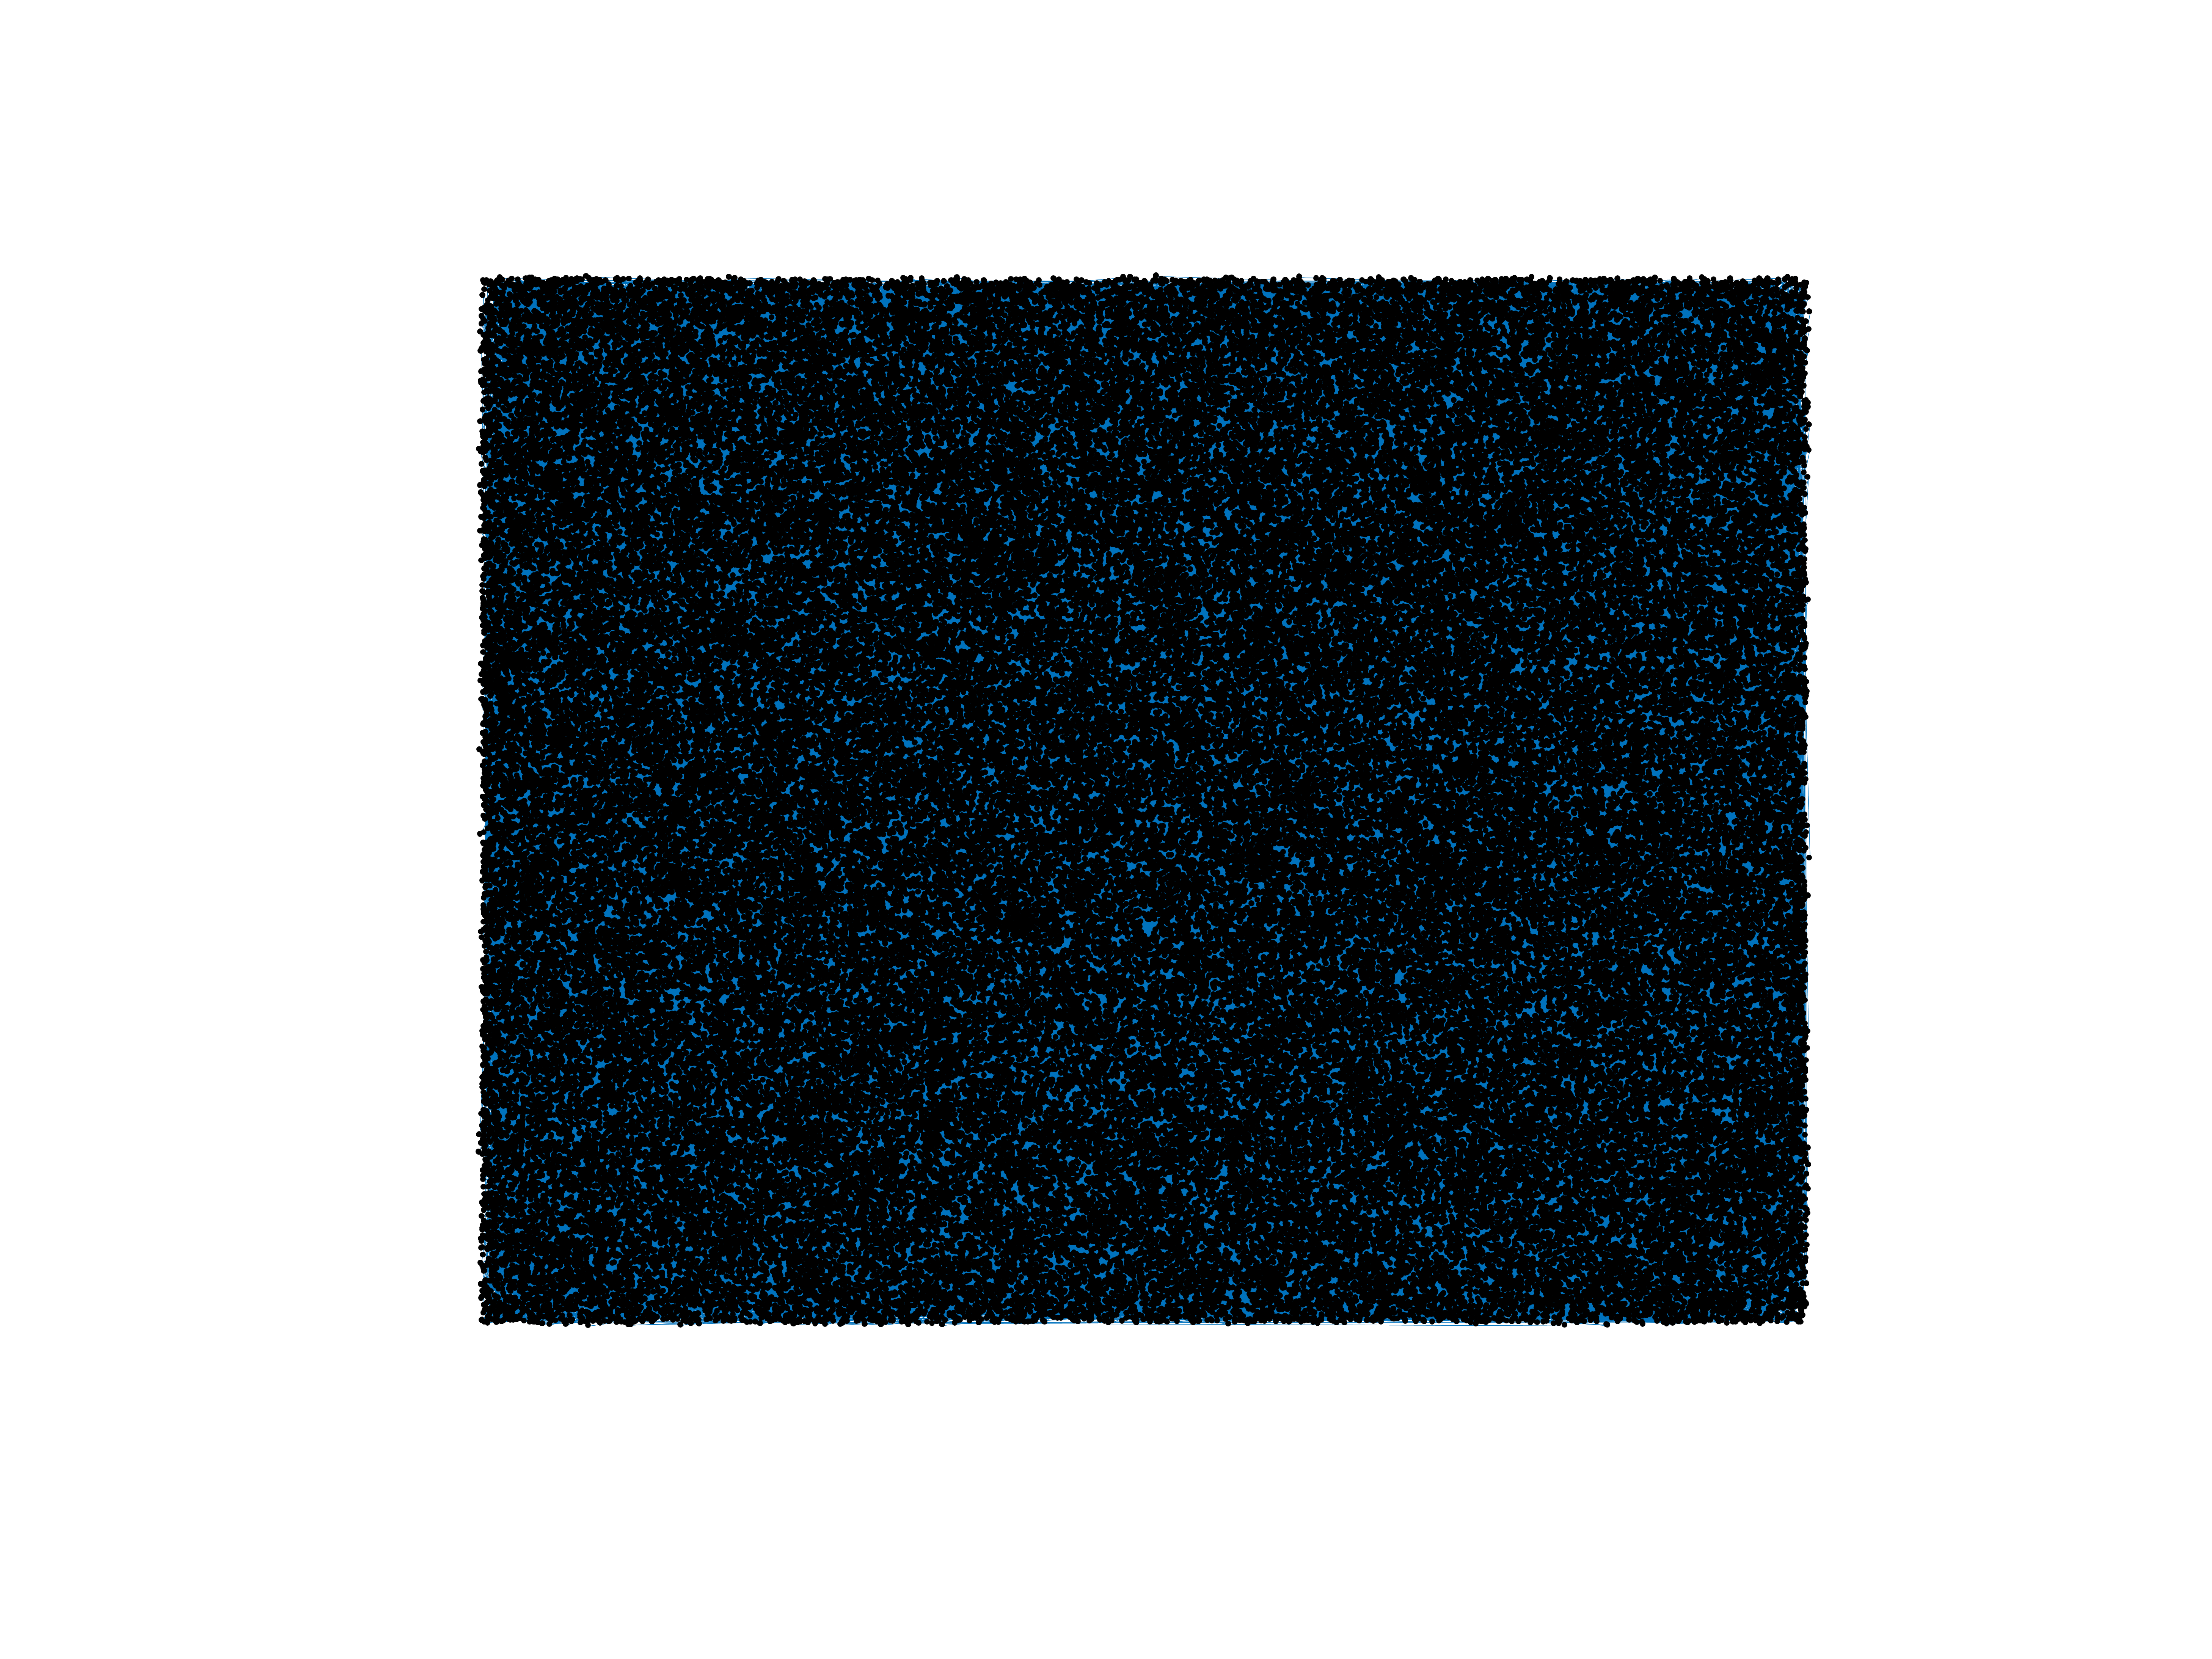
This is the bipartite network of YouTube users and their group memberships. The
nodes are users and groups, and an edge between a user and a group denotes a
group membership.
Metadata
Statistics
| Size | n = | 124,325
|
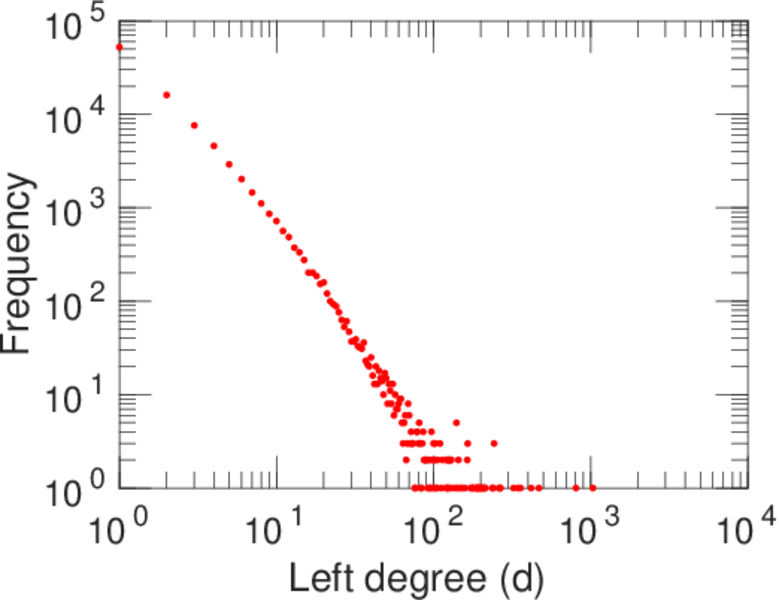
| Left size | n1 = | 94,238
|
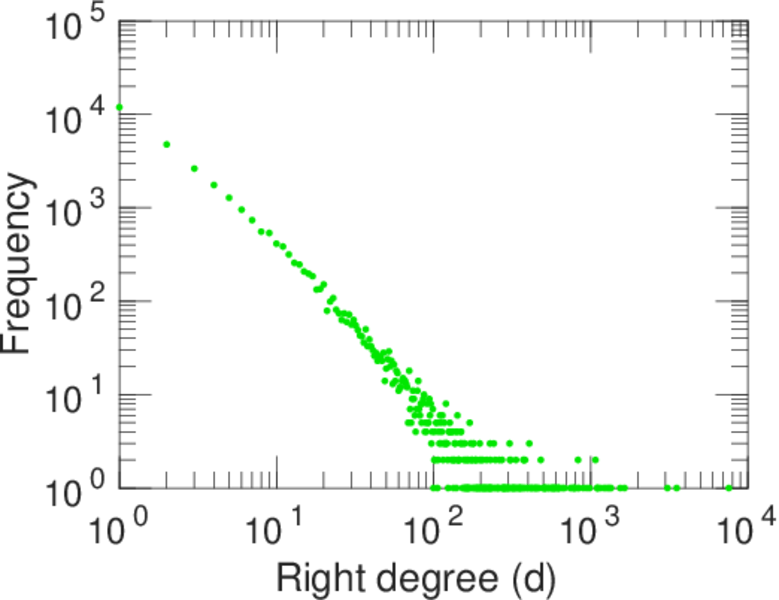
| Right size | n2 = | 30,087
|
| Volume | m = | 293,360
|
| Wedge count | s = | 70,180,198
|
| Claw count | z = | 92,191,098,295
|
| Cross count | x = | 150,344,737,942,342
|
| Square count | q = | 12,540,261
|
| 4-Tour count | T4 = | 381,648,116
|
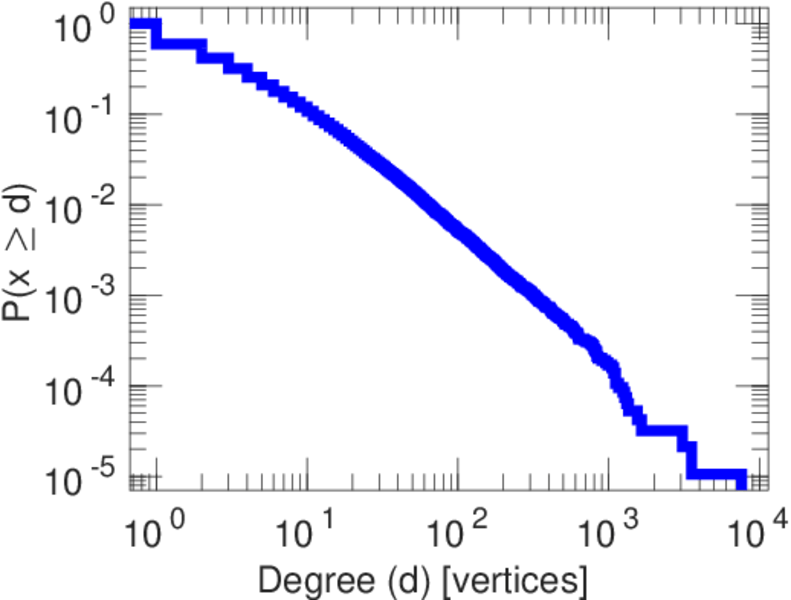
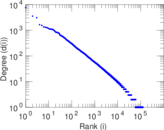
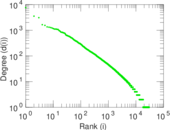
| Maximum degree | dmax = | 7,591
|
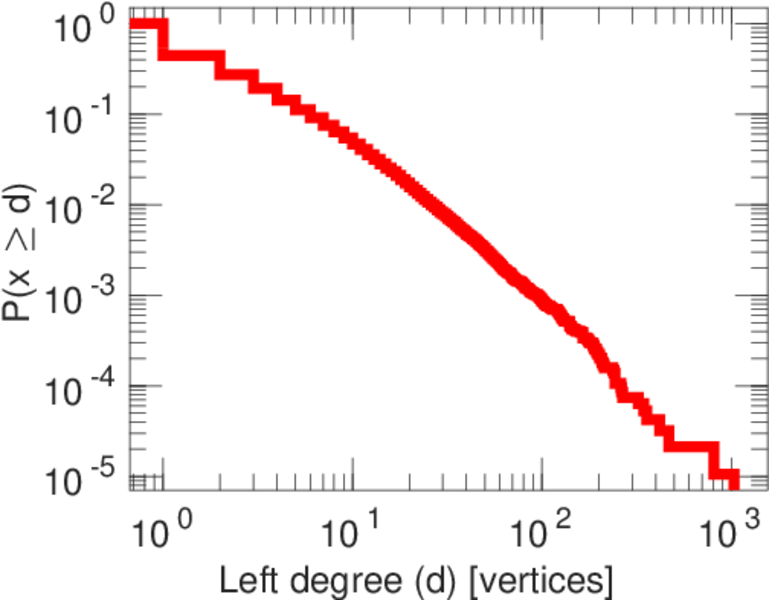
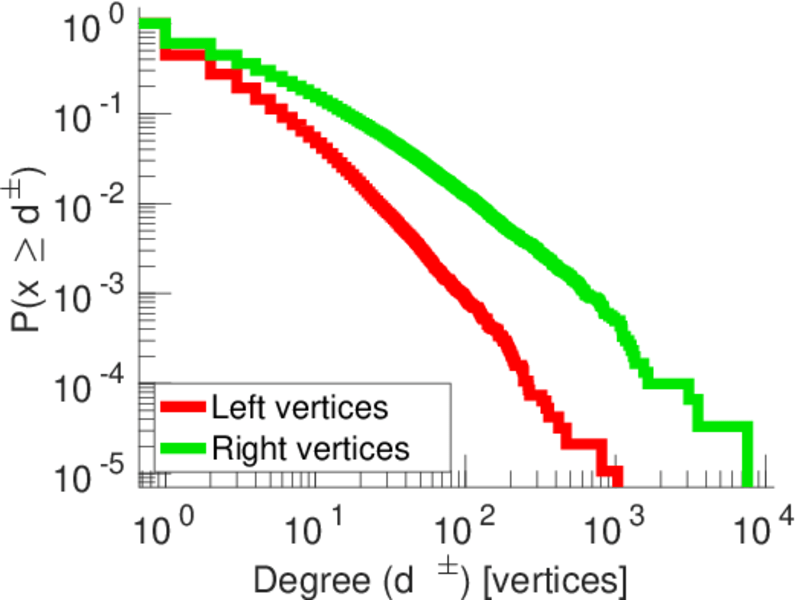
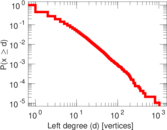
| Maximum left degree | d1max = | 1,035
|
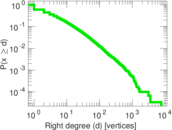
| Maximum right degree | d2max = | 7,591
|
| Average degree | d = | 4.719 24
|
| Average left degree | d1 = | 3.112 97
|
| Average right degree | d2 = | 9.750 39
|
| Fill | p = | 0.000 103 466
|
| Size of LCC | N = | 113,496
|
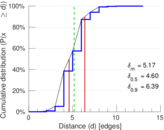
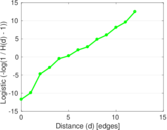
| Diameter | δ = | 17
|
| 50-Percentile effective diameter | δ0.5 = | 4.602 49
|
| 90-Percentile effective diameter | δ0.9 = | 6.390 19
|
| Median distance | δM = | 5
|
| Mean distance | δm = | 5.174 35
|
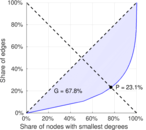
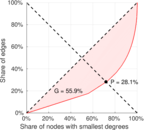
| Gini coefficient | G = | 0.693 488
|
| Balanced inequality ratio | P = | 0.229 794
|
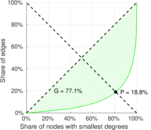
| Left balanced inequality ratio | P1 = | 0.280 584
|
| Right balanced inequality ratio | P2 = | 0.188 134
|
| Relative edge distribution entropy | Her = | 0.878 122
|
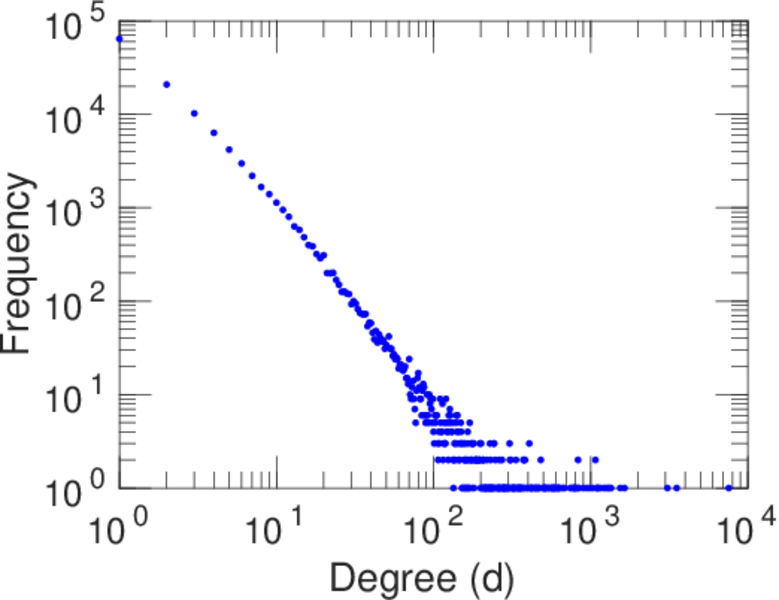
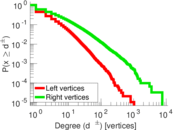
| Power law exponent | γ = | 2.411 68
|
| Tail power law exponent | γt = | 2.311 00
|
| Tail power law exponent with p | γ3 = | 2.311 00
|
| p-value | p = | 0.025 000 0
|
| Left tail power law exponent with p | γ3,1 = | 2.801 00
|
| Left p-value | p1 = | 0.753 000
|
| Right tail power law exponent with p | γ3,2 = | 2.281 00
|
| Right p-value | p2 = | 0.277 000
|
| Degree assortativity | ρ = | −0.067 164 5
|
| Degree assortativity p-value | pρ = | 2.122 07 × 10−290
|
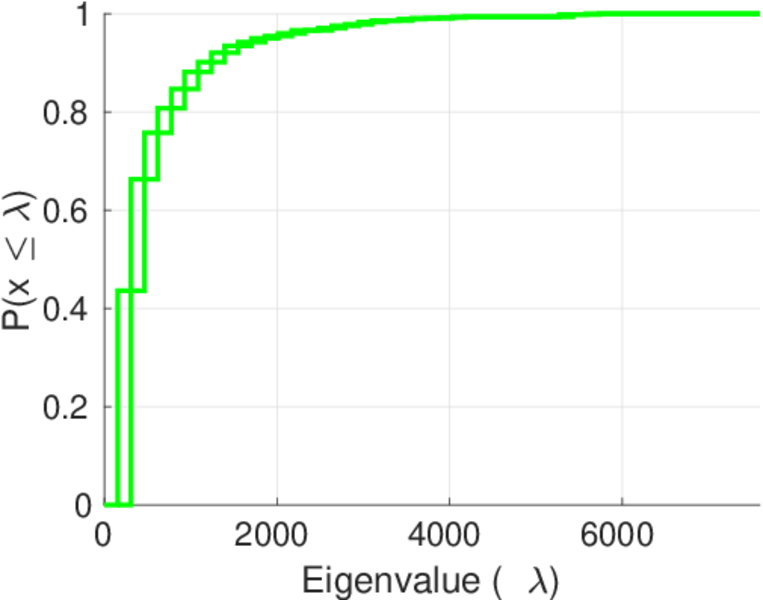
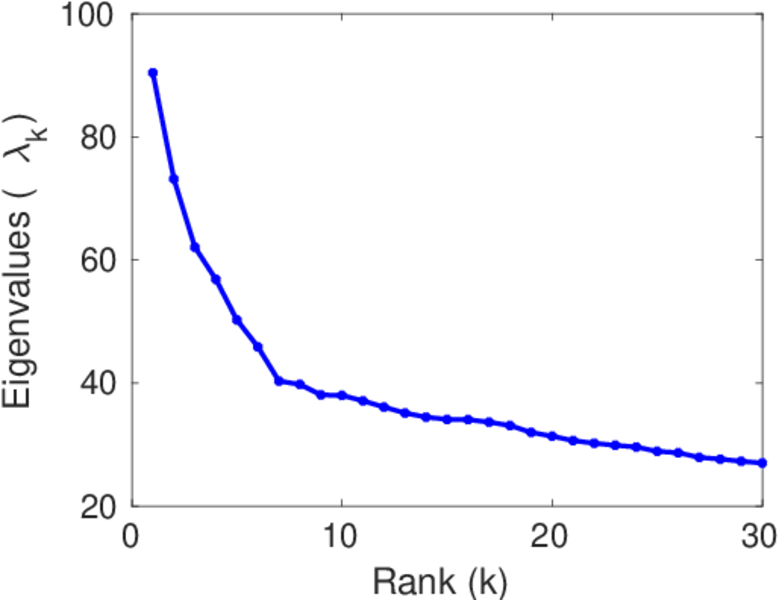
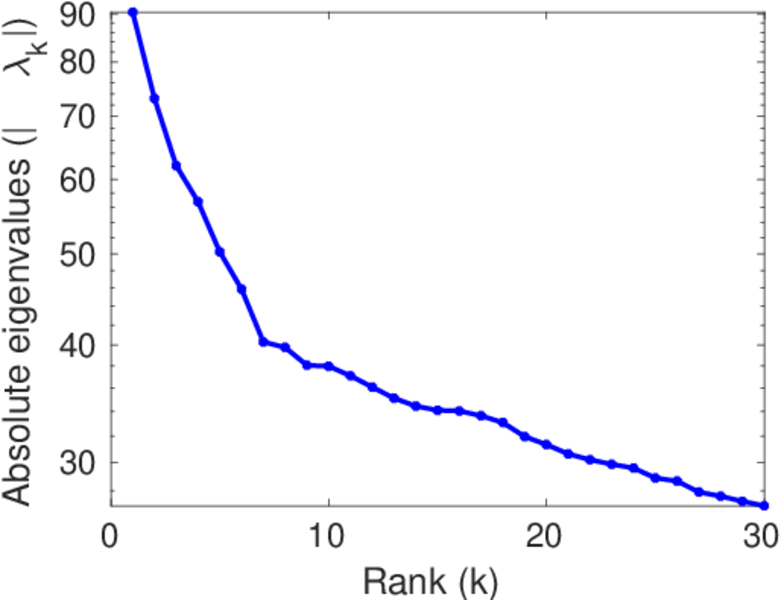
| Spectral norm | α = | 90.377 5
|
| Algebraic connectivity | a = | 0.009 221 19
|
| Spectral separation | |λ1[A] / λ2[A]| = | 1.235 41
|
| Controllability | C = | 73,201
|
| Relative controllability | Cr = | 0.588 787
|
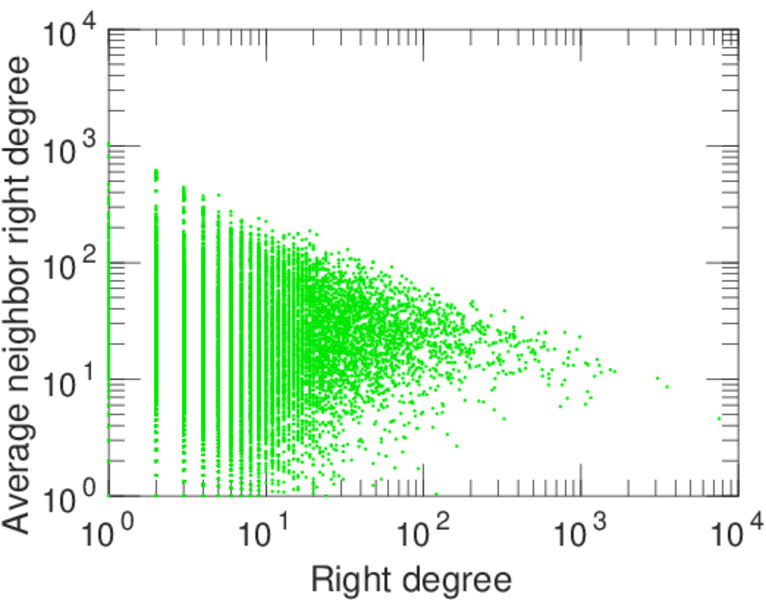
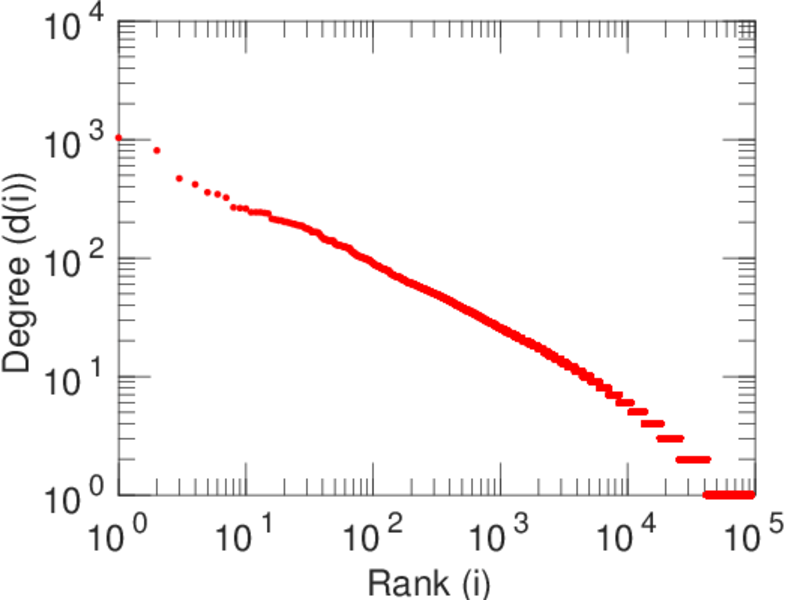
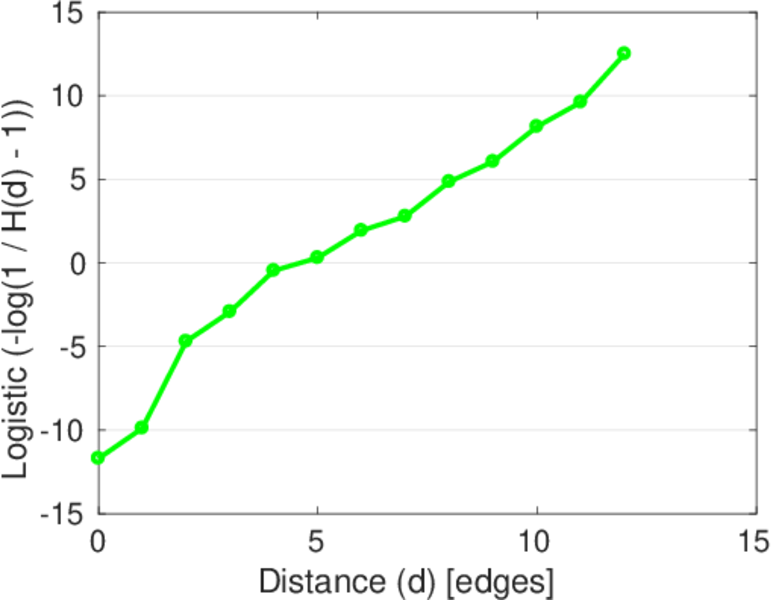
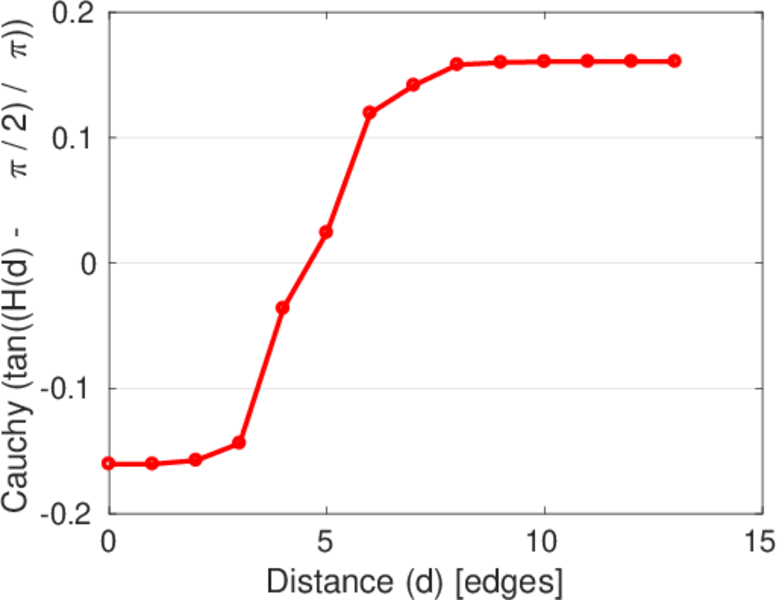
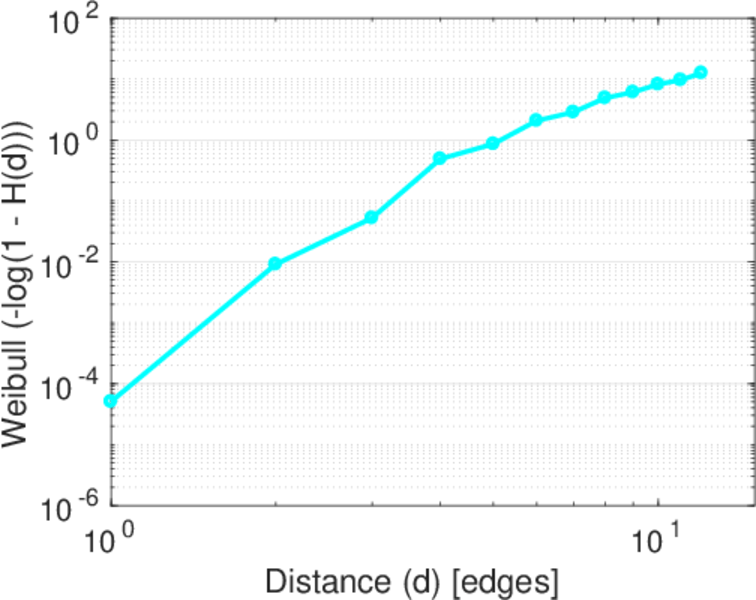
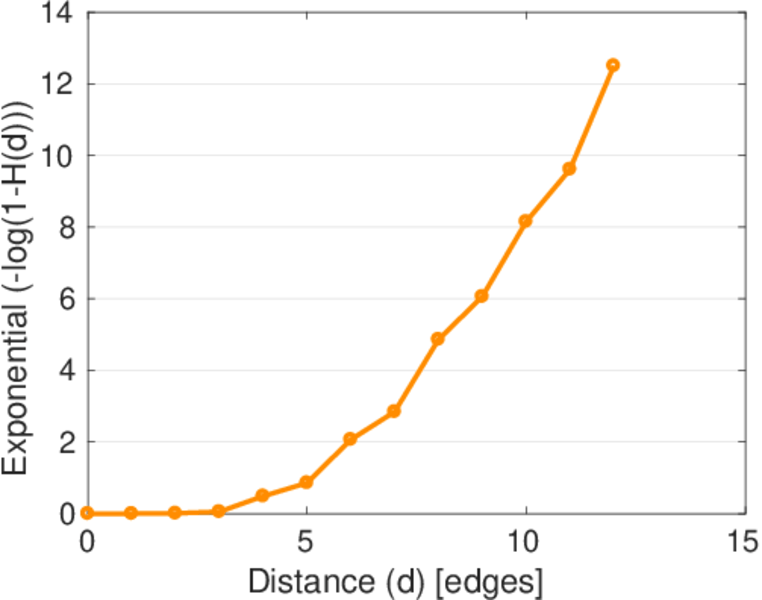
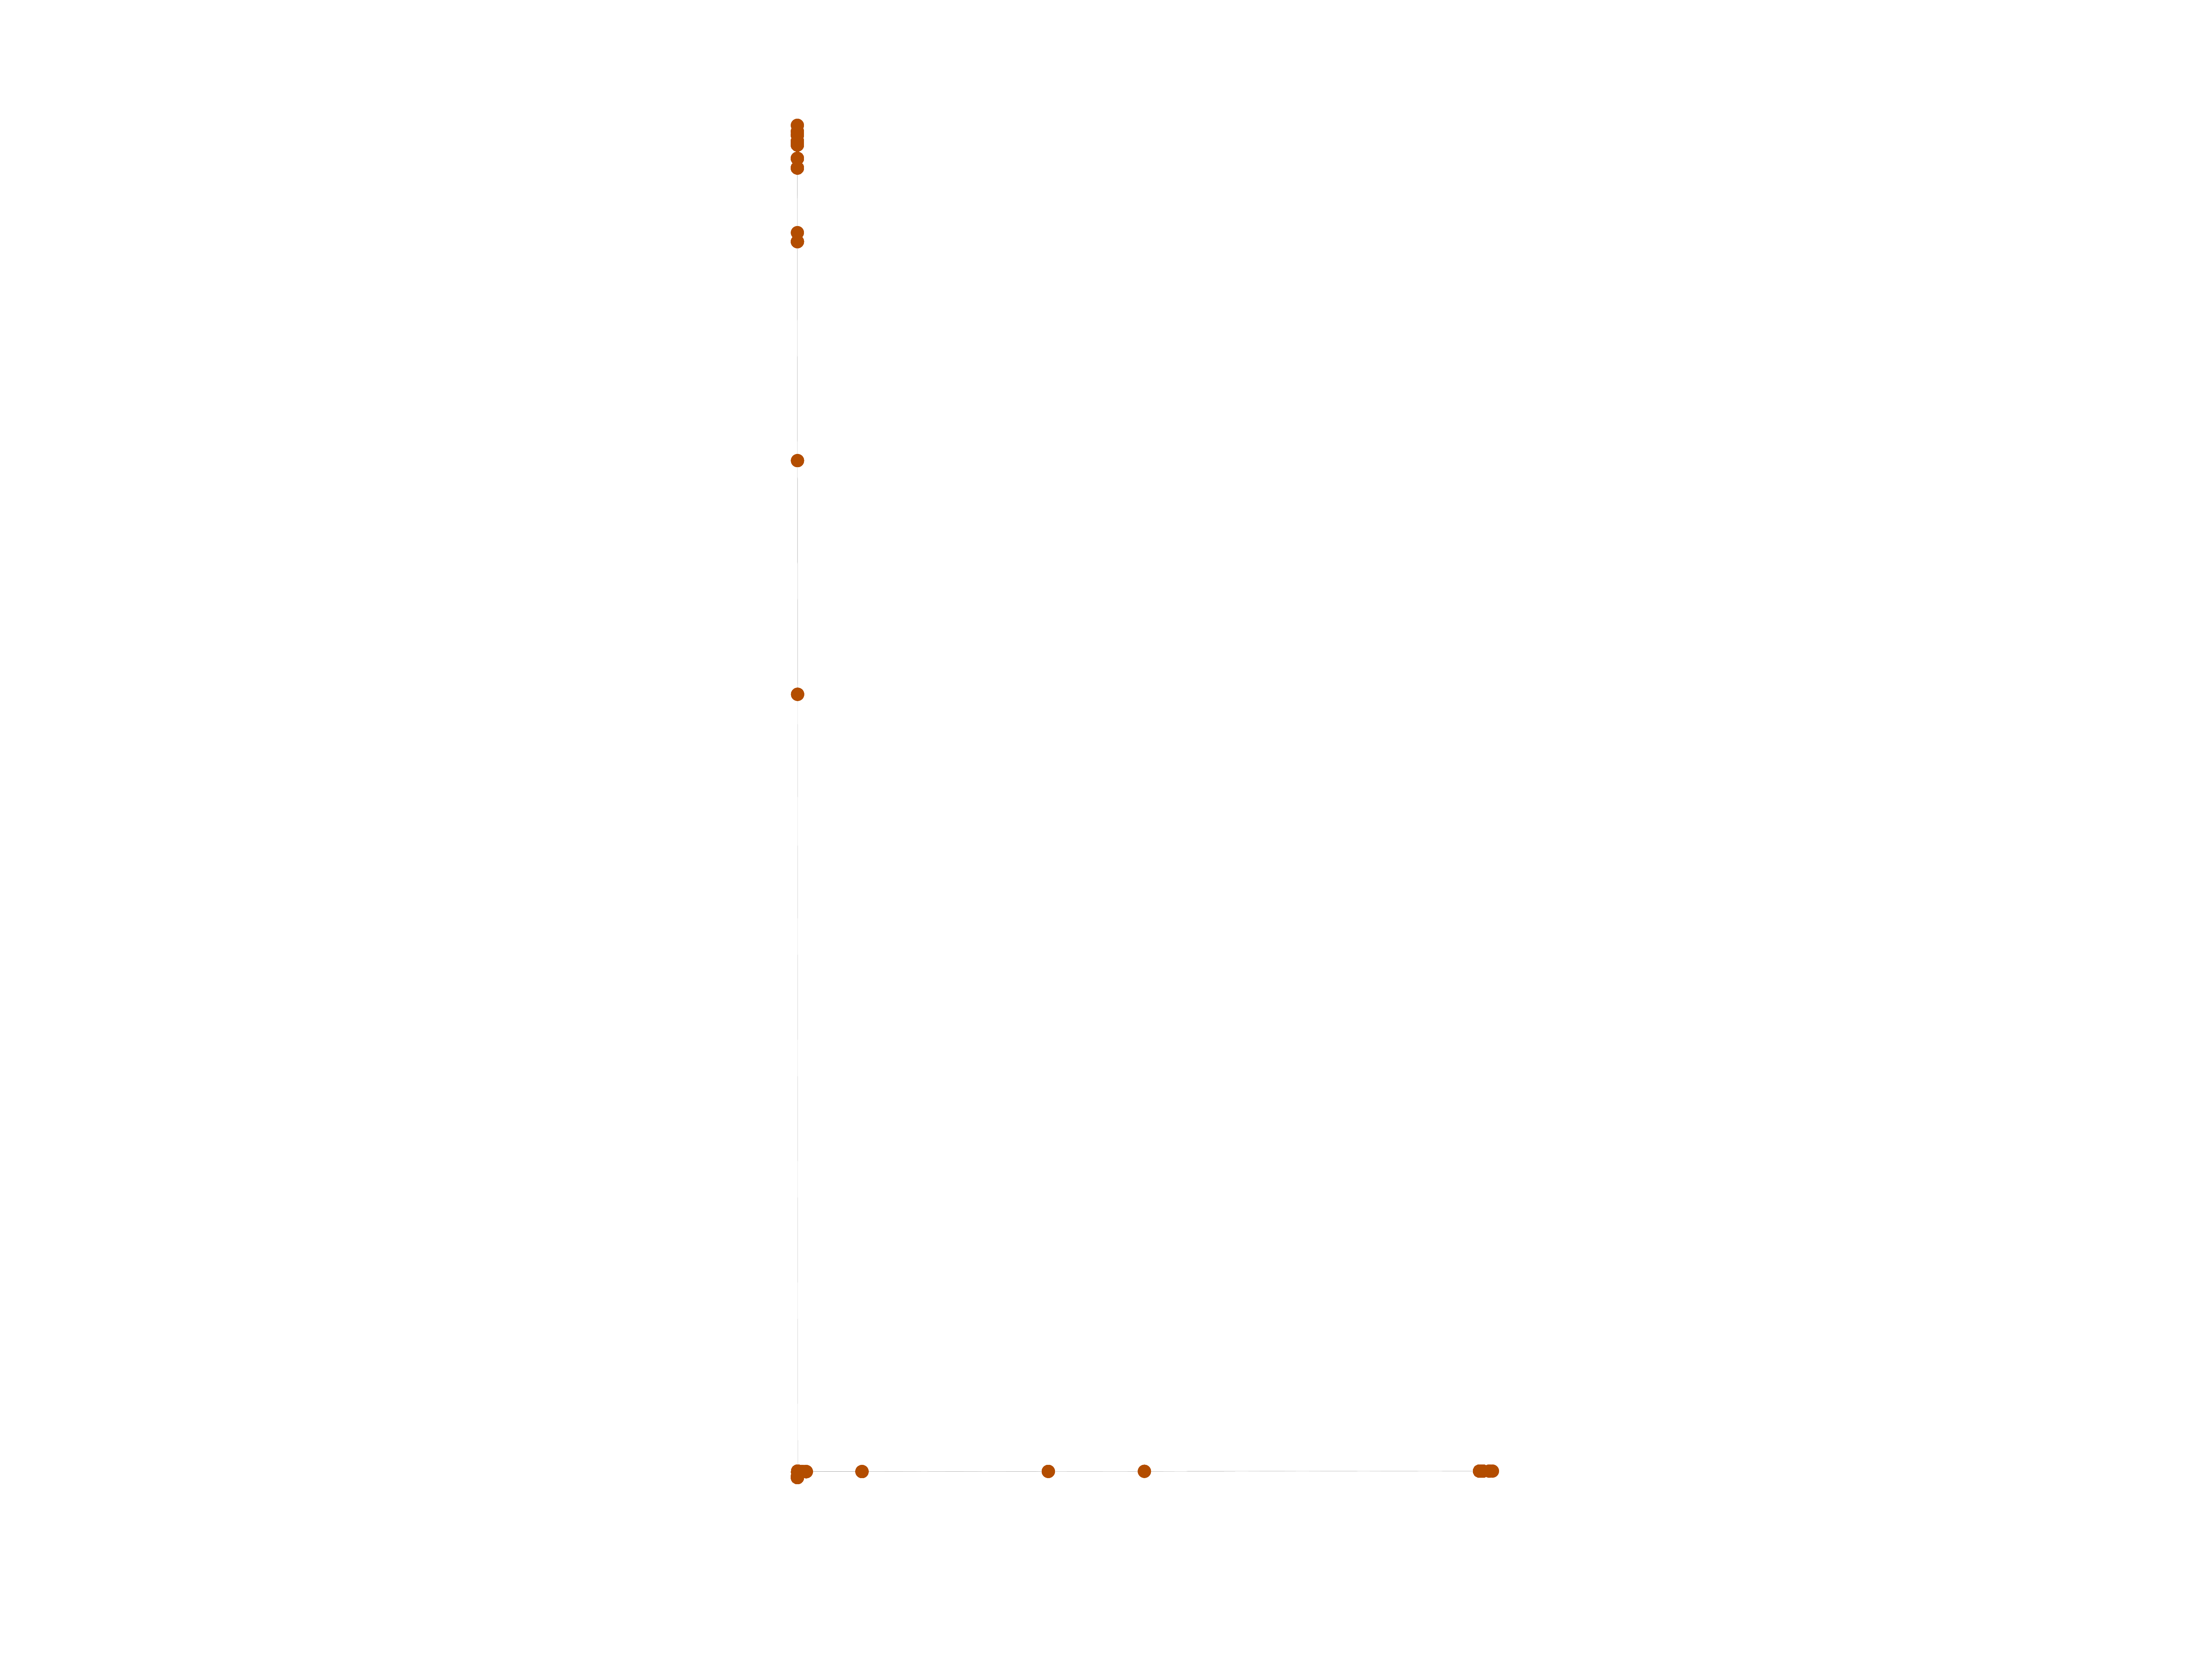
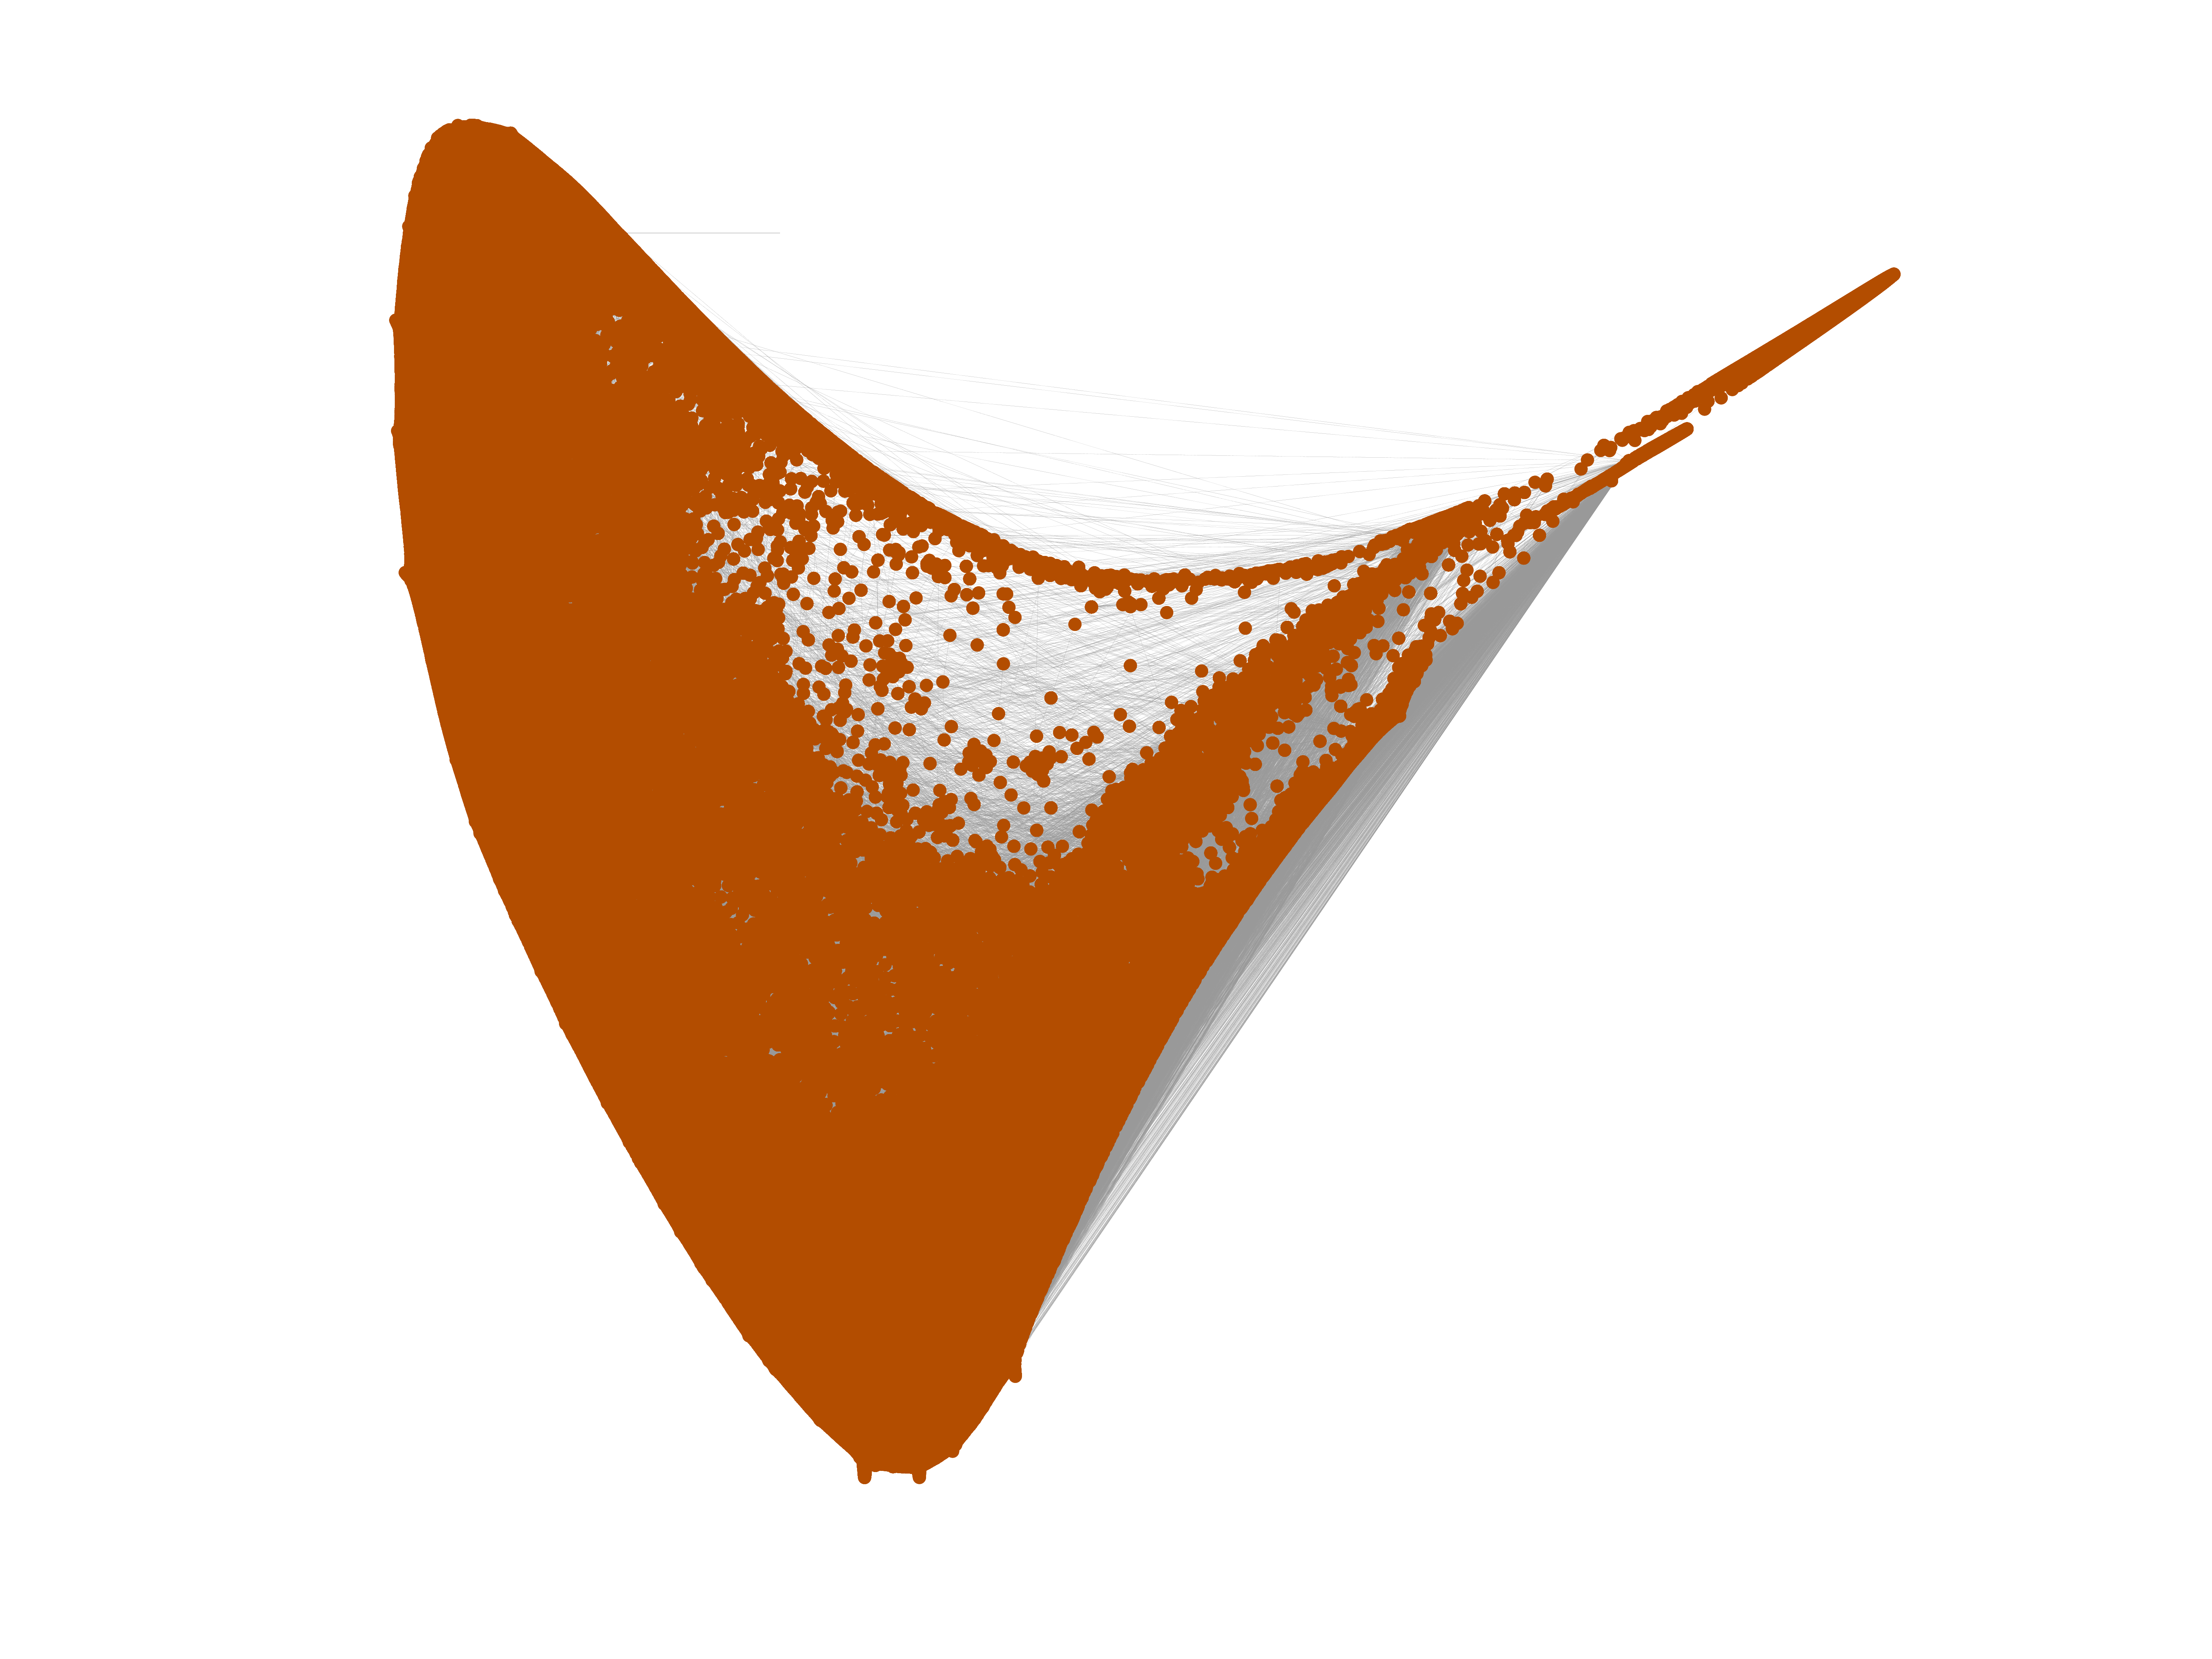
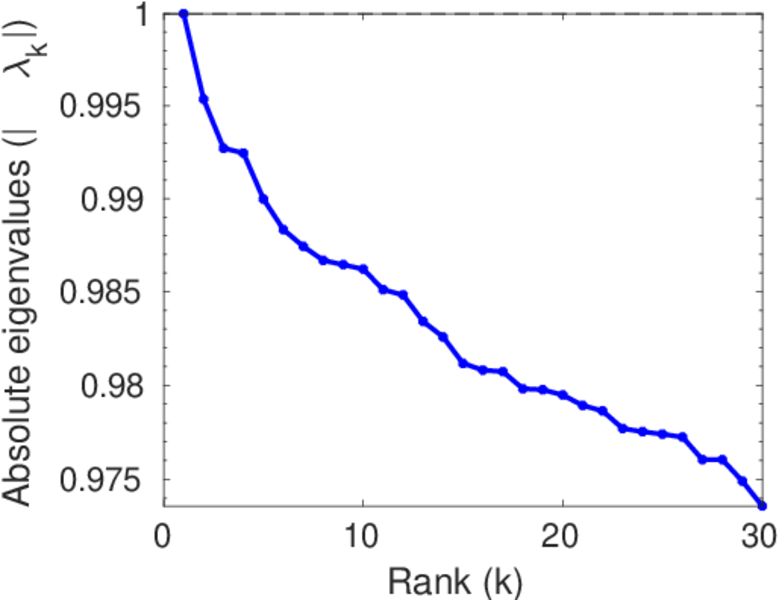
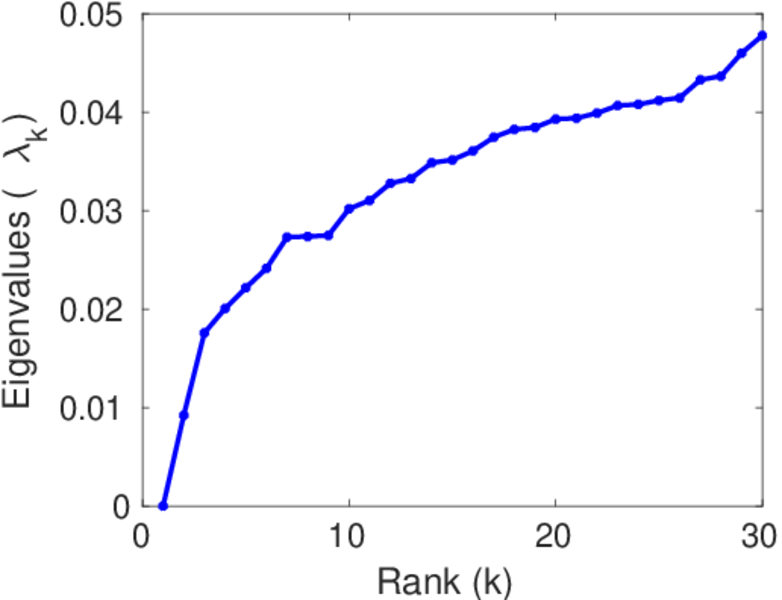
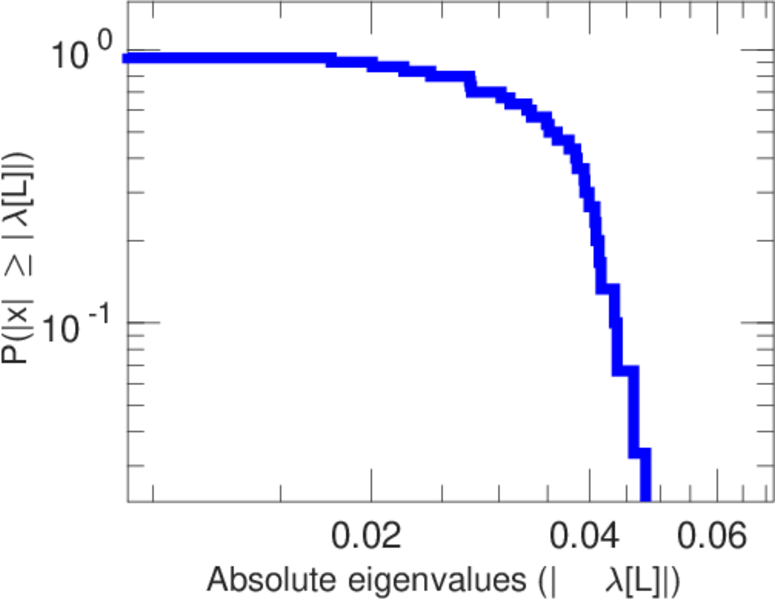
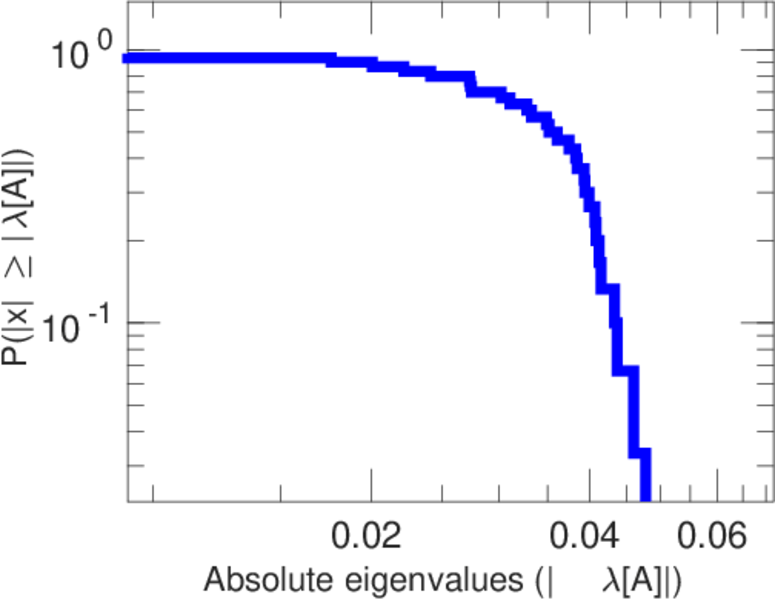
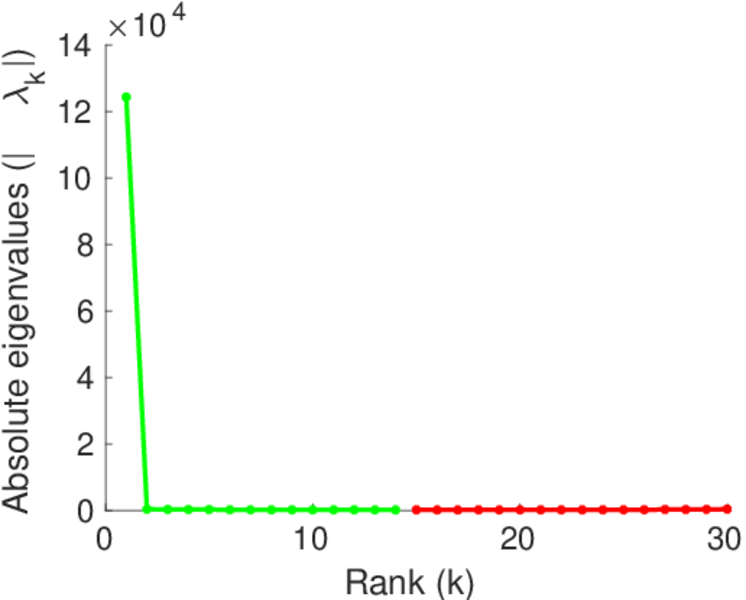
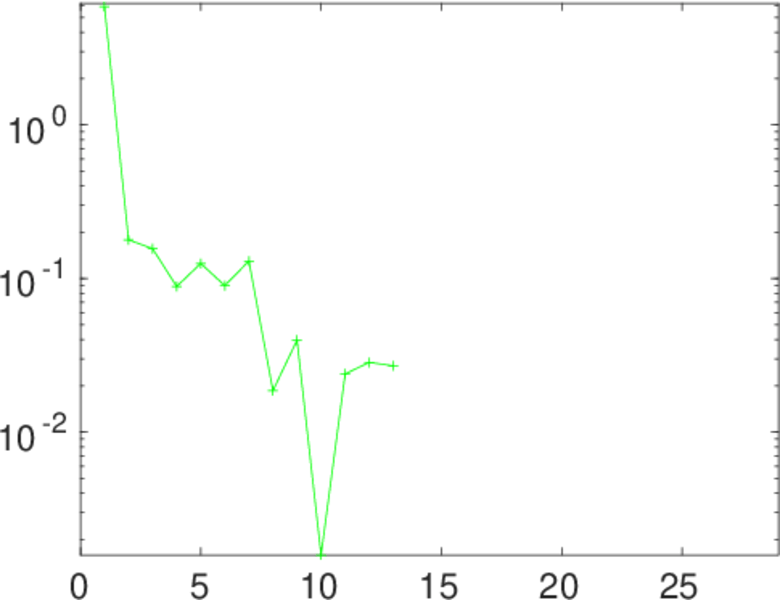
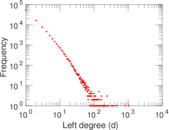
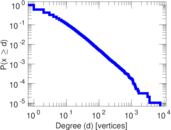
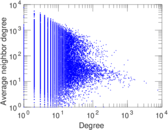
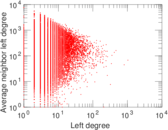
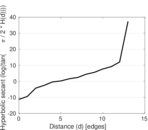
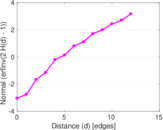
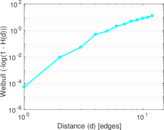
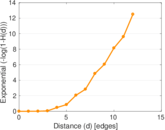
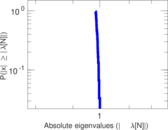
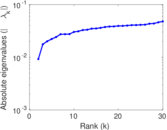
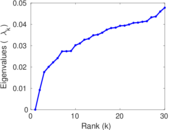
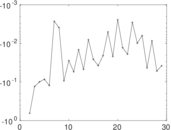
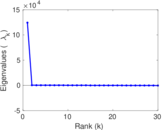
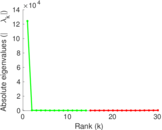
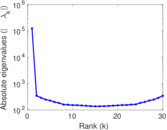
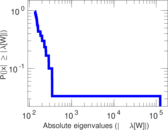
Plots


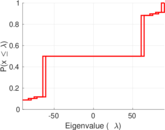
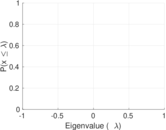


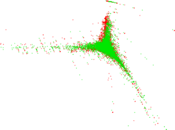
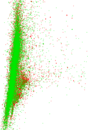


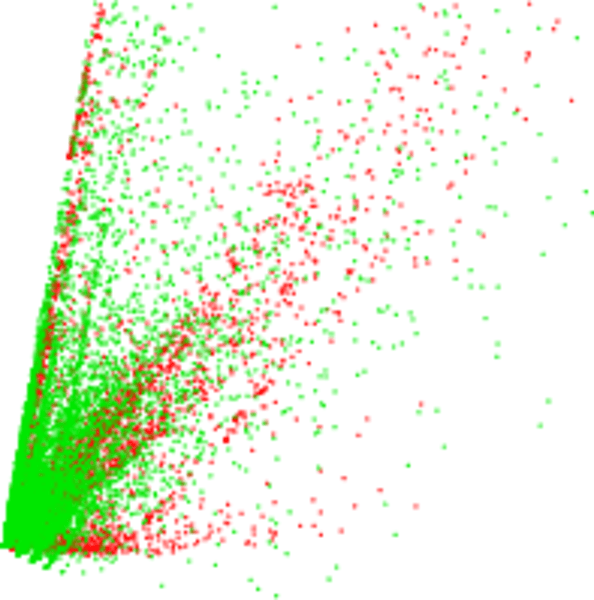
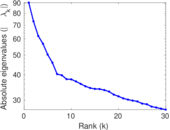
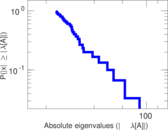
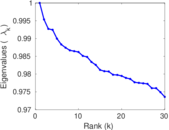
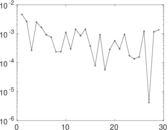
Matrix decompositions plots


Downloads
References
|
[1]
|
Jérôme Kunegis.
KONECT – The Koblenz Network Collection.
In Proc. Int. Conf. on World Wide Web Companion, pages
1343–1350, 2013.
[ http ]
|
|
[2]
|
Alan Mislove.
Online Social Networks: Measurement, Analysis, and Applications
to Distributed Information Systems.
PhD thesis, Rice Univ., 2009.
|
 KONECT ‣ Networks ‣
Buy Me a Coffee
KONECT ‣ Networks ‣
Buy Me a Coffee