Enron words
This is the bipartite document–word dataset of Enron words. Left nodes are
documents and right nodes are words. Edge weights are multiplicities.
Metadata
Statistics
| Size | n = | 67,960
|
| Left size | n1 = | 39,861
|
| Right size | n2 = | 28,099
|
| Volume | m = | 6,412,172
|
| Unique edge count | m̿ = | 3,710,420
|
| Wedge count | s = | 3,214,624,476
|
| Claw count | z = | 2,510,007,422,598
|
| Cross count | x = | 2,191,825,474,071,012
|
| Square count | q = | 45,471,014,642
|
| 4-Tour count | T4 = | 376,634,510,028
|
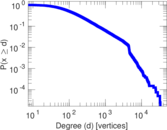
| Maximum degree | dmax = | 7,190
|
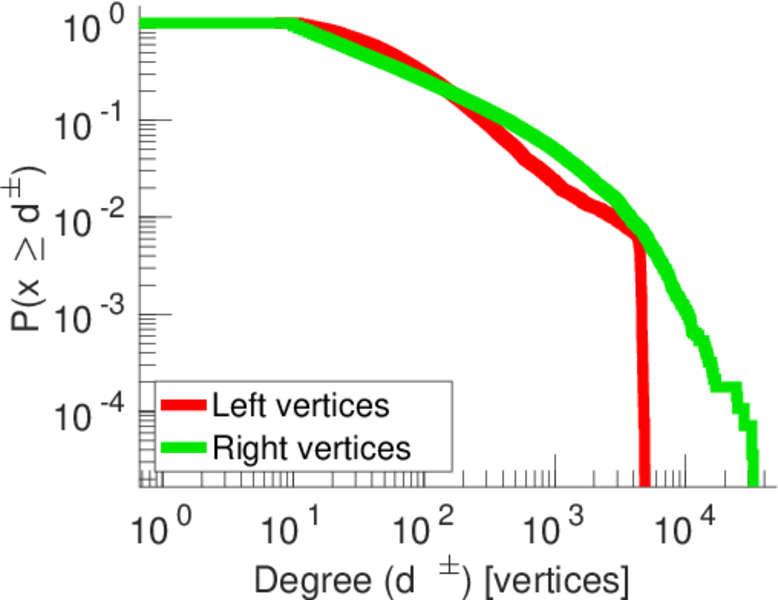
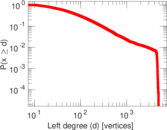
| Maximum left degree | d1max = | 2,120
|
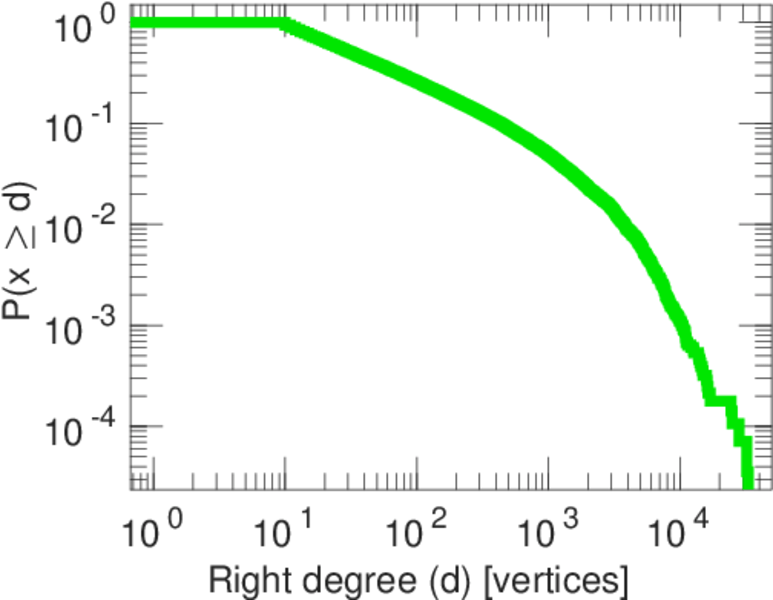
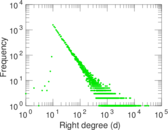
| Maximum right degree | d2max = | 7,190
|
| Average degree | d = | 188.704
|
| Average left degree | d1 = | 160.863
|
| Average right degree | d2 = | 228.199
|
| Fill | p = | 0.003 312 71
|
| Average edge multiplicity | m̃ = | 1.728 15
|
| Size of LCC | N = | 67,960
|
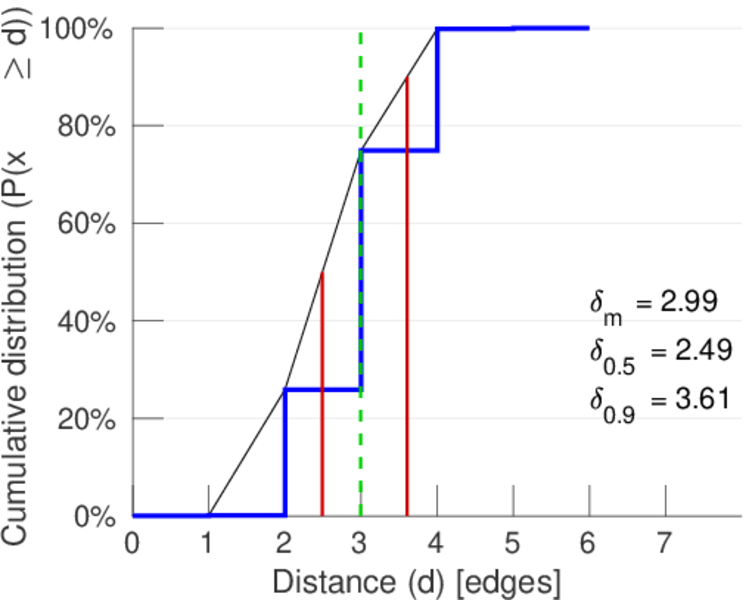
| Diameter | δ = | 6
|
| 50-Percentile effective diameter | δ0.5 = | 2.492 21
|
| 90-Percentile effective diameter | δ0.9 = | 3.606 21
|
| Median distance | δM = | 3
|
| Mean distance | δm = | 2.992 72
|
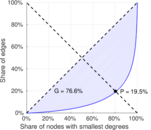
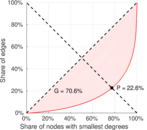
| Gini coefficient | G = | 0.707 894
|
| Balanced inequality ratio | P = | 0.224 254
|
| Left balanced inequality ratio | P1 = | 0.225 645
|
| Right balanced inequality ratio | P2 = | 0.156 346
|
| Relative edge distribution entropy | Her = | 0.897 344
|
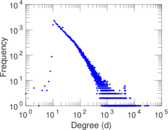
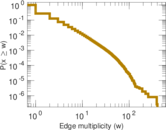
| Power law exponent | γ = | 1.269 14
|
| Tail power law exponent | γt = | 1.991 00
|
| Degree assortativity | ρ = | −0.174 109
|
| Degree assortativity p-value | pρ = | 0.000 00
|
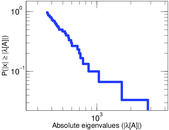
| Spectral separation | |λ1[A] / λ2[A]| = | 1.700 69
|
| Controllability | C = | 14,724
|
| Relative controllability | Cr = | 0.216 657
|
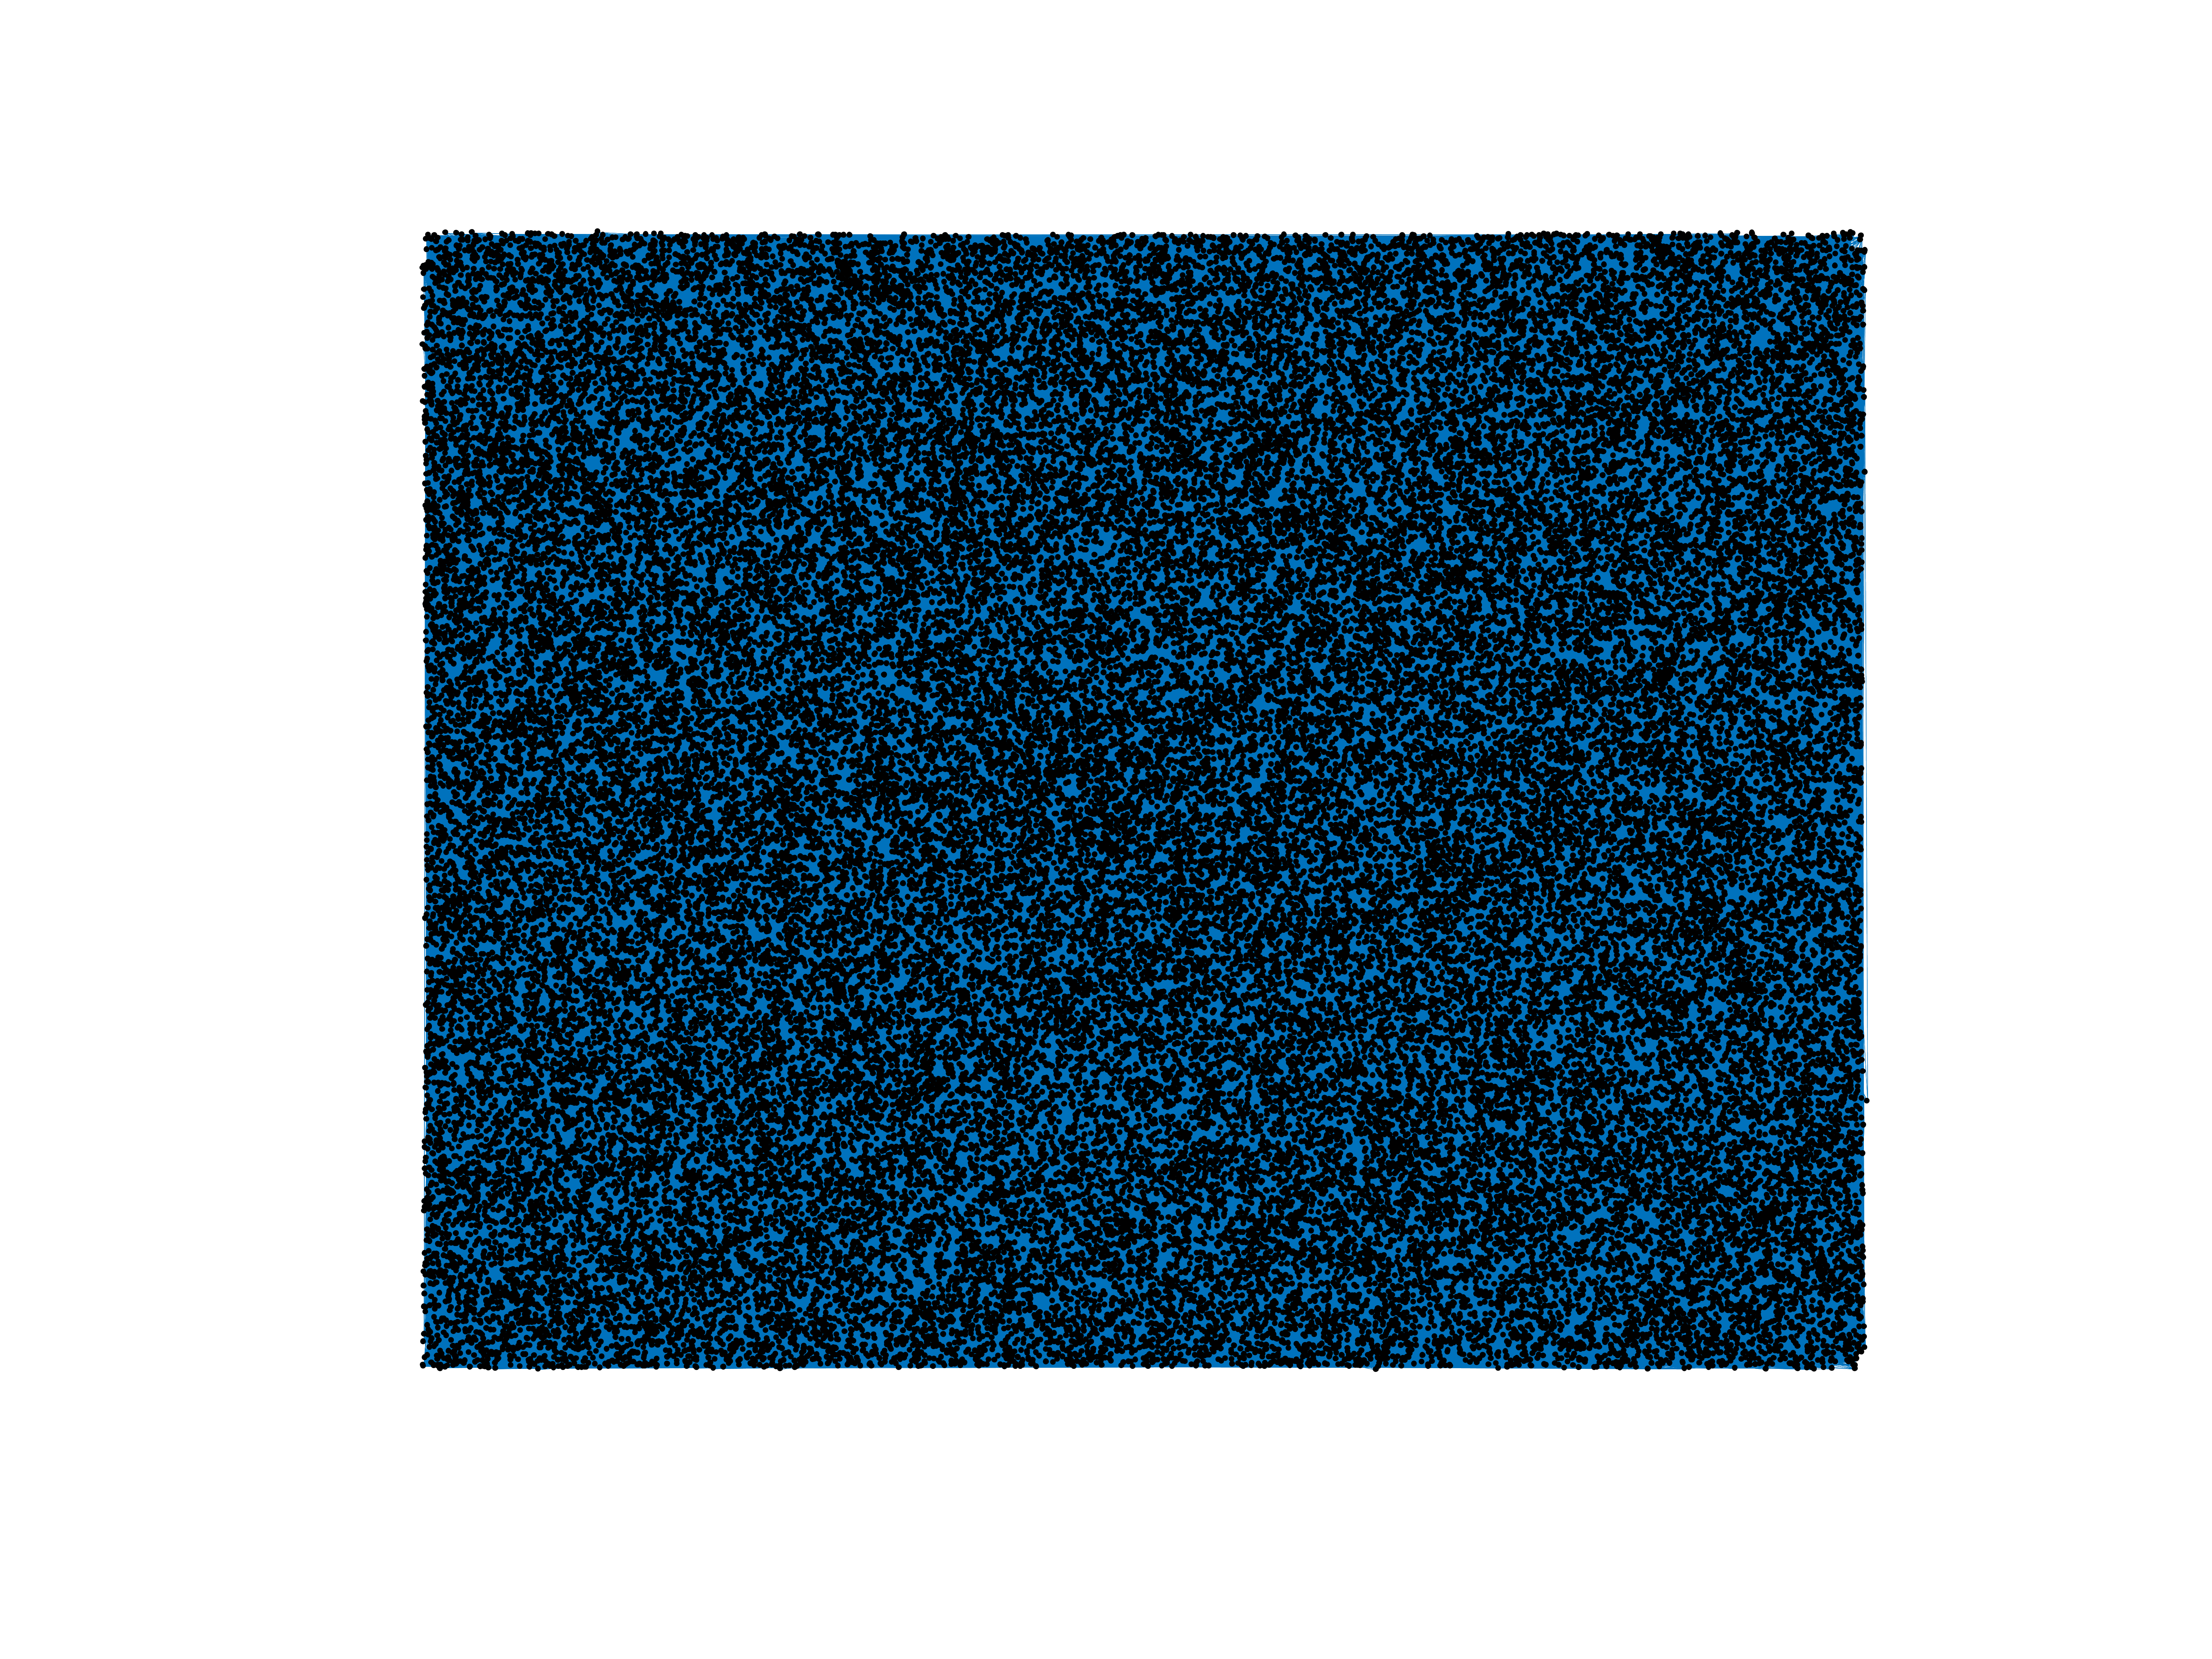
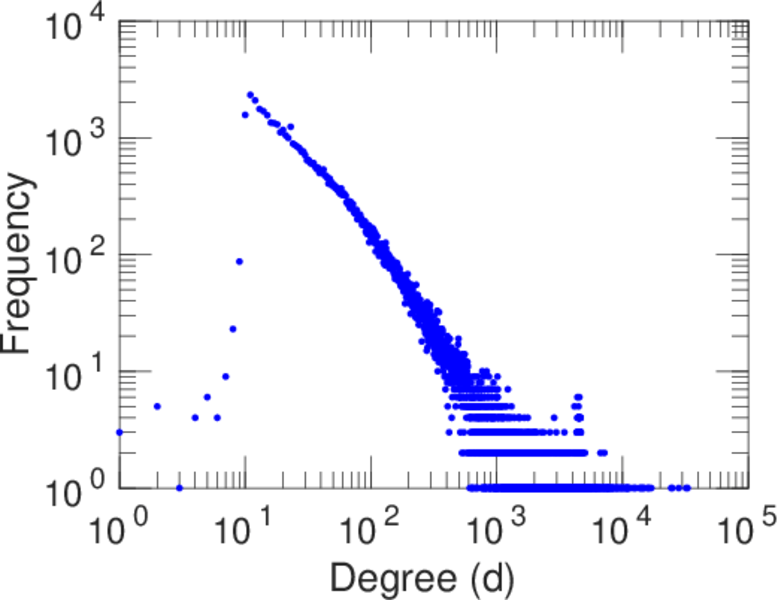
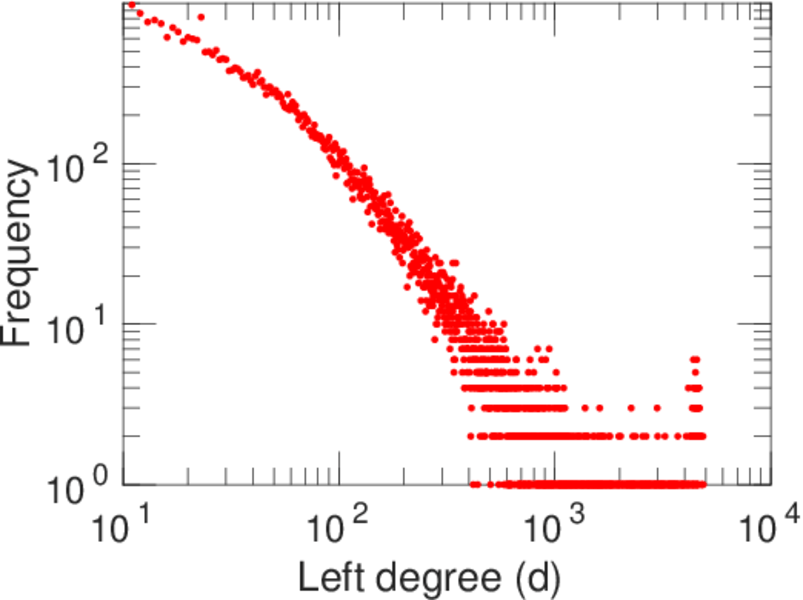
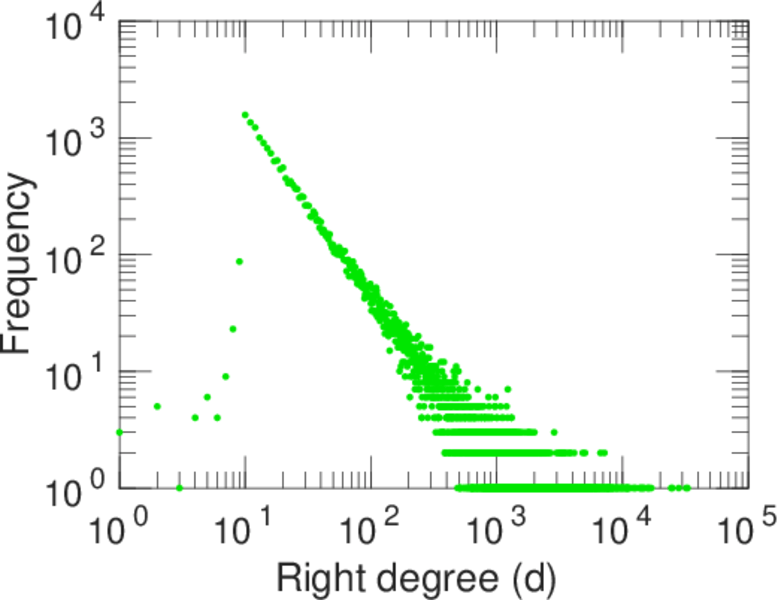
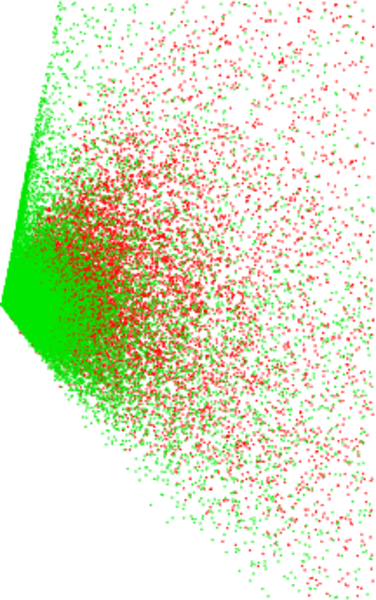
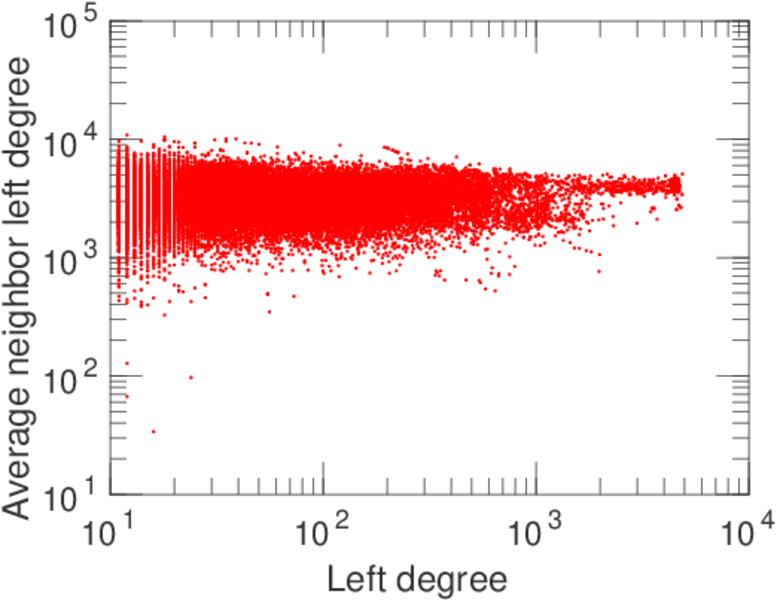
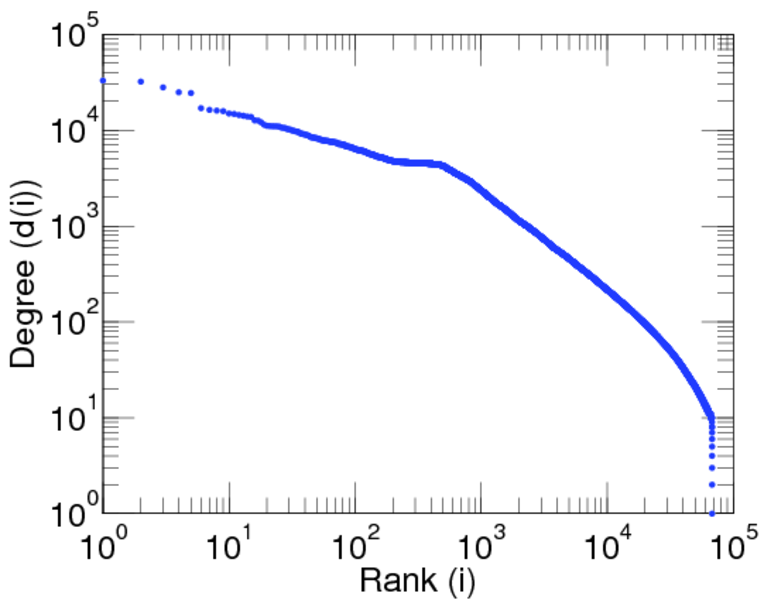
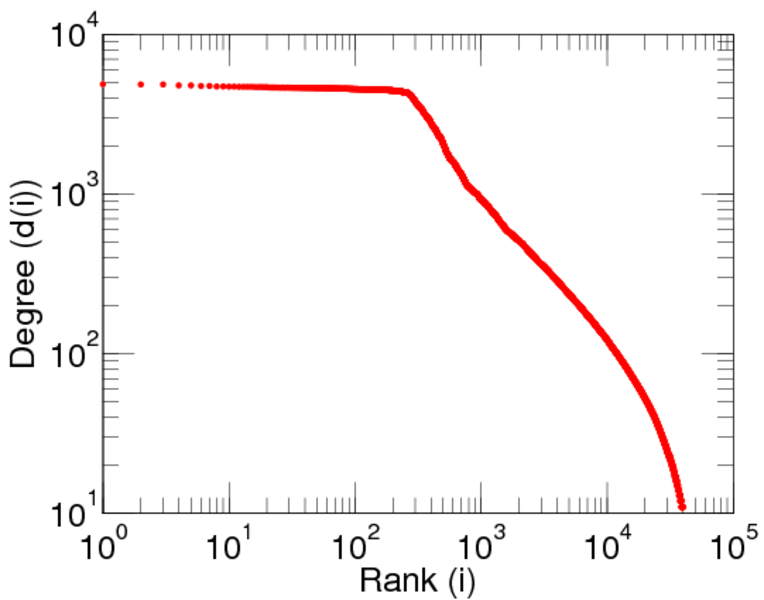
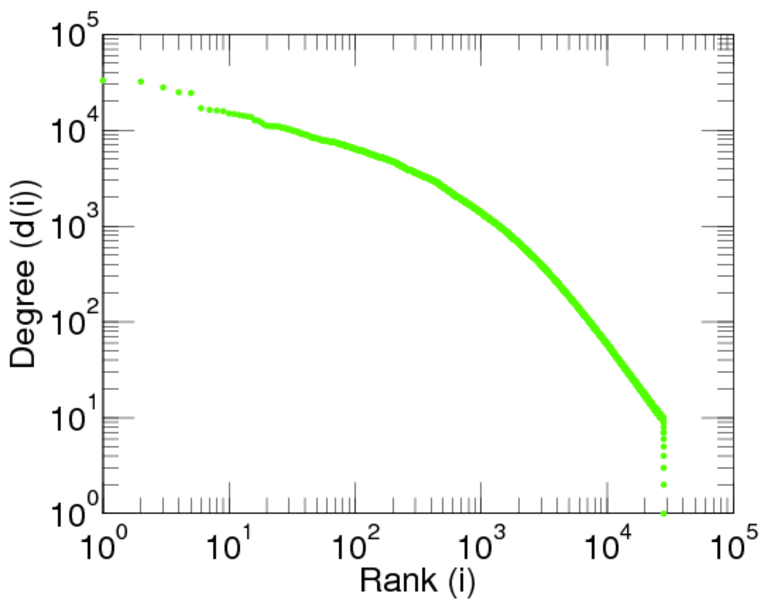
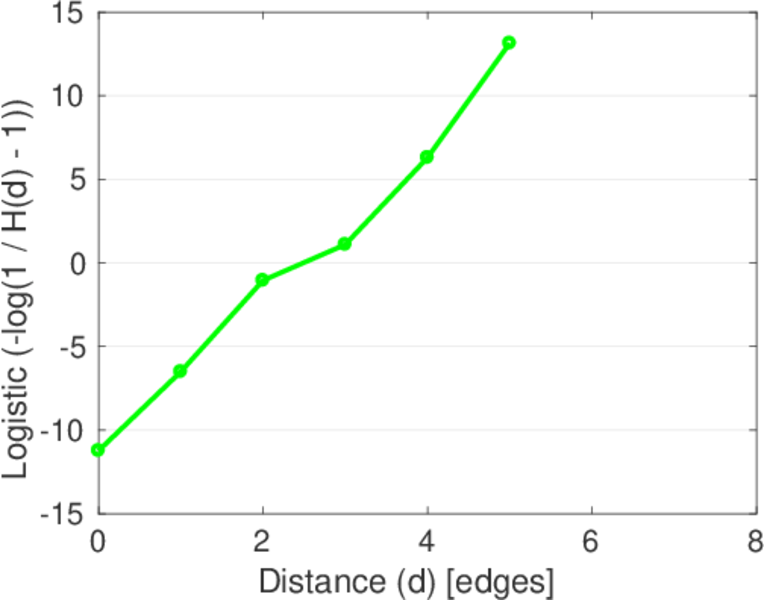
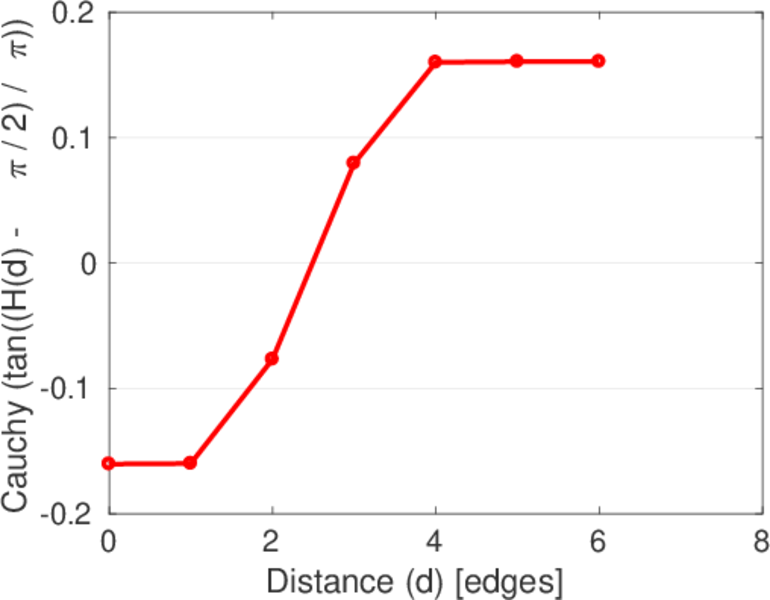
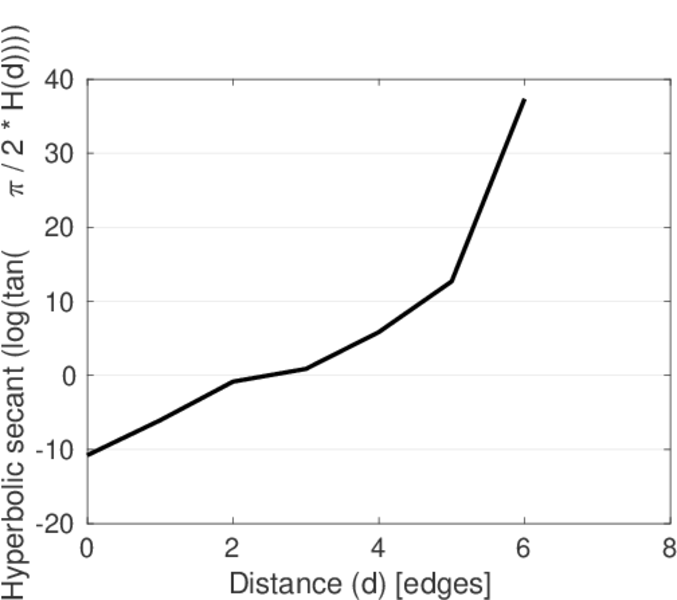
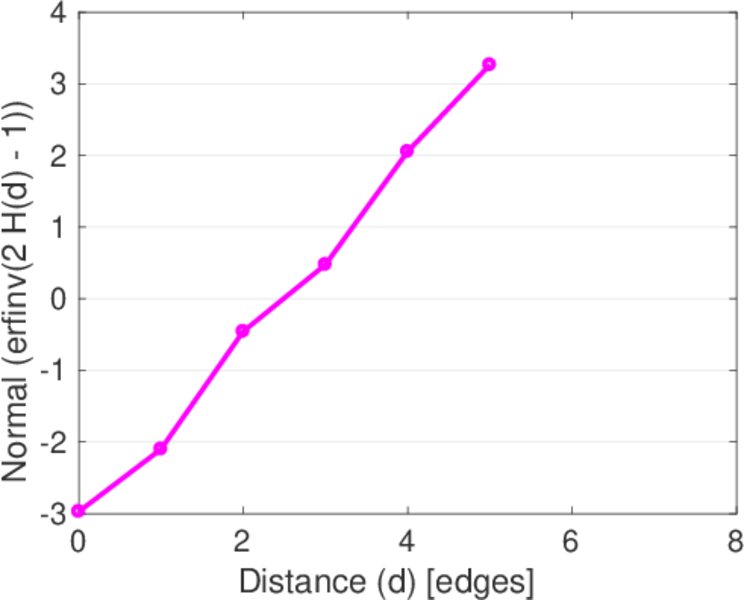
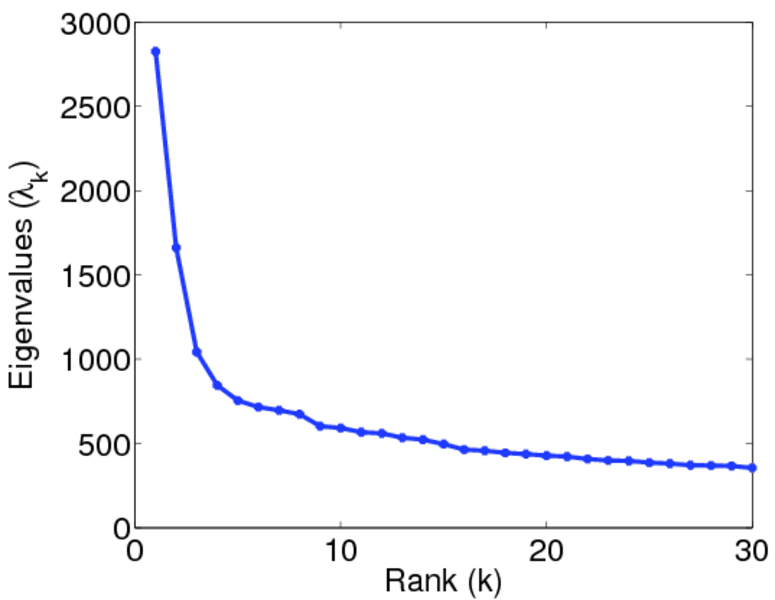
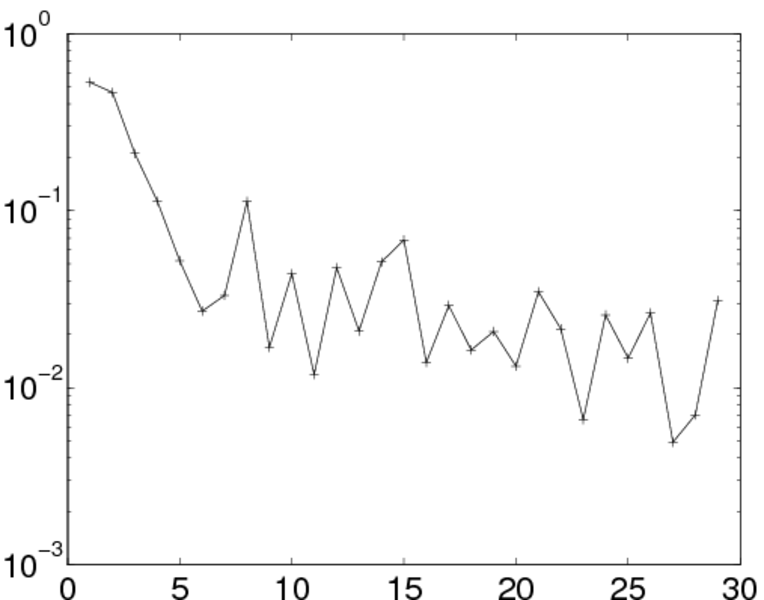
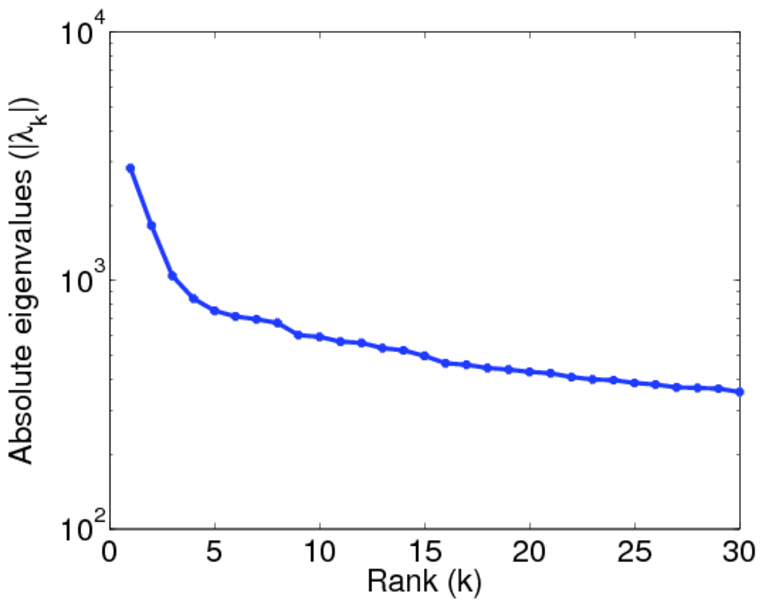
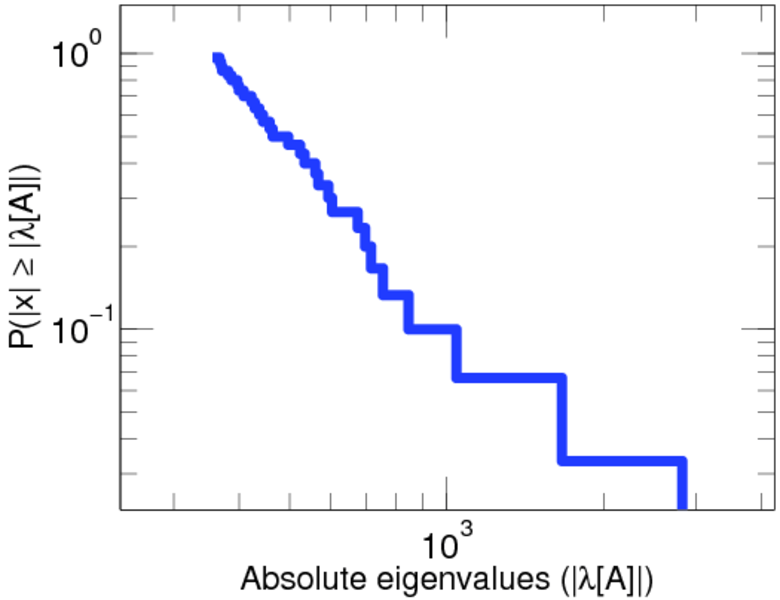
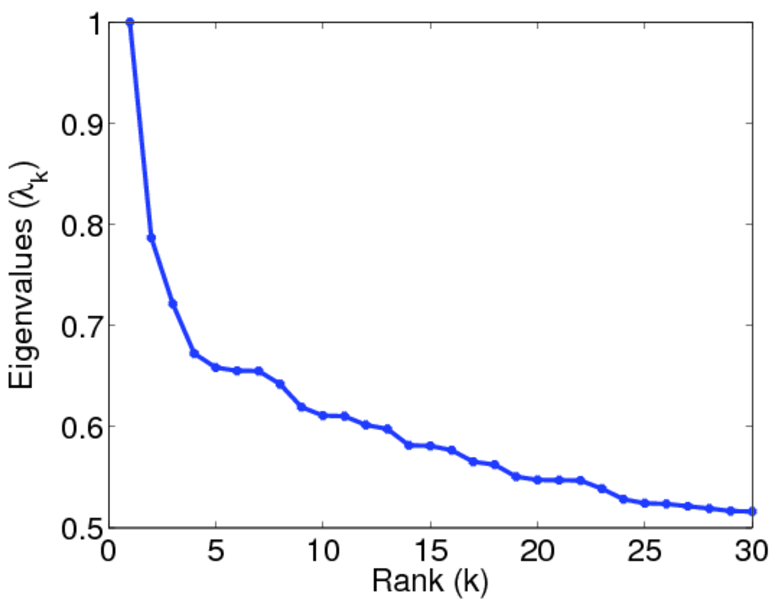
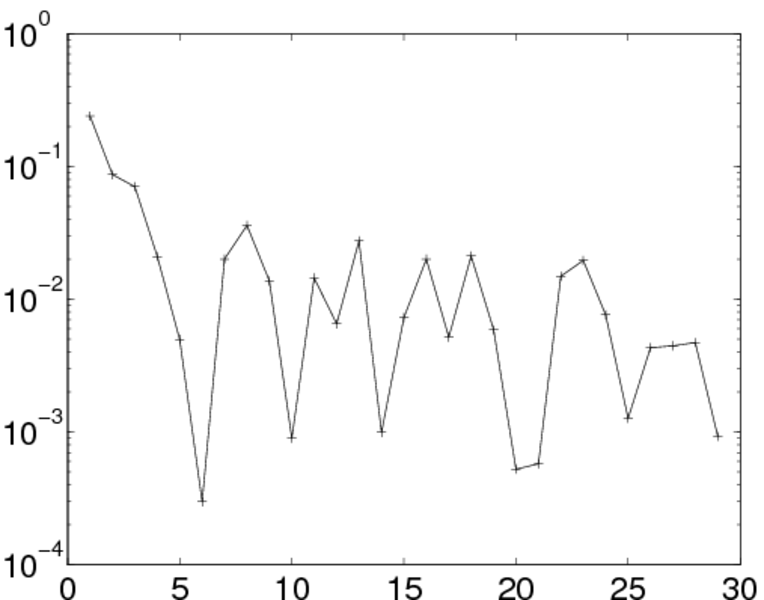
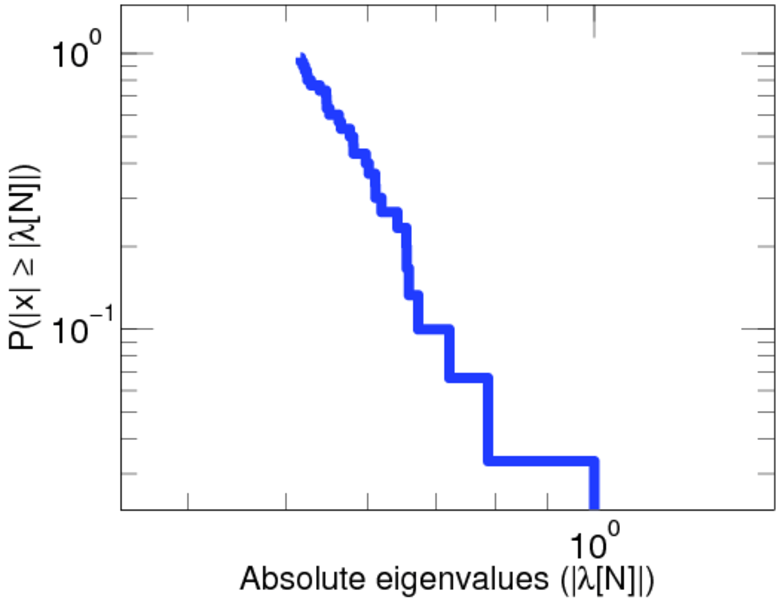
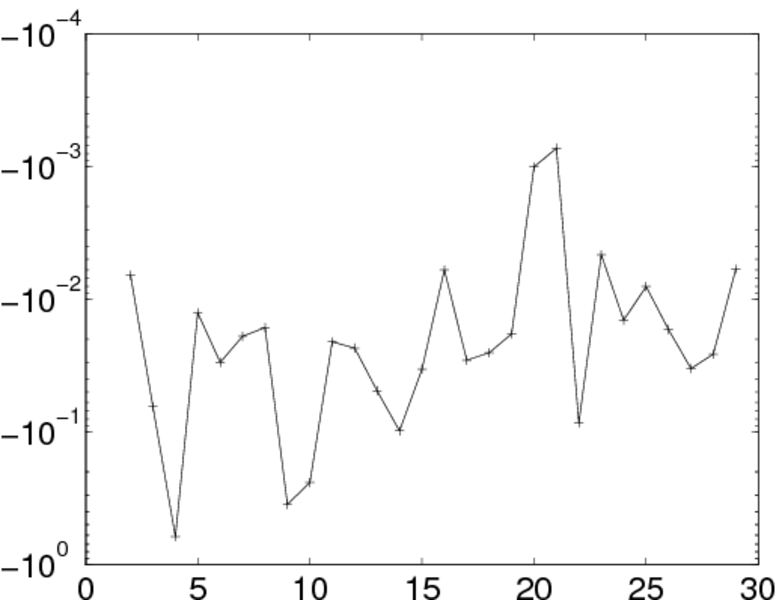
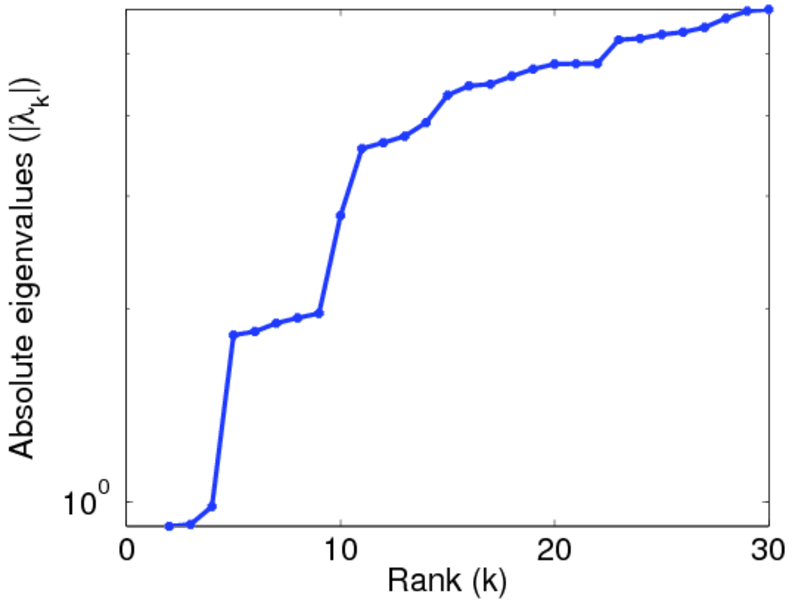
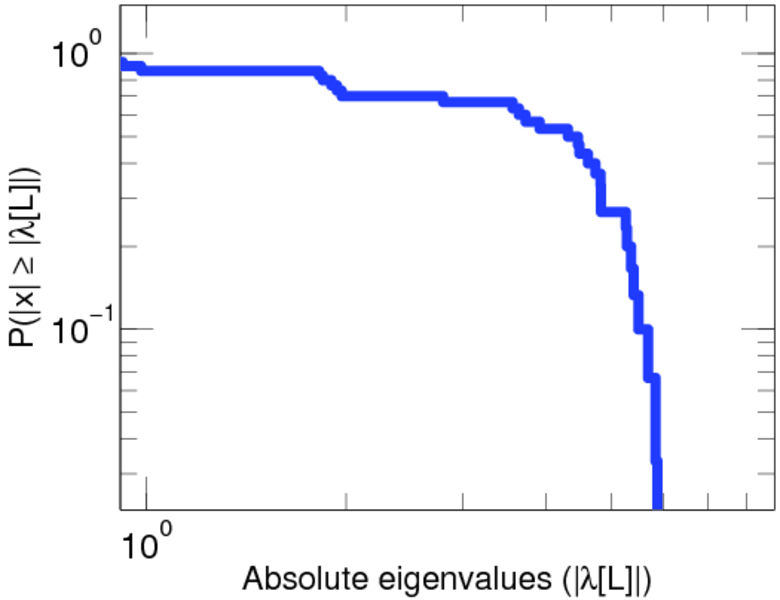
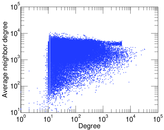
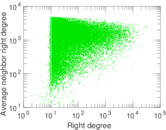
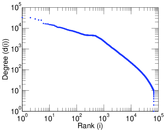
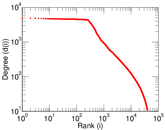
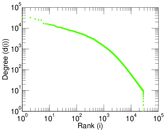
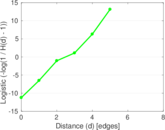
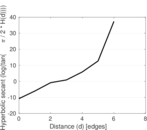
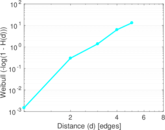
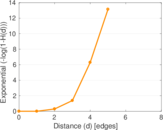
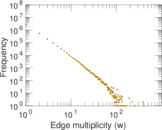
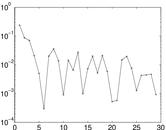
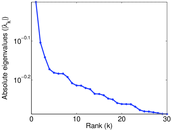
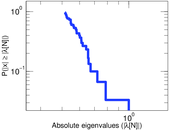
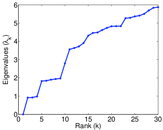
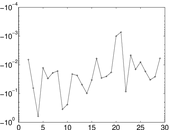
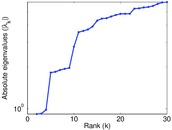
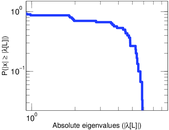
Plots


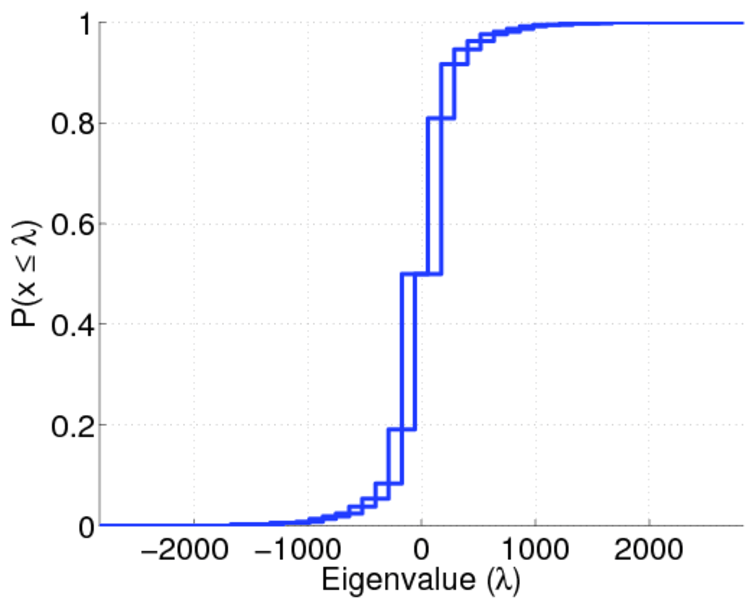
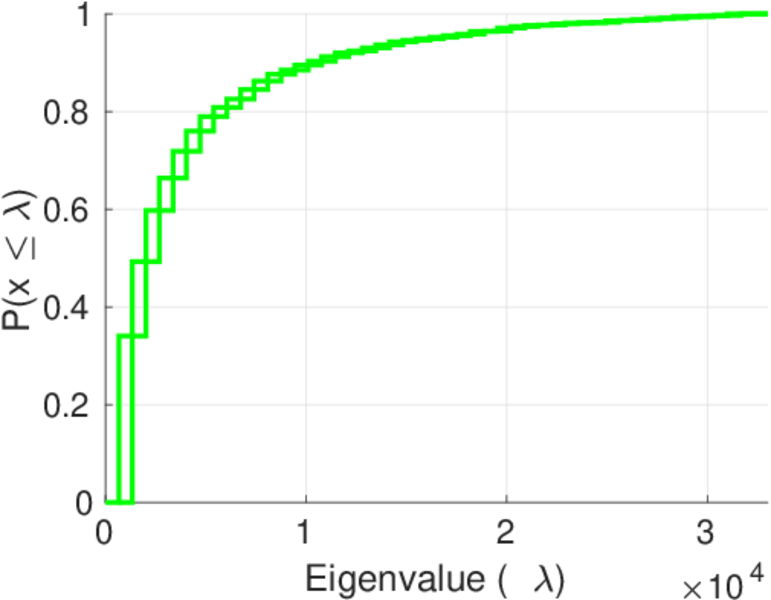
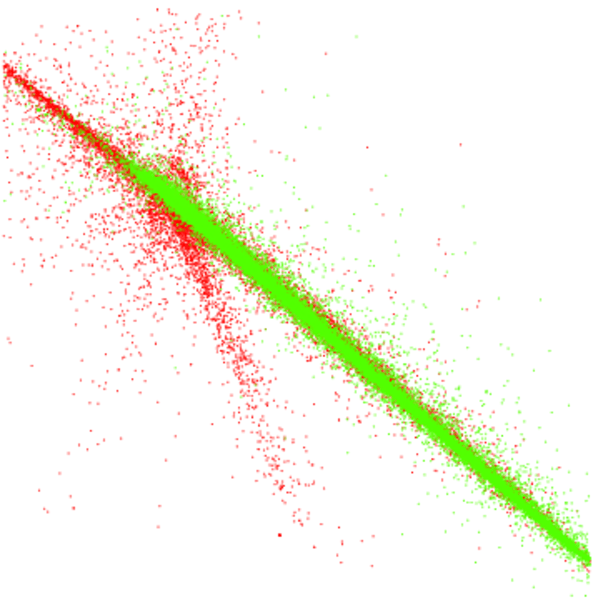
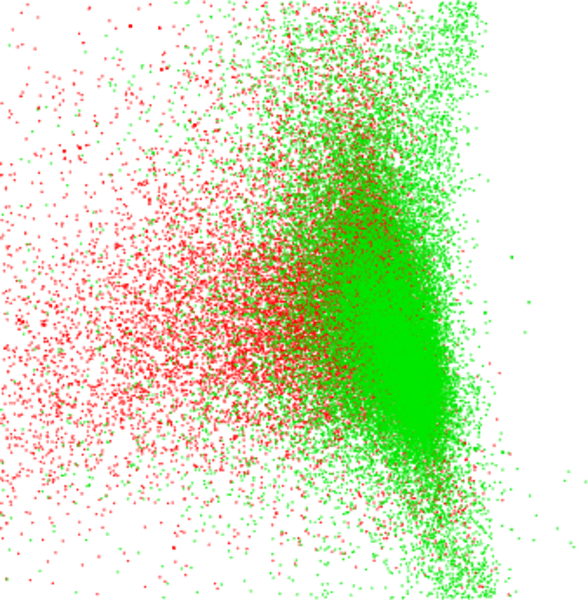
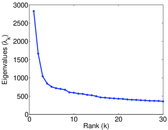
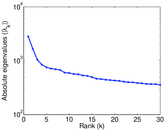
Matrix decompositions plots


Downloads
References
|
[1]
|
Jérôme Kunegis.
KONECT – The Koblenz Network Collection.
In Proc. Int. Conf. on World Wide Web Companion, pages
1343–1350, 2013.
[ http ]
|
|
[2]
|
M. Lichman.
UCI Machine Learning Repository, 2013.
[ http ]
|
 KONECT ‣ Networks ‣
Buy Me a Coffee
KONECT ‣ Networks ‣
Buy Me a Coffee