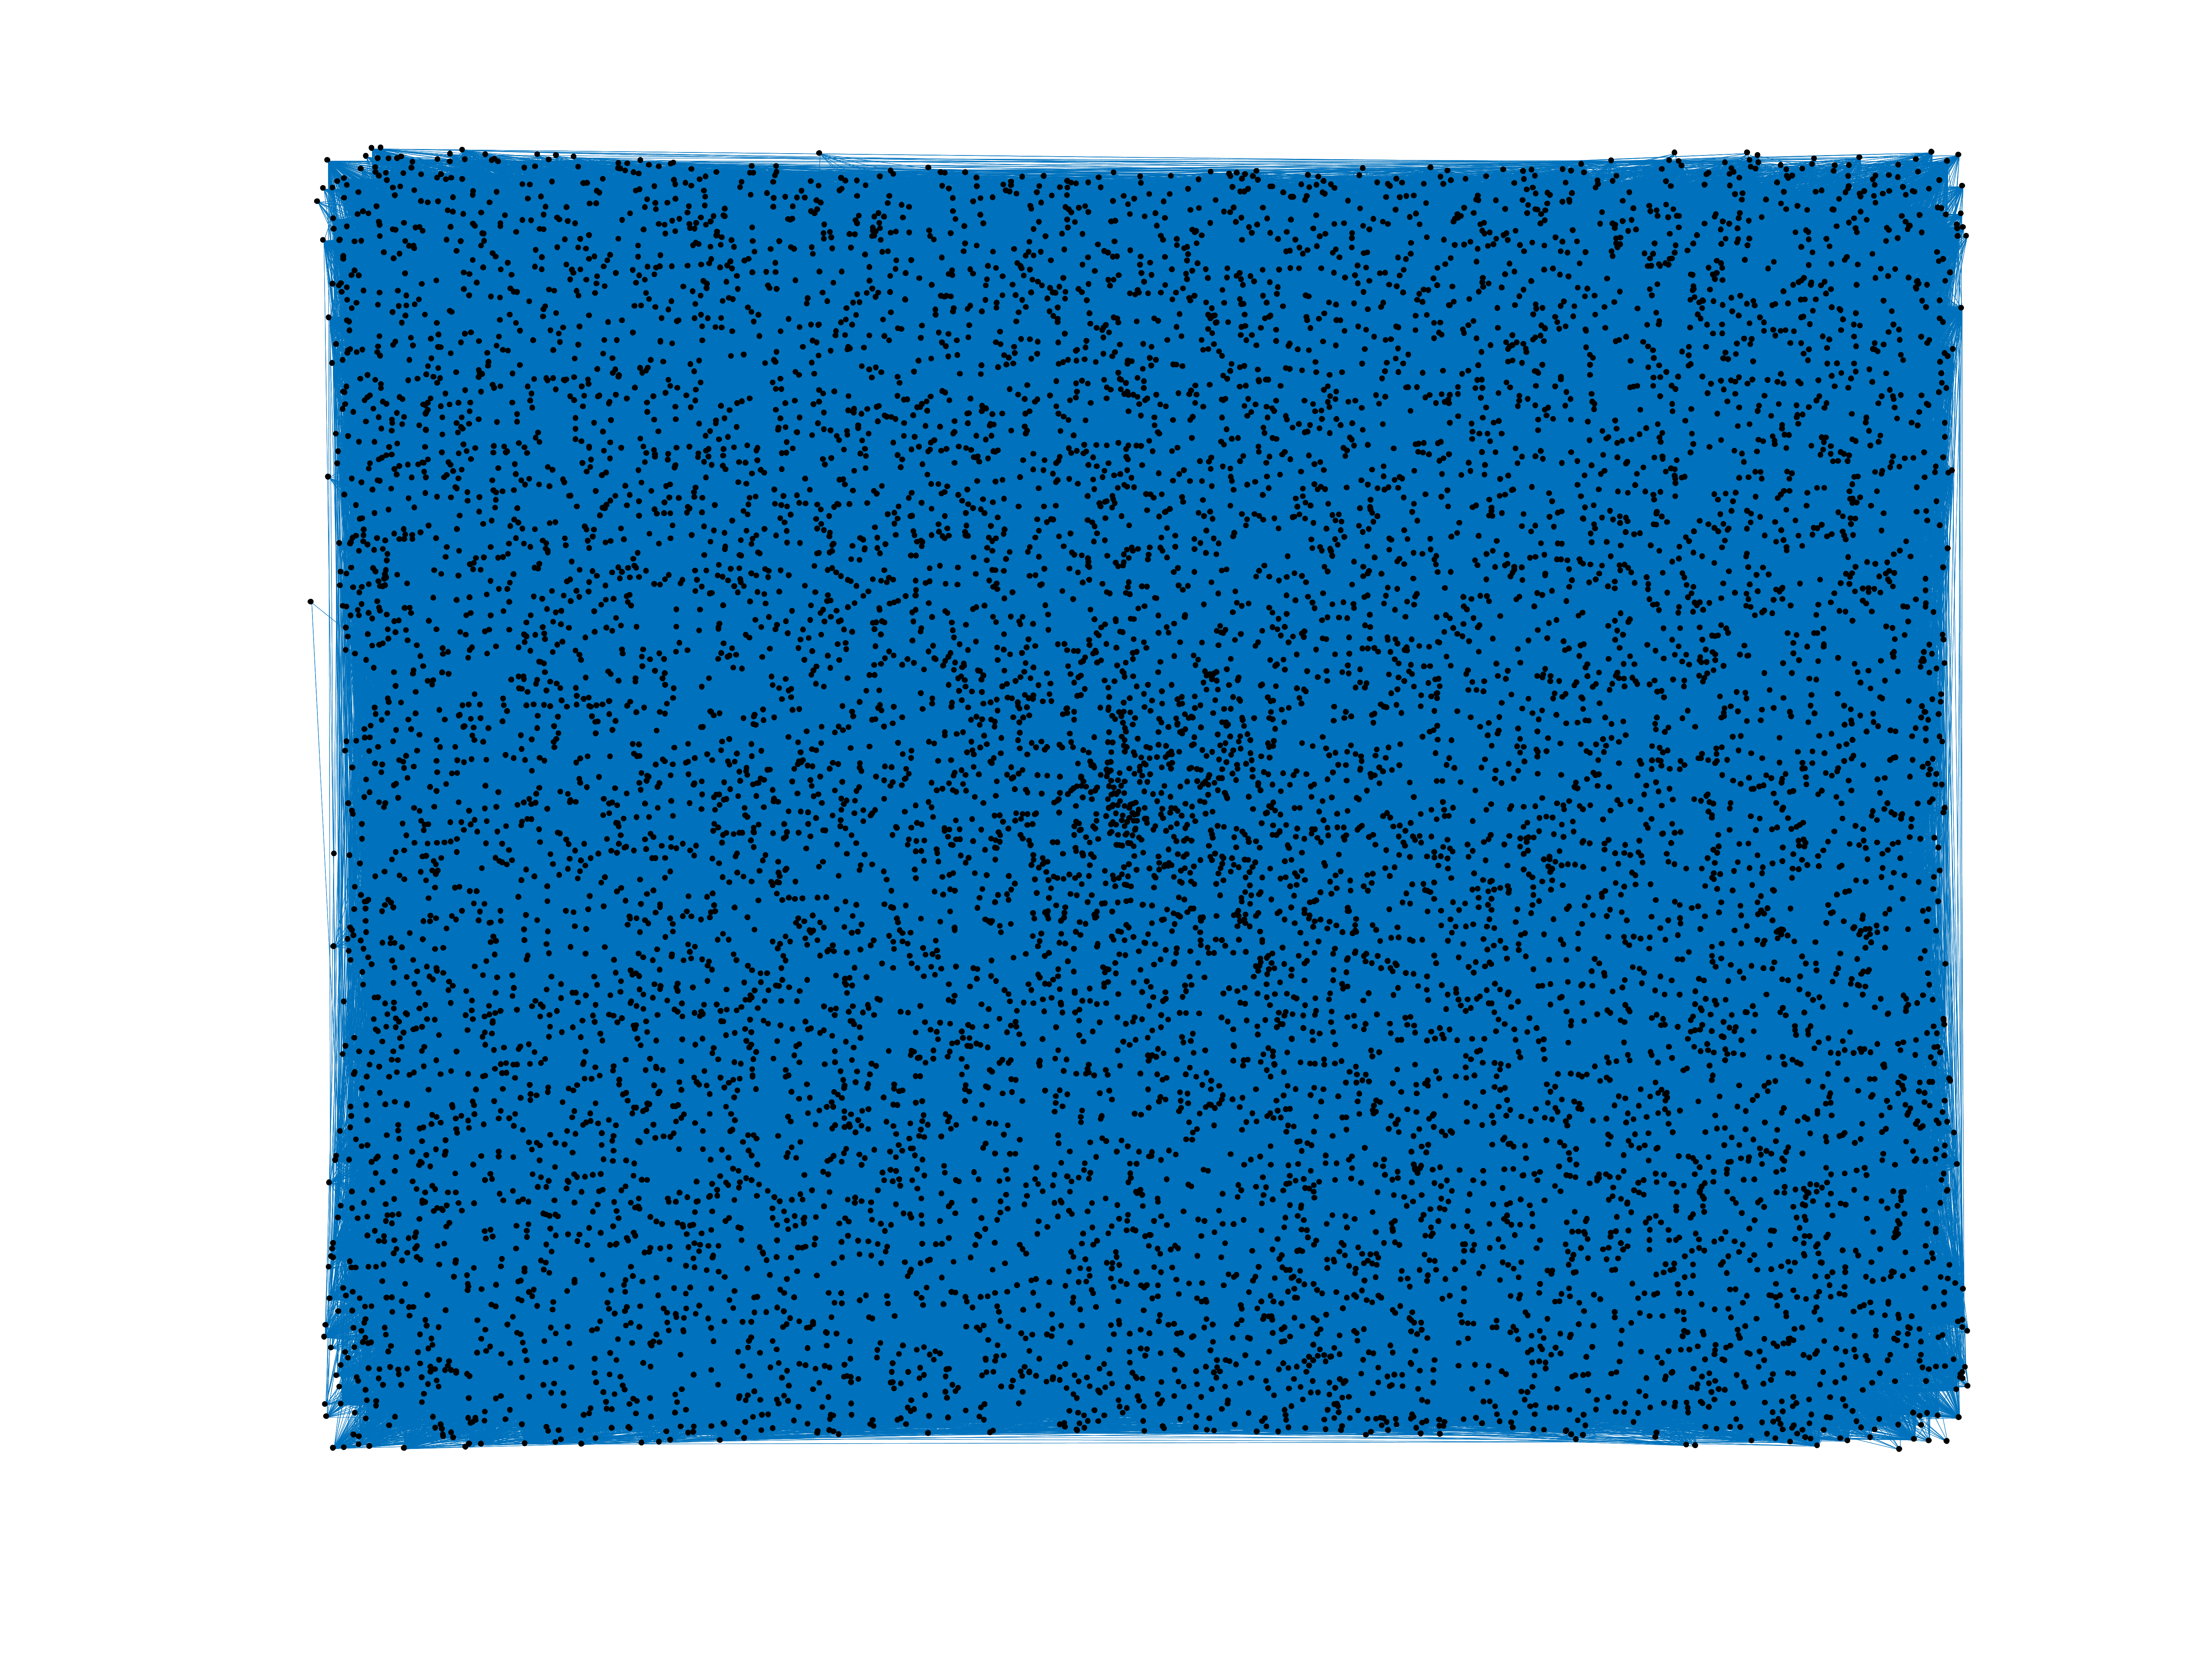
Daily Kos
This is the bipartite document–word dataset of Daily Kos. Left nodes are
documents and right nodes are words. Edge weights are multiplicities.
Metadata
Statistics
| Size | n = | 10,336
|
| Left size | n1 = | 3,430
|
| Right size | n2 = | 6,906
|
| Volume | m = | 467,714
|
| Unique edge count | m̿ = | 353,160
|
| Wedge count | s = | 68,241,250
|
| Claw count | z = | 11,455,280,341
|
| Cross count | x = | 2,925,573,347,776
|
| Square count | q = | 467,702,668
|
| 4-Tour count | T4 = | 4,015,445,872
|
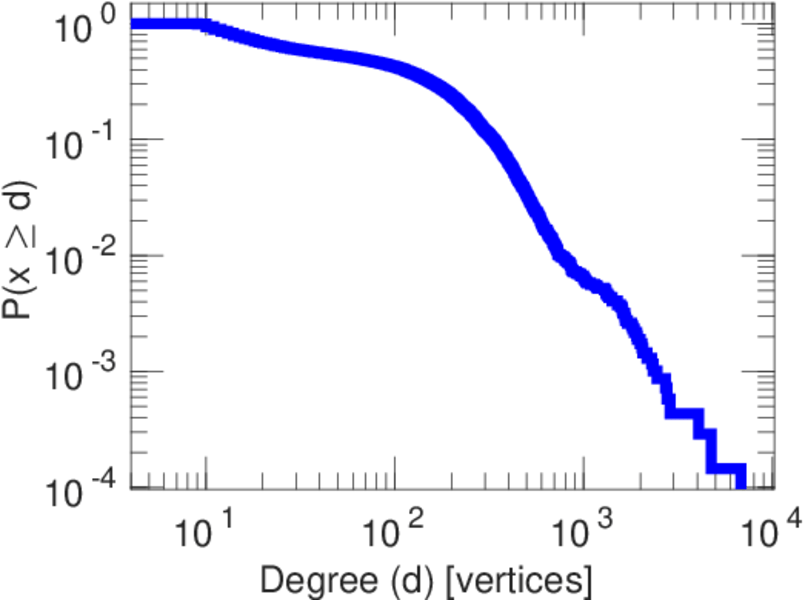
| Maximum degree | dmax = | 2,123
|
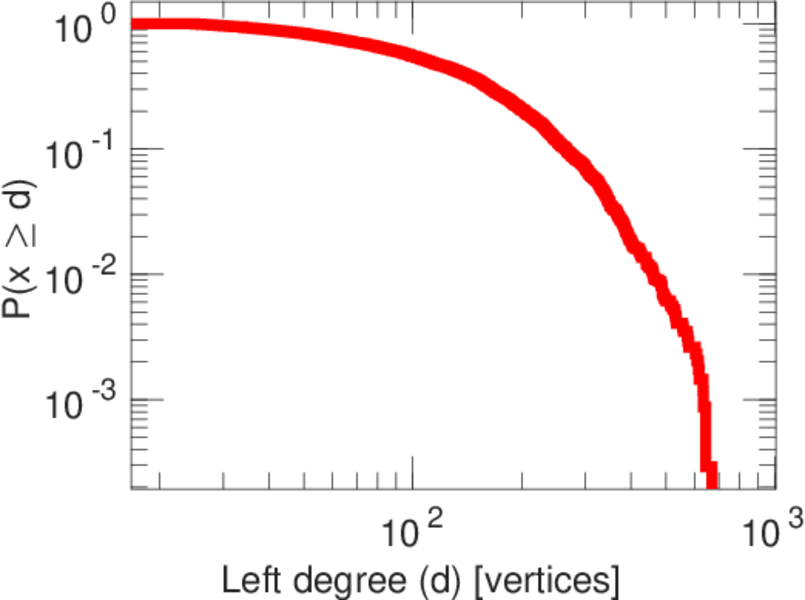
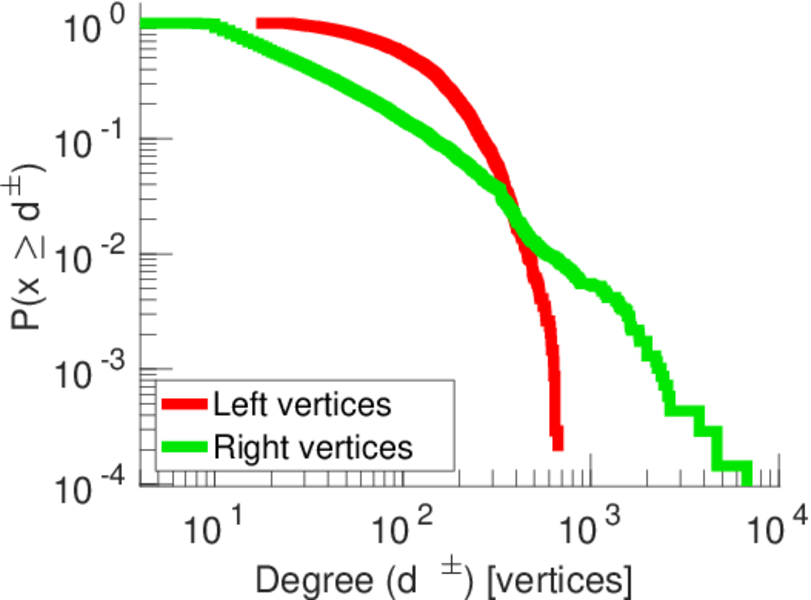
| Maximum left degree | d1max = | 457
|
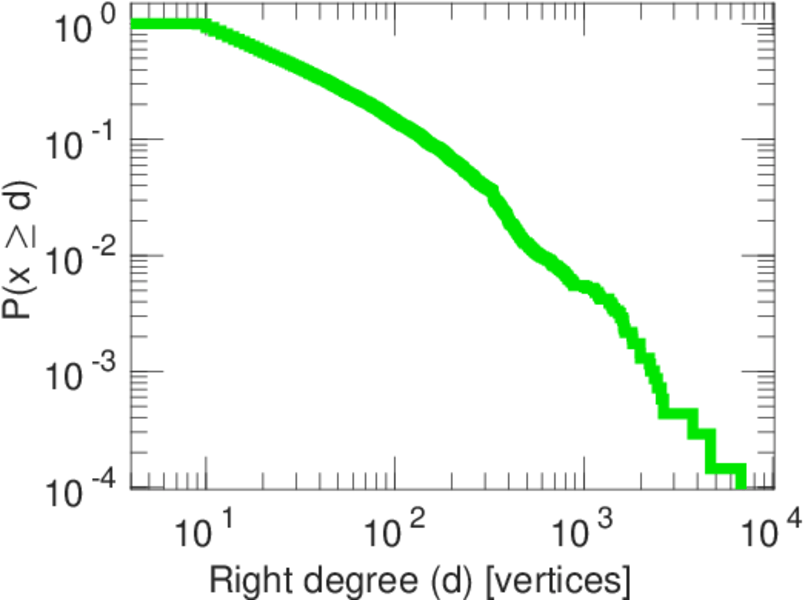
| Maximum right degree | d2max = | 2,123
|
| Average degree | d = | 90.501 9
|
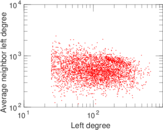
| Average left degree | d1 = | 136.360
|
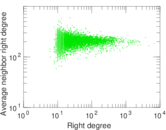
| Average right degree | d2 = | 67.725 7
|
| Fill | p = | 0.014 909 1
|
| Average edge multiplicity | m̃ = | 1.324 37
|
| Size of LCC | N = | 10,336
|
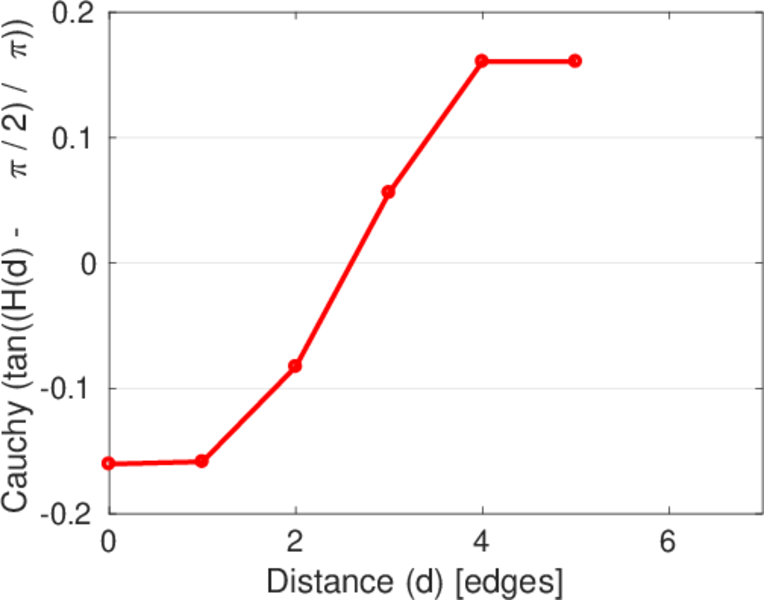
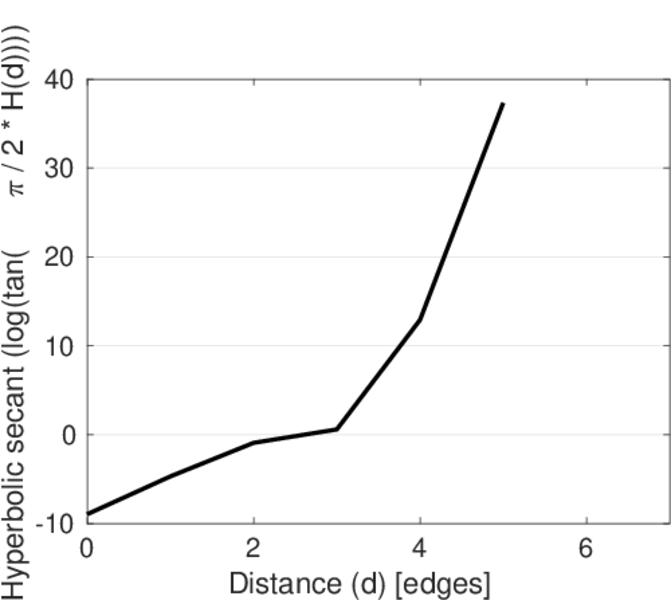
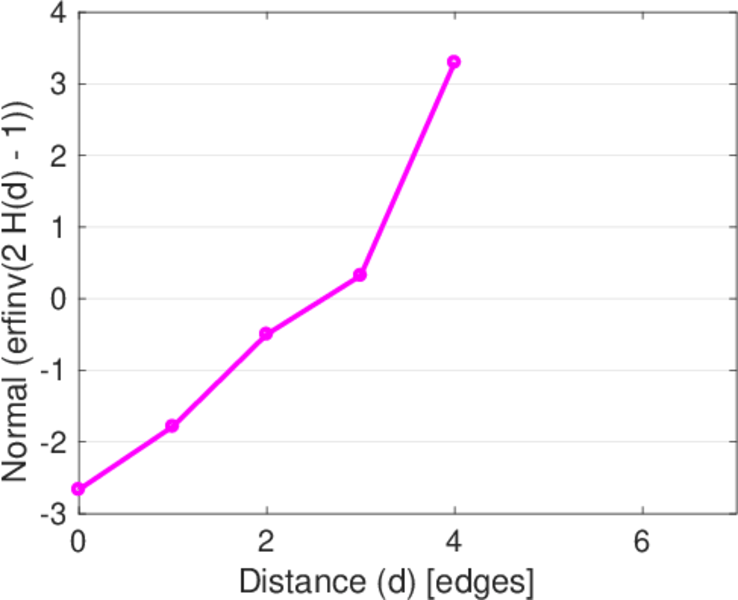
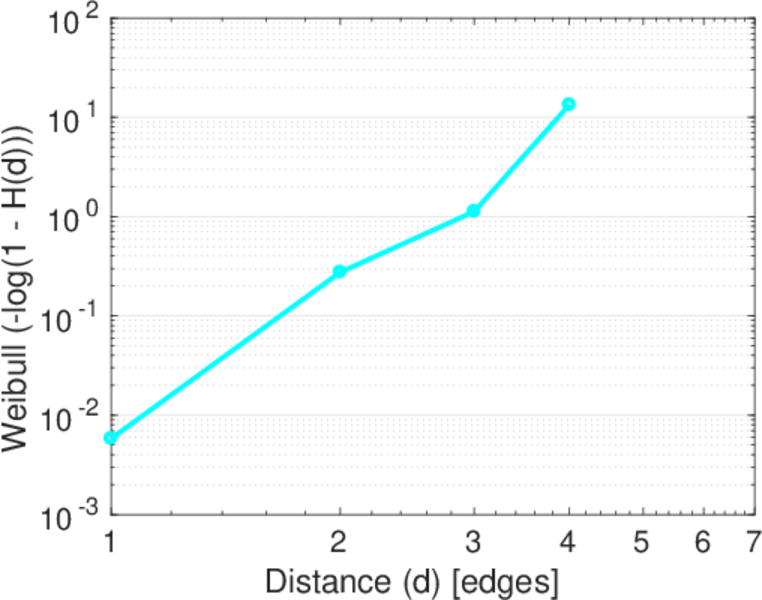
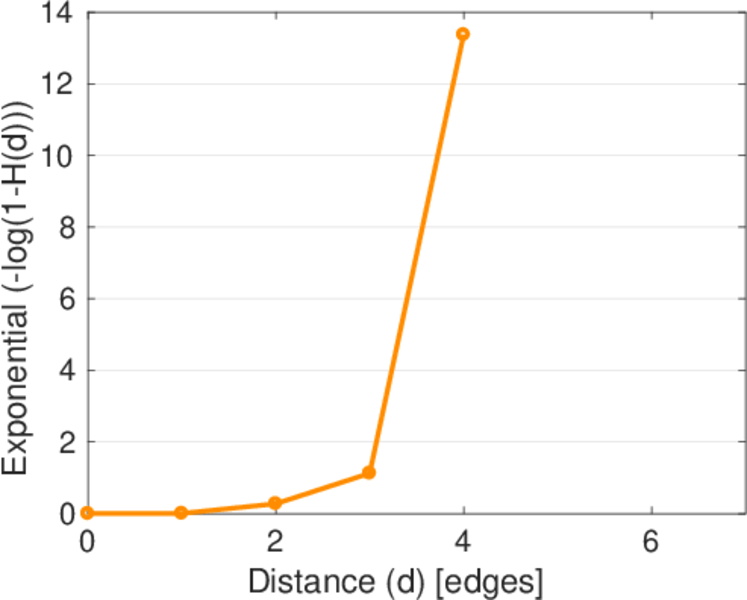
| Diameter | δ = | 5
|
| 50-Percentile effective diameter | δ0.5 = | 2.596 43
|
| 90-Percentile effective diameter | δ0.9 = | 3.691 70
|
| Median distance | δM = | 3
|
| Mean distance | δm = | 3.078 07
|
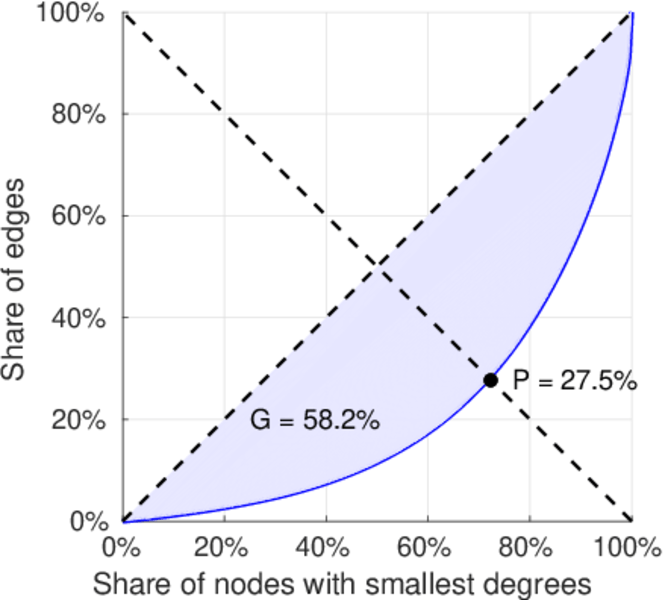
| Gini coefficient | G = | 0.606 086
|
| Balanced inequality ratio | P = | 0.269 422
|
| Left balanced inequality ratio | P1 = | 0.364 120
|
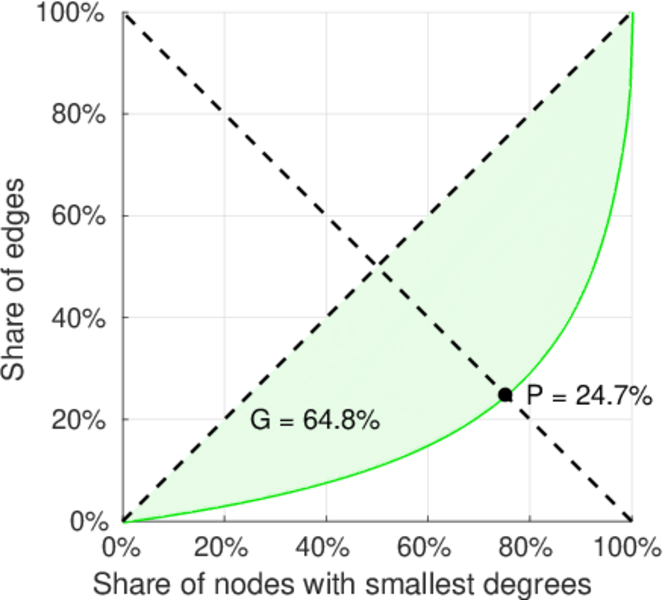
| Right balanced inequality ratio | P2 = | 0.246 890
|
| Relative edge distribution entropy | Her = | 0.940 178
|
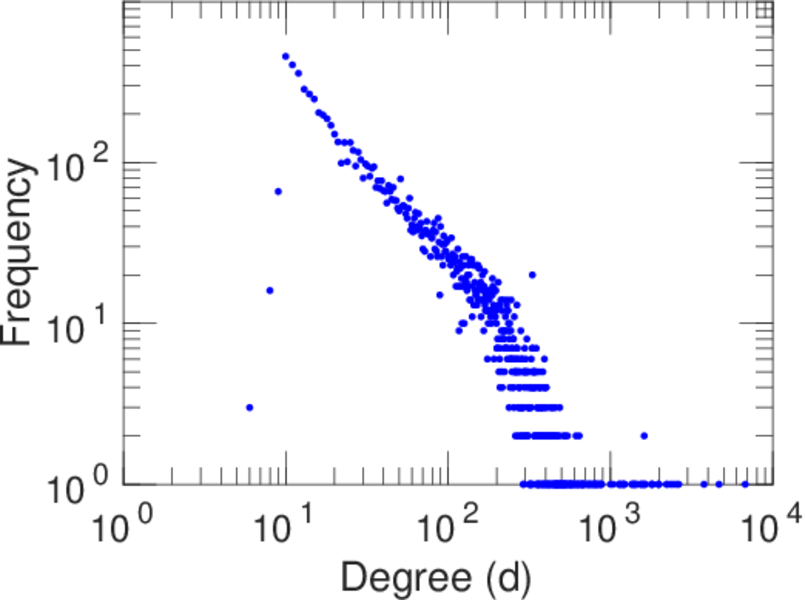
| Power law exponent | γ = | 1.274 22
|
| Tail power law exponent | γt = | 2.341 00
|
| Tail power law exponent with p | γ3 = | 2.341 00
|
| p-value | p = | 0.000 00
|
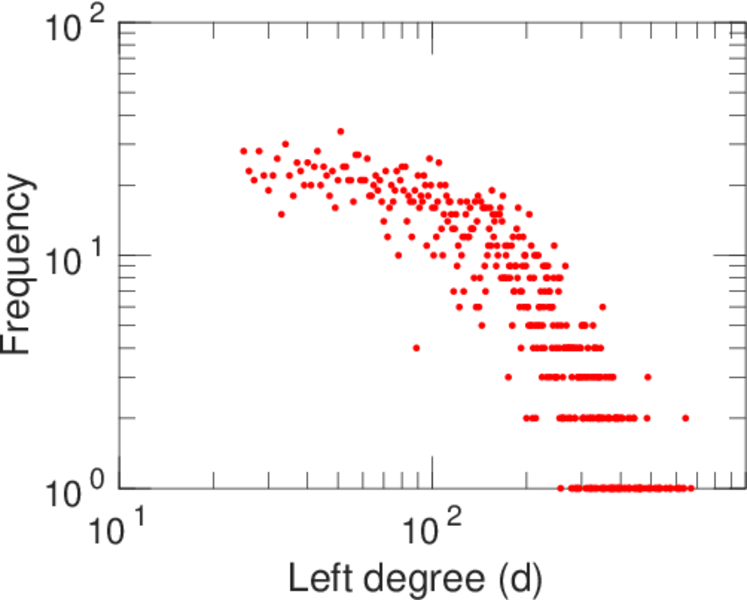
| Left tail power law exponent with p | γ3,1 = | 2.411 00
|
| Left p-value | p1 = | 0.000 00
|
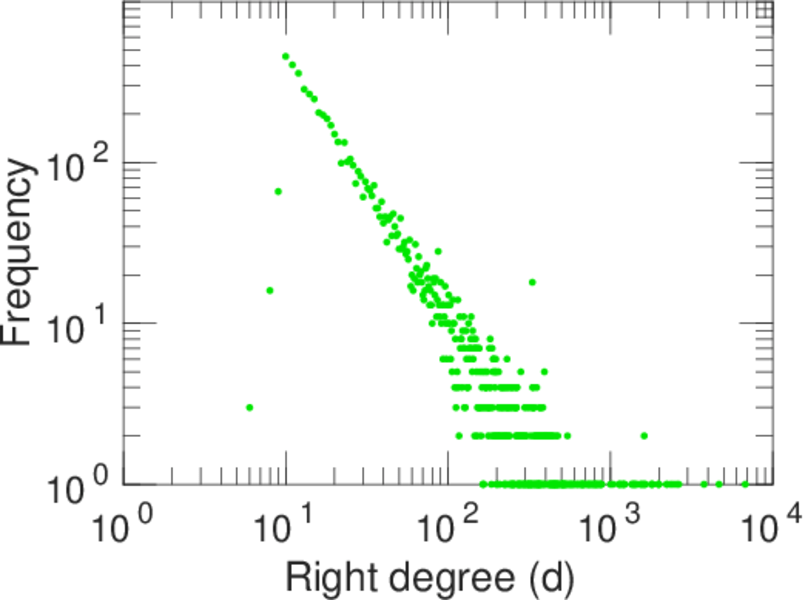
| Right tail power law exponent with p | γ3,2 = | 1.851 00
|
| Right p-value | p2 = | 0.000 00
|
| Degree assortativity | ρ = | −0.054 950 6
|
| Degree assortativity p-value | pρ = | 2.984 58 × 10−234
|
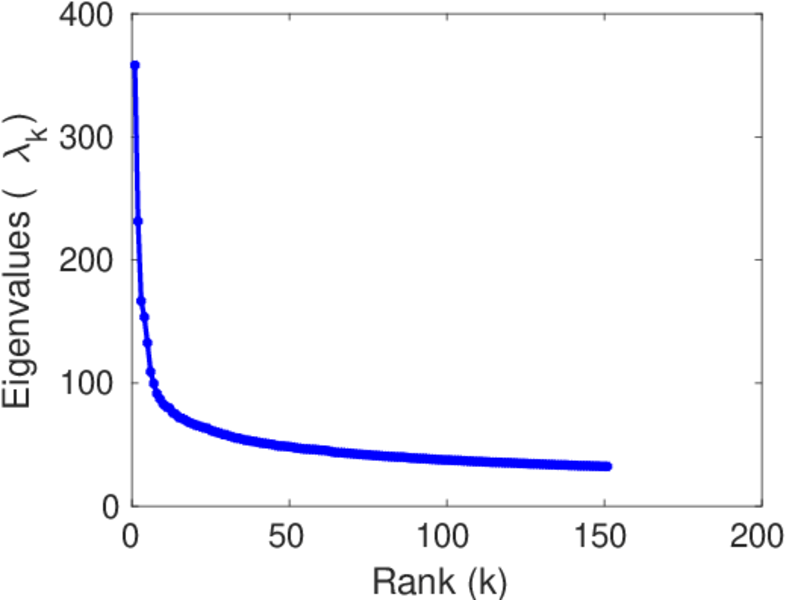
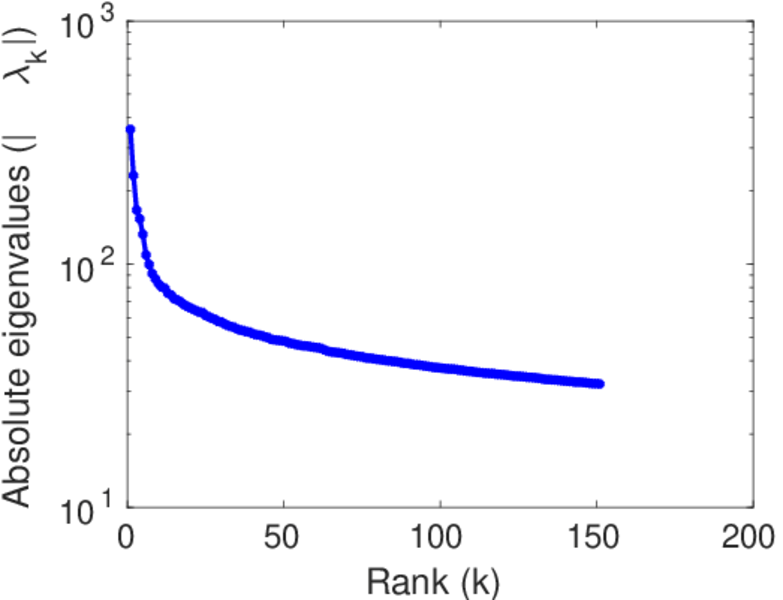
| Spectral norm | α = | 358.079
|
| Algebraic connectivity | a = | 5.811 82
|
| Spectral separation | |λ1[A] / λ2[A]| = | 1.547 57
|
| Controllability | C = | 3,476
|
| Relative controllability | Cr = | 0.336 300
|
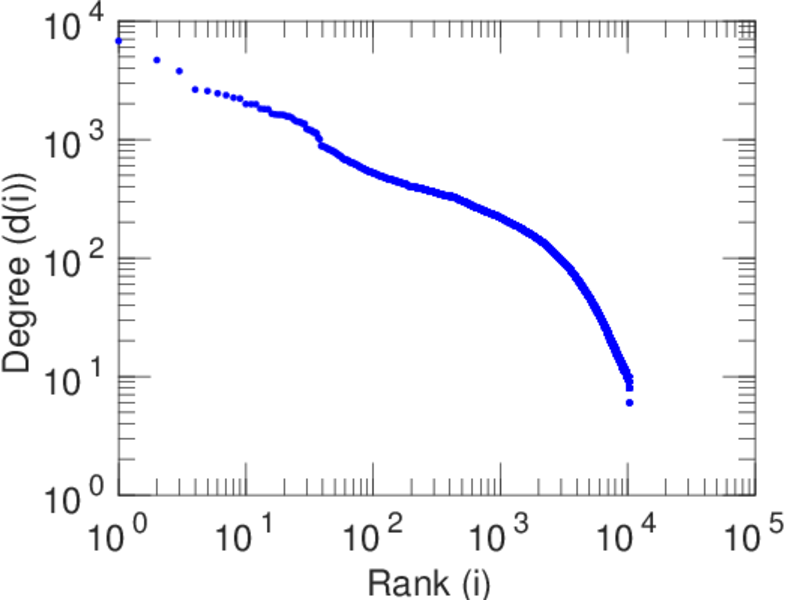
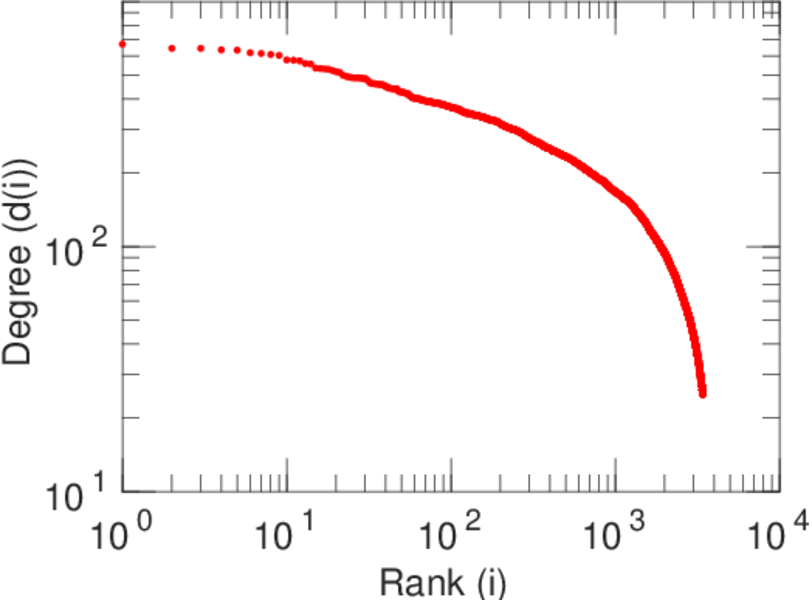
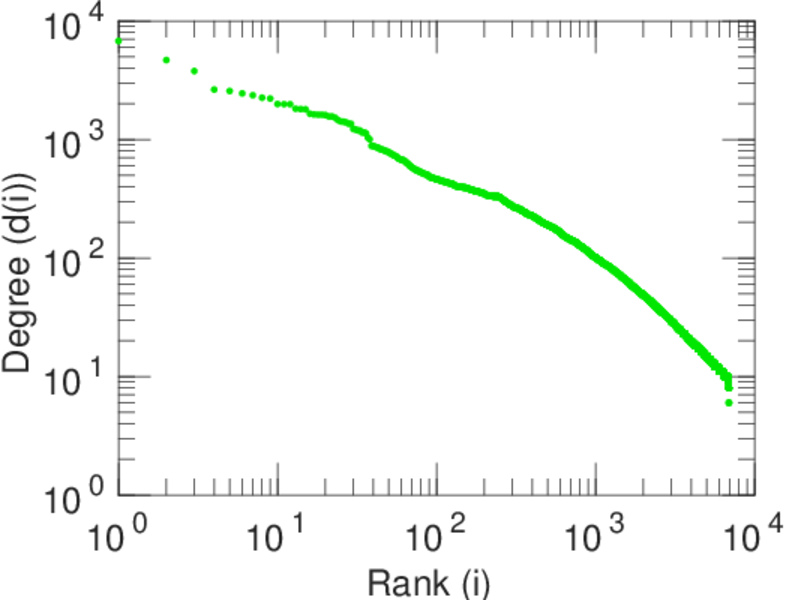
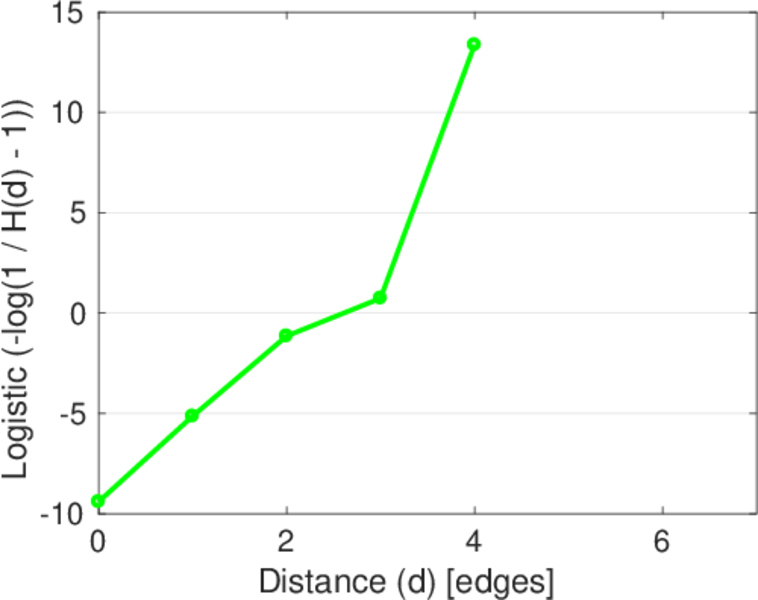
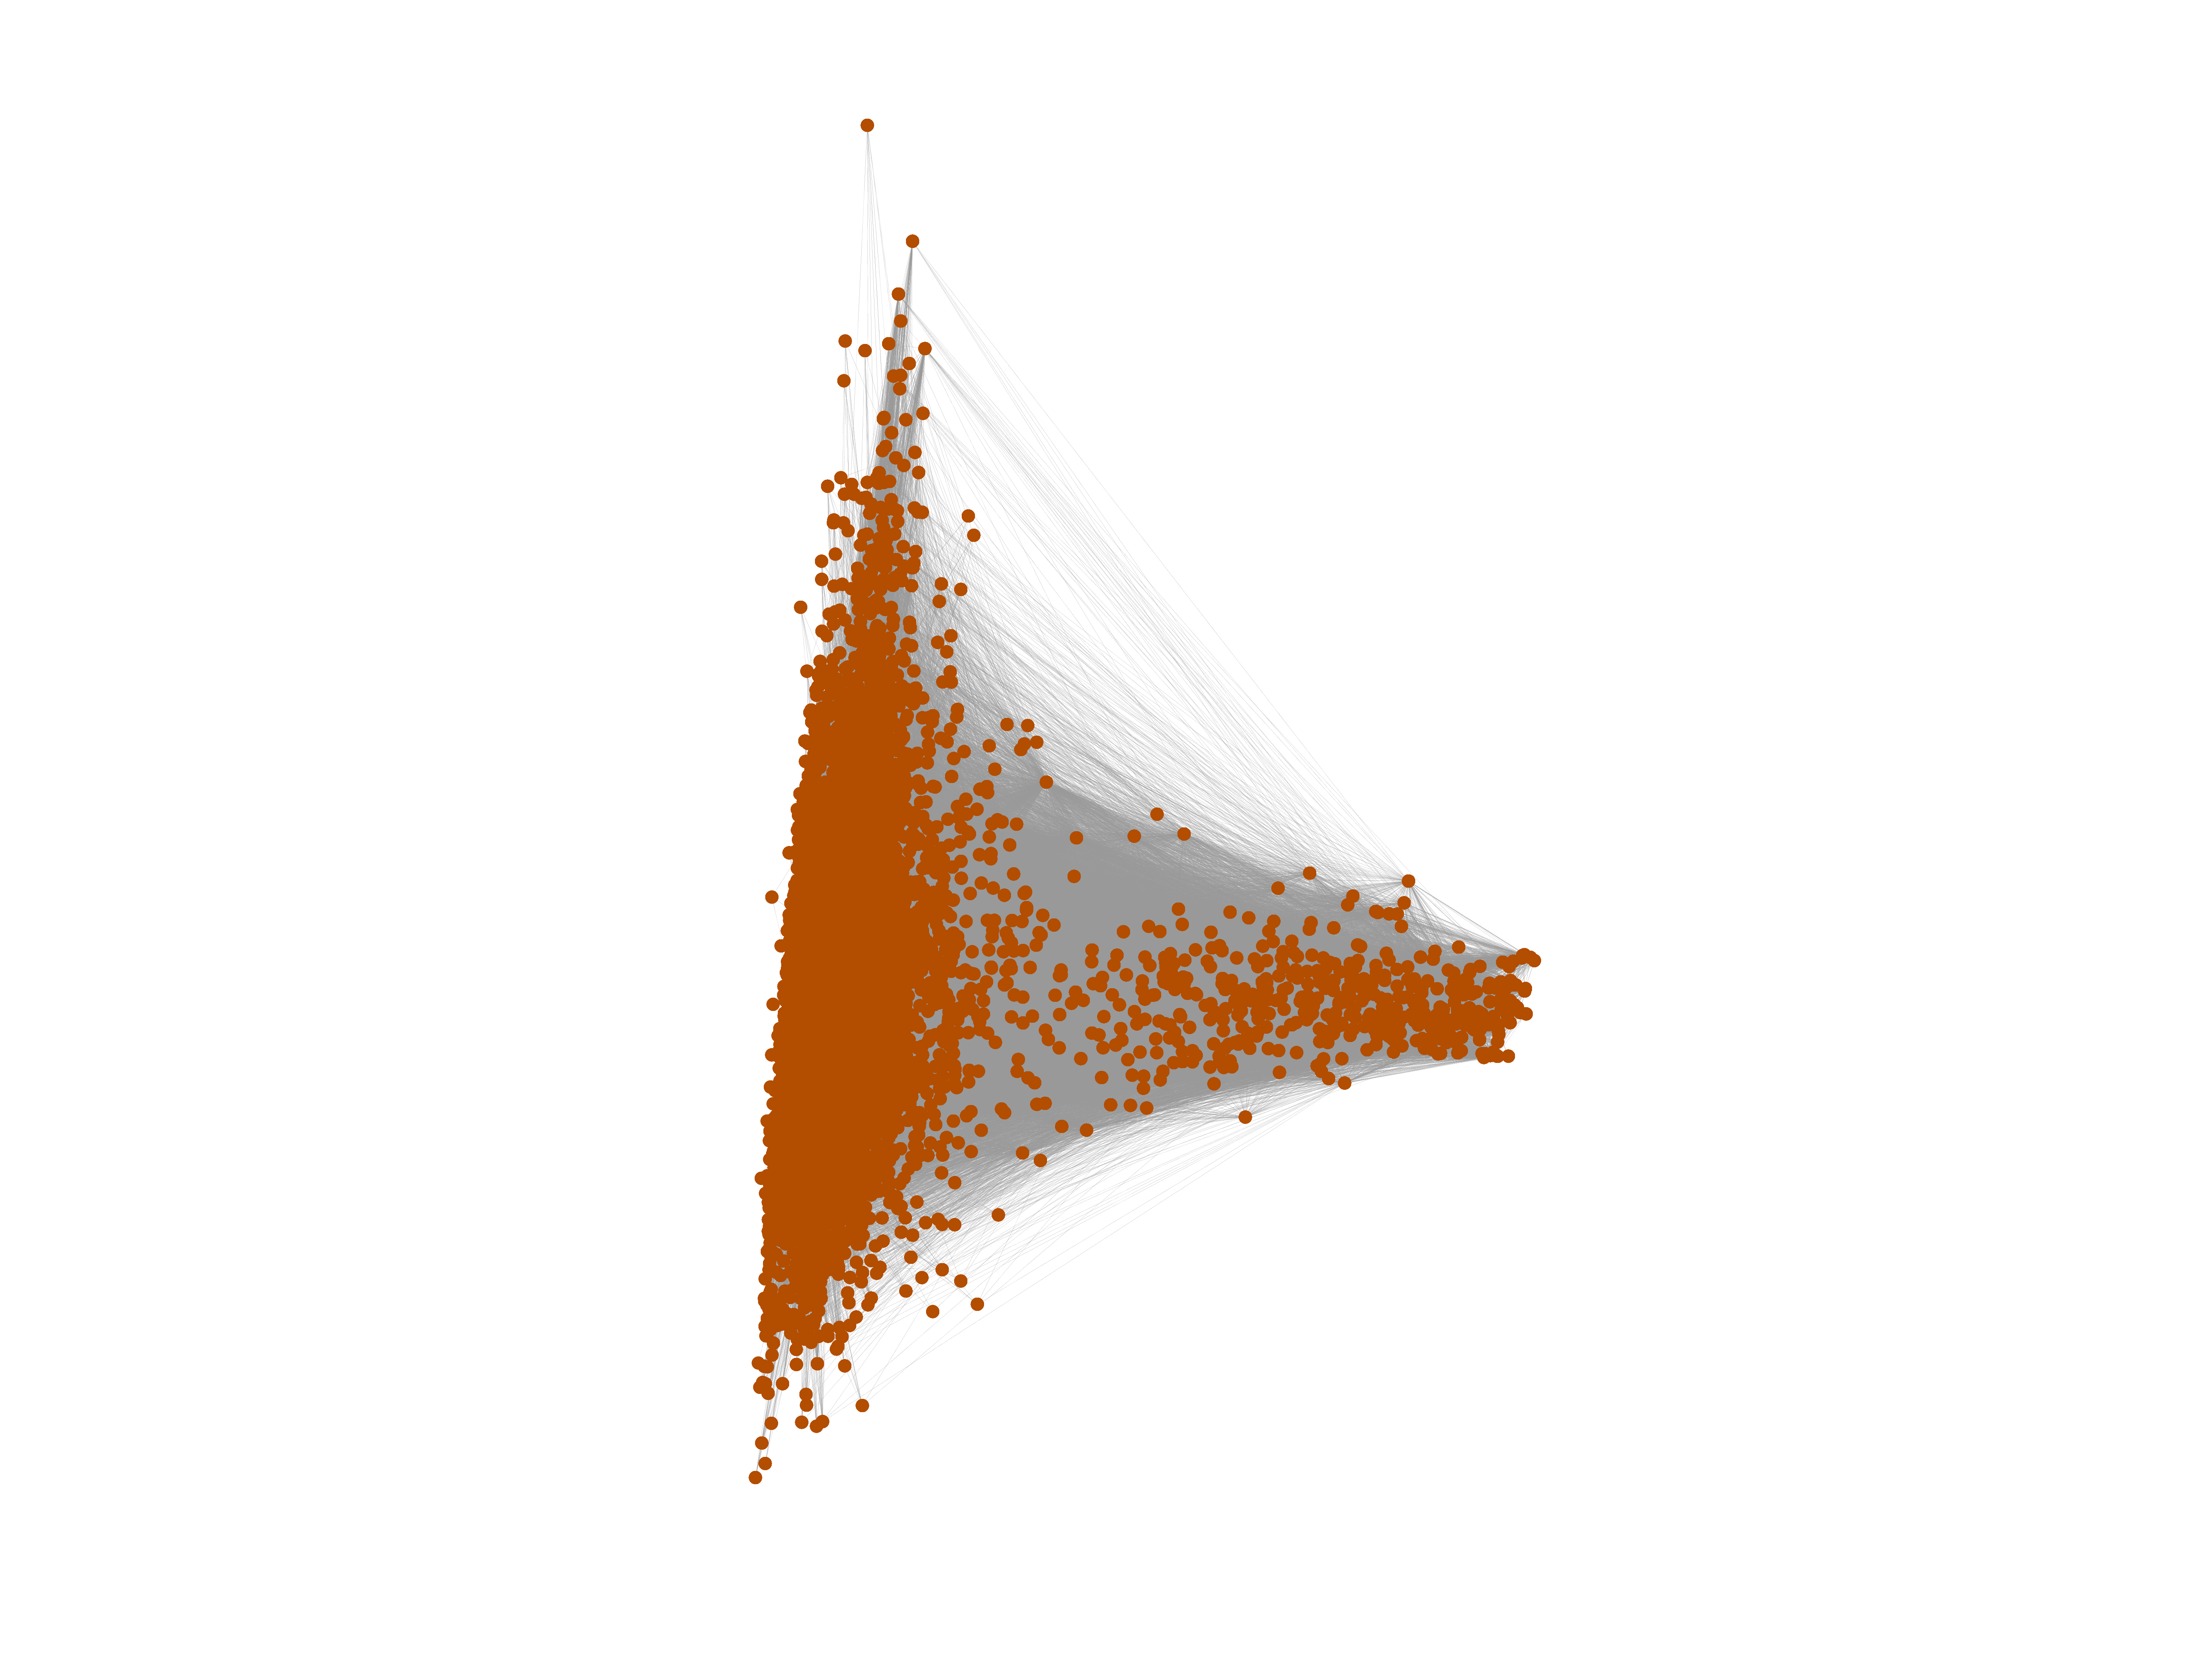
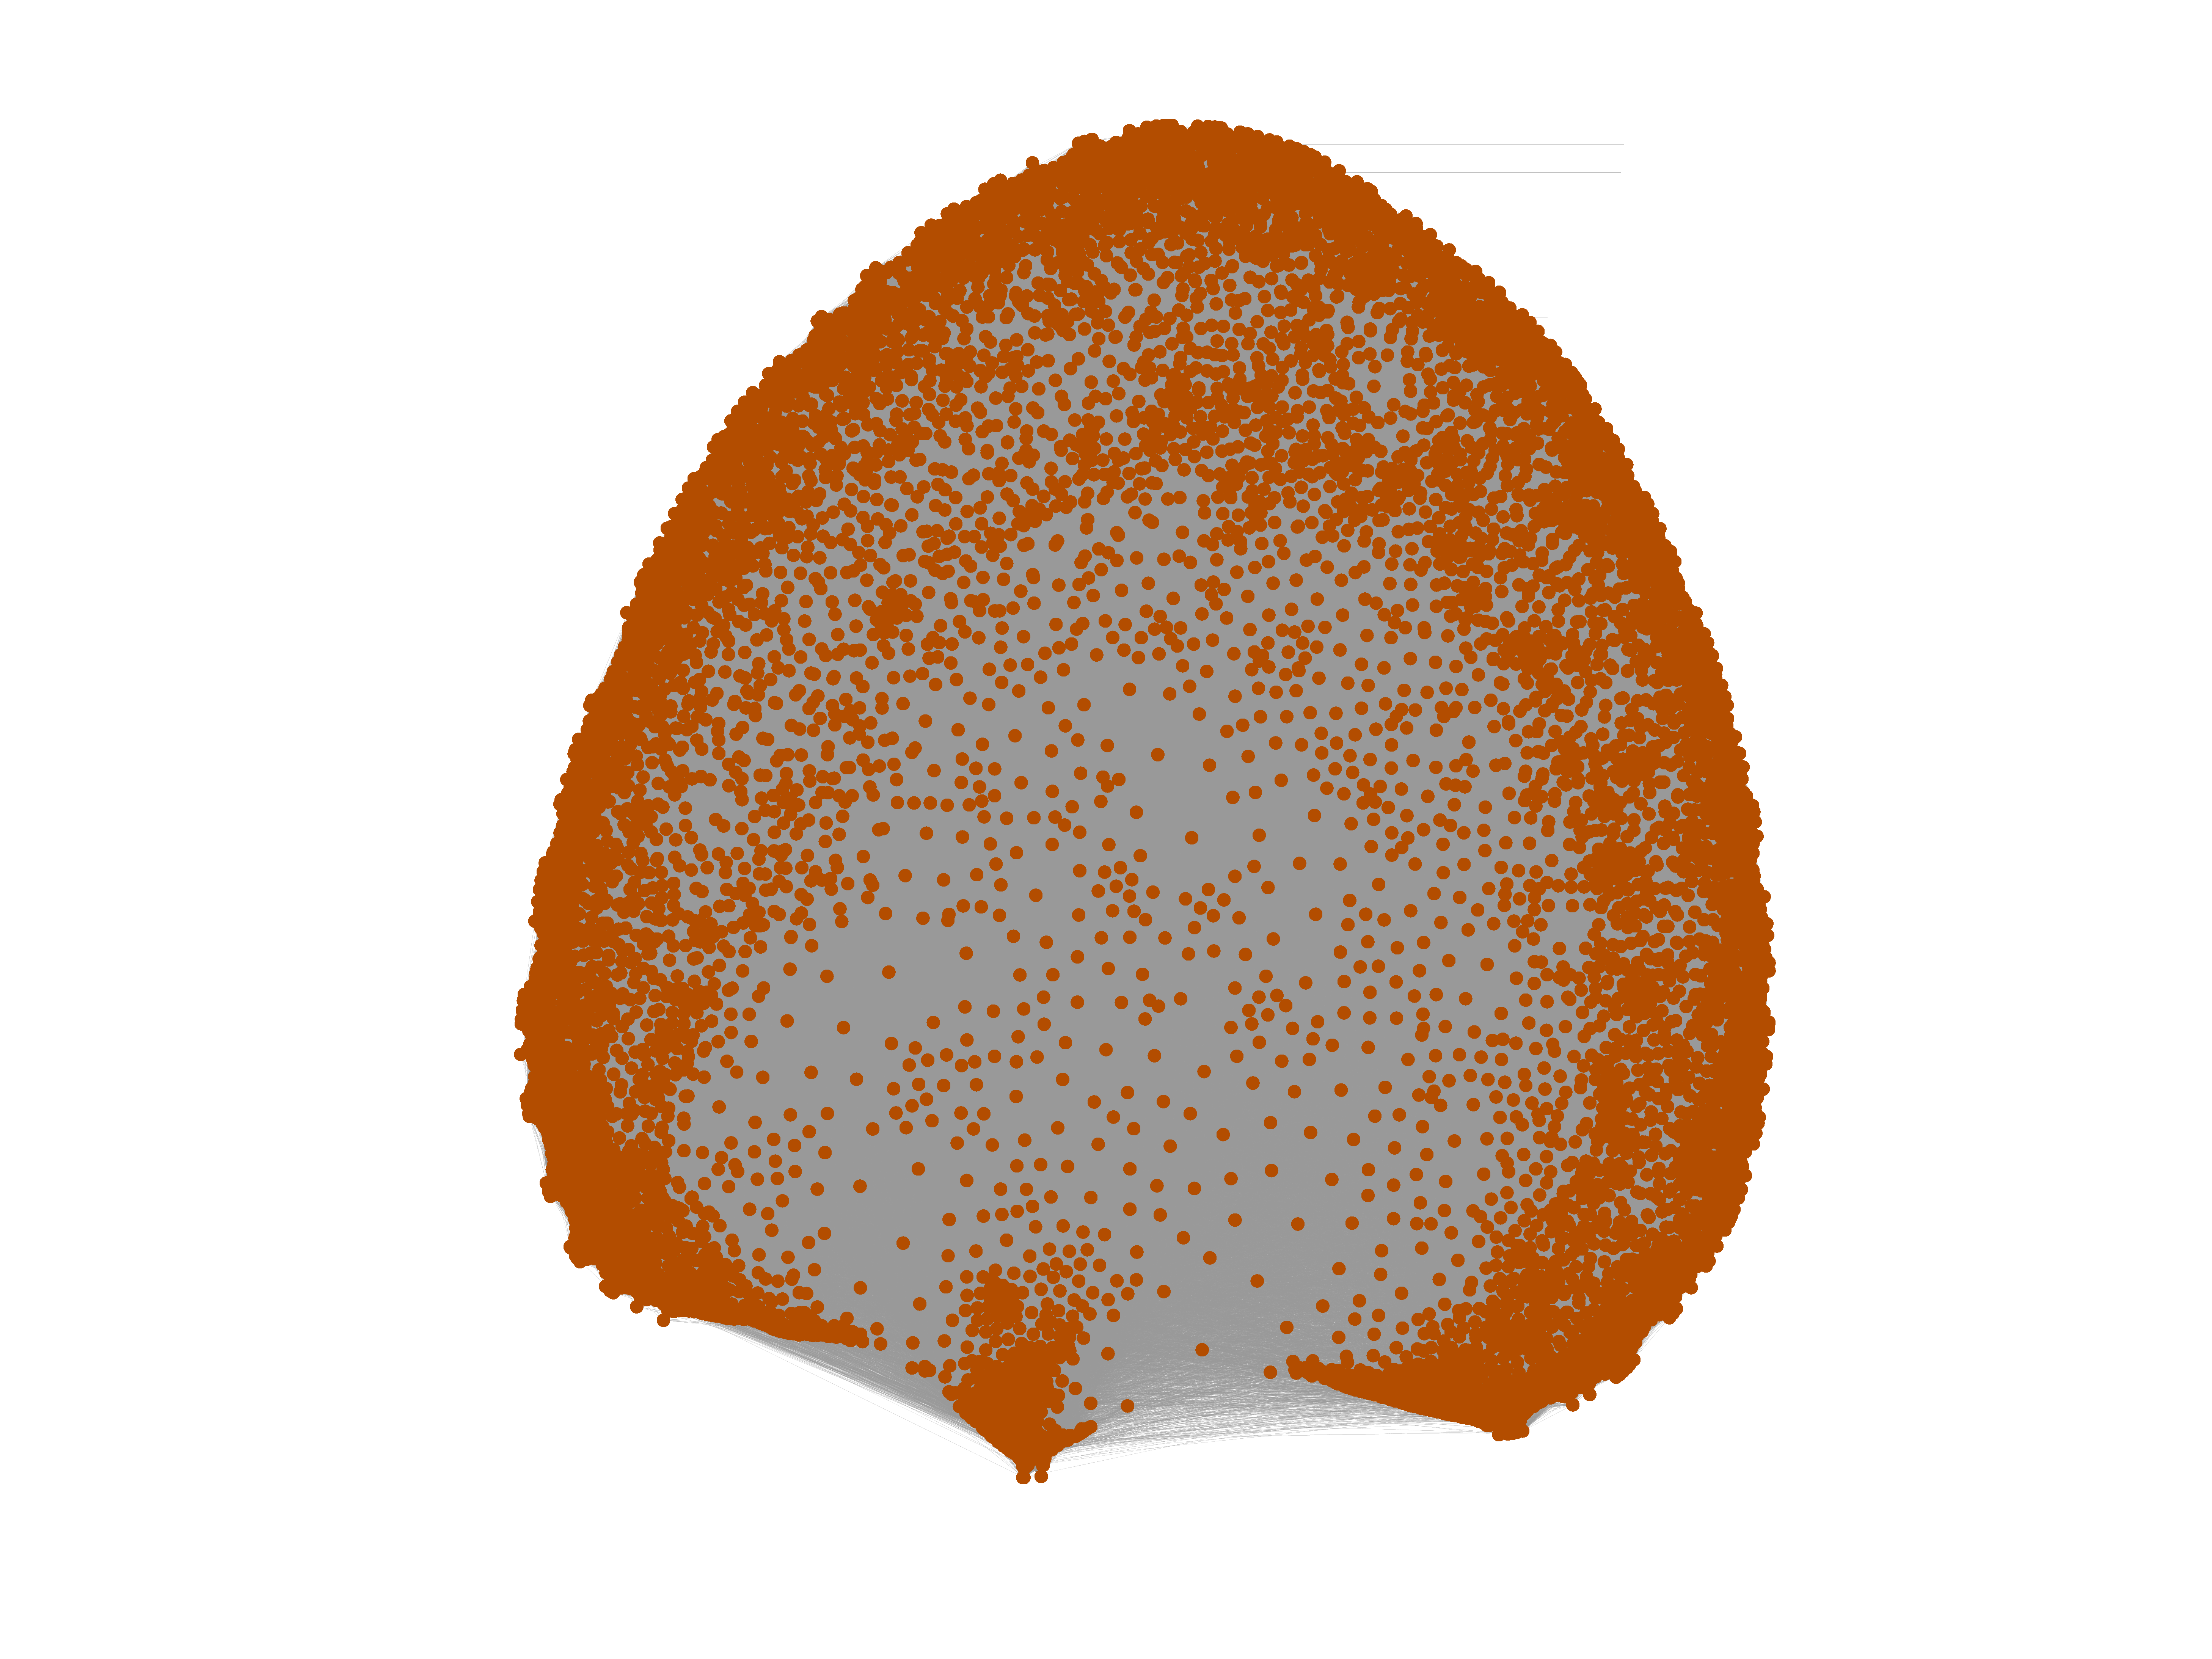
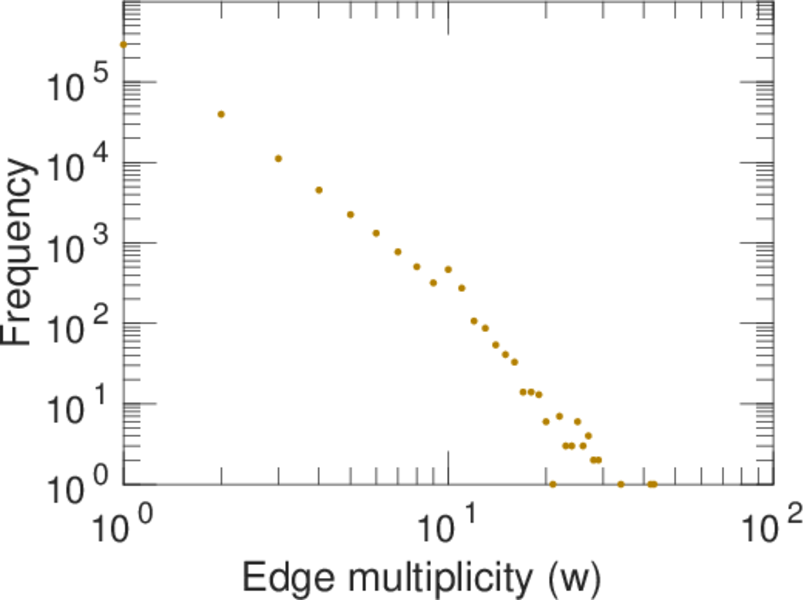
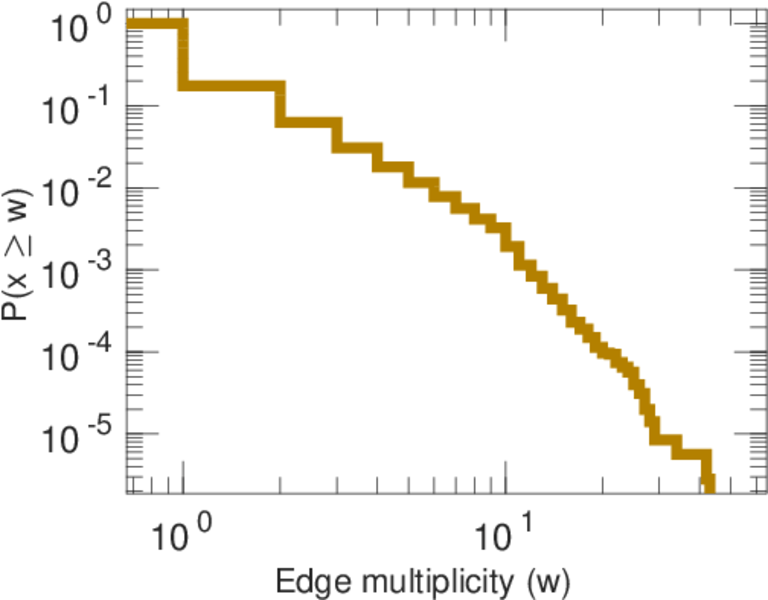
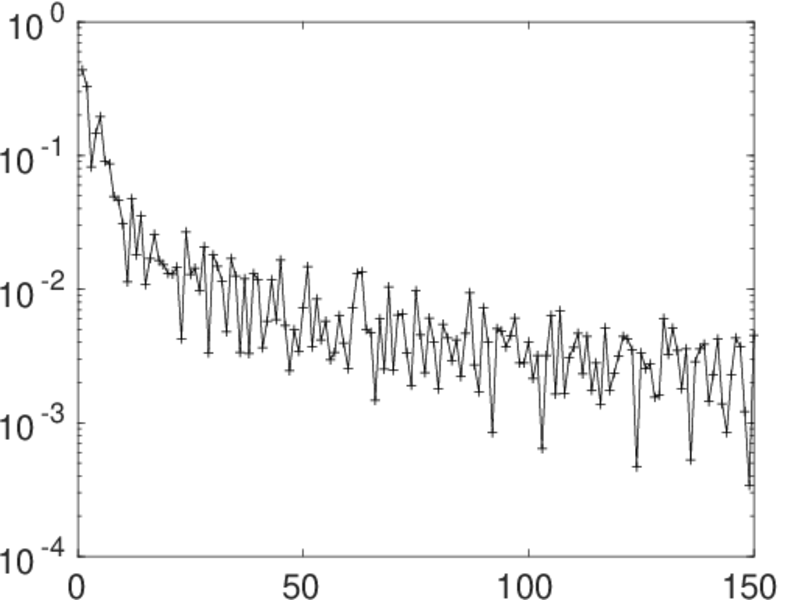
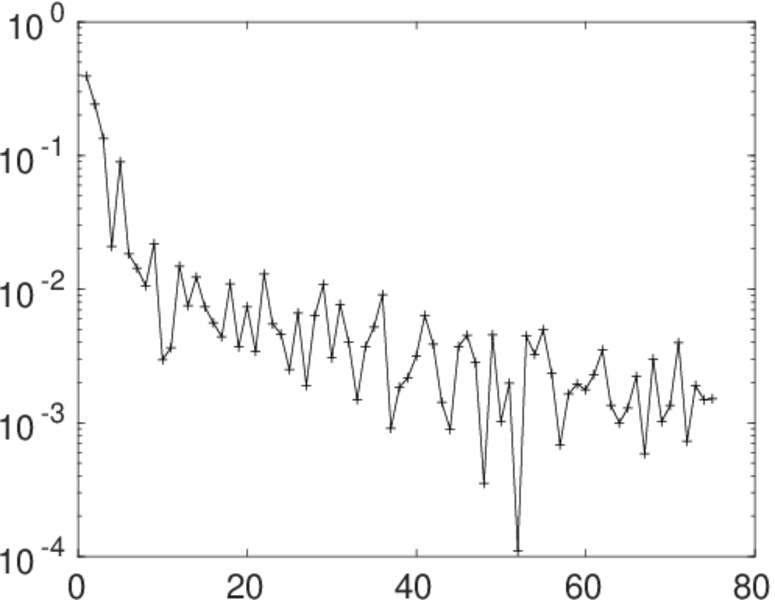
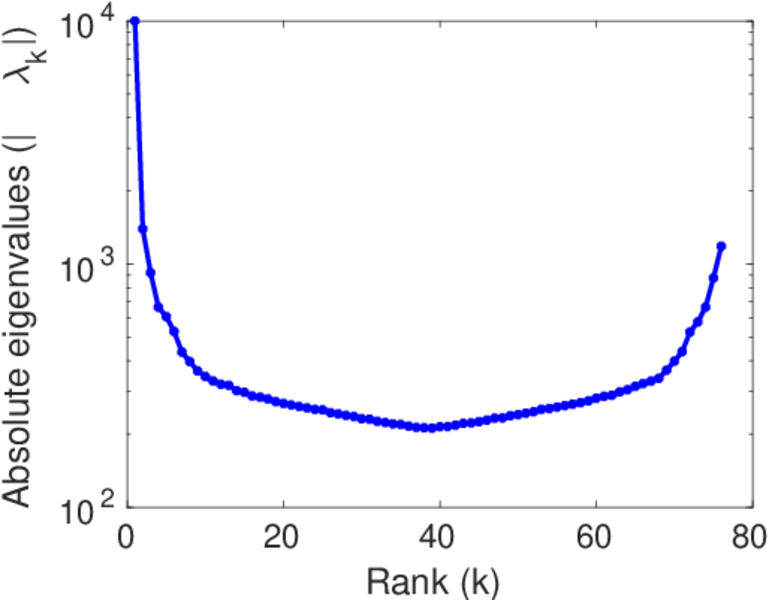
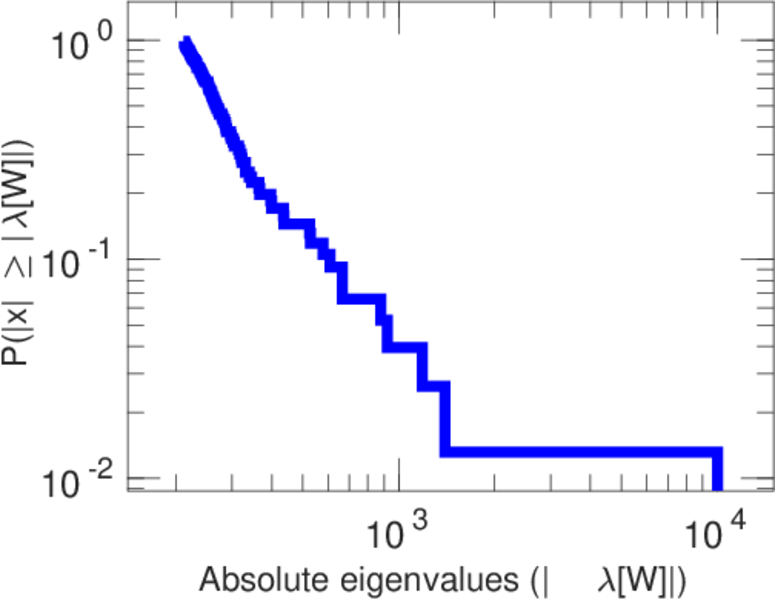
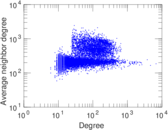
Plots


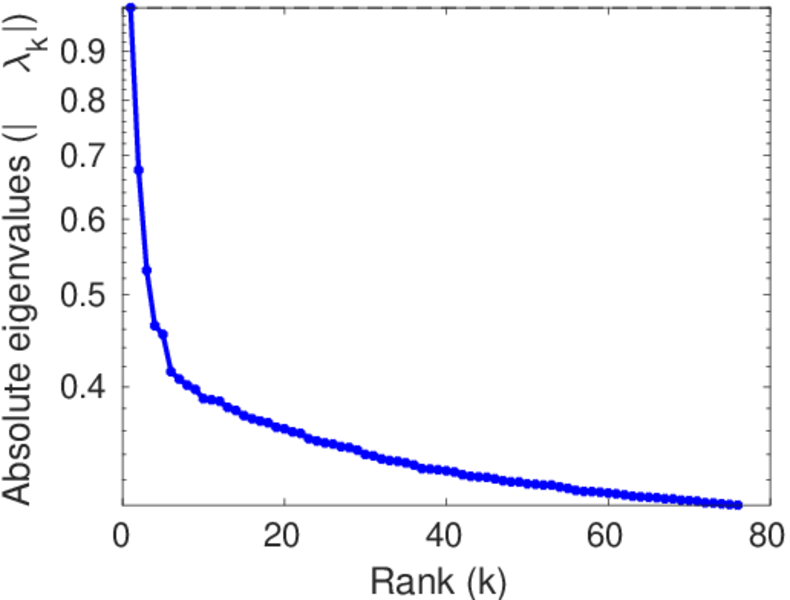
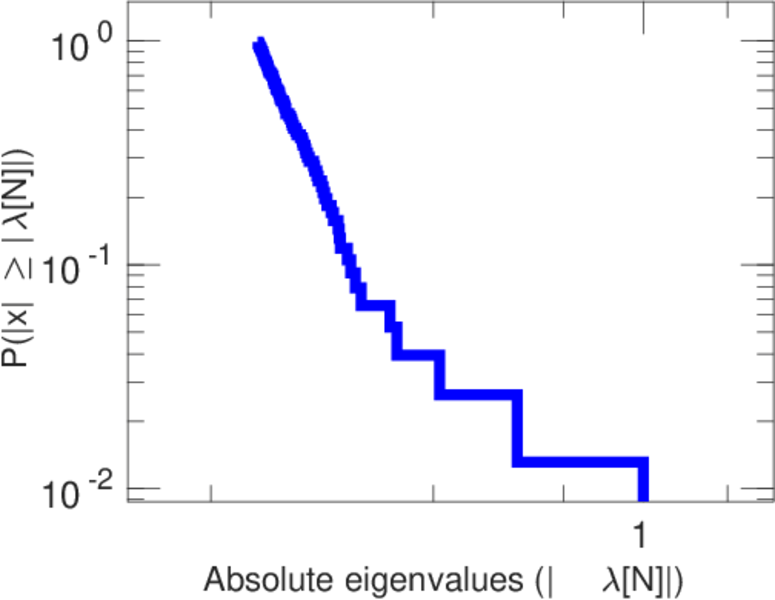
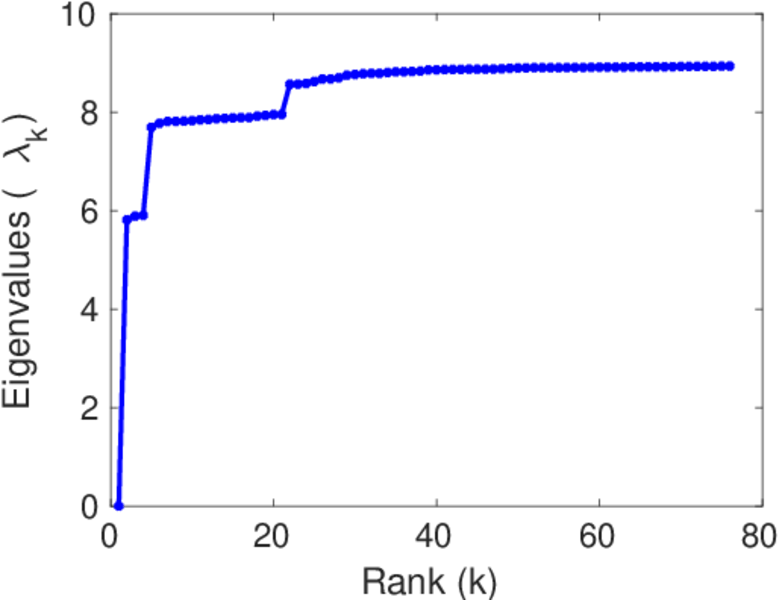
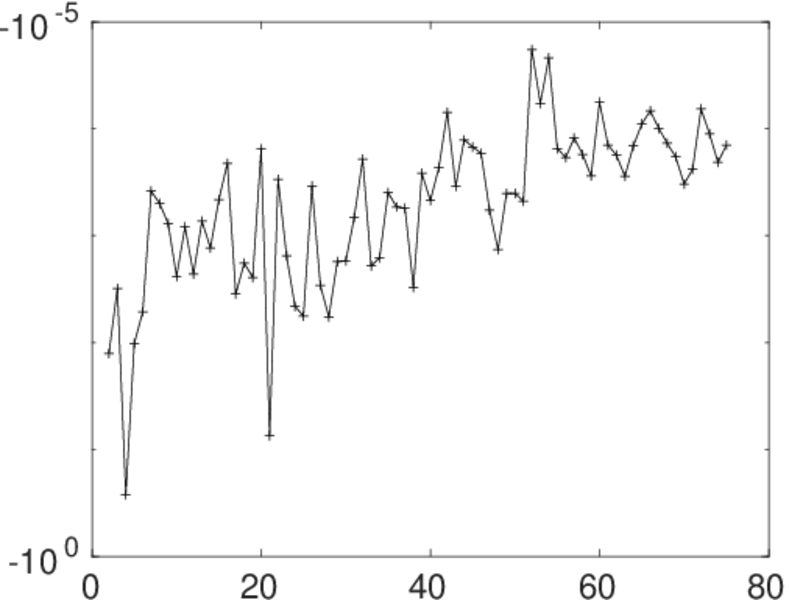
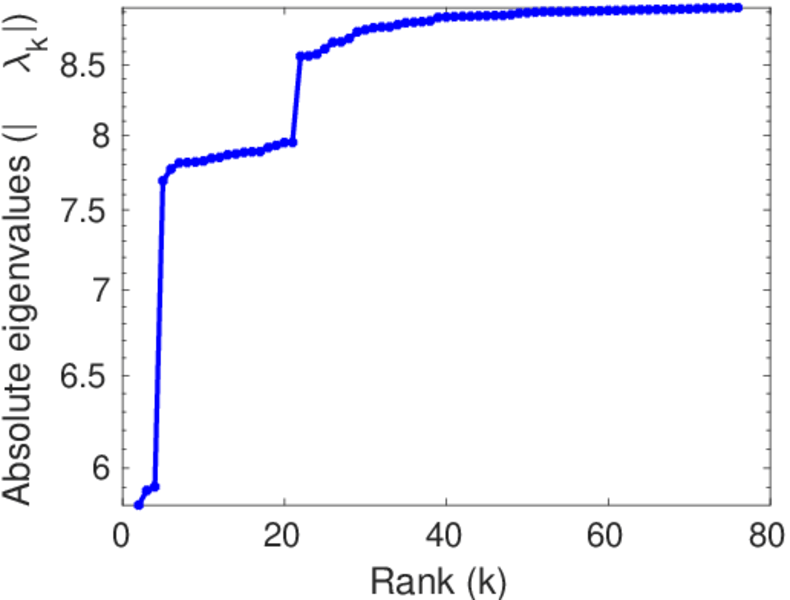
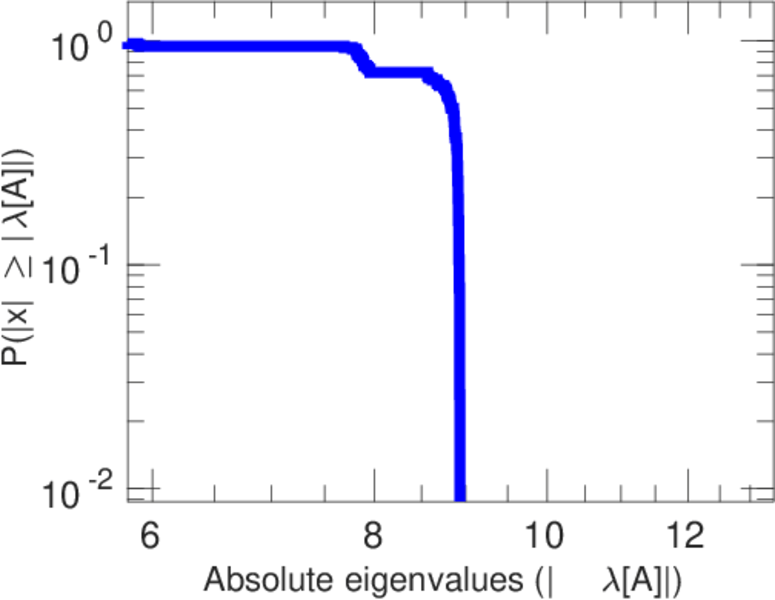
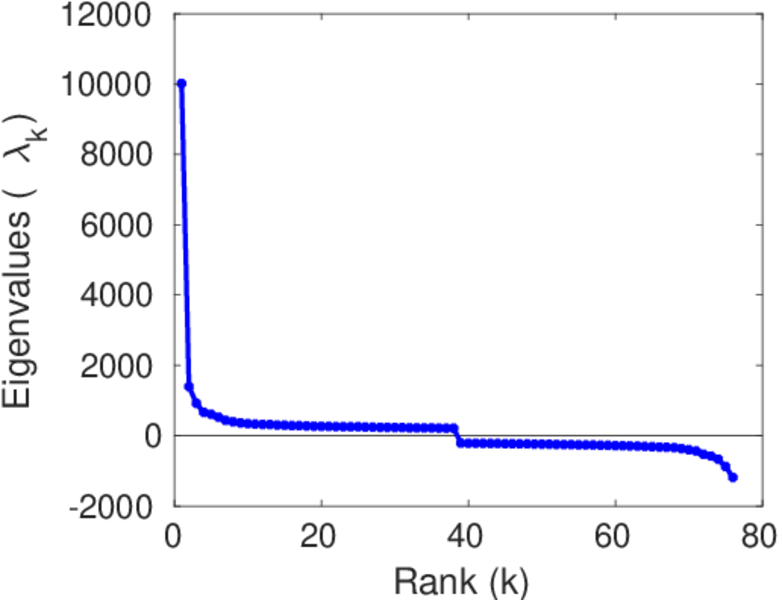
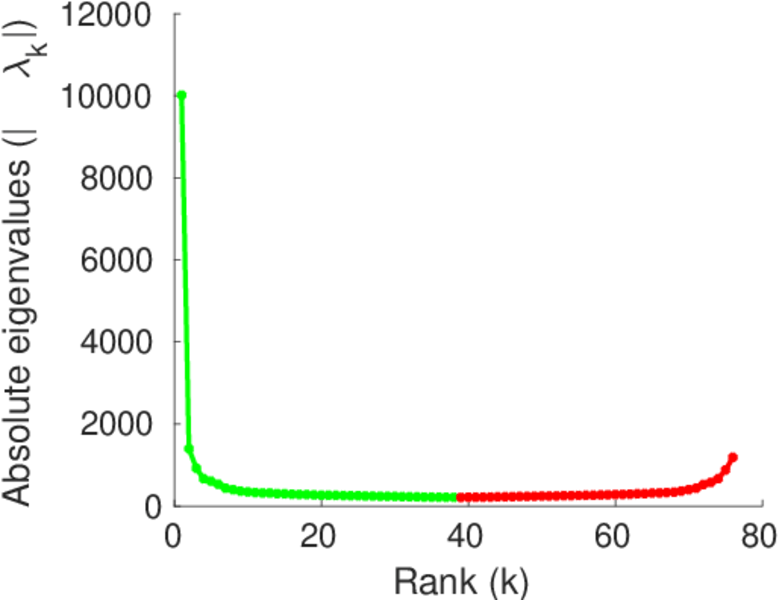
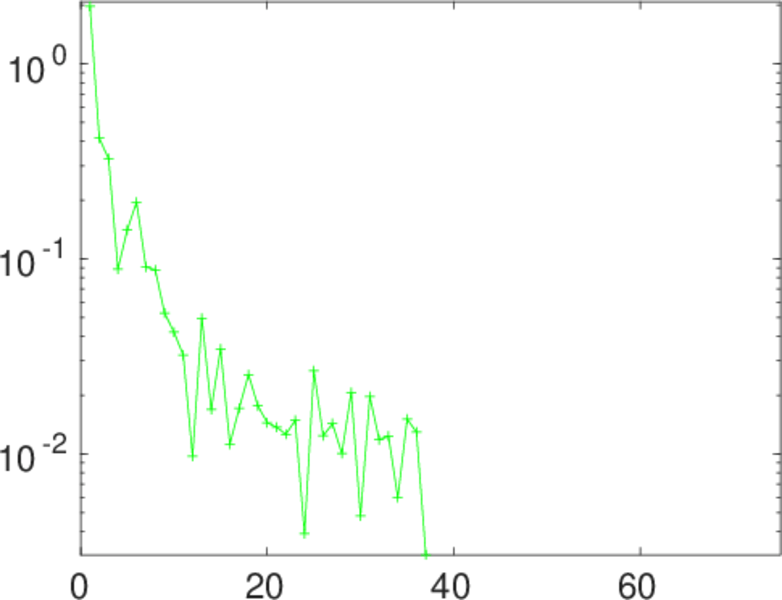
Matrix decompositions plots


Downloads
References
|
[1]
|
Jérôme Kunegis.
KONECT – The Koblenz Network Collection.
In Proc. Int. Conf. on World Wide Web Companion, pages
1343–1350, 2013.
[ http ]
|
|
[2]
|
M. Lichman.
UCI Machine Learning Repository, 2013.
[ http ]
|
 KONECT ‣ Networks ‣
Buy Me a Coffee
KONECT ‣ Networks ‣
Buy Me a Coffee