NIPS full papers
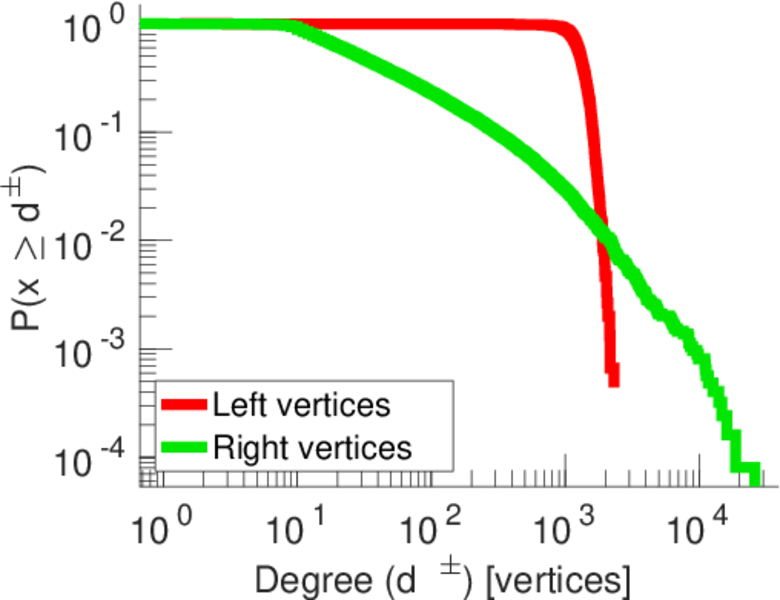
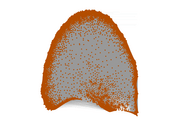
This is the bipartite document–word dataset of NIPS full papers. Left nodes
are documents and right nodes are words. Edge weights are multiplicities.
Metadata
Statistics
| Size | n = | 13,875
|
| Left size | n1 = | 1,500
|
| Right size | n2 = | 12,375
|
| Volume | m = | 1,932,365
|
| Unique edge count | m̿ = | 746,316
|
| Wedge count | s = | 316,414,350
|
| Claw count | z = | 60,669,295,416
|
| Cross count | x = | 10,271,177,488,043
|
| Square count | q = | 7,325,274,840
|
| 4-Tour count | T4 = | 59,870,386,232
|
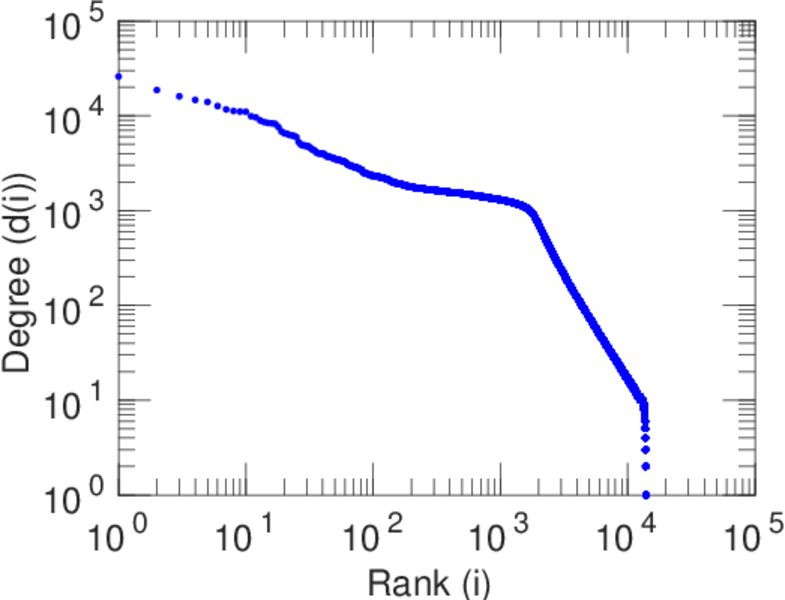
| Maximum degree | dmax = | 1,455
|
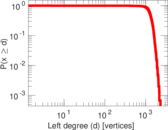
| Maximum left degree | d1max = | 914
|
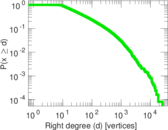
| Maximum right degree | d2max = | 1,455
|
| Average degree | d = | 278.539
|
| Average left degree | d1 = | 1,288.24
|
| Average right degree | d2 = | 156.151
|
| Fill | p = | 0.040 205 6
|
| Average edge multiplicity | m̃ = | 2.589 20
|
| Size of LCC | N = | 13,875
|
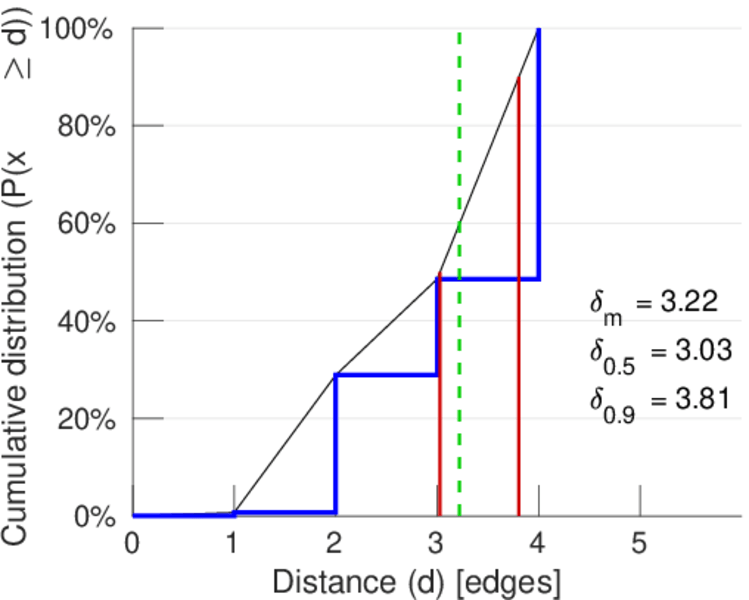
| Diameter | δ = | 6
|
| 50-Percentile effective diameter | δ0.5 = | 3.028 37
|
| 90-Percentile effective diameter | δ0.9 = | 3.805 67
|
| Median distance | δM = | 4
|
| Mean distance | δm = | 3.219 19
|
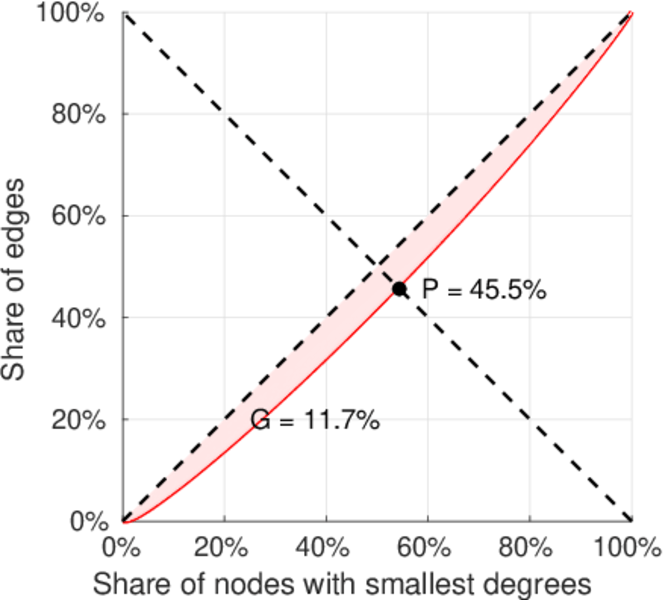
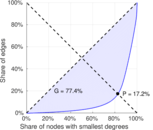
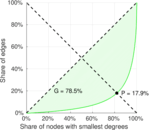
| Gini coefficient | G = | 0.821 596
|
| Balanced inequality ratio | P = | 0.140 265
|
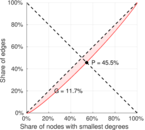
| Left balanced inequality ratio | P1 = | 0.454 947
|
| Right balanced inequality ratio | P2 = | 0.178 579
|
| Relative edge distribution entropy | Her = | 0.892 567
|
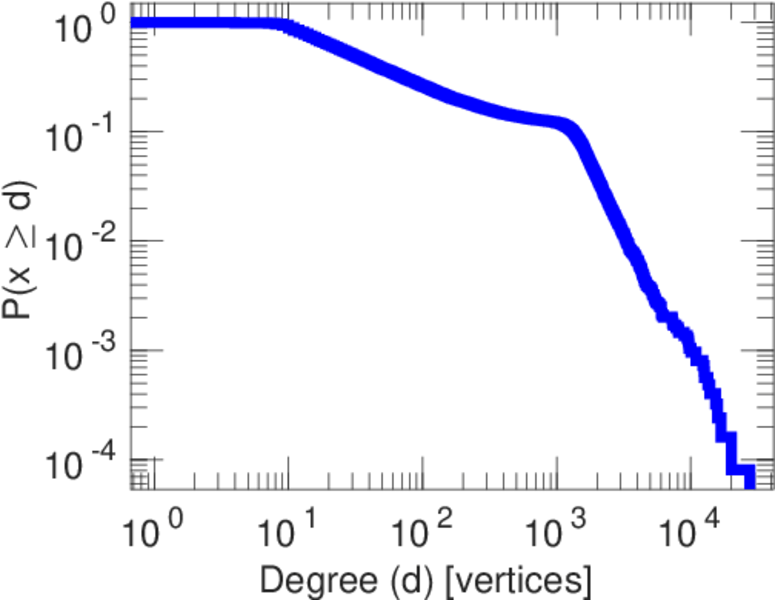
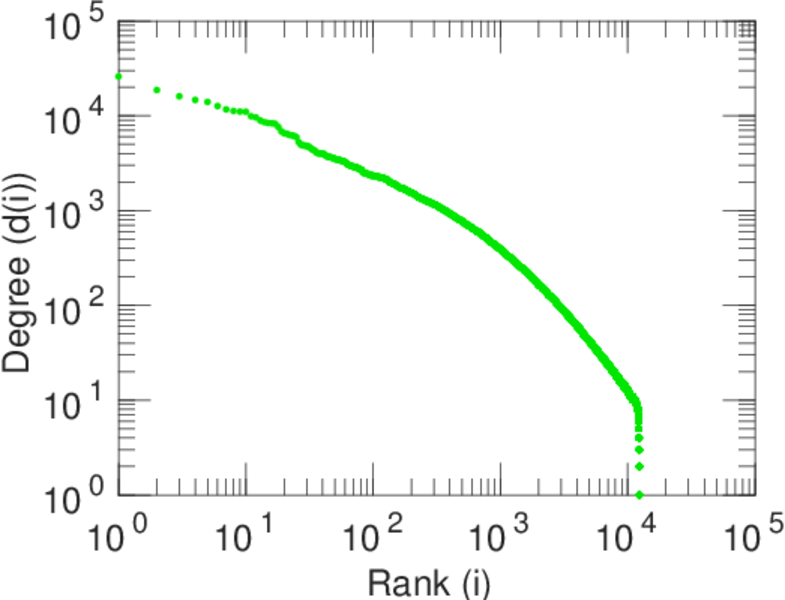
| Power law exponent | γ = | 1.300 92
|
| Tail power law exponent | γt = | 1.521 00
|
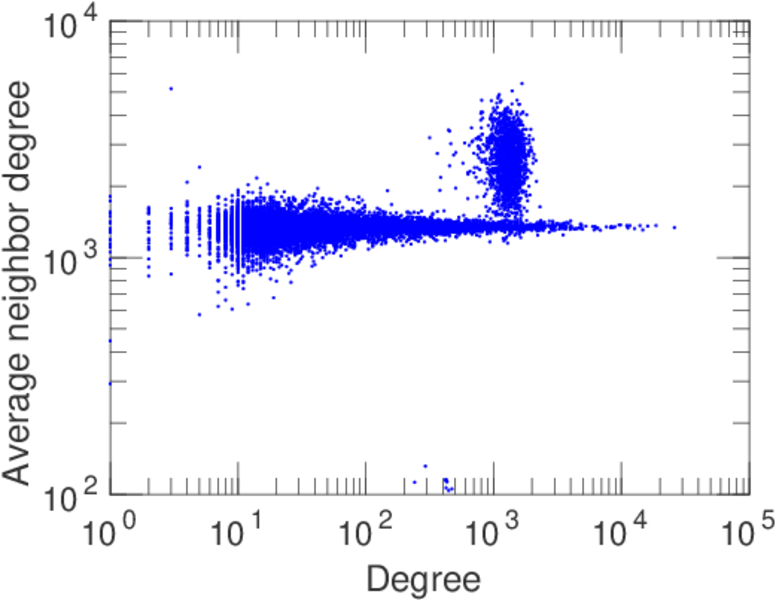
| Degree assortativity | ρ = | −0.042 518 0
|
| Degree assortativity p-value | pρ = | 1.267 82 × 10−295
|
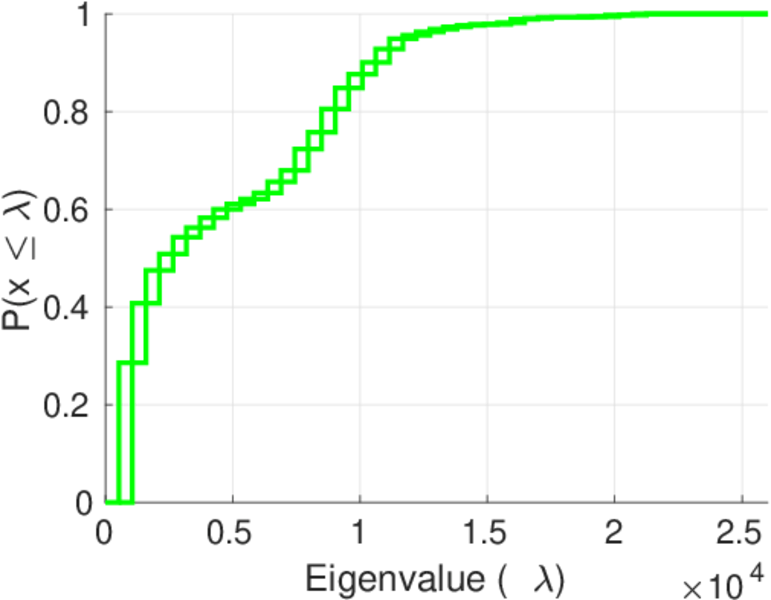
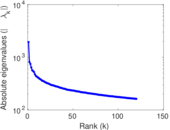
| Spectral norm | α = | 1,943.24
|
| Algebraic connectivity | a = | 0.996 481
|
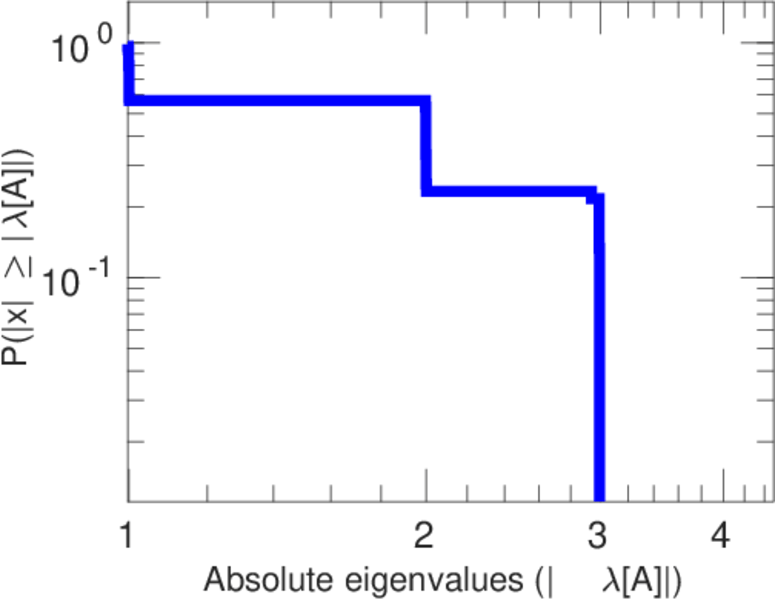
| Spectral separation | |λ1[A] / λ2[A]| = | 2.387 05
|
| Controllability | C = | 10,875
|
| Relative controllability | Cr = | 0.783 784
|
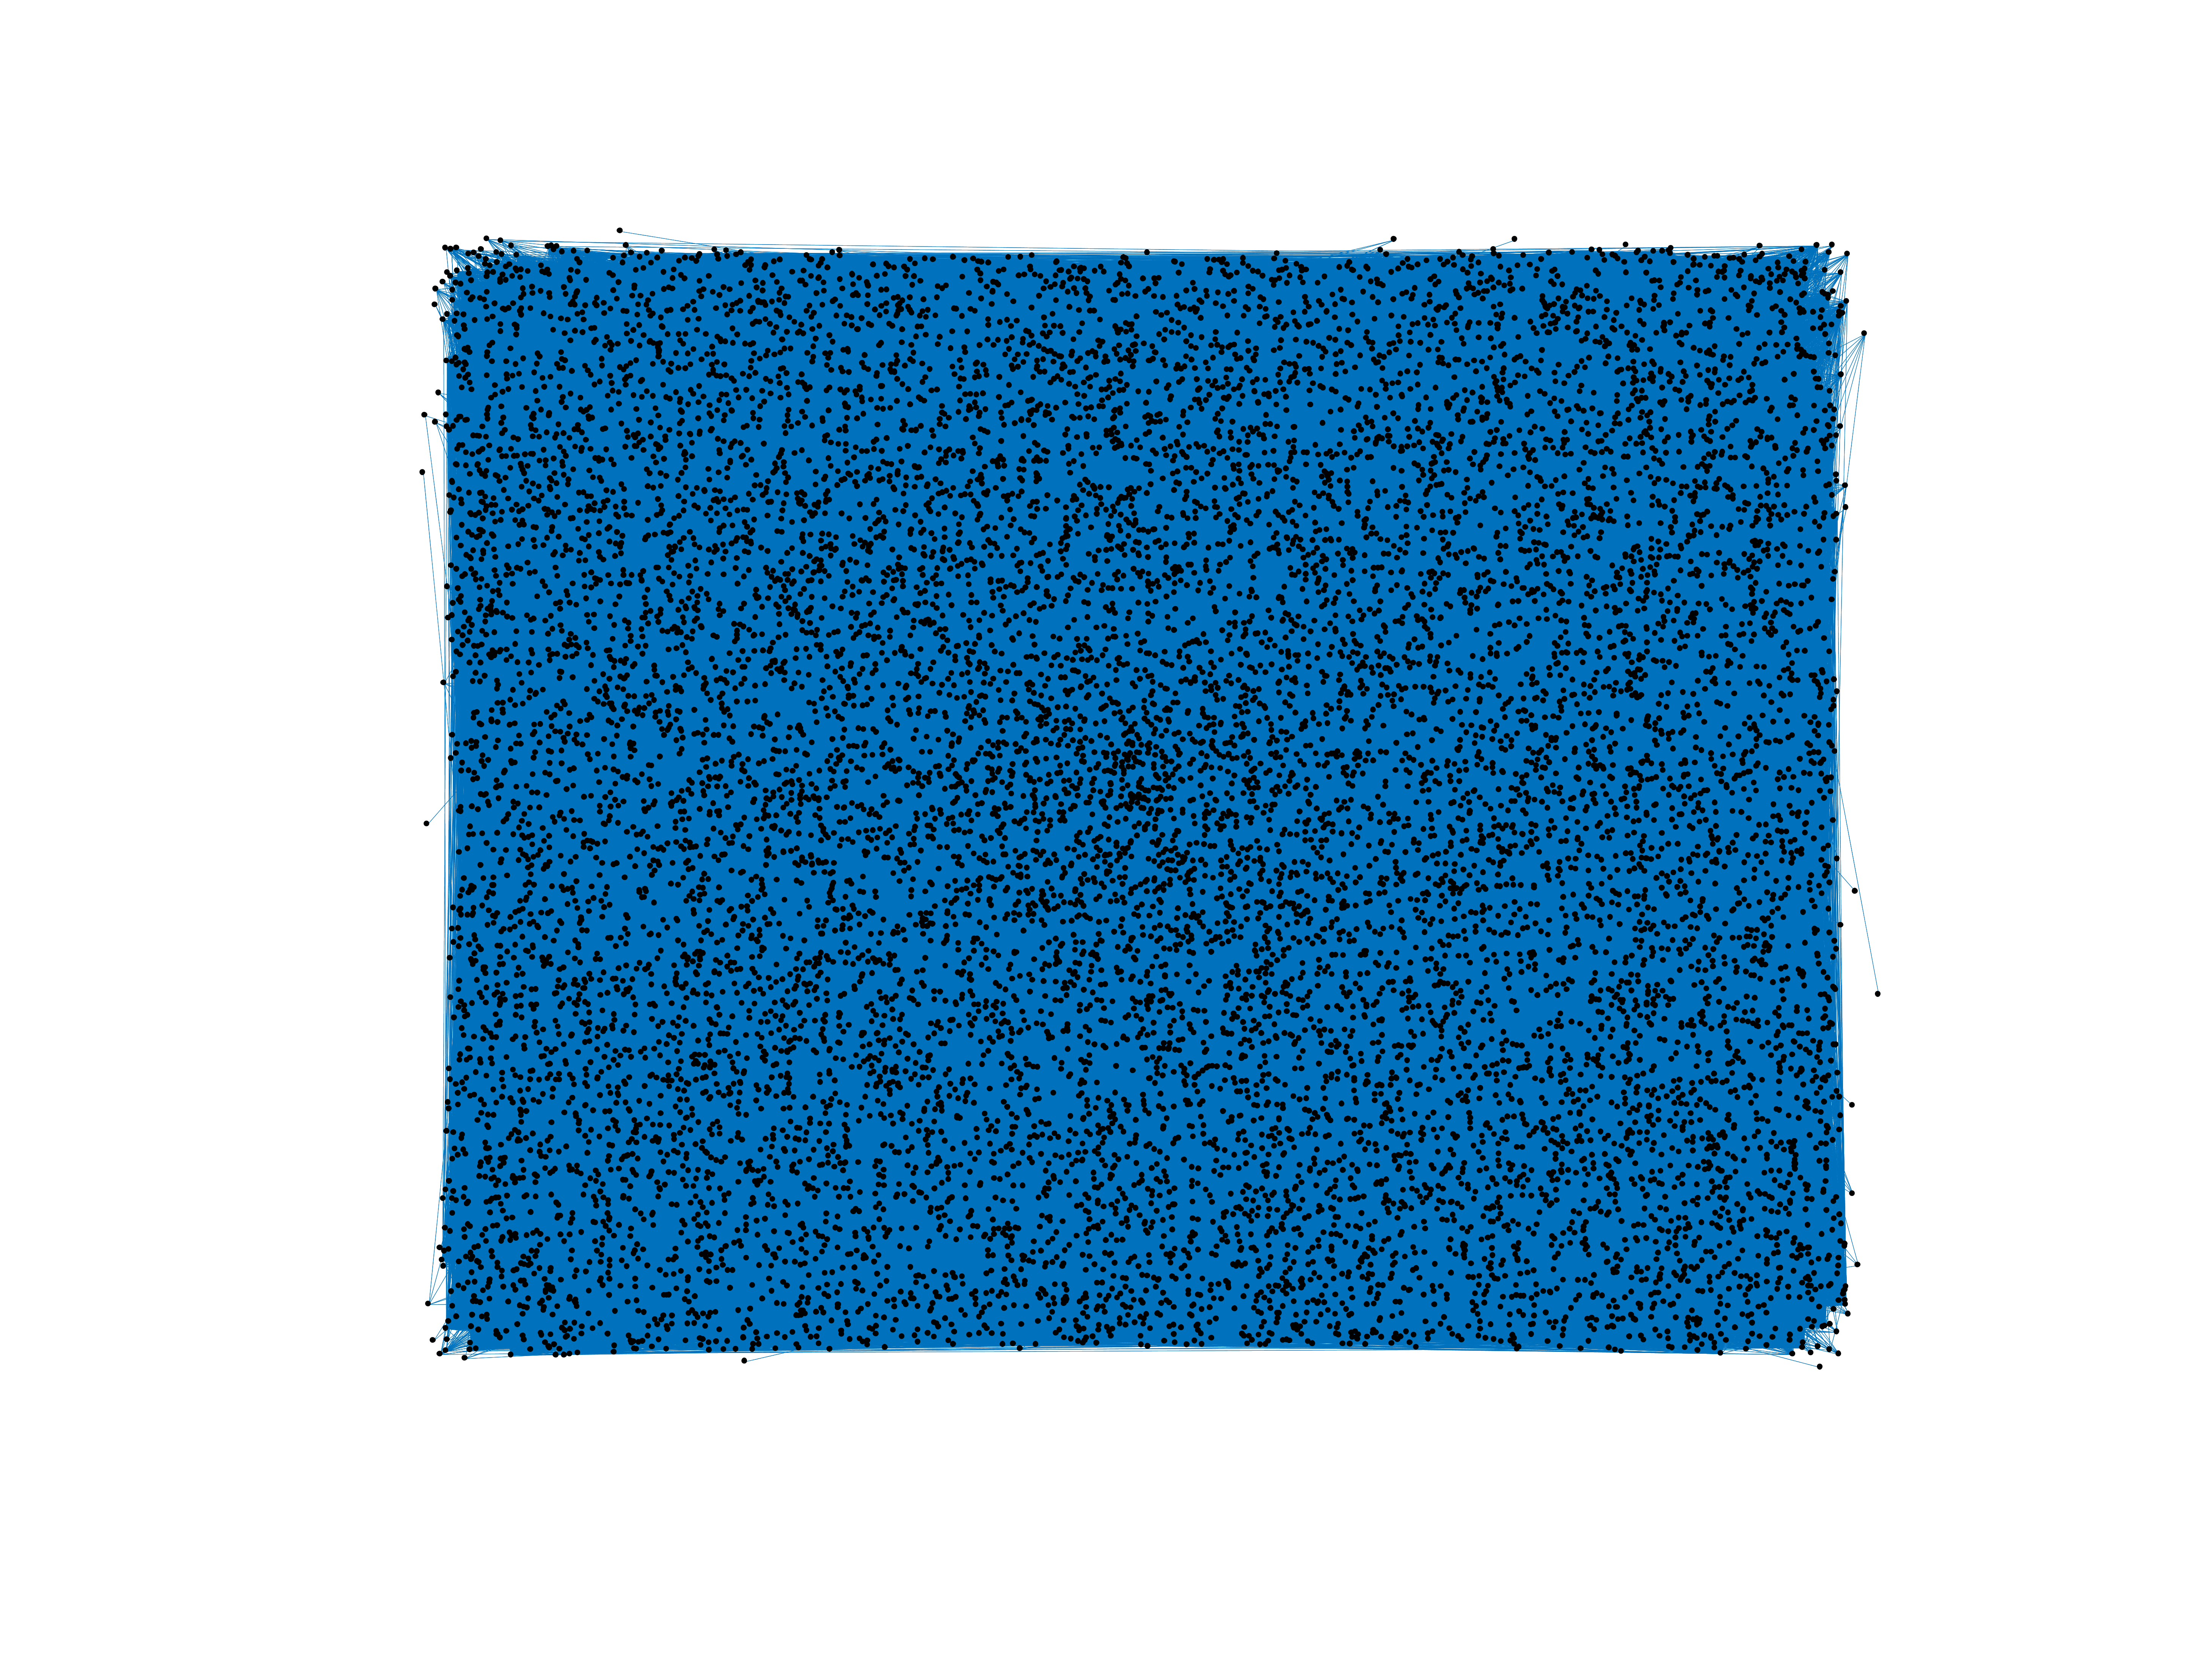
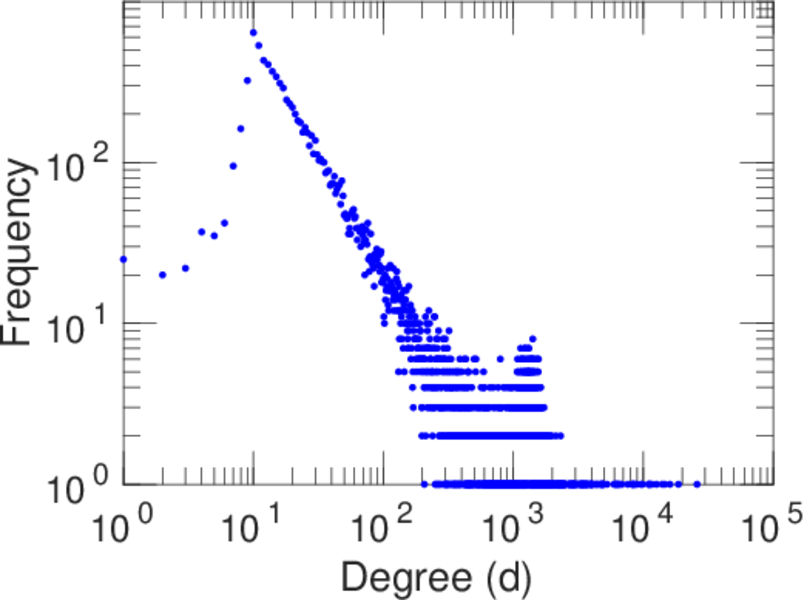
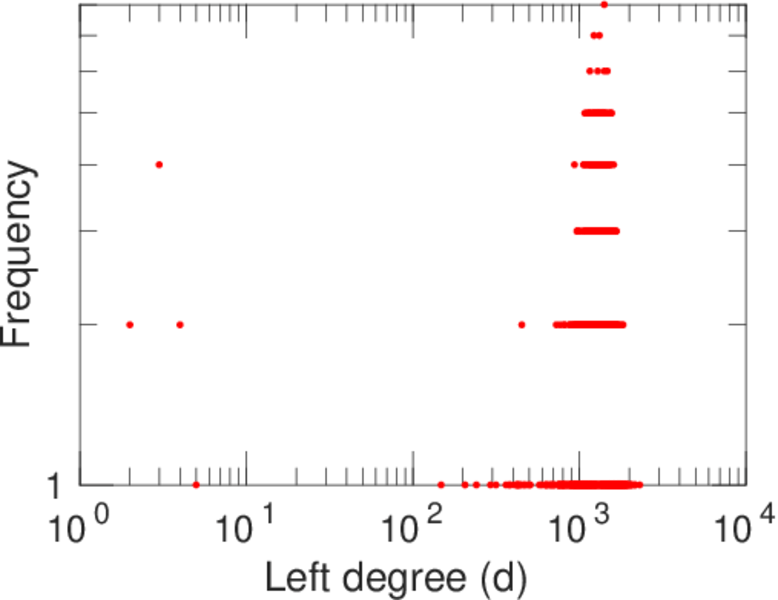
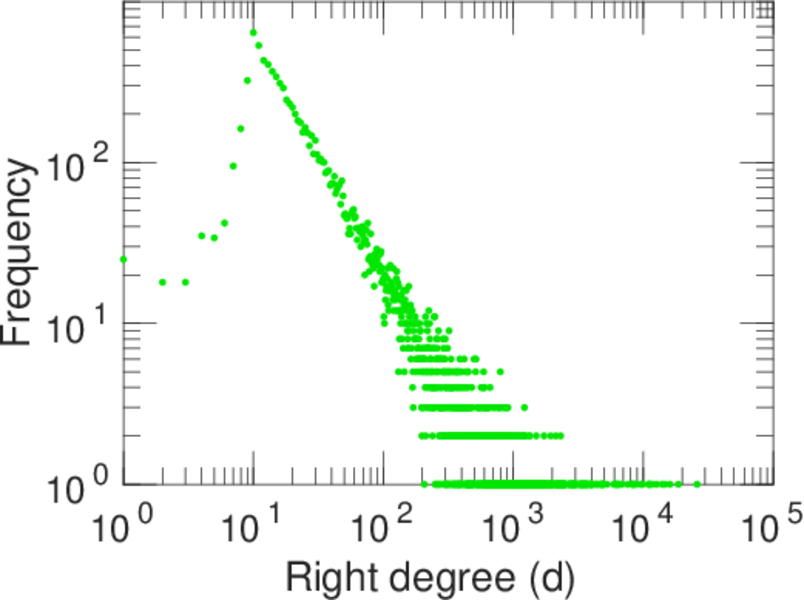
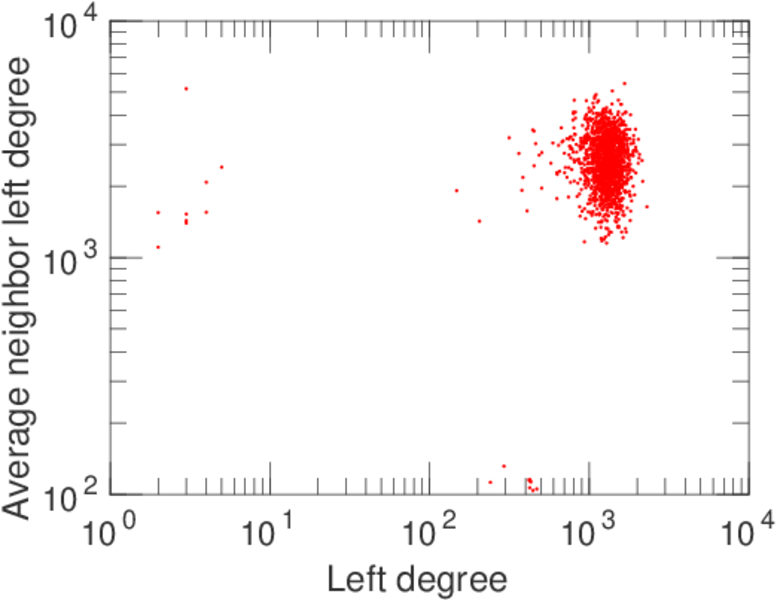
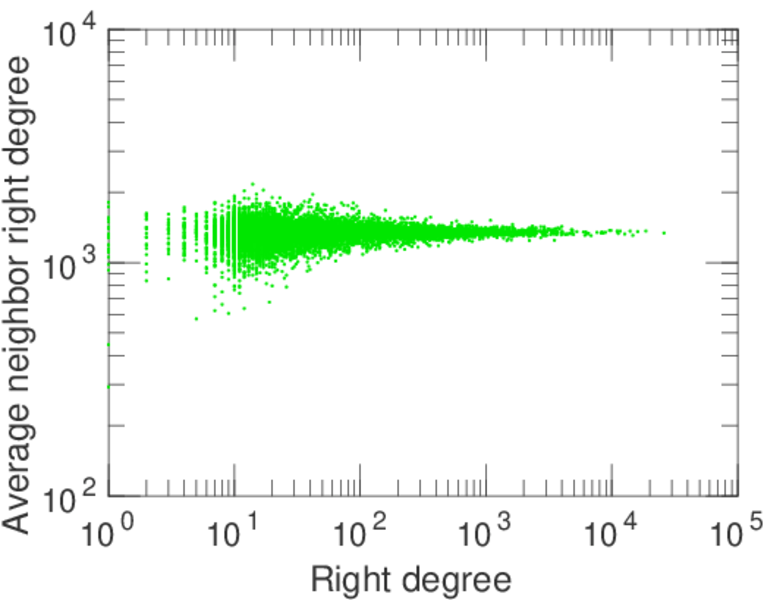
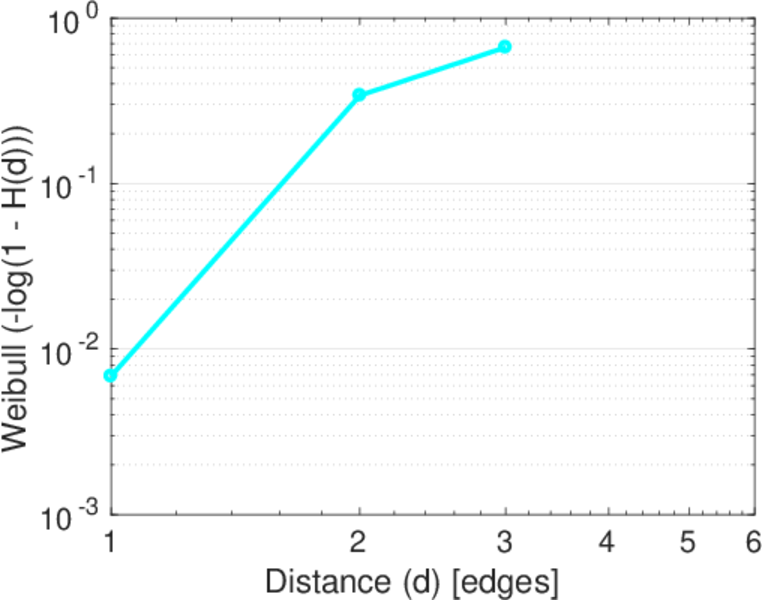
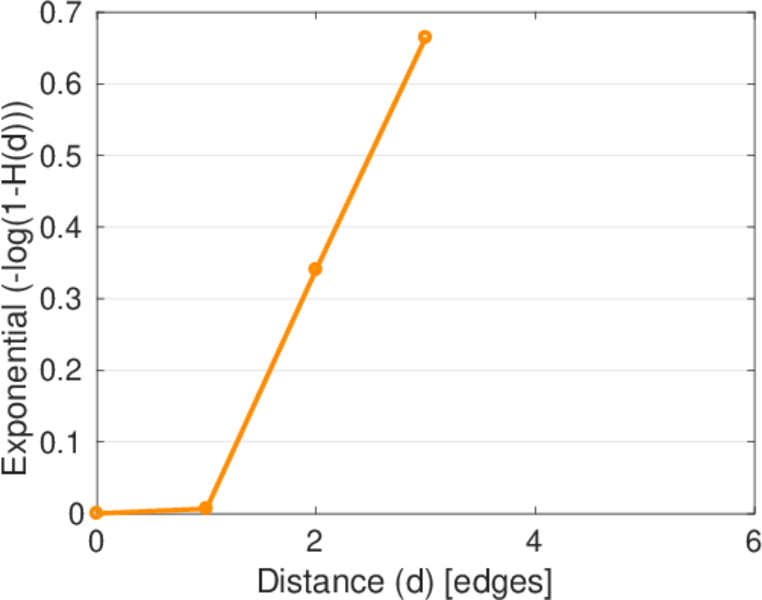
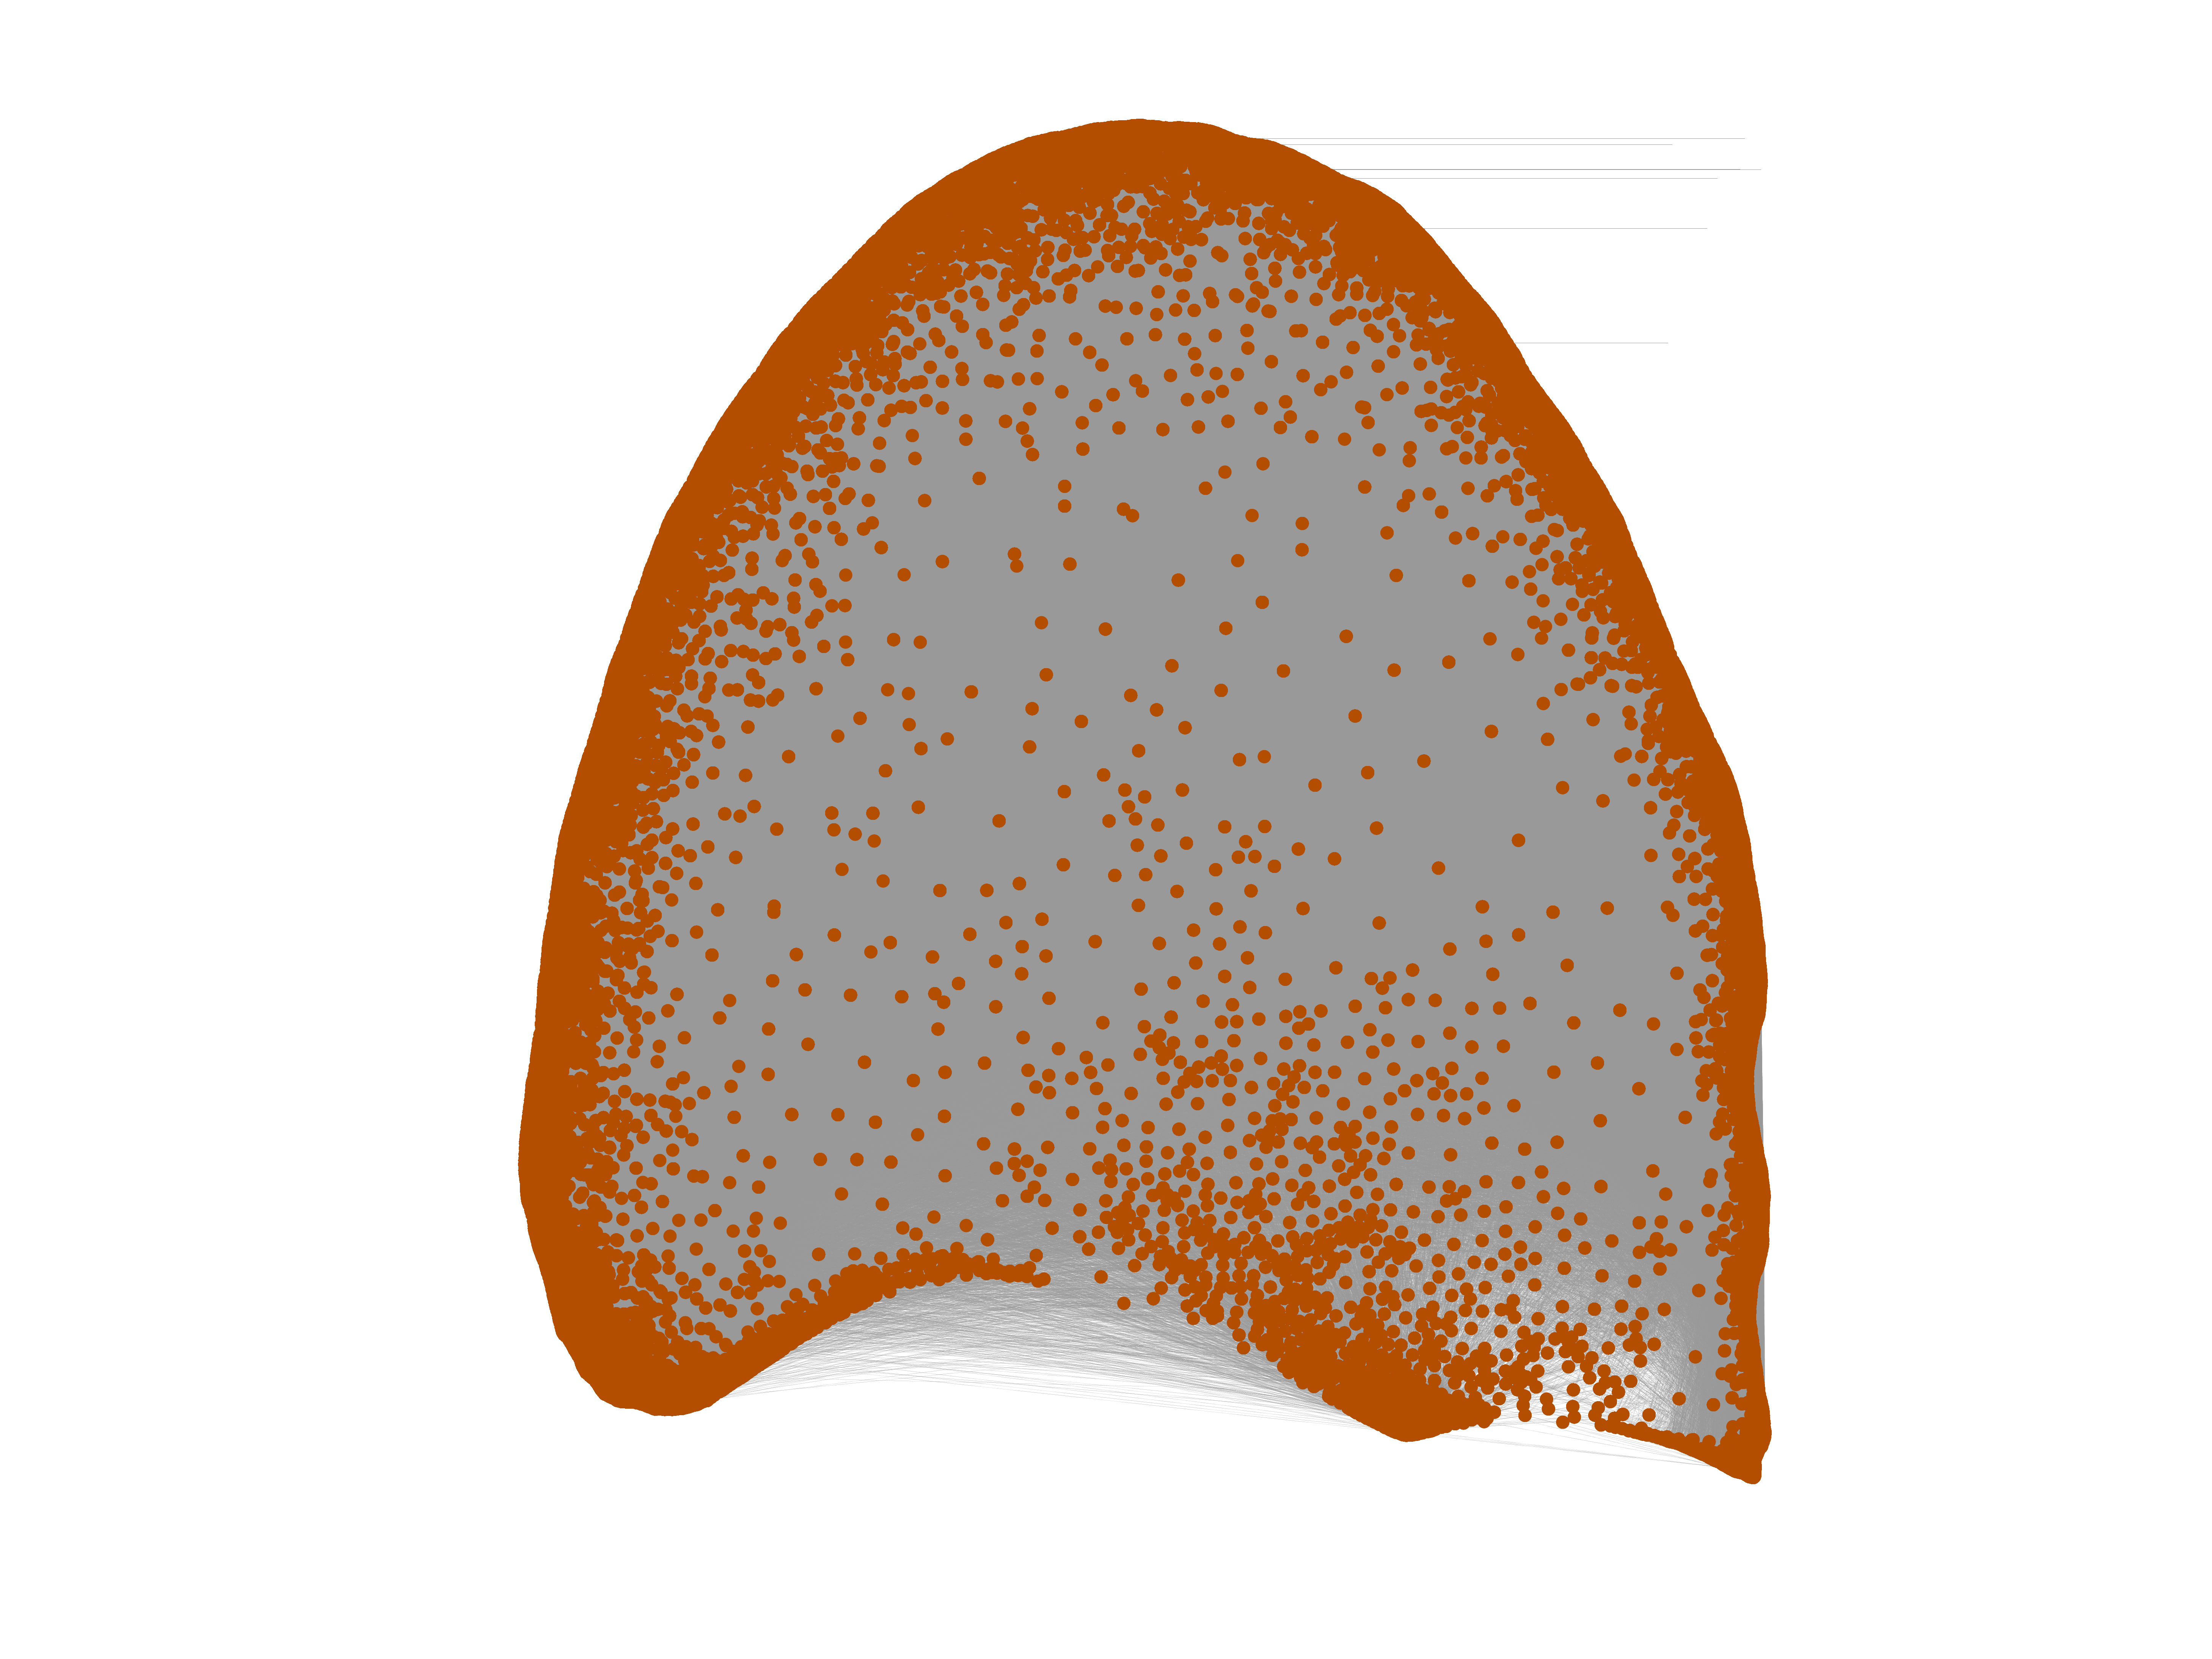
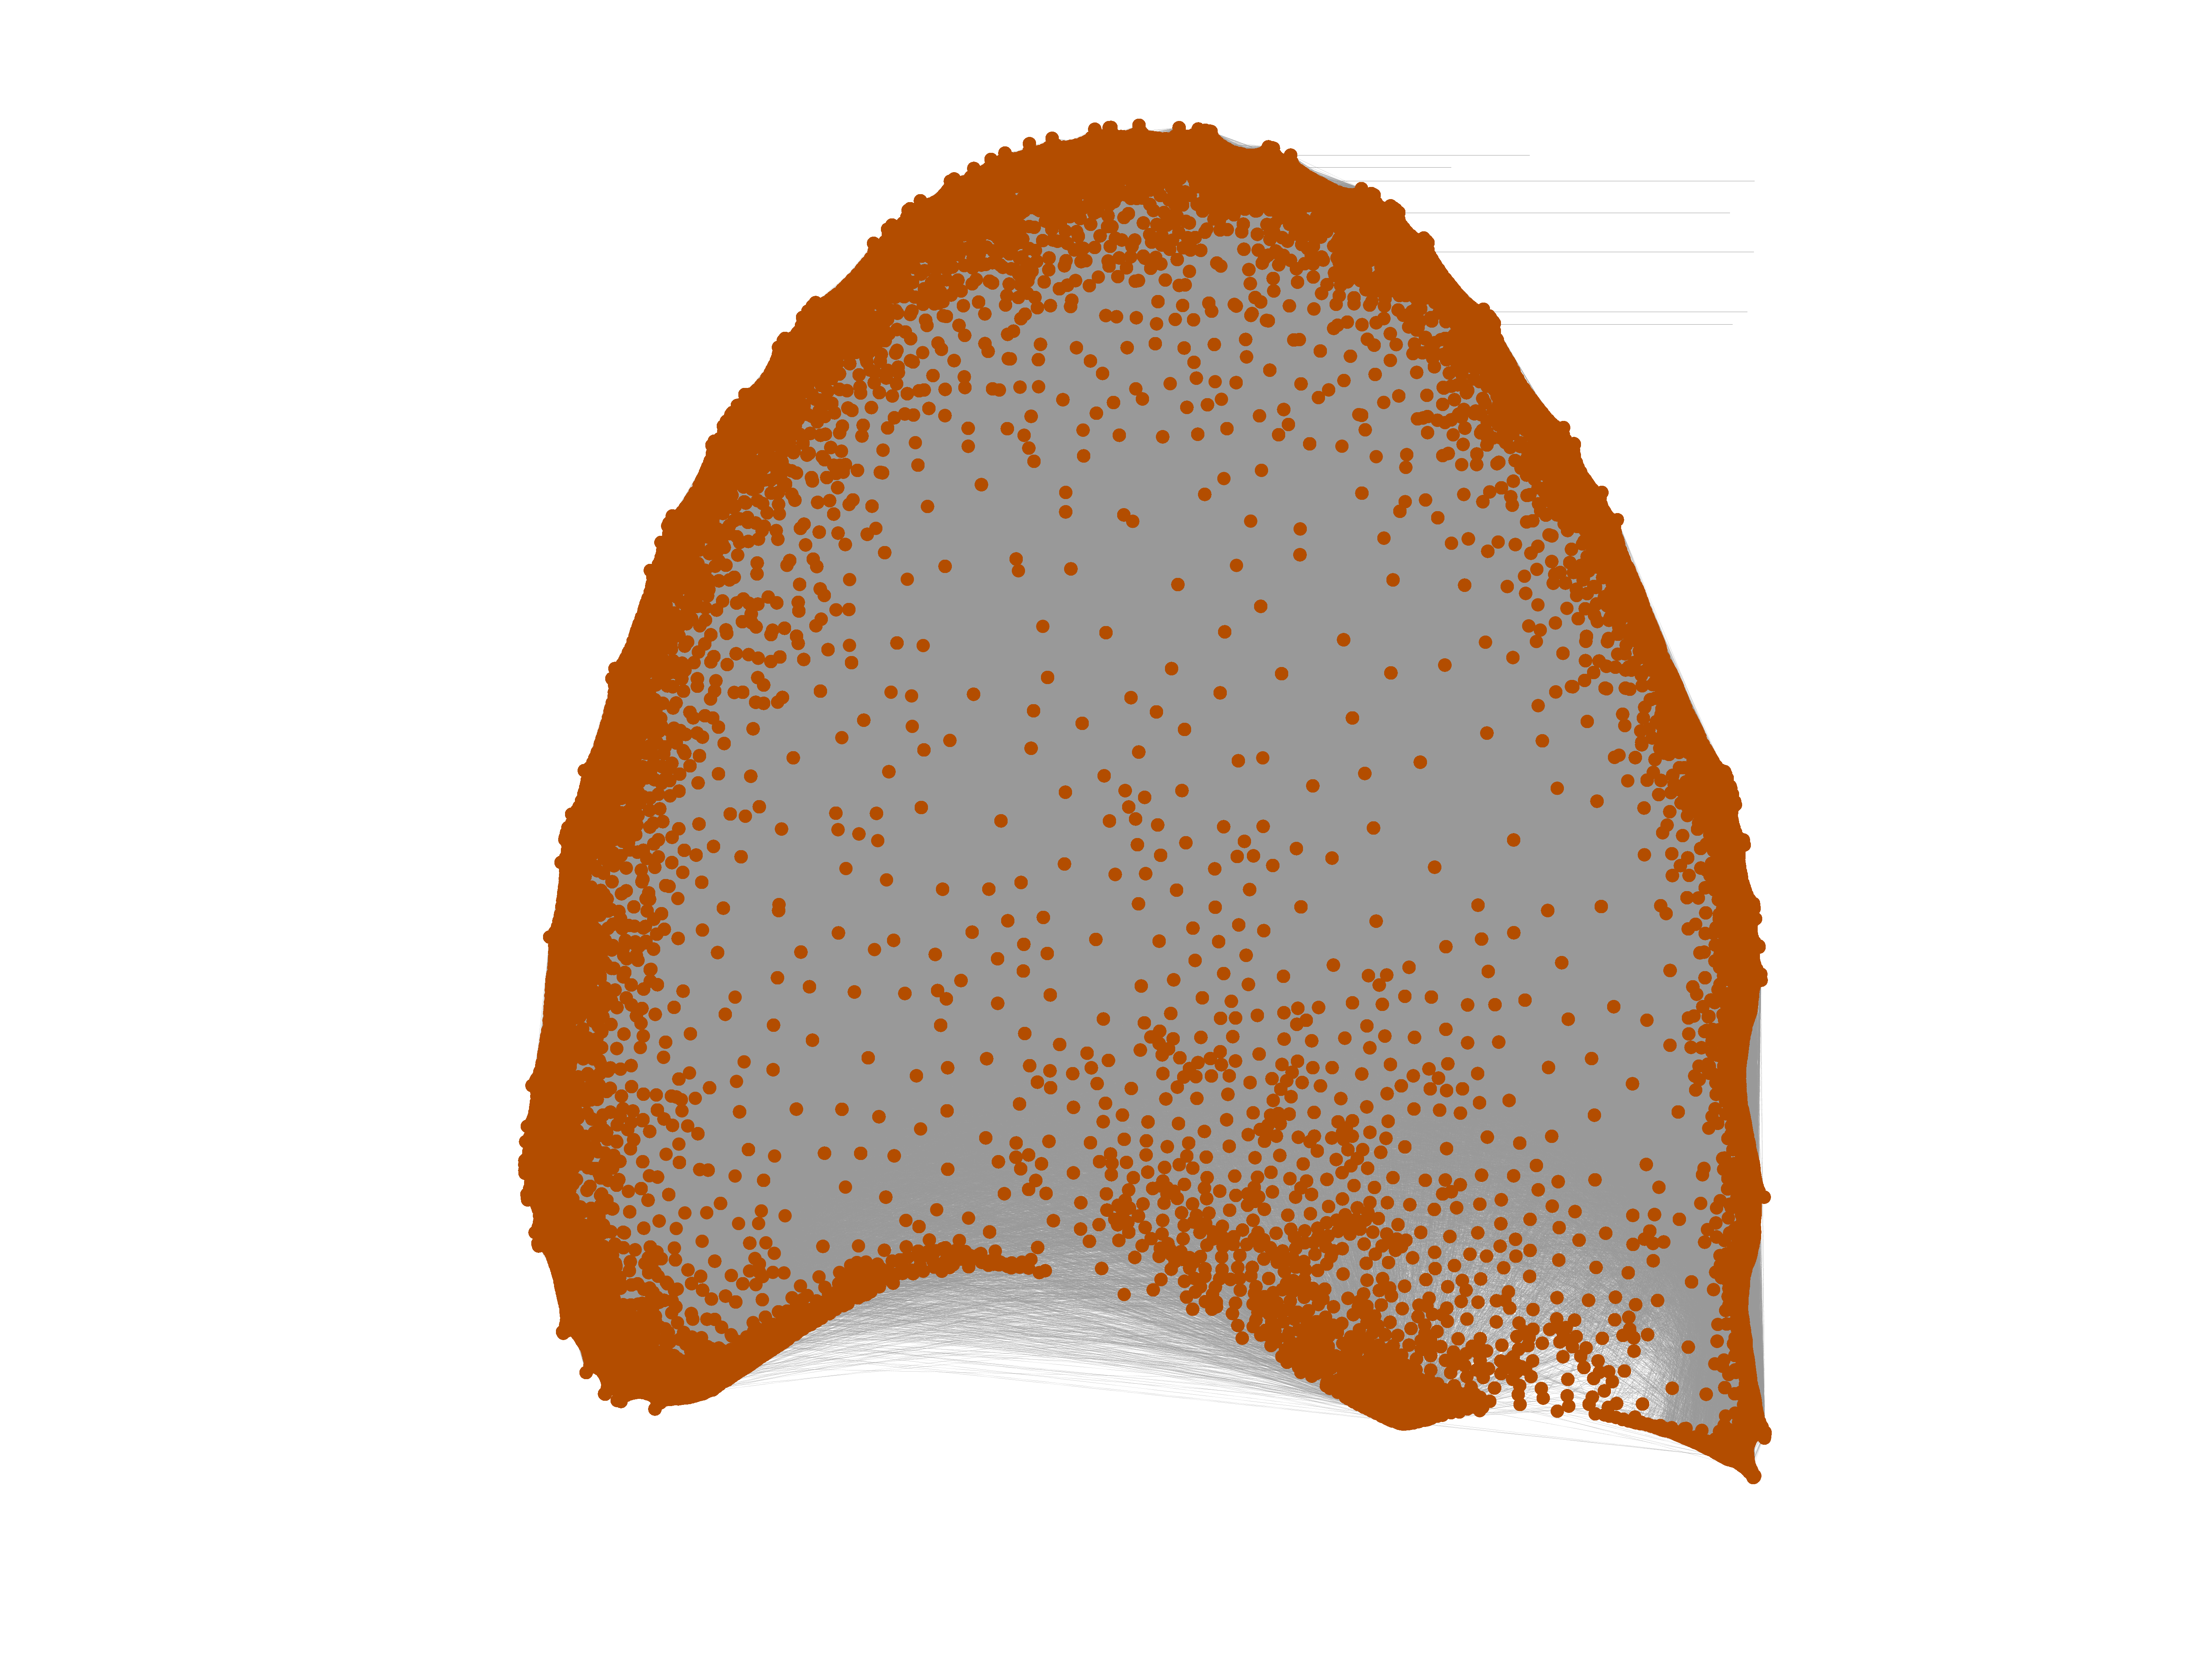
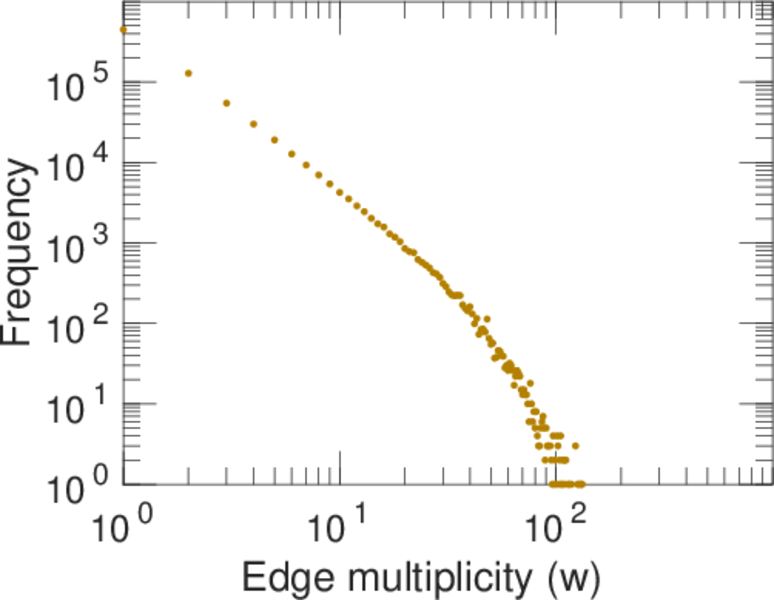
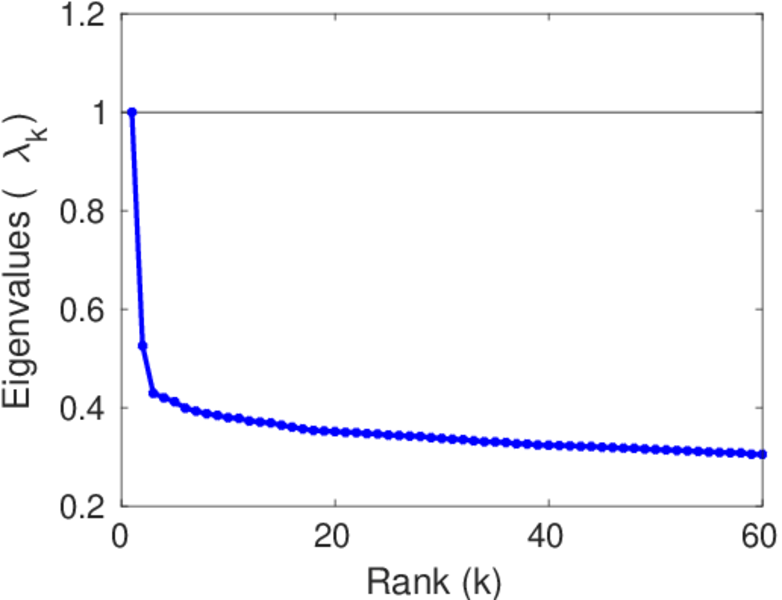
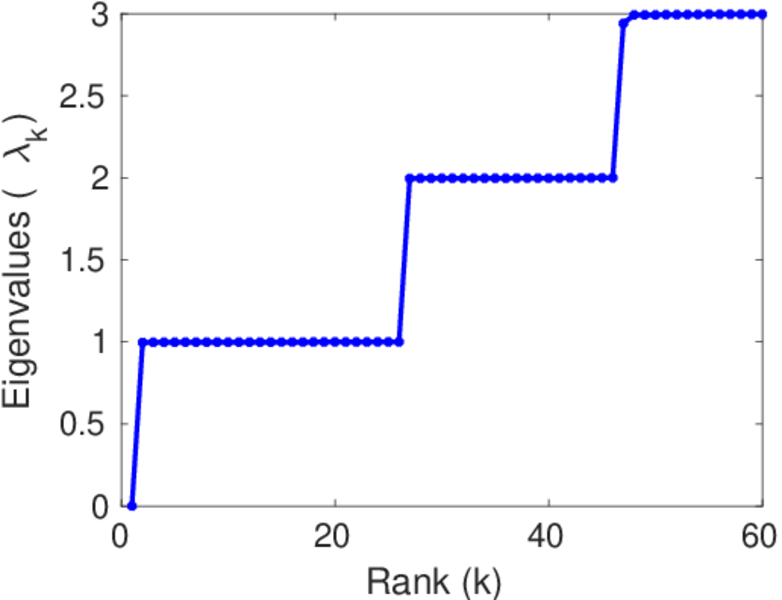
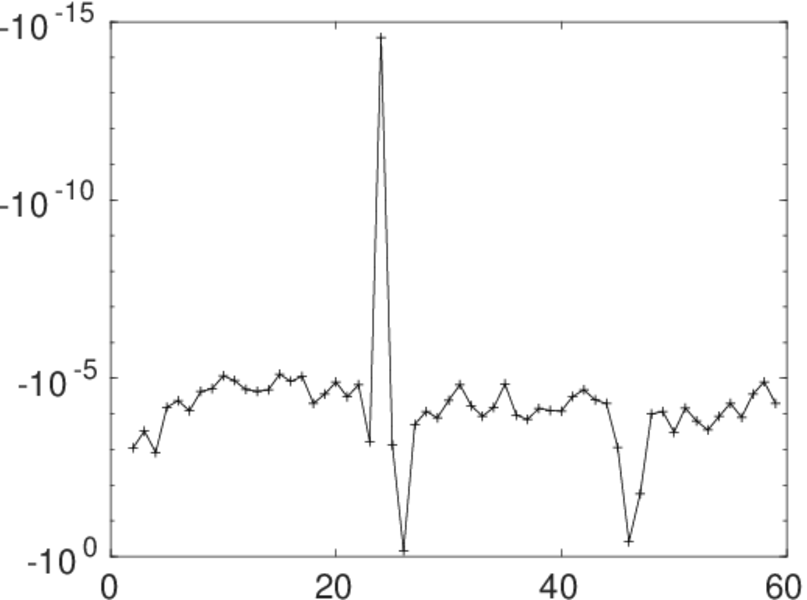
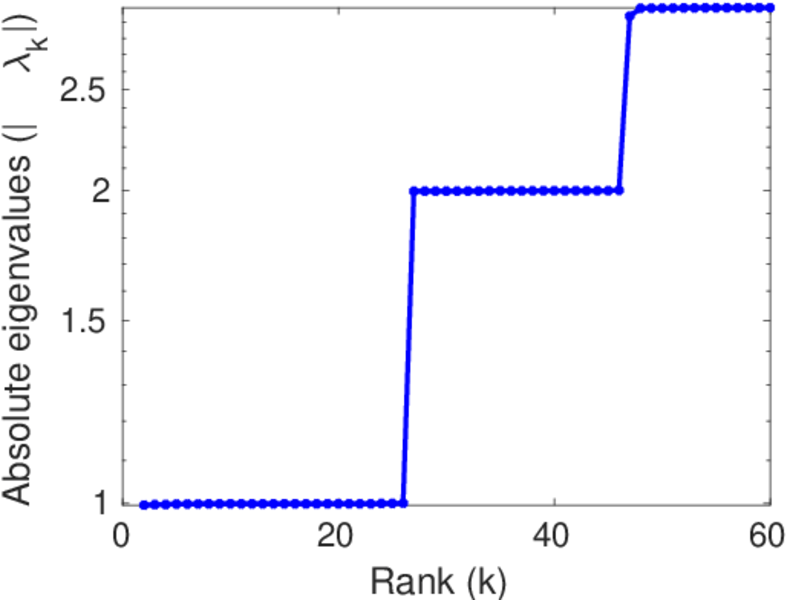
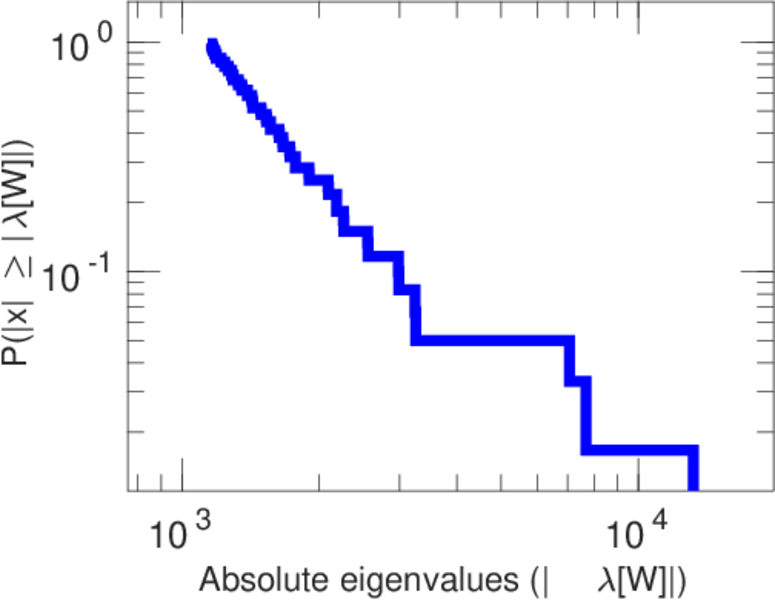
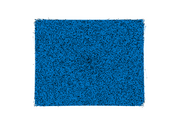
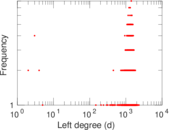
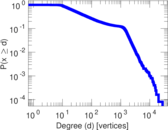
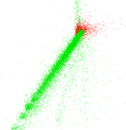
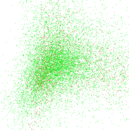
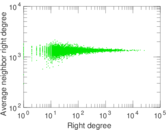
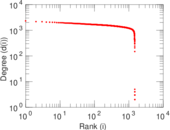
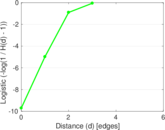
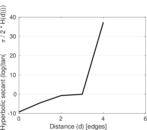
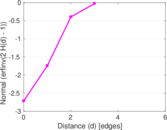
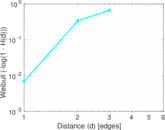
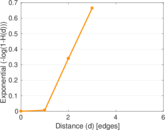
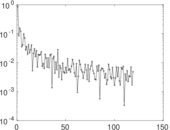
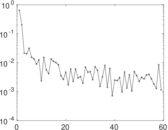
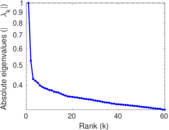
Plots


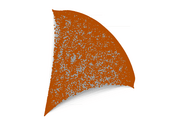
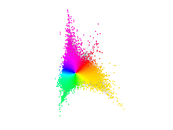

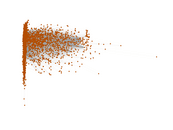
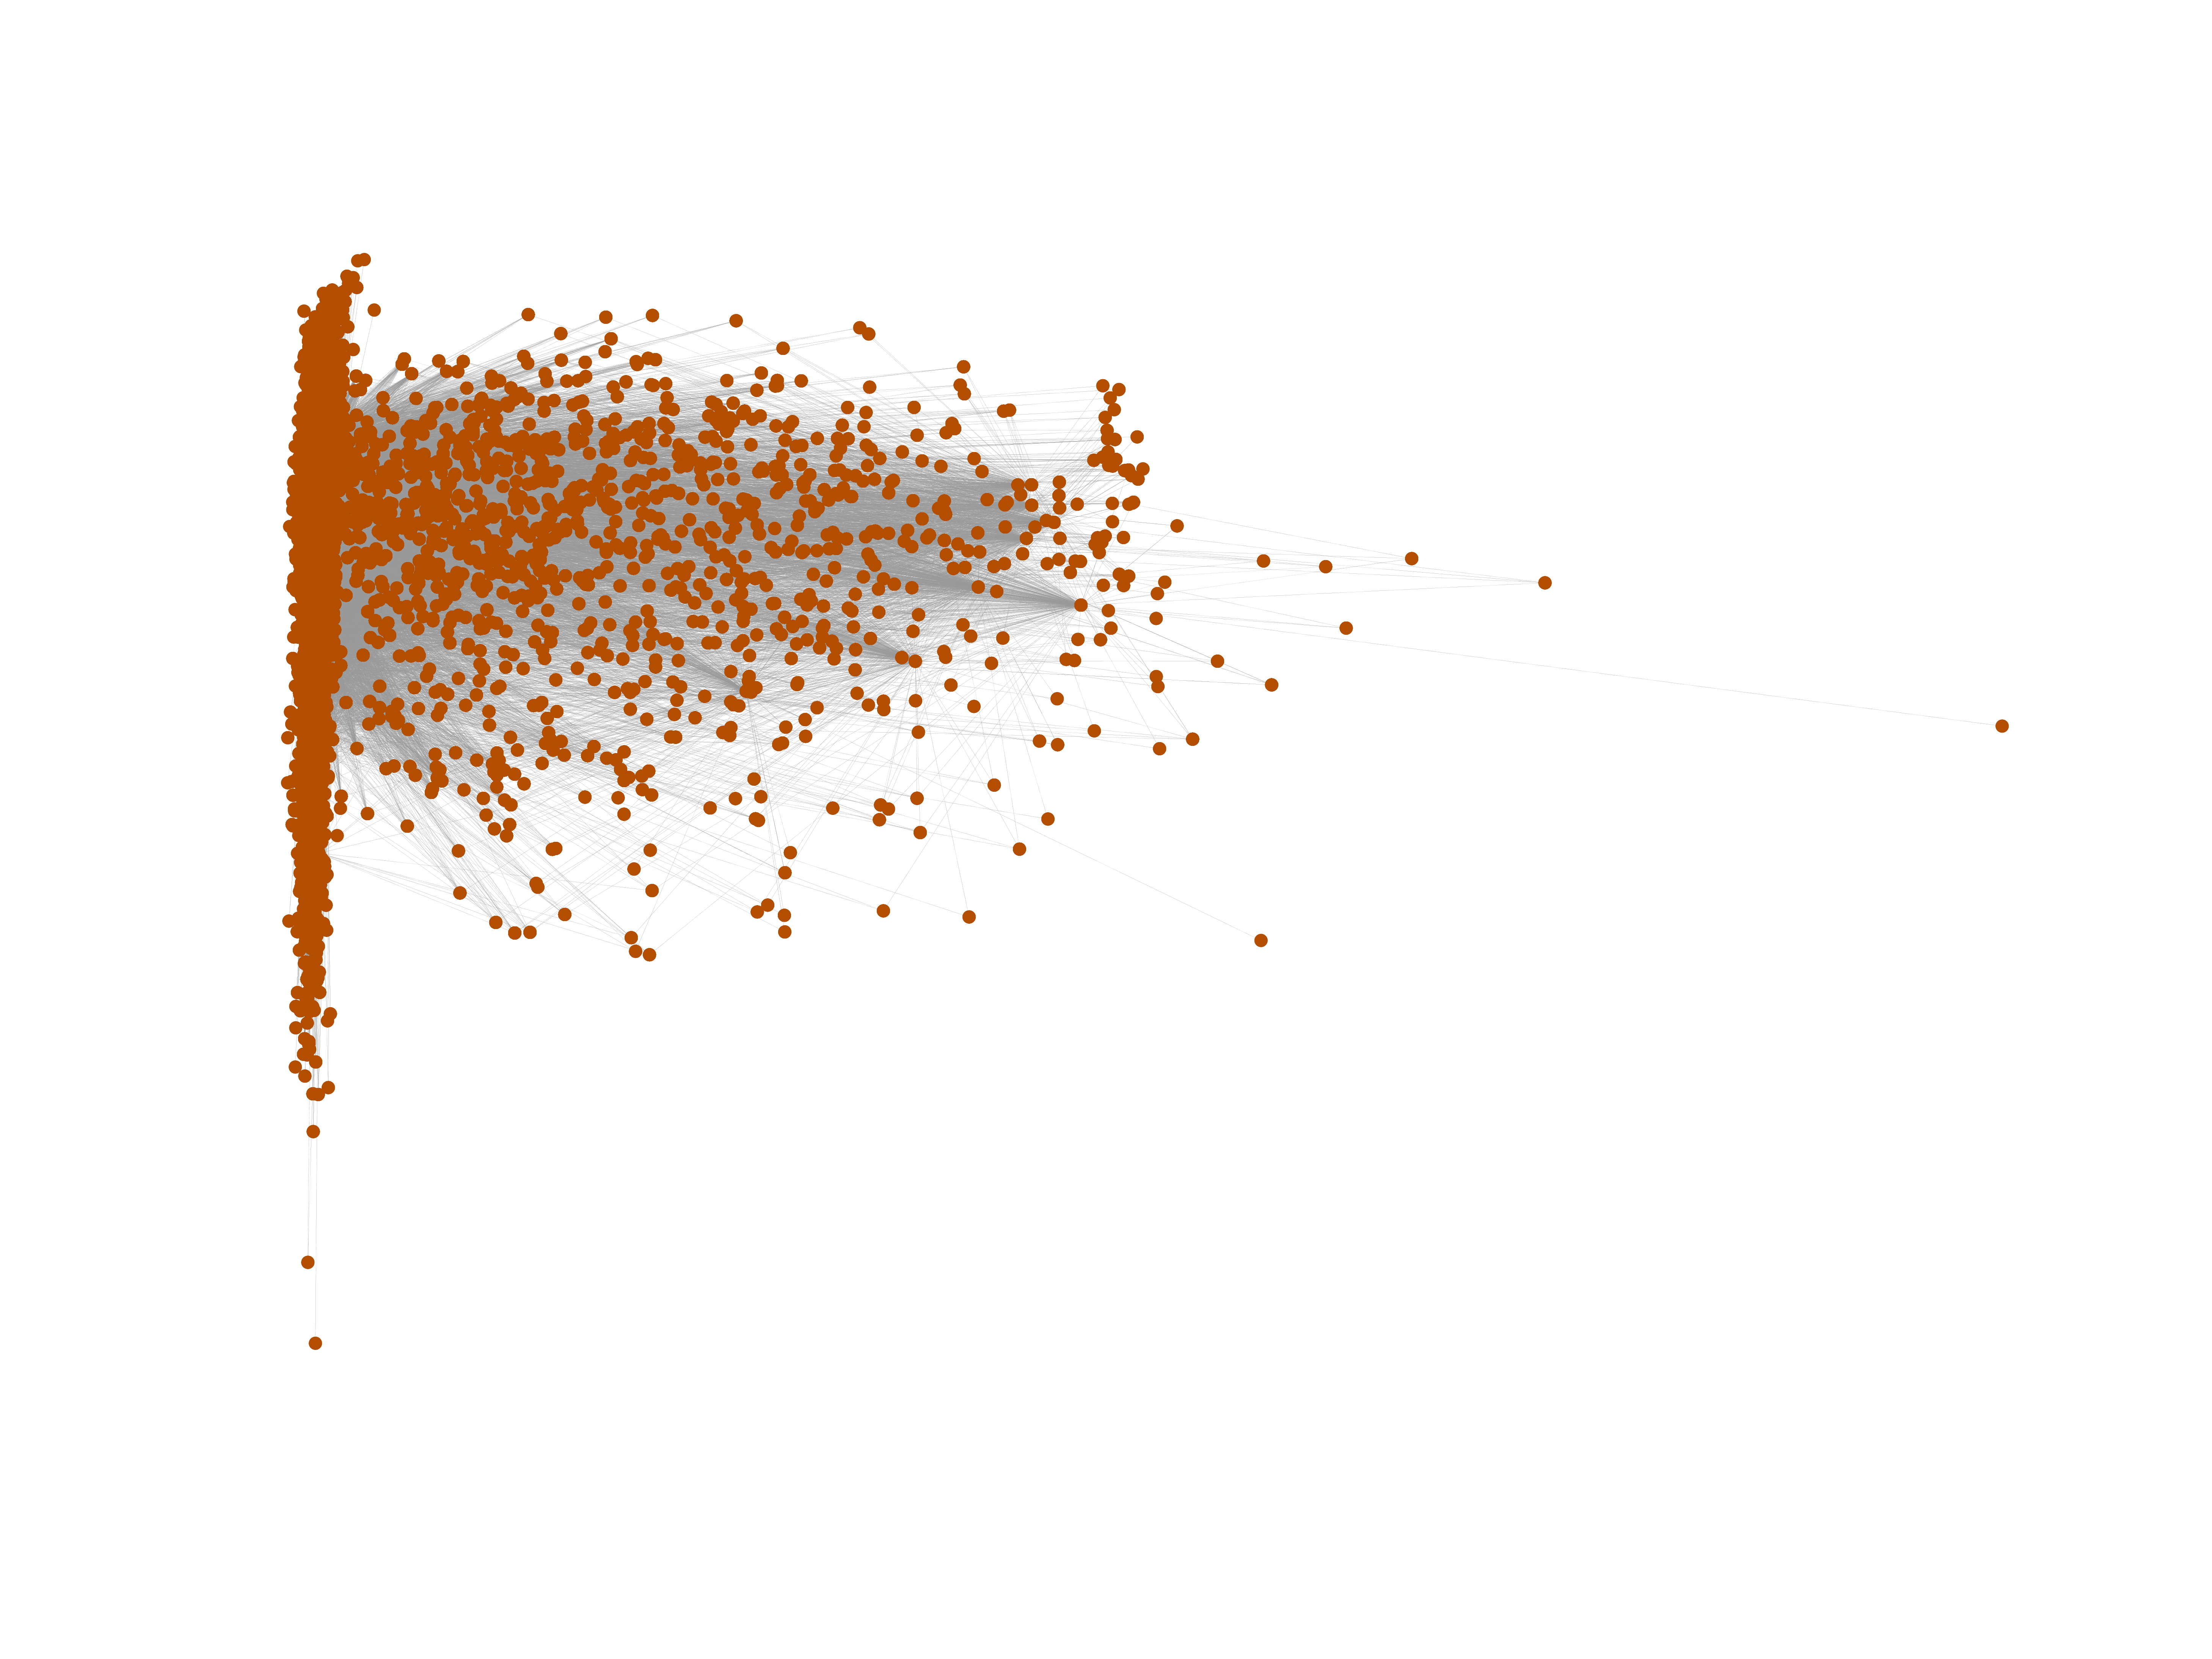
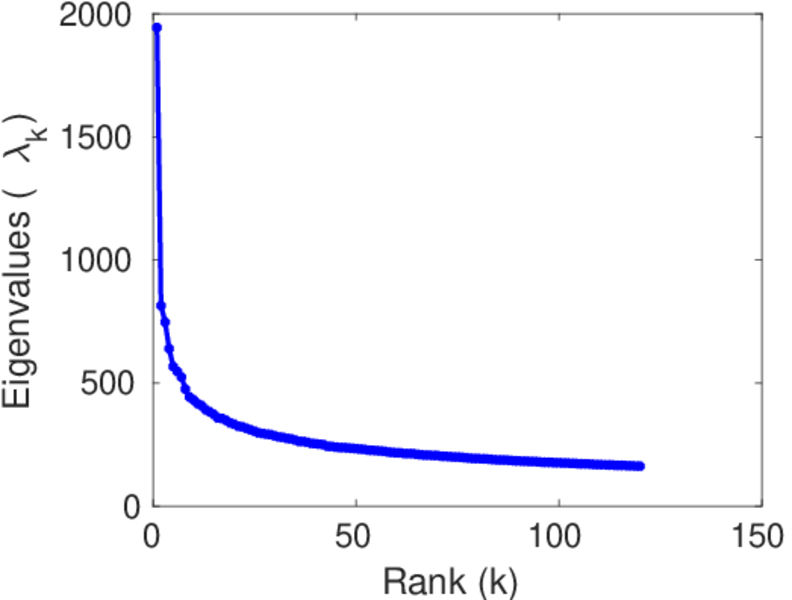
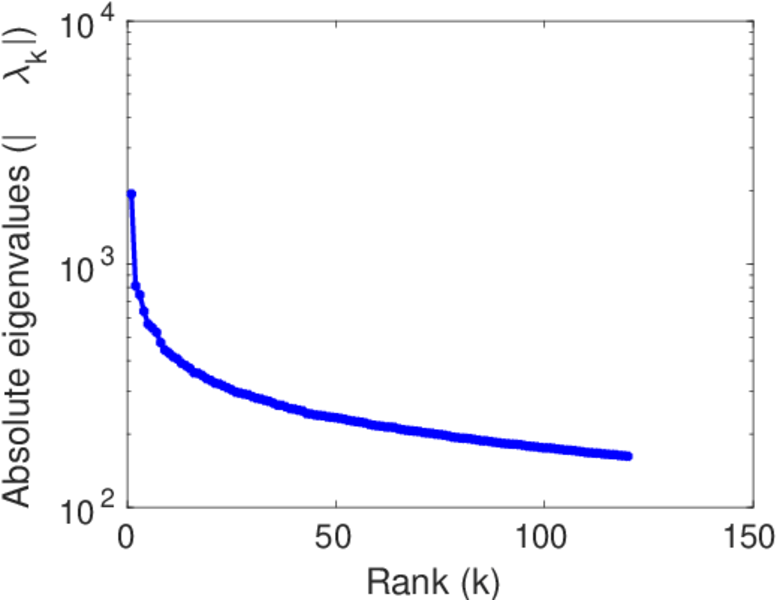
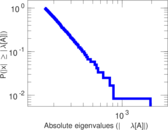
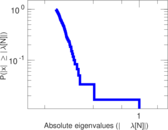
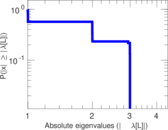
Matrix decompositions plots


Downloads
References
|
[1]
|
Jérôme Kunegis.
KONECT – The Koblenz Network Collection.
In Proc. Int. Conf. on World Wide Web Companion, pages
1343–1350, 2013.
[ http ]
|
|
[2]
|
M. Lichman.
UCI Machine Learning Repository, 2013.
[ http ]
|
 KONECT ‣ Networks ‣
Buy Me a Coffee
KONECT ‣ Networks ‣
Buy Me a Coffee