BookCrossing (implicit)
This network contains information about books read by members of the
BookCrossing community. Nodes of the network are users and books, and an edge
denotes that a user has interacted with a book.
Metadata
Statistics
| Size | n = | 445,801
|
| Left size | n1 = | 105,278
|
| Right size | n2 = | 340,523
|
| Volume | m = | 1,149,739
|
| Wedge count | s = | 465,125,366
|
| Claw count | z = | 751,050,106,734
|
| Cross count | x = | 1,817,486,272,201,908
|
| Square count | q = | 93,843,300
|
| 4-Tour count | T4 = | 2,613,565,786
|
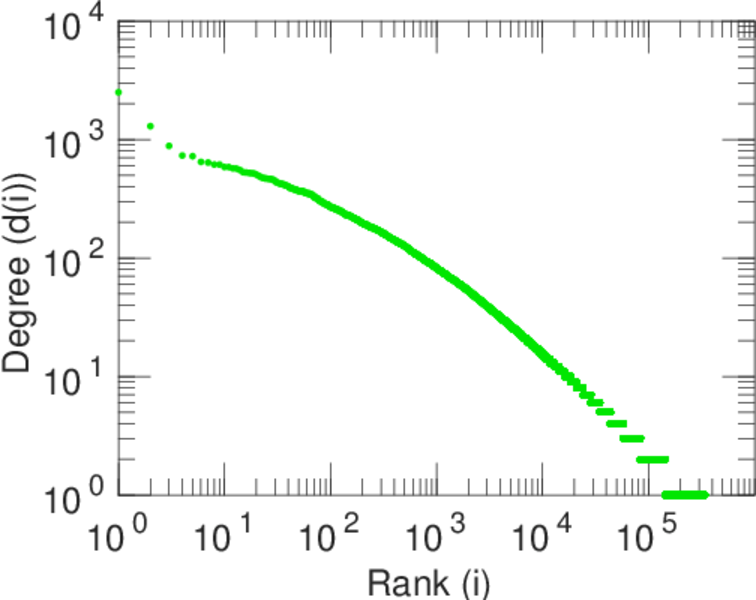
| Maximum degree | dmax = | 13,601
|
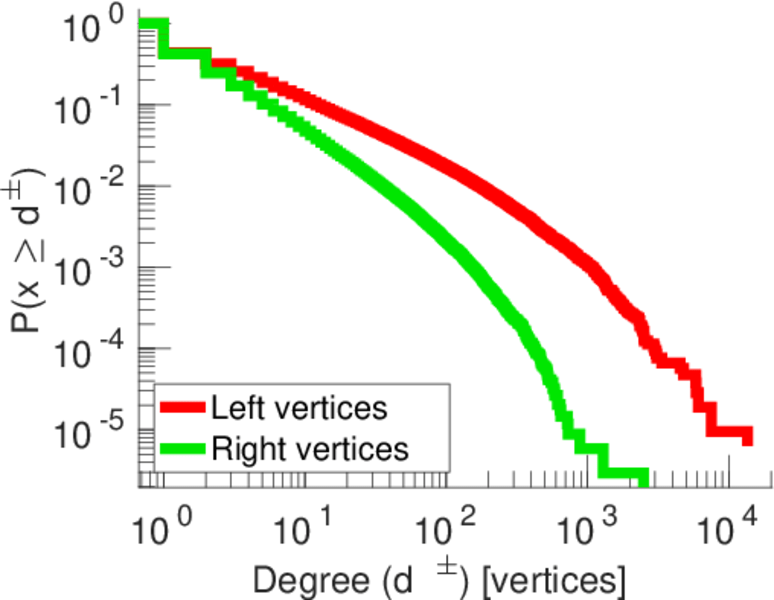
| Maximum left degree | d1max = | 13,601
|
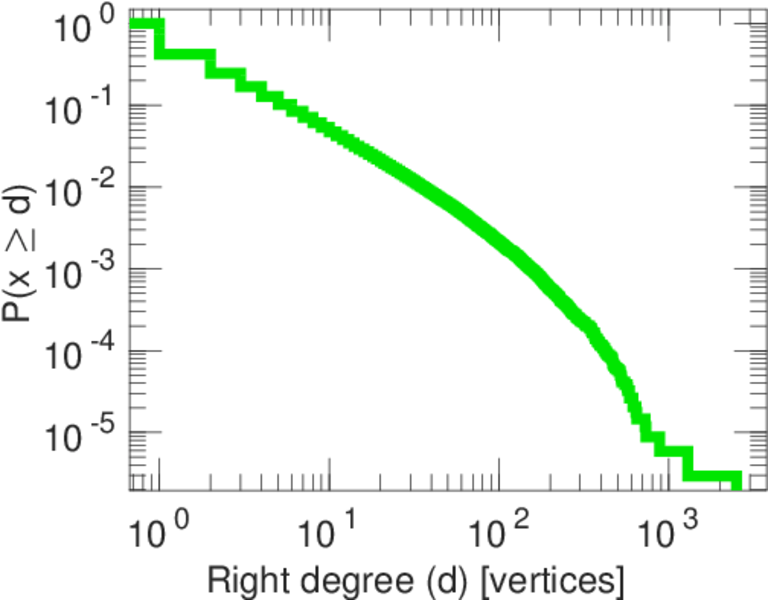
| Maximum right degree | d2max = | 2,502
|
| Average degree | d = | 5.158 08
|
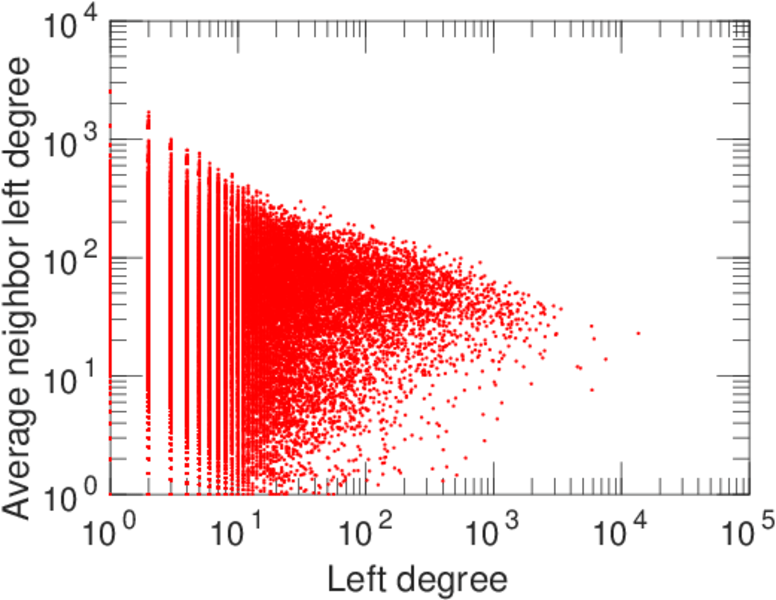
| Average left degree | d1 = | 10.921 0
|
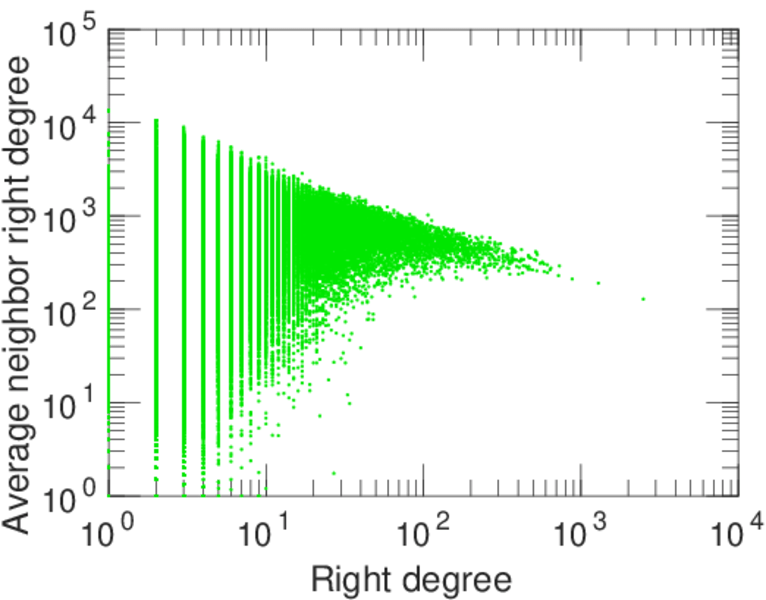
| Average right degree | d2 = | 3.376 39
|
| Fill | p = | 3.207 12 × 10−5
|
| Size of LCC | N = | 420,143
|
| Diameter | δ = | 19
|
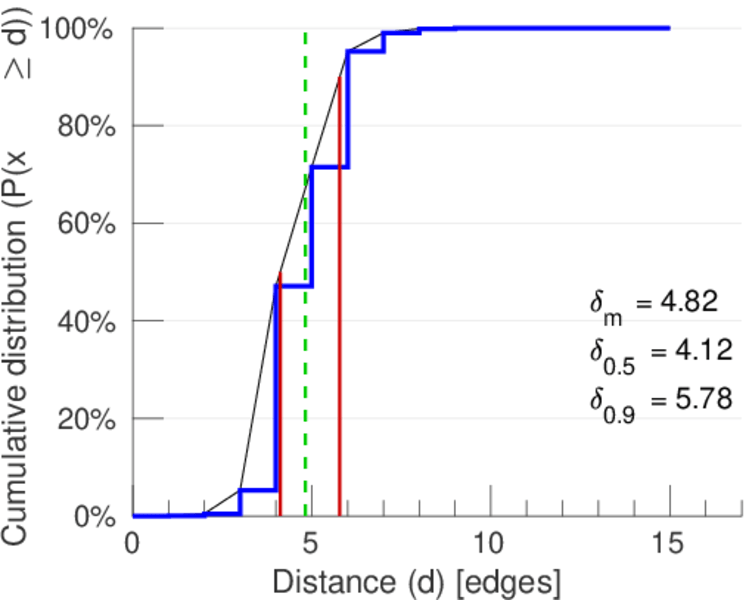
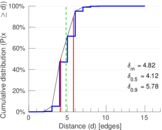
| 50-Percentile effective diameter | δ0.5 = | 4.118 29
|
| 90-Percentile effective diameter | δ0.9 = | 5.781 38
|
| Median distance | δM = | 5
|
| Mean distance | δm = | 4.816 87
|
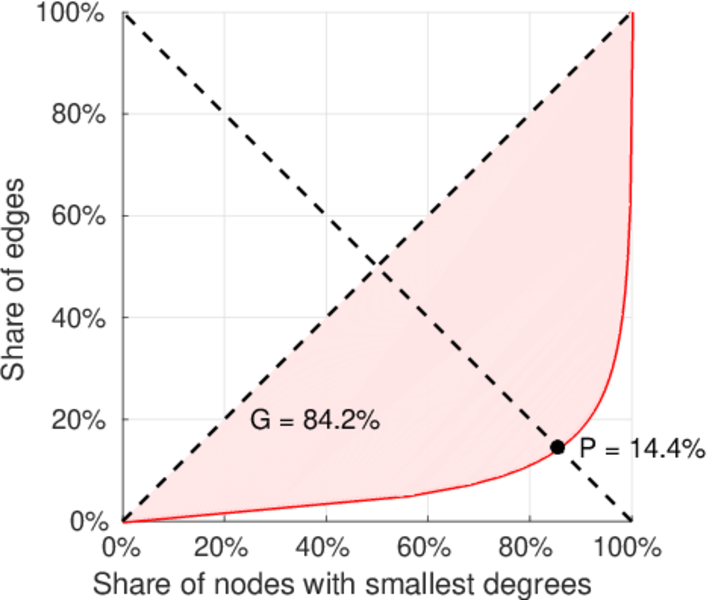
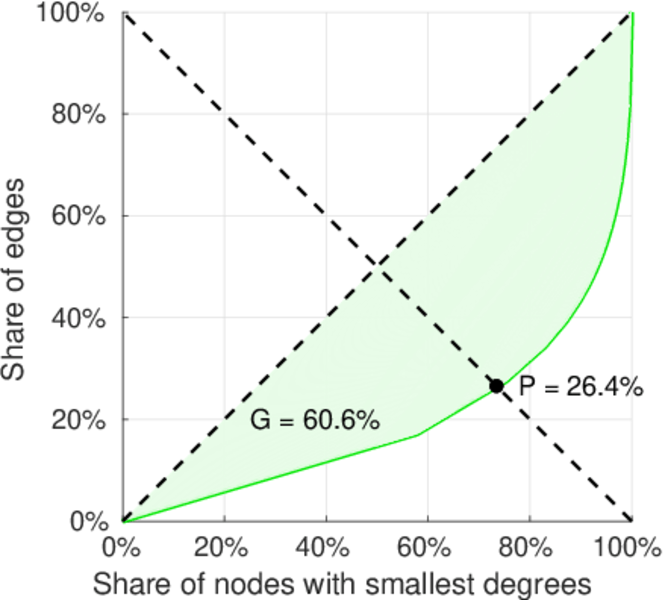
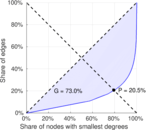
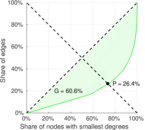
| Gini coefficient | G = | 0.752 201
|
| Balanced inequality ratio | P = | 0.196 535
|
| Left balanced inequality ratio | P1 = | 0.143 971
|
| Right balanced inequality ratio | P2 = | 0.264 016
|
| Relative edge distribution entropy | Her = | 0.854 894
|
| Tail power law exponent | γt = | 2.051 00
|
| Tail power law exponent with p | γ3 = | 2.051 00
|
| p-value | p = | 0.000 00
|
| Left tail power law exponent with p | γ3,1 = | 1.831 00
|
| Left p-value | p1 = | 0.000 00
|
| Right tail power law exponent with p | γ3,2 = | 2.141 00
|
| Right p-value | p2 = | 0.000 00
|
| Degree assortativity | ρ = | −0.057 574 8
|
| Degree assortativity p-value | pρ = | 0.000 00
|
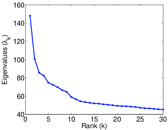
| Spectral norm | α = | 147.958
|
| Algebraic connectivity | a = | 0.010 442 0
|
| Spectral separation | |λ1[A] / λ2[A]| = | 1.466 78
|
| Controllability | C = | 295,185
|
| Relative controllability | Cr = | 0.662 145
|
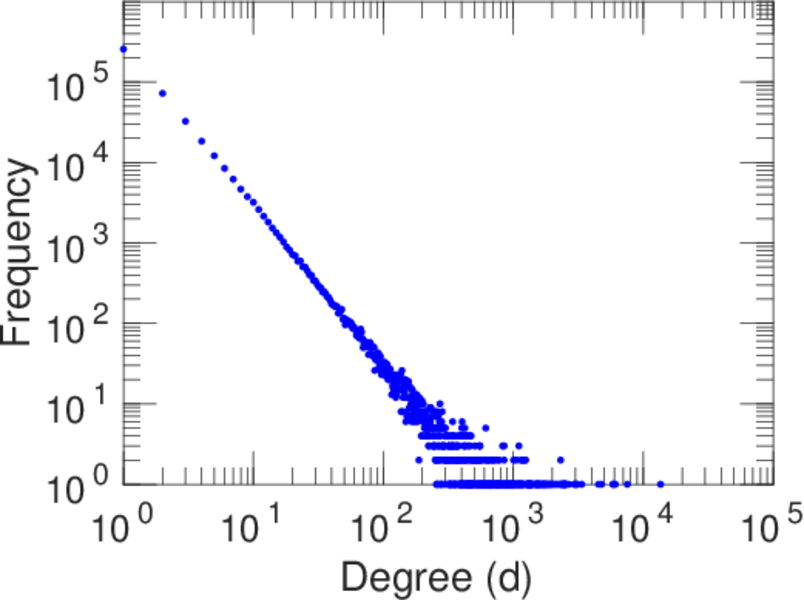
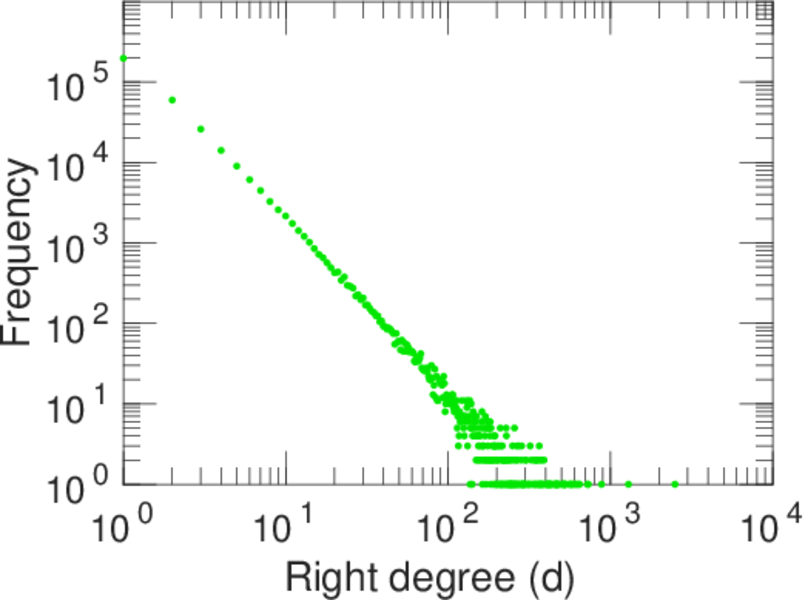
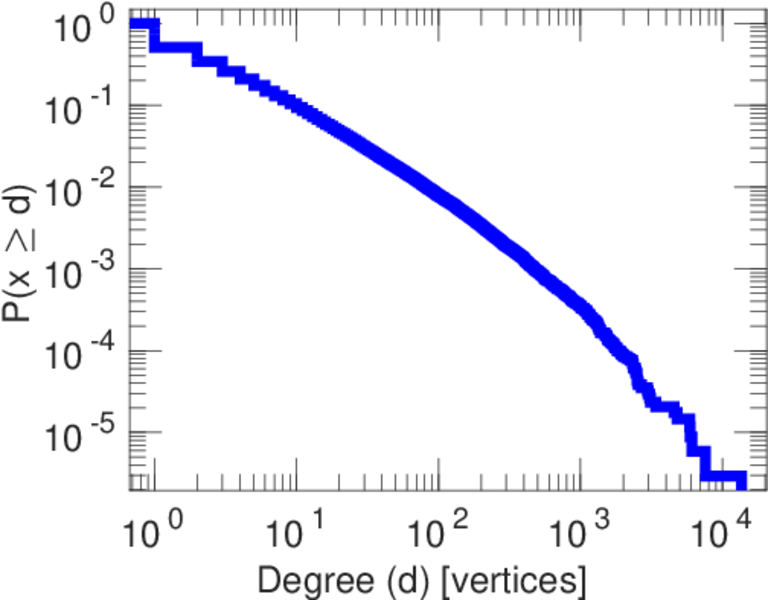
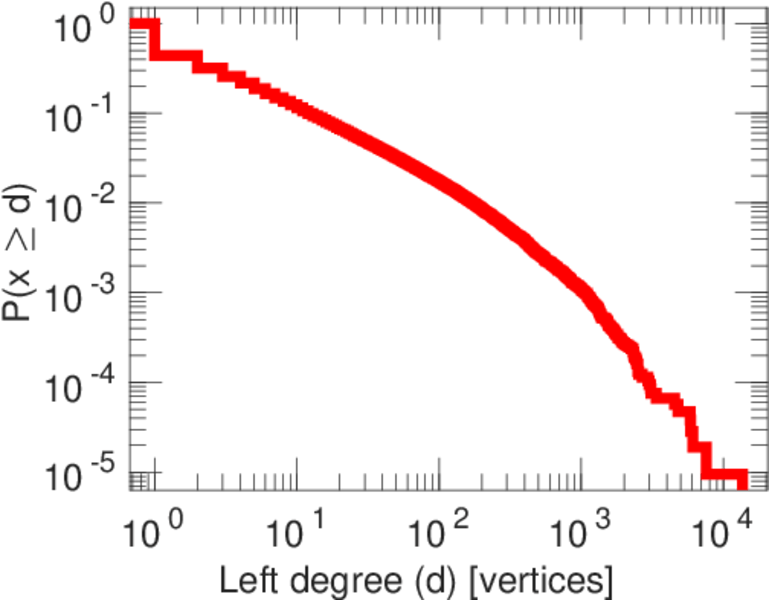
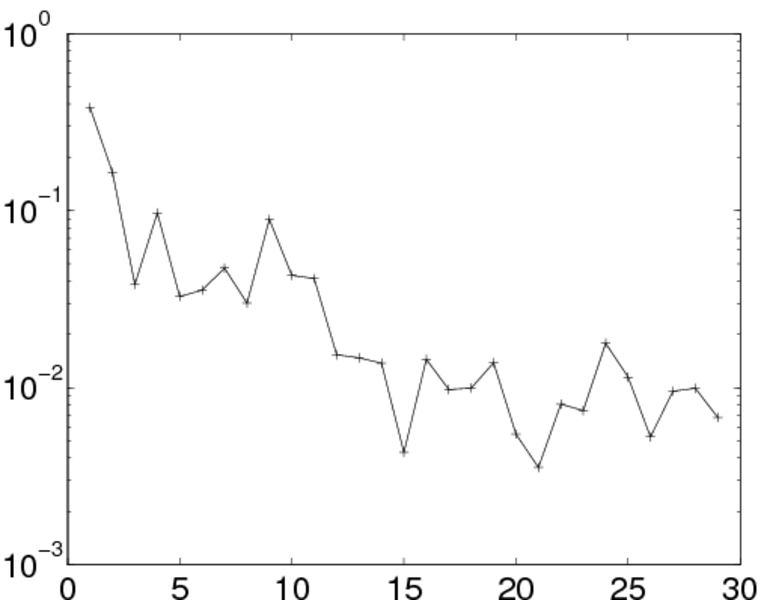
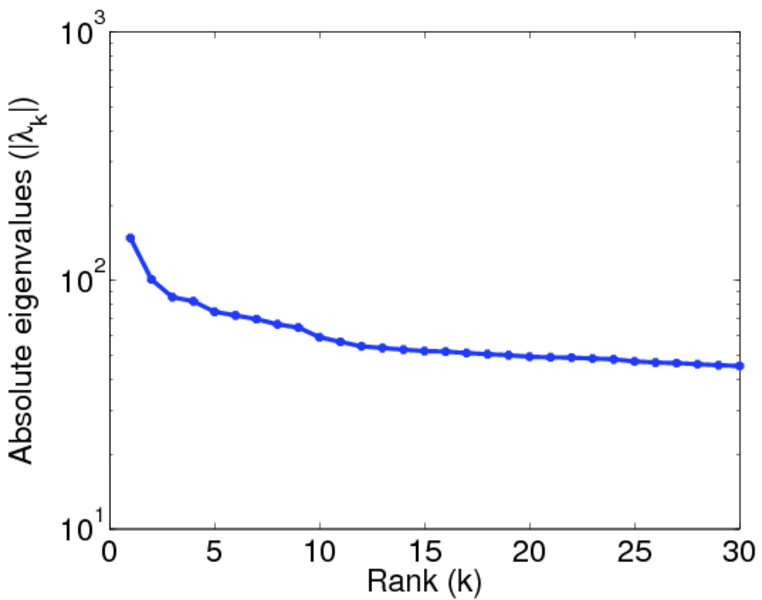
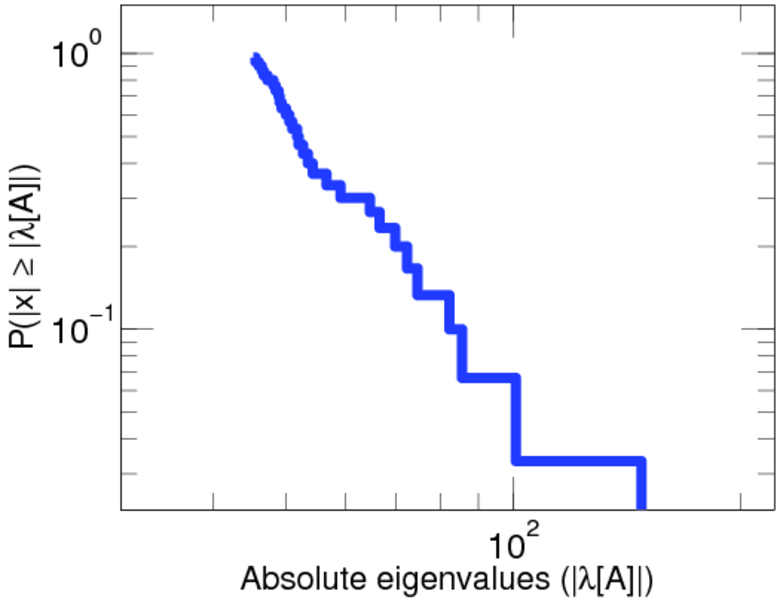
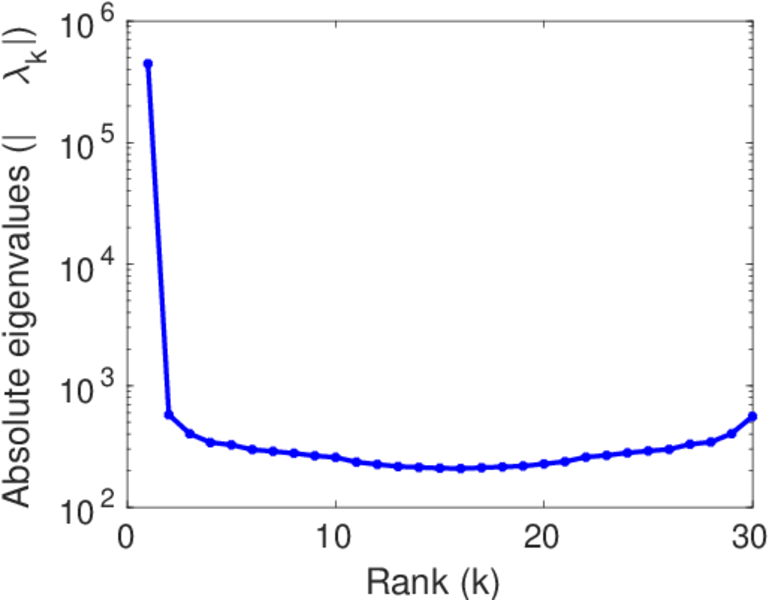
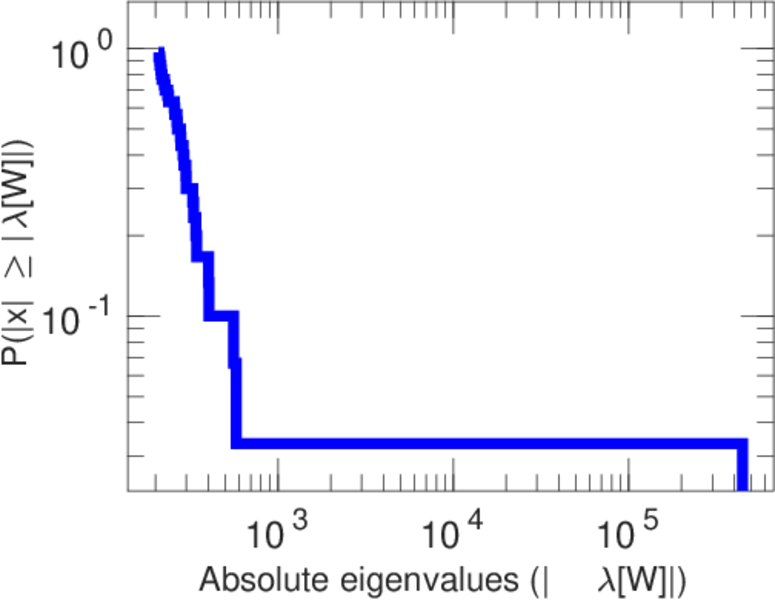
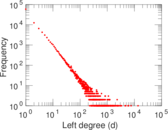
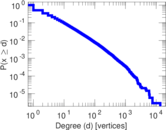
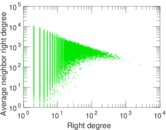
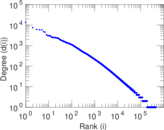
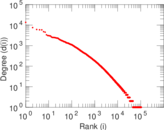
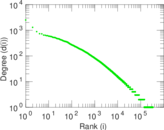
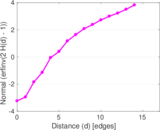
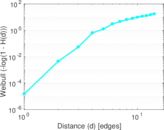
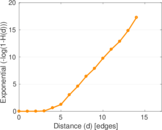
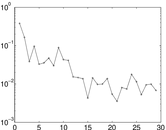
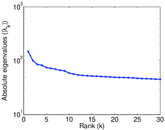
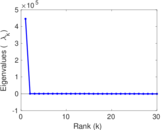
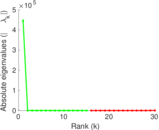
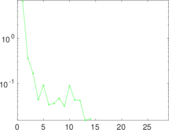
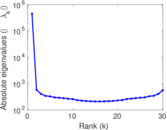
Plots


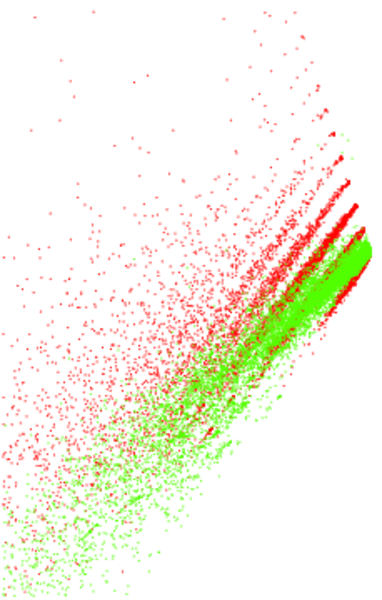
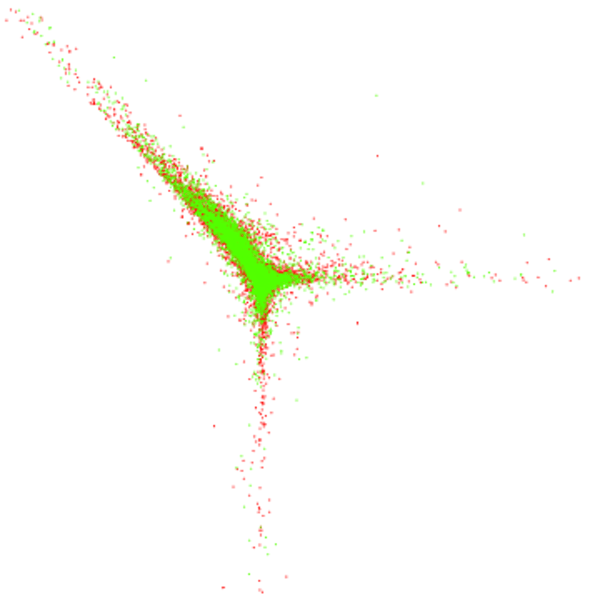
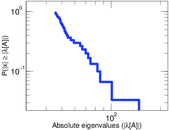
Matrix decompositions plots

Downloads
References
|
[1]
|
Jérôme Kunegis.
KONECT – The Koblenz Network Collection.
In Proc. Int. Conf. on World Wide Web Companion, pages
1343–1350, 2013.
[ http ]
|
|
[2]
|
Cai-Nicolas Ziegler, Sean M. McNee, Joseph A. Konstan, and Georg Lausen.
Improving recommendation lists through topic diversification.
In Proc. Int. World Wide Web Conf., pages 22–32, 2005.
|
 KONECT ‣ Networks ‣
Buy Me a Coffee
KONECT ‣ Networks ‣
Buy Me a Coffee