Southern women (small)

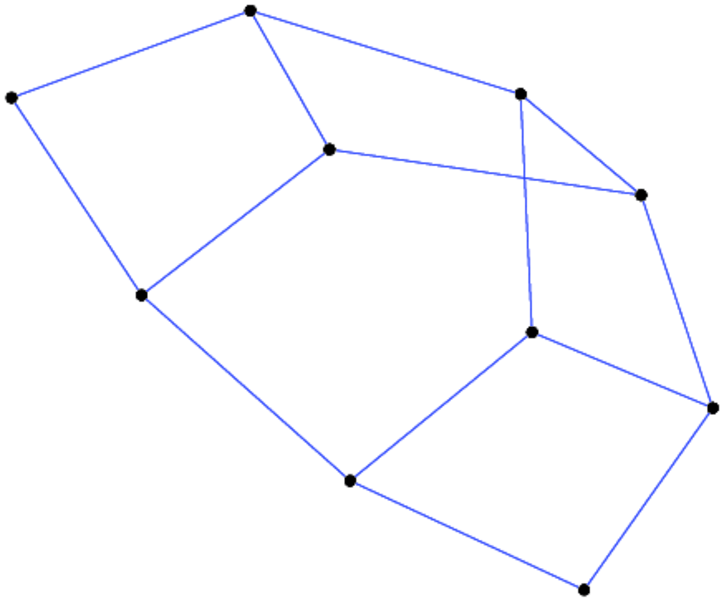
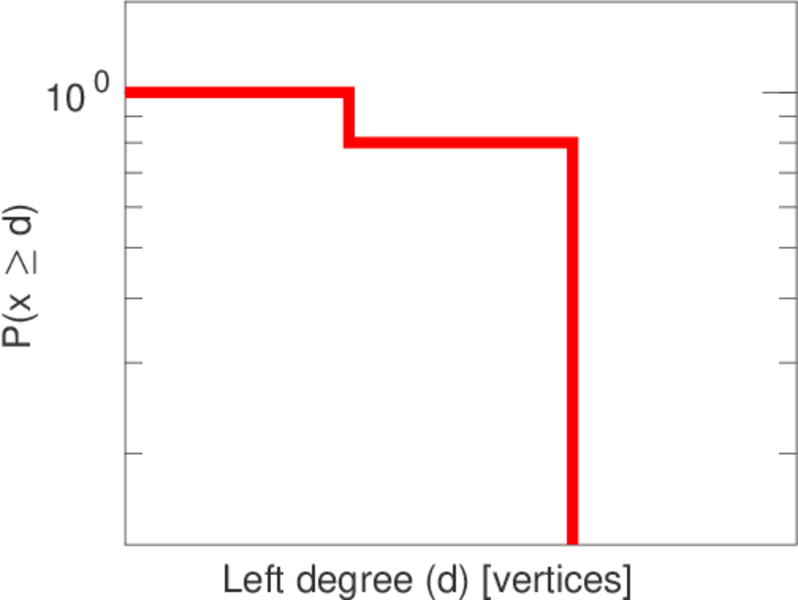
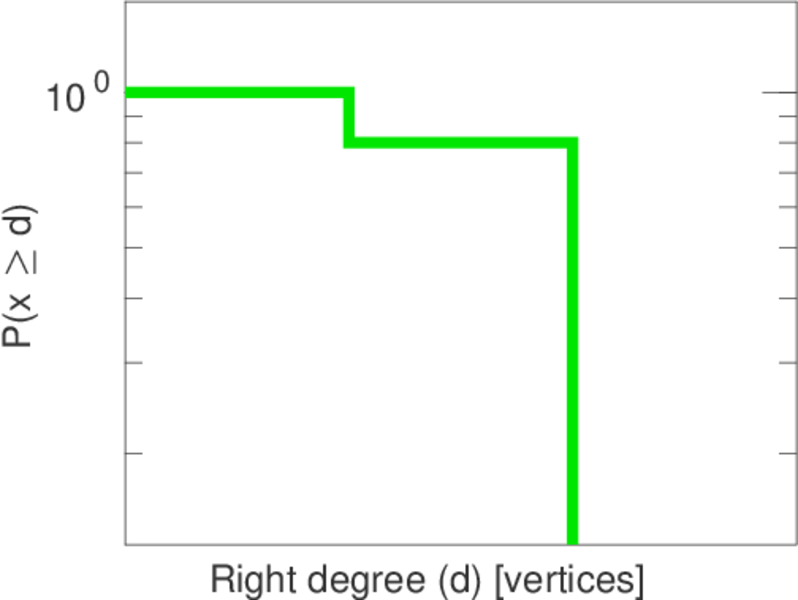
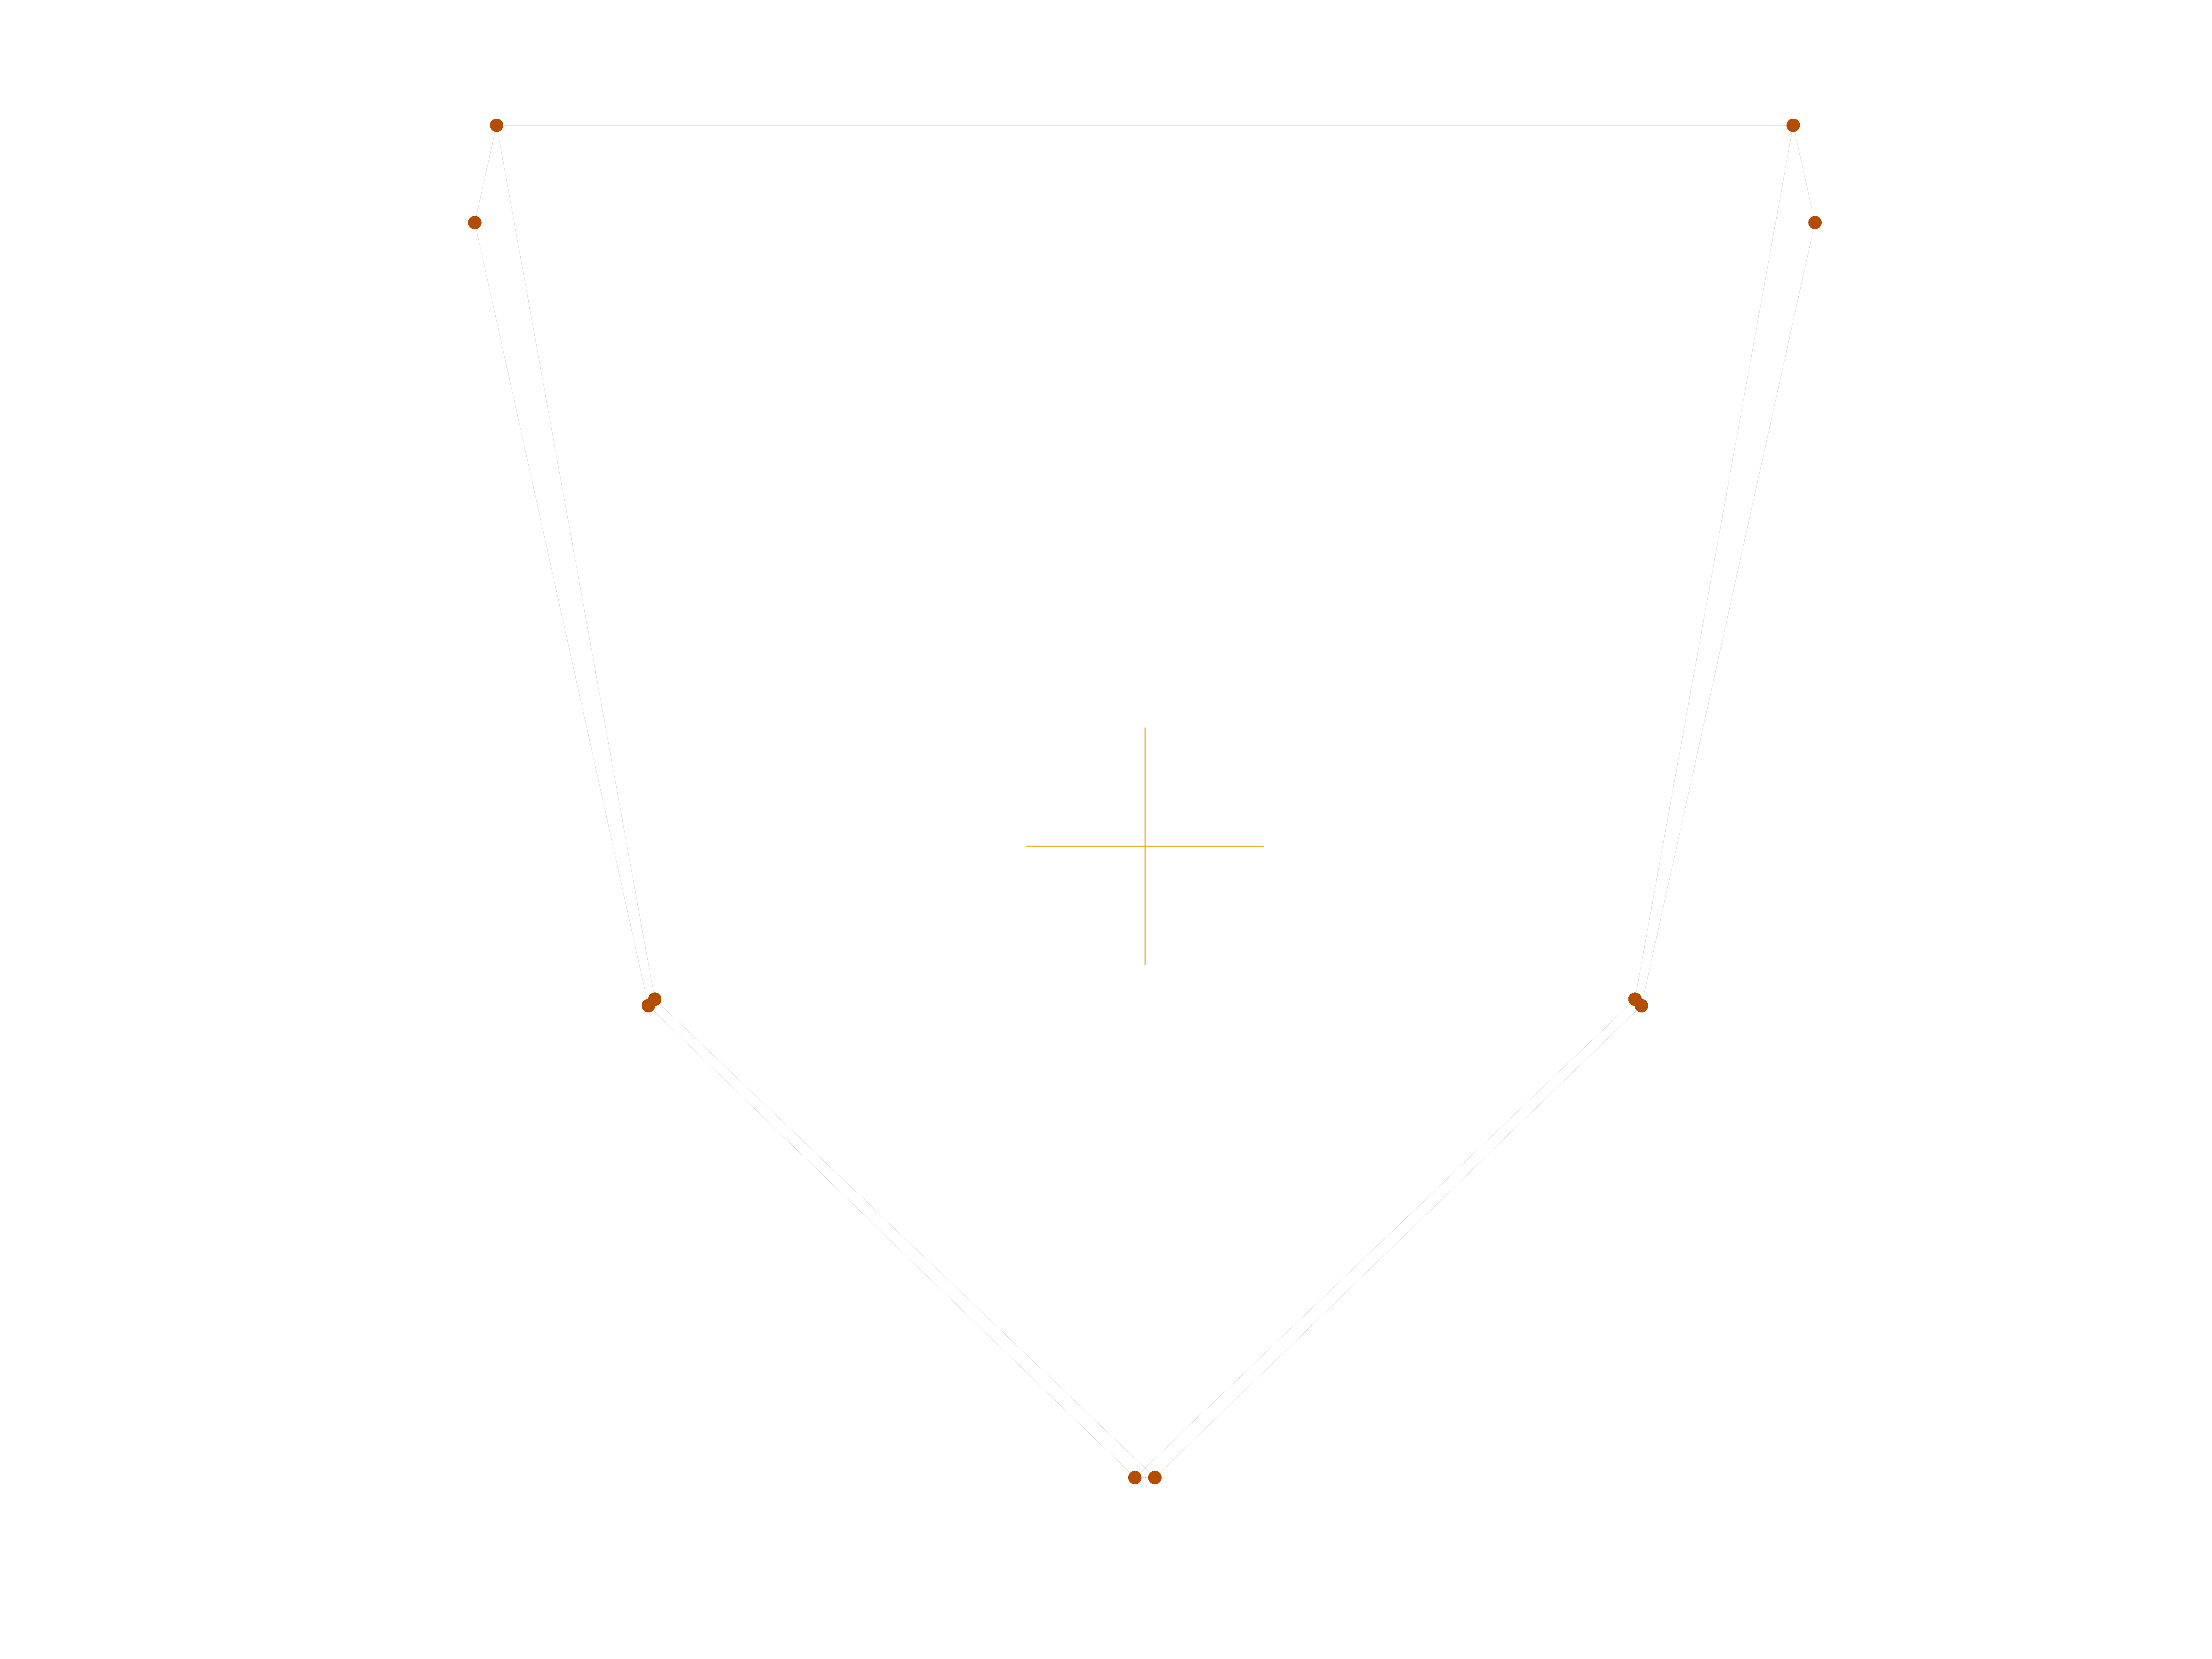
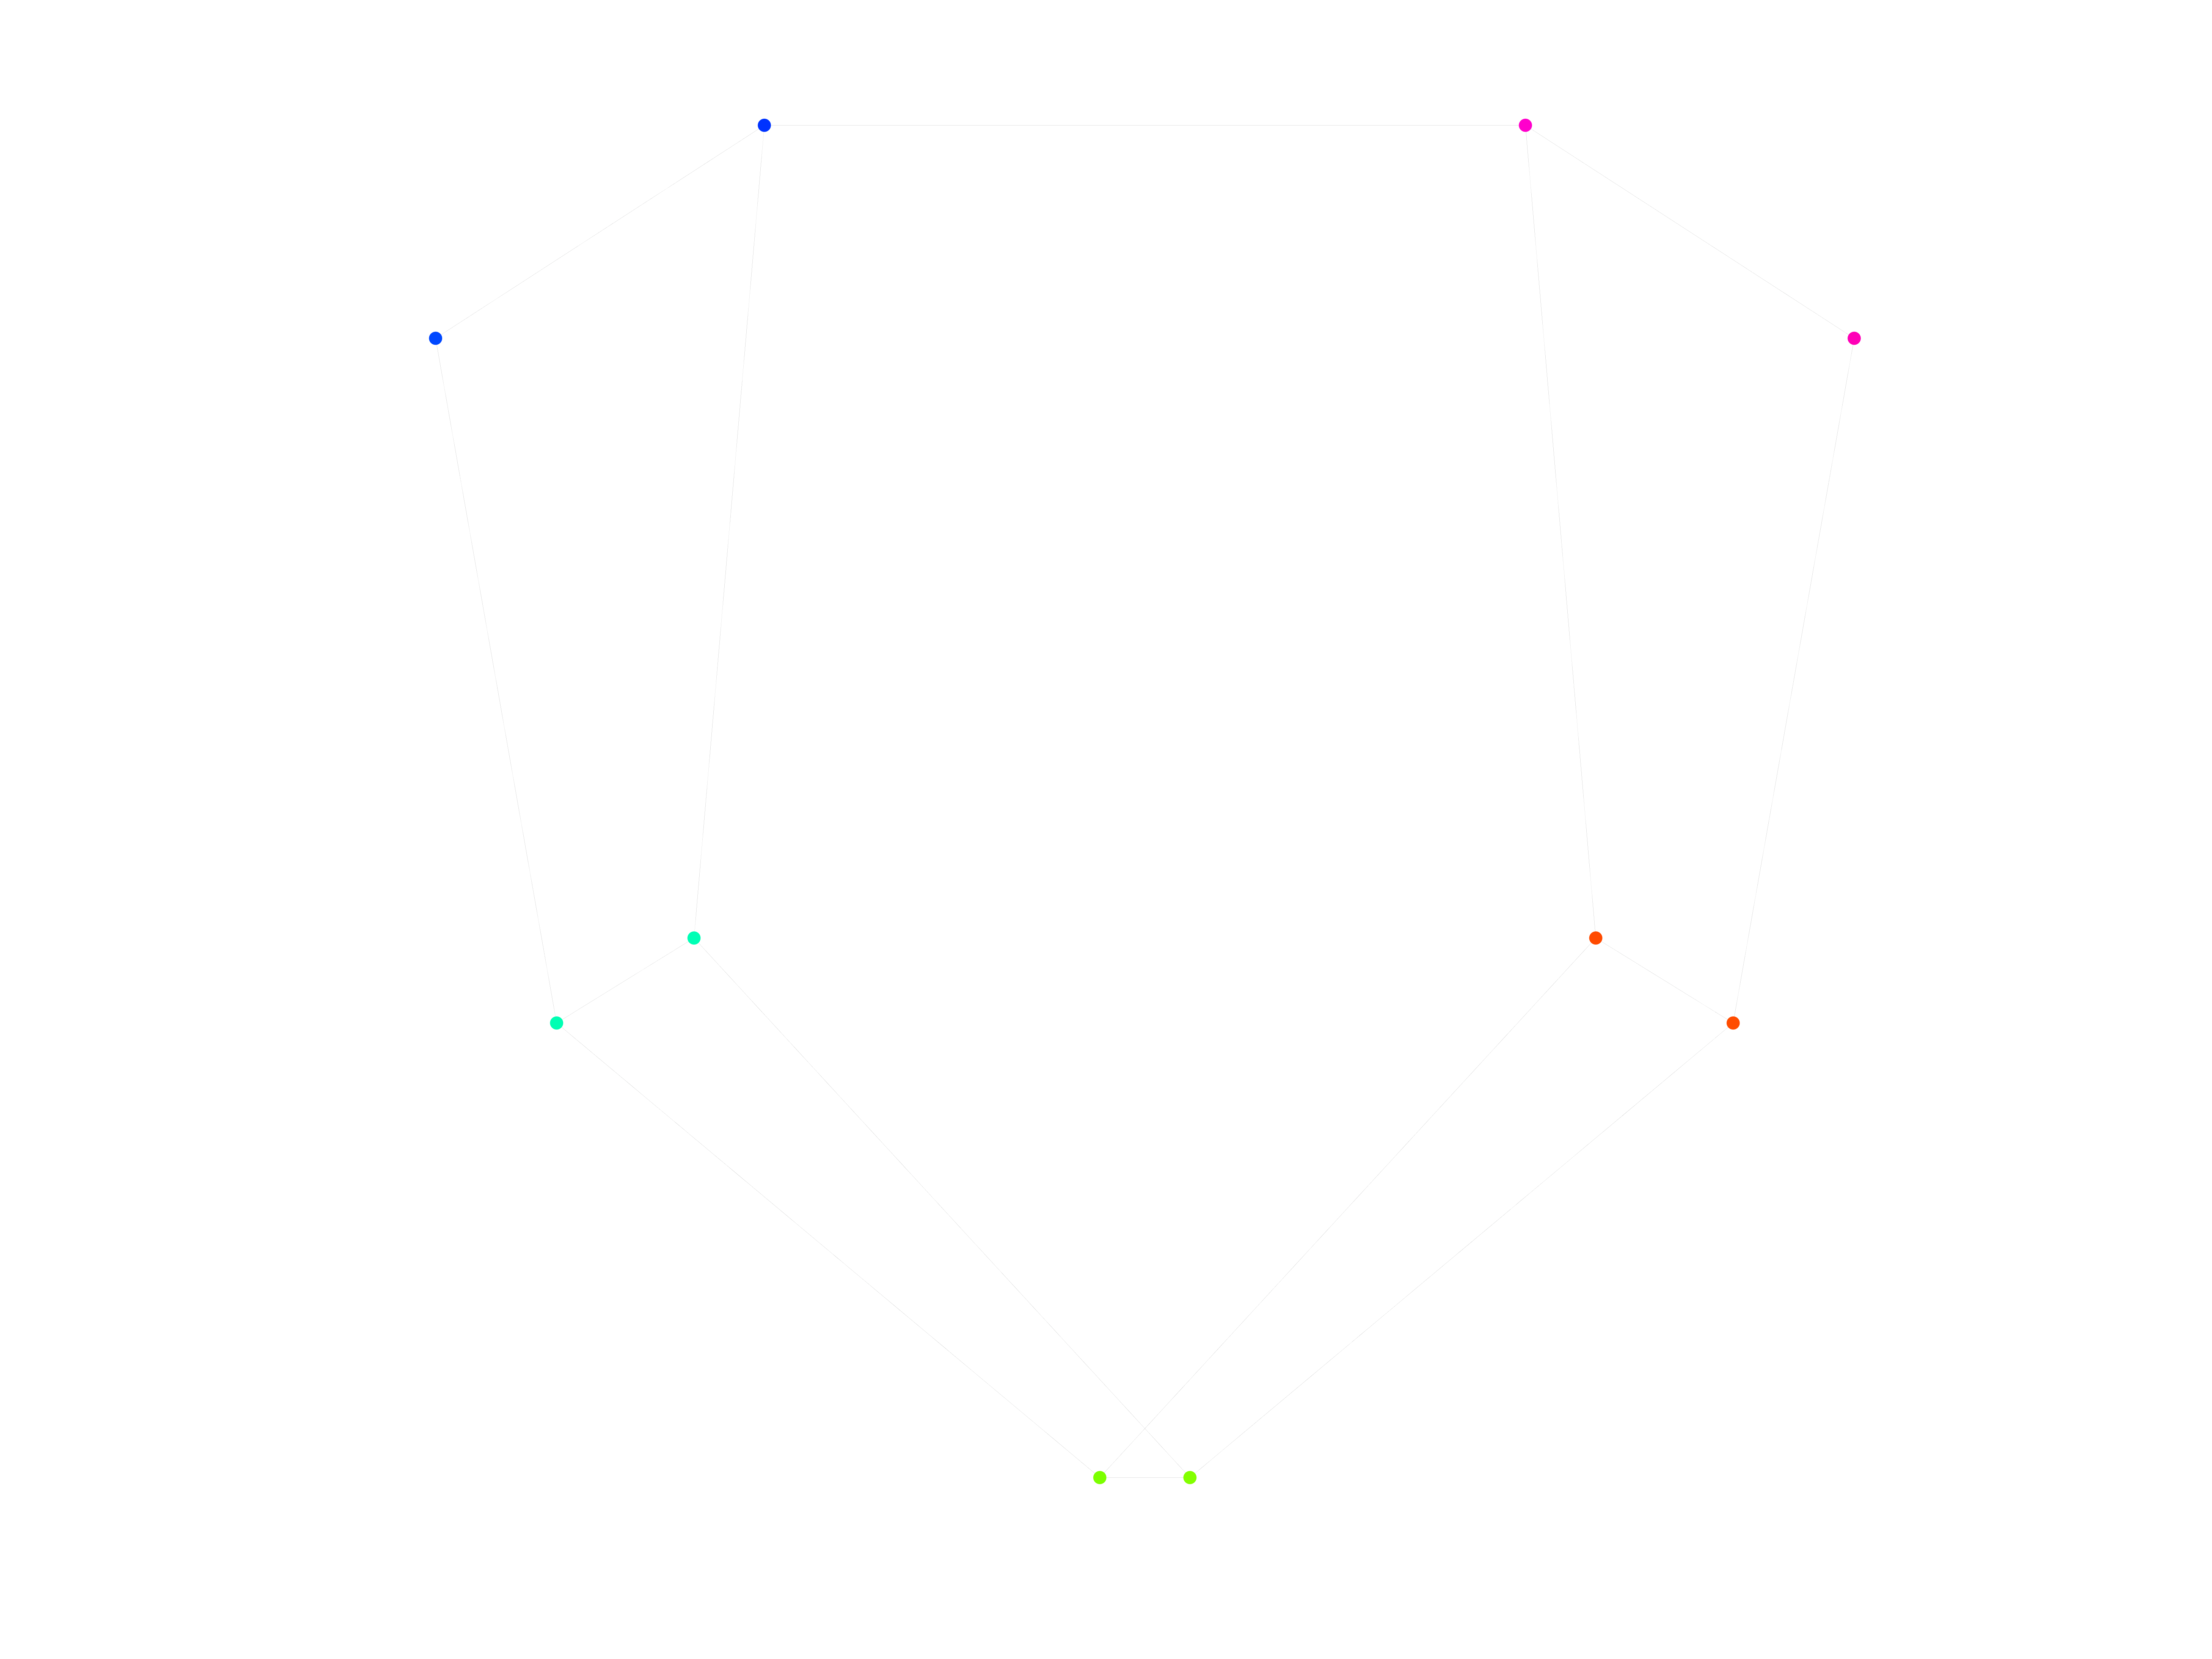
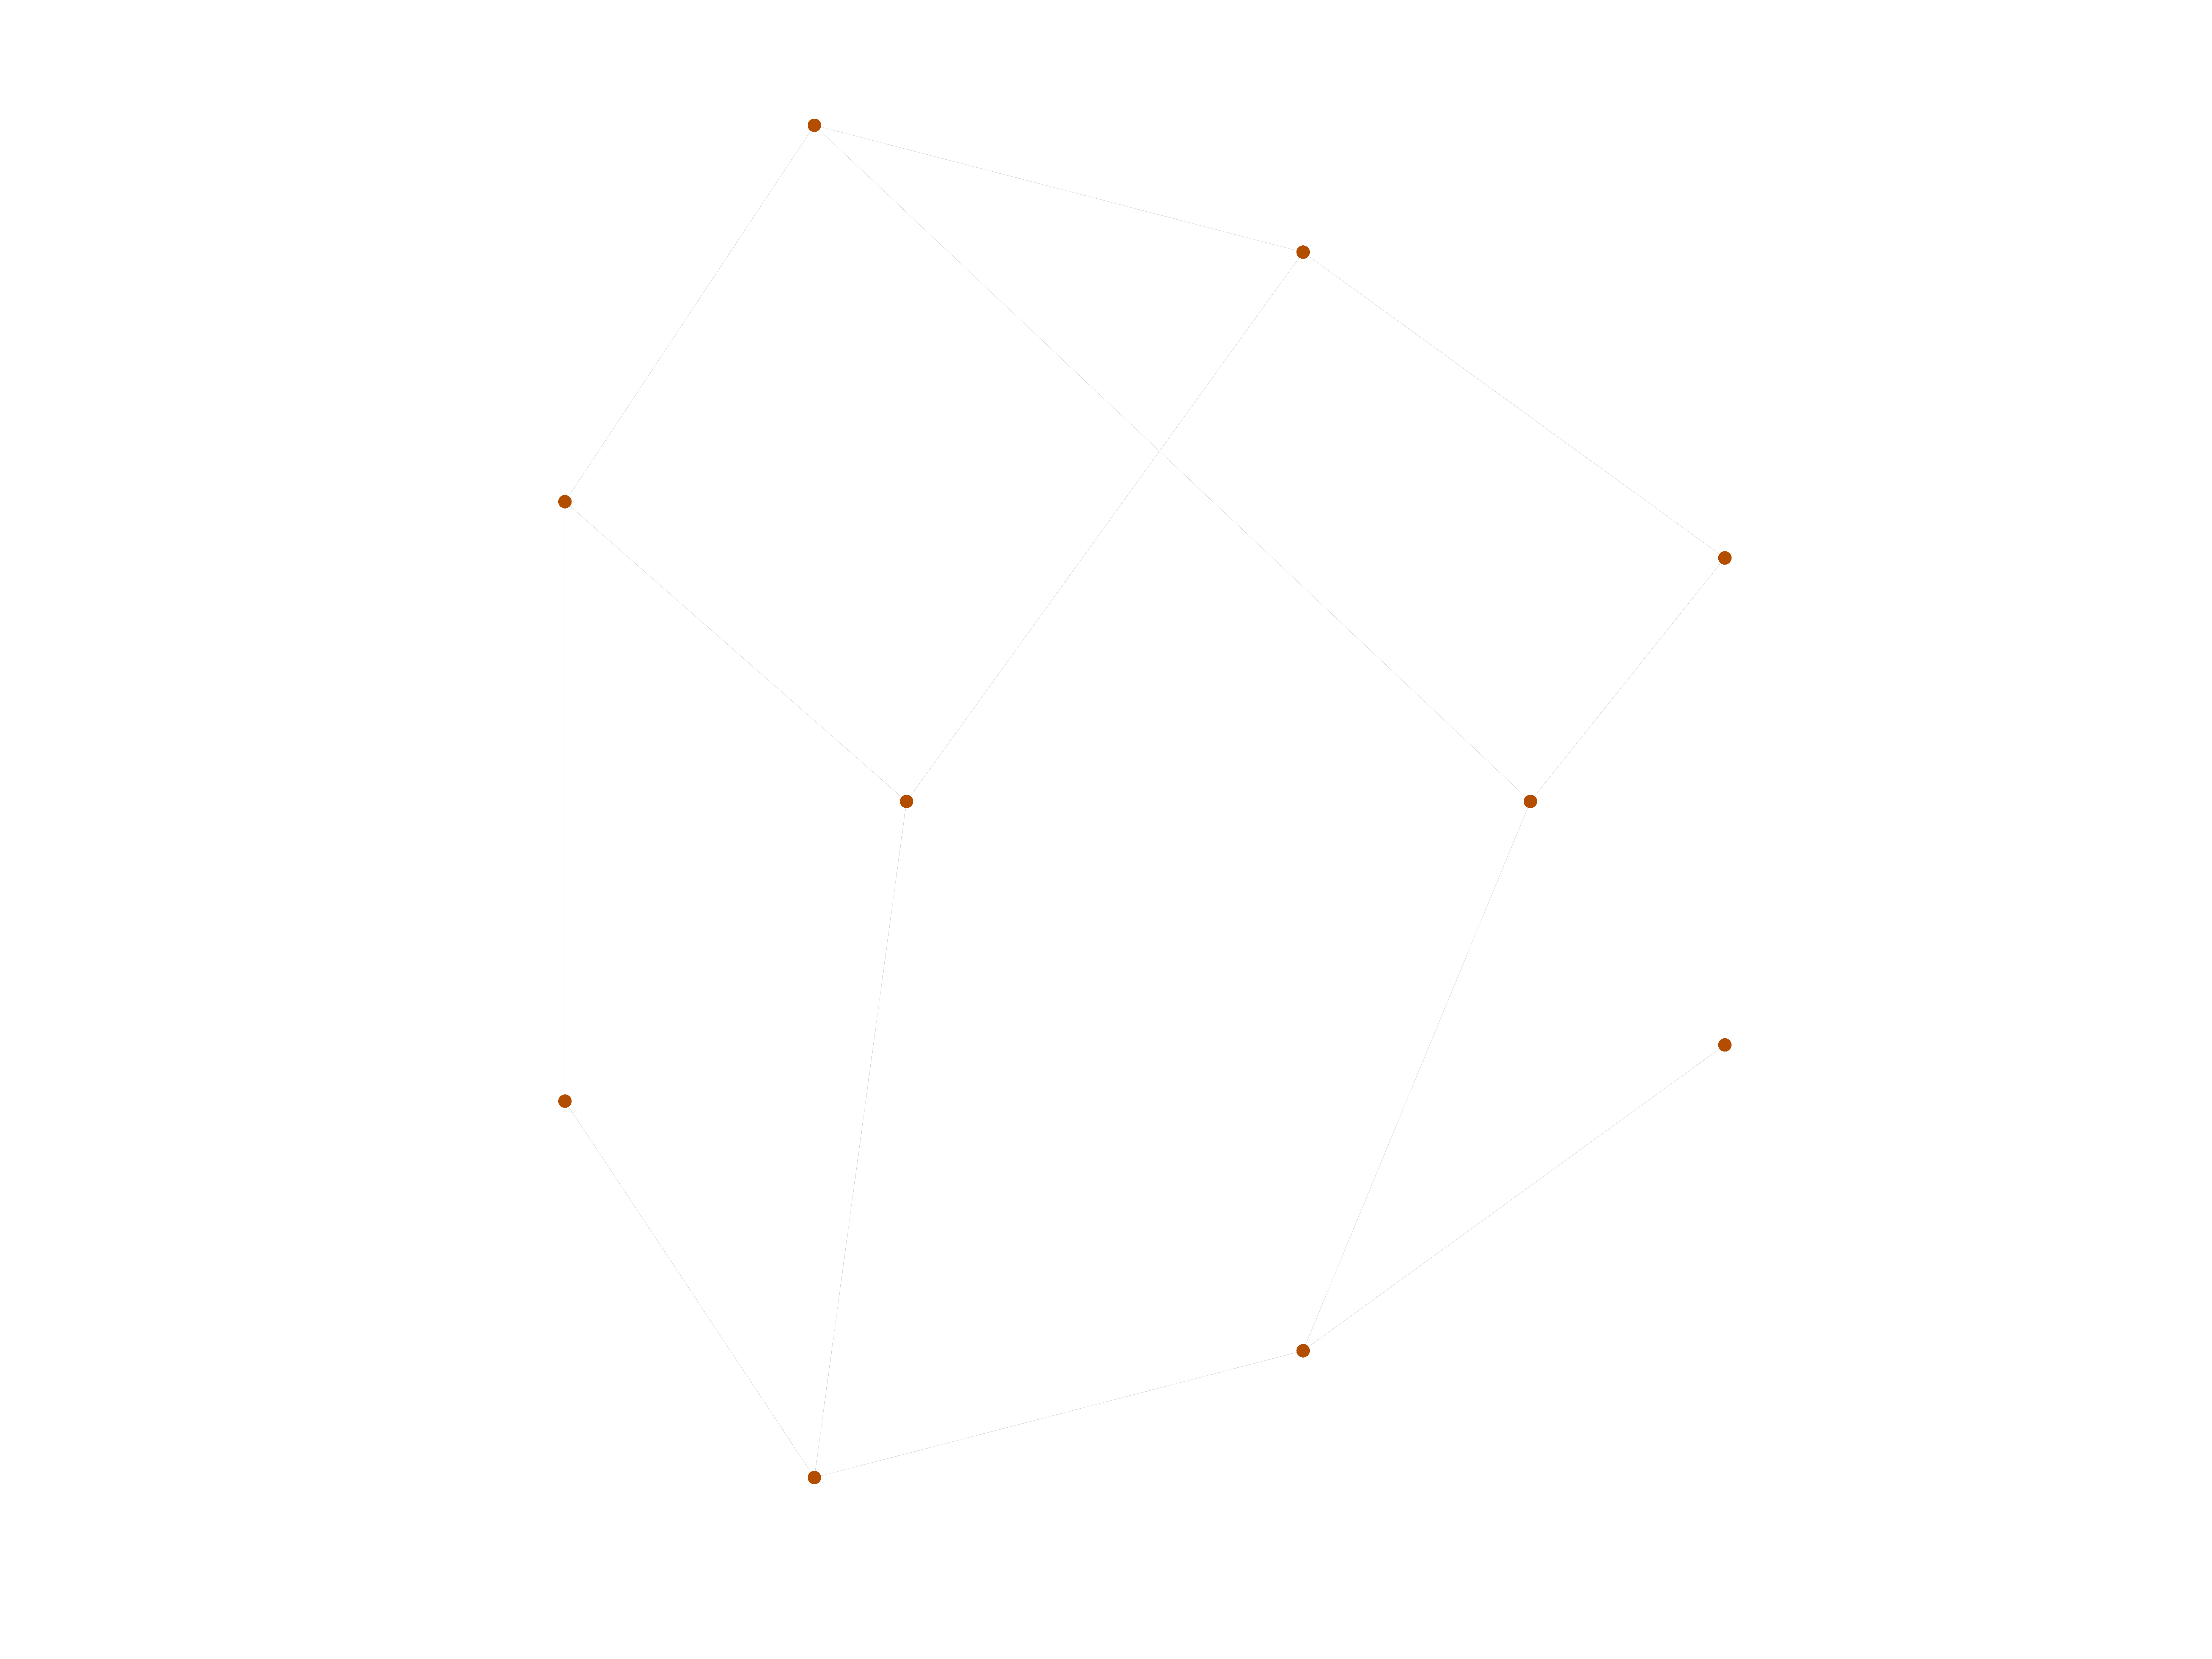
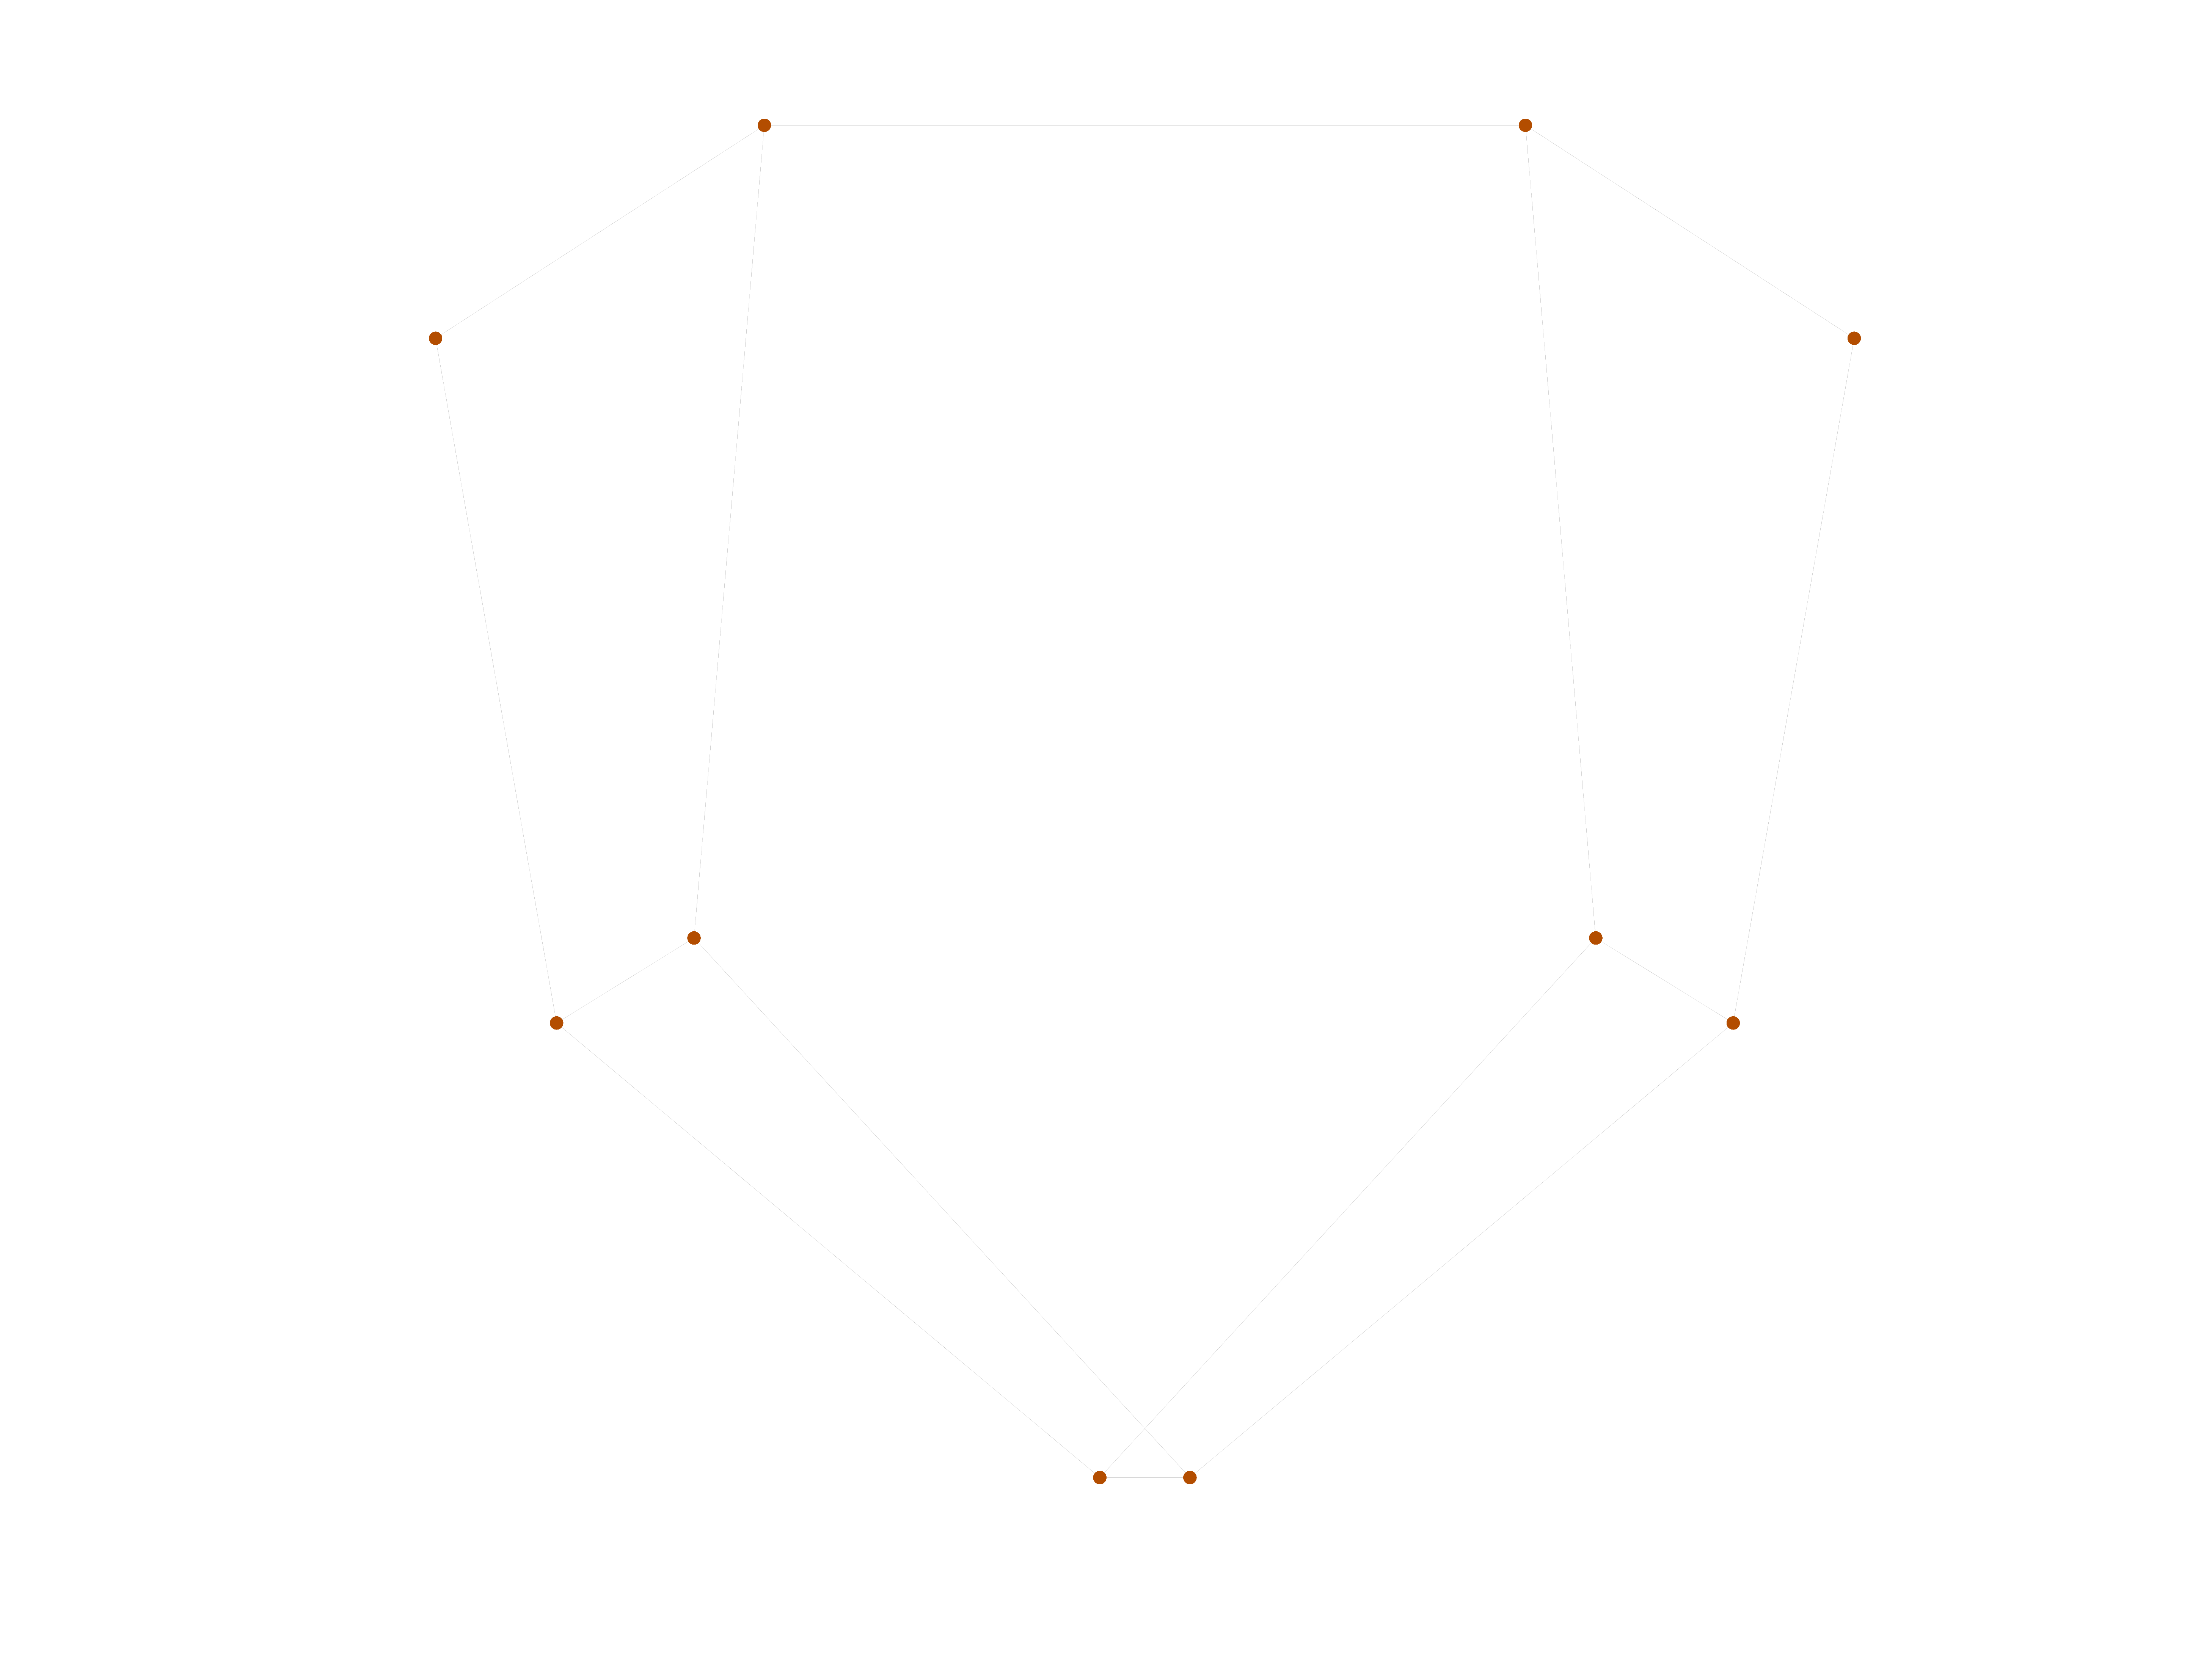
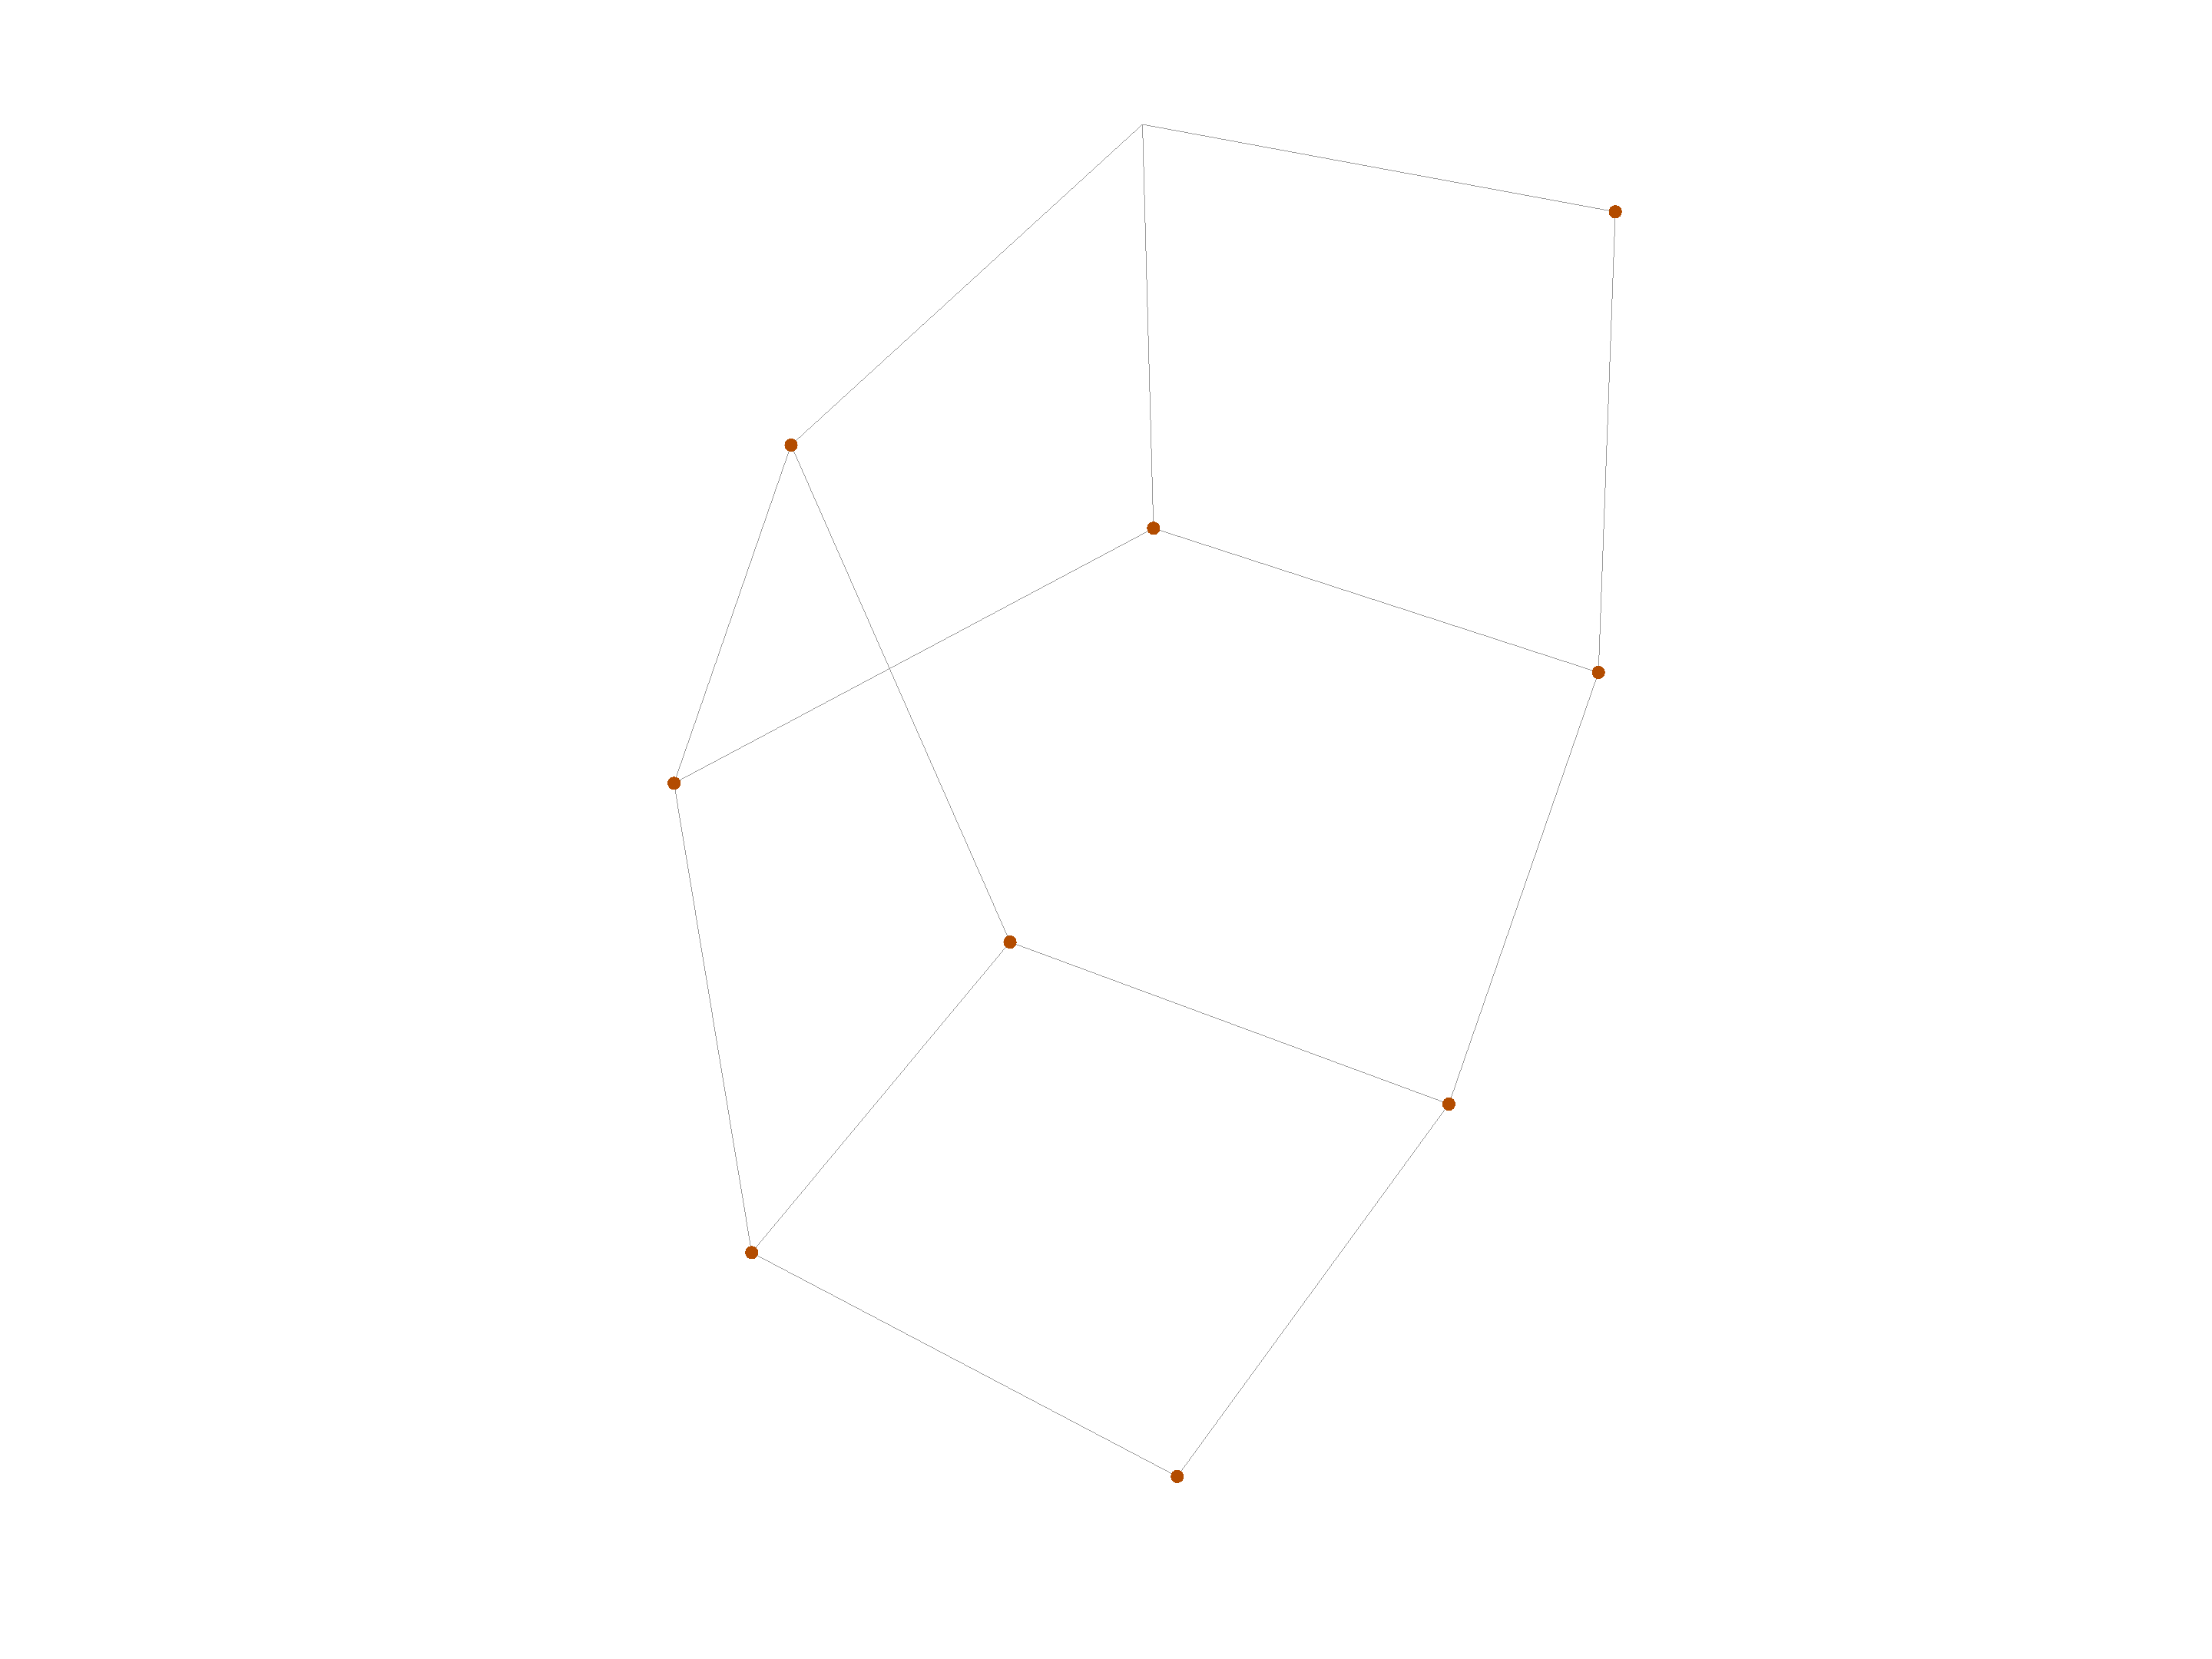
This bipartite dataset shows the participation of women in social events over a nine-month period. The data was collected in the Southern United States of America in the 1930s. In comparison to the other southern women dataset this network only consists of African-American women. There is an edge for every woman who participates in an event. The left node represents a woman and the ride lnode represents an event.

Metadata

CodeSw
Internal namebrunson_southern-women
NameSouthern women (small)
Data sourcehttps://github.com/corybrunson/triadic
AvailabilityDataset is available for download
Consistency checkDataset passed all tests
Category
Interaction network
Node meaningWoman, event
Edge meaningParticipation
Network formatBipartite, undirected
Edge typeUnweighted, no multiple edges

Statistics

Size n =10
Left size n1 =5
Right size n2 =5
Volume m =14
Wedge count s =12
Claw count z =8
Cross count x =0
Square count q =4
4-Tour count T4 =164
Maximum degree dmax =3
Maximum left degree d1max =3
Maximum right degree d2max =3
Average degree d =2.800 00
Average left degree d1 =2.800 00
Average right degree d2 =2.800 00
Fill p =0.560 000
Size of LCC N =4
Diameter δ =5
50-Percentile effective diameter δ0.5 =0.000 00
90-Percentile effective diameter δ0.9 =0.800 000
Median distance δM =1
Mean distance δm =0.500 000
Gini coefficient G =0.042 857 1
Balanced inequality ratio P =0.357 143
Left balanced inequality ratio P1 =0.357 143
Right balanced inequality ratio P2 =0.357 143
Relative edge distribution entropy Her =0.995 193
Power law exponent γ =4.082 88
Tail power law exponent γt =2.851 00
Tail power law exponent with p γ3 =2.851 00
p-value p =0.000 00
Left tail power law exponent with p γ3,1 =2.851 00
Left p-value p1 =0.001 000 00
Right tail power law exponent with p γ3,2 =2.851 00
Right p-value p2 =0.002 000 00
Degree assortativity ρ =−0.166 667
Degree assortativity p-value pρ =0.569 033
Spectral norm α =2.858 59
Algebraic connectivity a =0.805 955
Spectral separation 1[A] / λ2[A]| =1.574 97
Controllability C =0
Relative controllability Cr =0.000 00

Plots

Fruchterman–Reingold graph drawing

Degree distribution

Cumulative degree distribution

Lorenz curve

Spectral distribution of the adjacency matrix

Spectral distribution of the normalized adjacency matrix

Spectral distribution of the Laplacian

Spectral graph drawing based on the adjacency matrix

Spectral graph drawing based on the Laplacian

Spectral graph drawing based on the normalized adjacency matrix

Degree assortativity

Zipf plot

Hop distribution

Double Laplacian graph drawing

Delaunay graph drawing

Matrix decompositions plots

Downloads

References

[1] Jérôme Kunegis. KONECT – The Koblenz Network Collection. In Proc. Int. Conf. on World Wide Web Companion, pages 1343–1350, 2013. [ http ]
[2] Allison Davis, Burleigh B. Gardner, and Mary R. Gardner. Deep South; a Social Anthropological Study of Caste and Class. The Univ. of Chicago Press, 1941.