DBLP
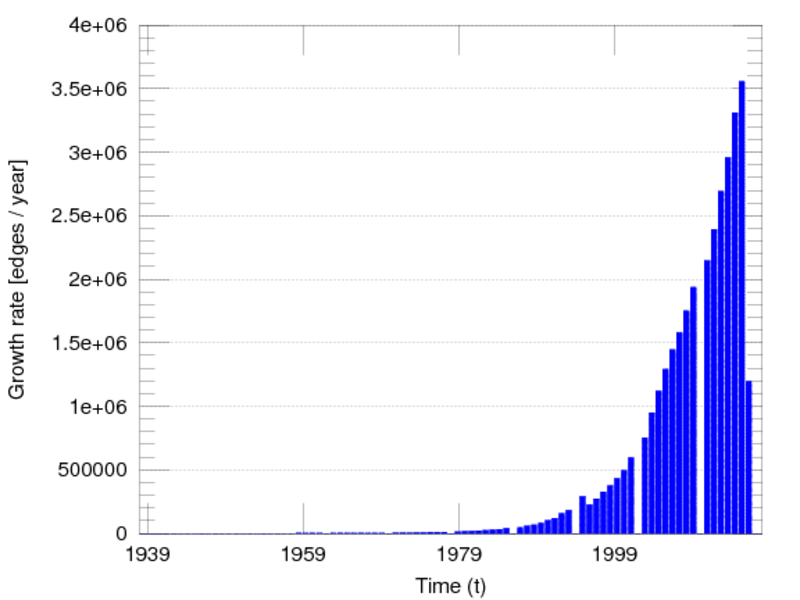
This is the collaboration graph of authors of scientific papers from DBLP
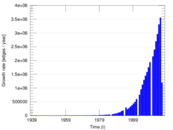
computer science bibliography. An edge between two authors represents a common
publication. Edges are annotated with the date of the publication. There may
be multiple edges between two nodes, representing pairs of authors that have
written multiple publications together.
Metadata
Statistics
| Size | n = | 1,824,701
|
| Volume | m = | 29,487,744
|
| Unique edge count | m̿ = | 16,689,230
|
| Loop count | l = | 0
|
| Wedge count | s = | 490,841,289
|
| Claw count | z = | 517,700,642,316
|
| Cross count | x = | 260,670,210,463,189
|
| Triangle count | t = | 27,718,326
|
| Square count | q = | 1,911,391,423
|
| 4-Tour count | T4 = | 17,271,185,770
|
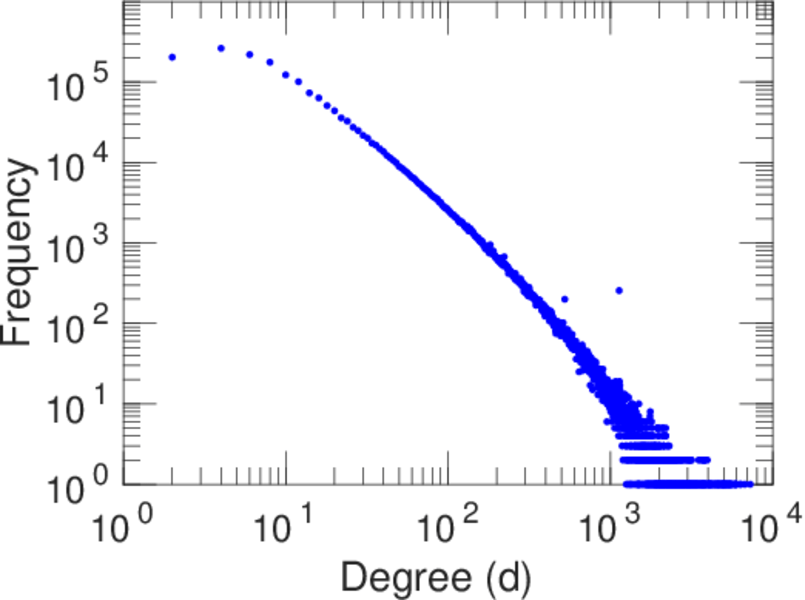
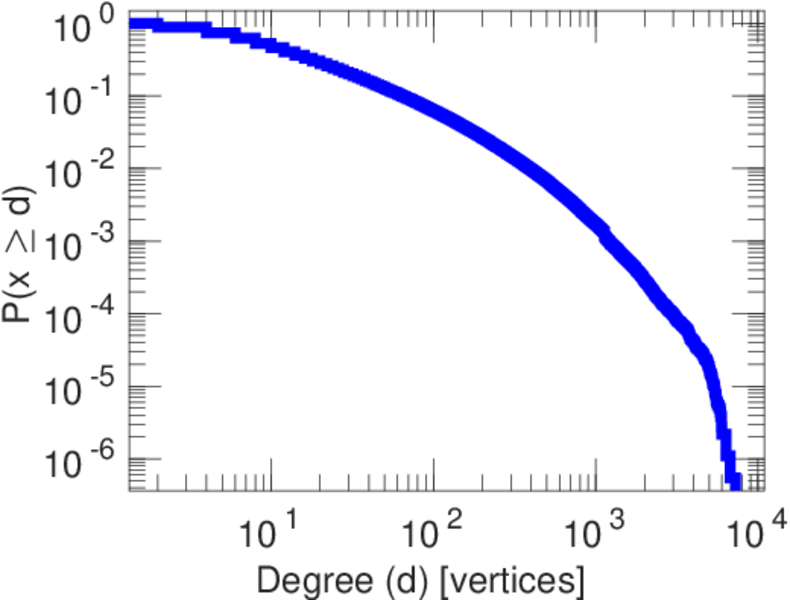
| Maximum degree | dmax = | 7,276
|
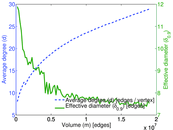
| Average degree | d = | 32.320 6
|
| Fill | p = | 1.002 50 × 10−5
|
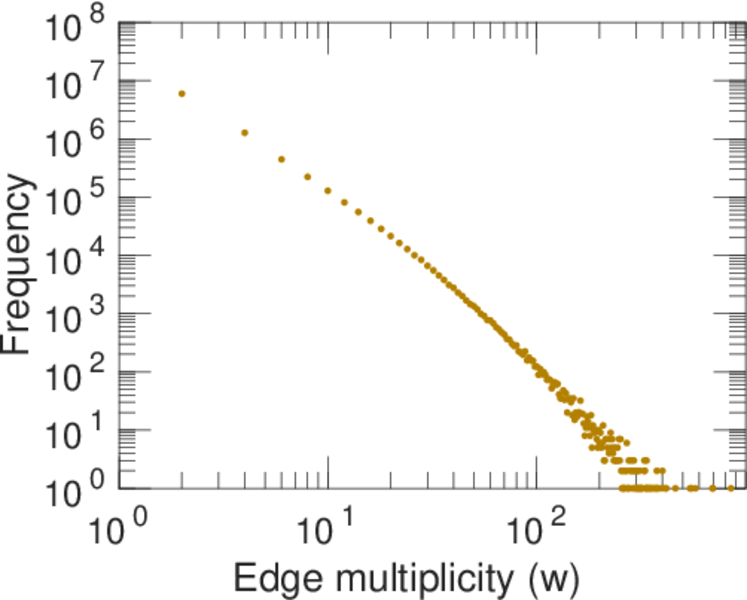
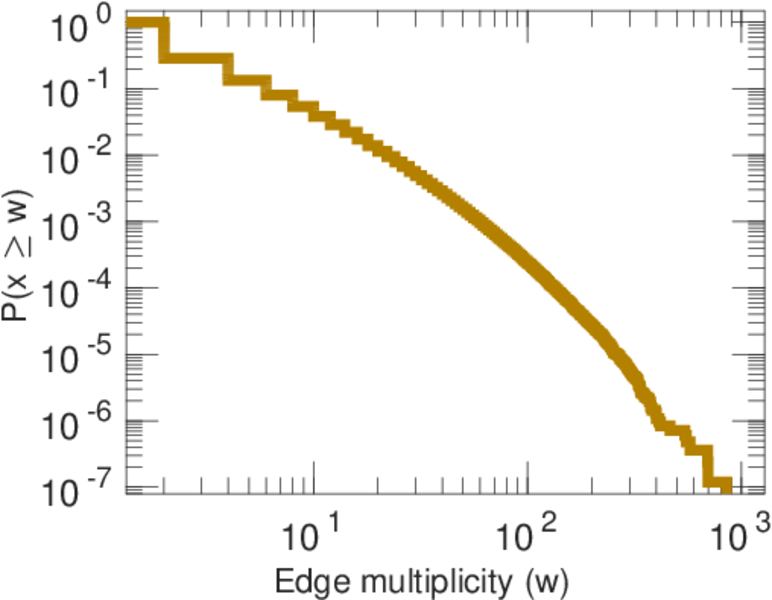
| Average edge multiplicity | m̃ = | 1.766 87
|
| Size of LCC | N = | 1,653,767
|
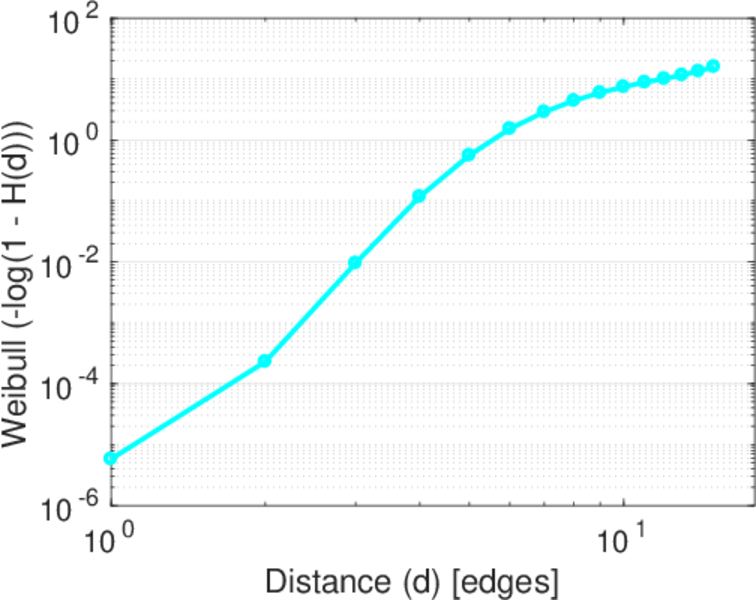
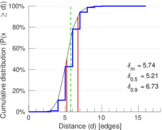
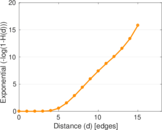
| Diameter | δ = | 23
|
| 50-Percentile effective diameter | δ0.5 = | 5.205 37
|
| 90-Percentile effective diameter | δ0.9 = | 6.733 58
|
| Median distance | δM = | 6
|
| Mean distance | δm = | 5.744 05
|
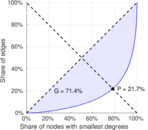
| Gini coefficient | G = | 0.713 646
|
| Balanced inequality ratio | P = | 0.217 175
|
| Relative edge distribution entropy | Her = | 0.942 083
|
| Power law exponent | γ = | 1.653 38
|
| Tail power law exponent | γt = | 2.951 00
|
| Degree assortativity | ρ = | +0.114 186
|
| Degree assortativity p-value | pρ = | 0.000 00
|
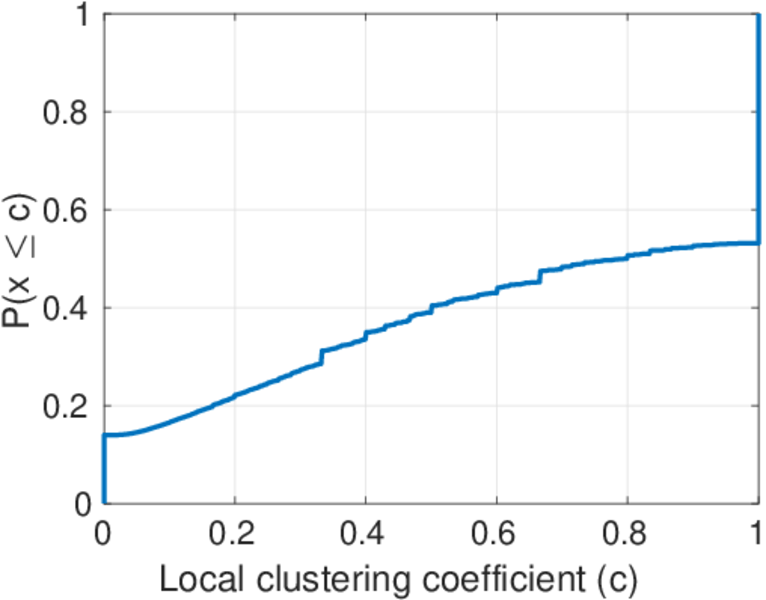
| Clustering coefficient | c = | 0.169 413
|
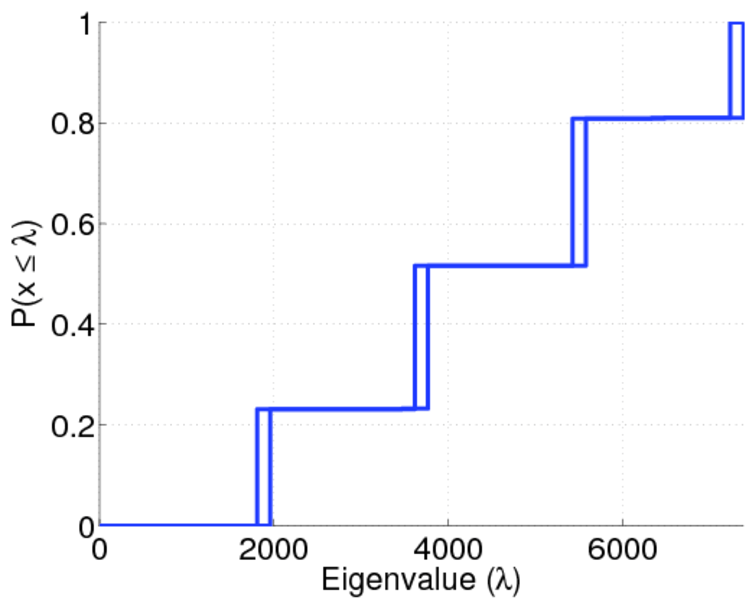
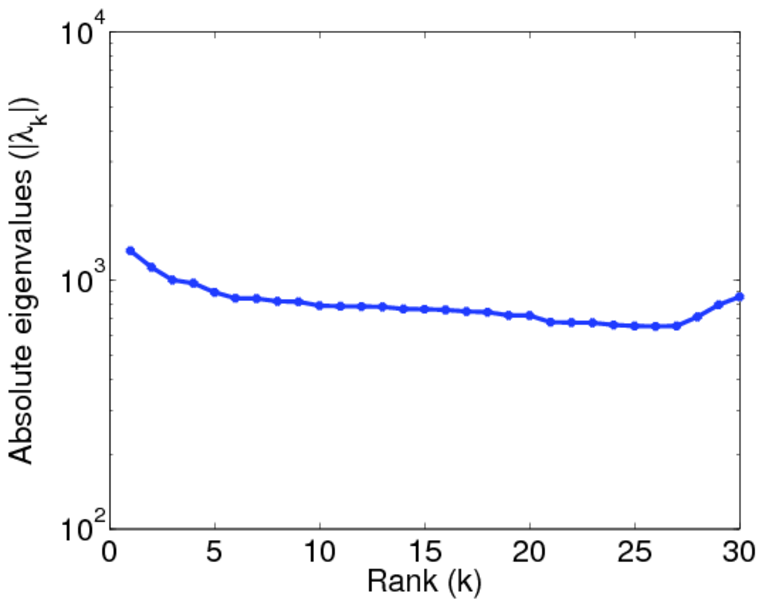
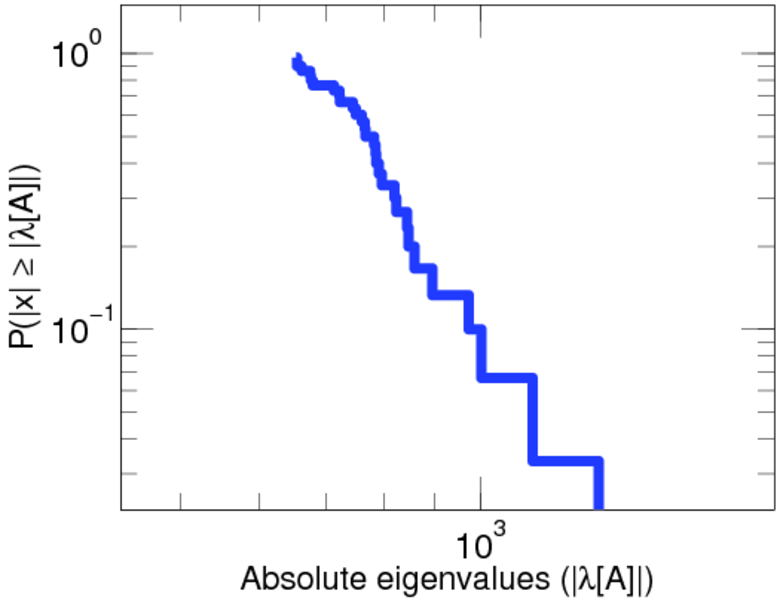
| Spectral norm | α = | 1,315.80
|
| Spectral separation | |λ1[A] / λ2[A]| = | 1.165 11
|
| Non-bipartivity | bA = | 0.347 088
|
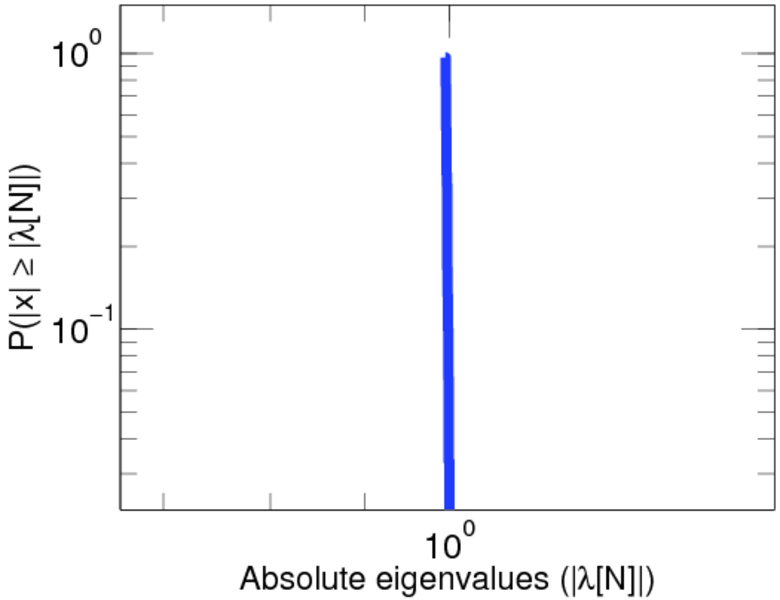
| Normalized non-bipartivity | bN = | 0.024 538 3
|
| Algebraic non-bipartivity | χ = | 0.044 354 8
|
| Spectral bipartite frustration | bK = | 0.001 123 70
|
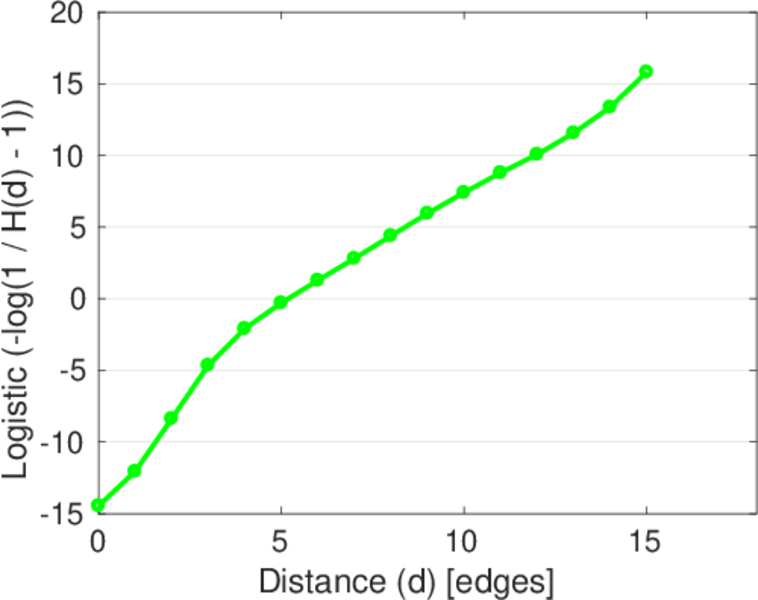
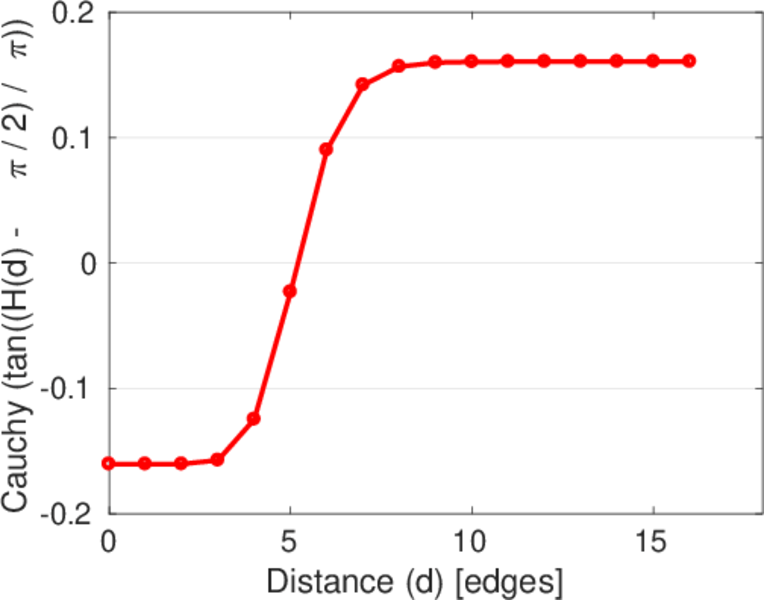
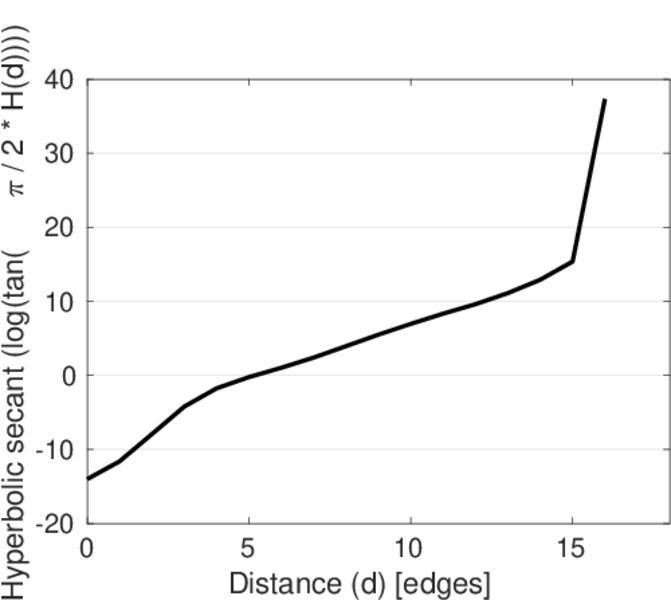
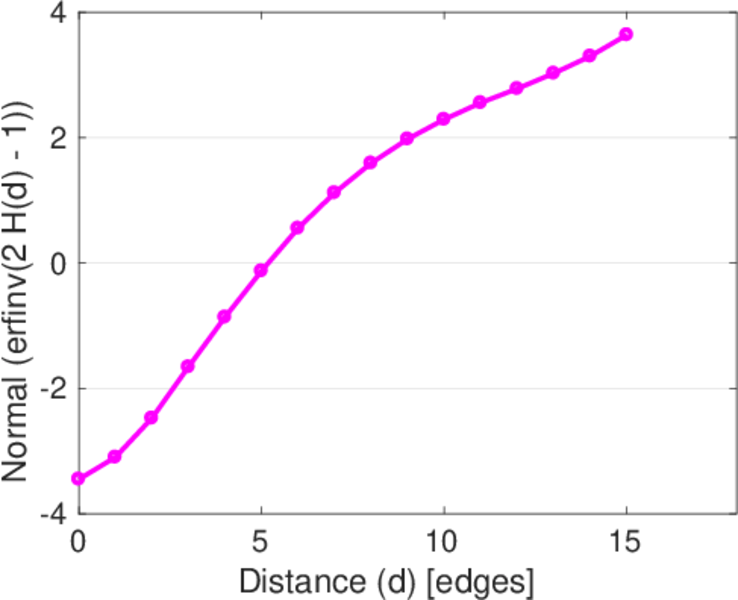
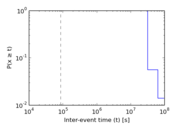
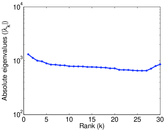
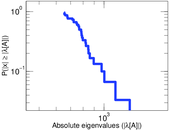
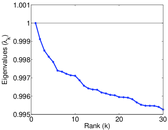
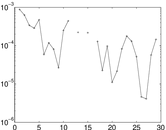
Plots


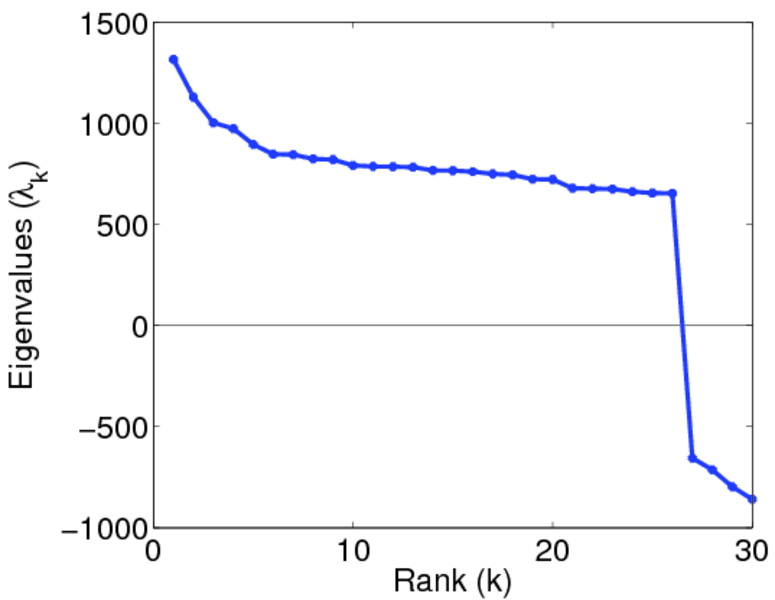
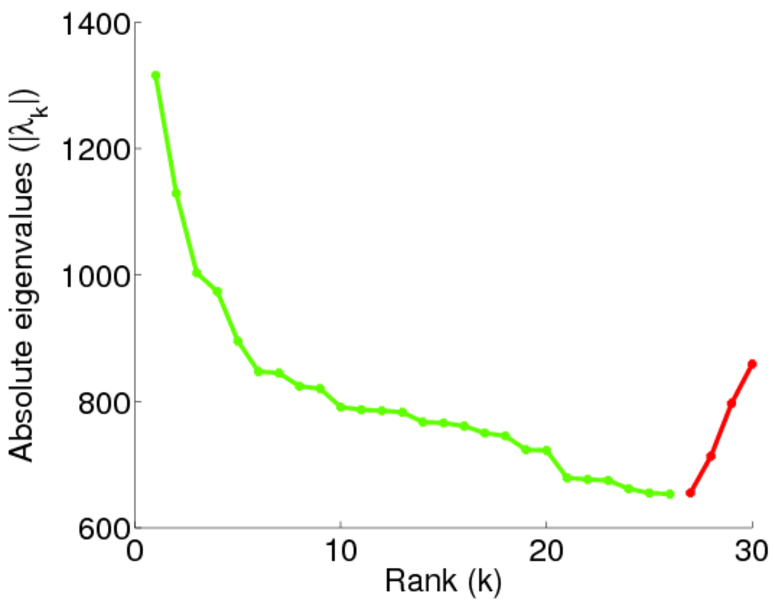
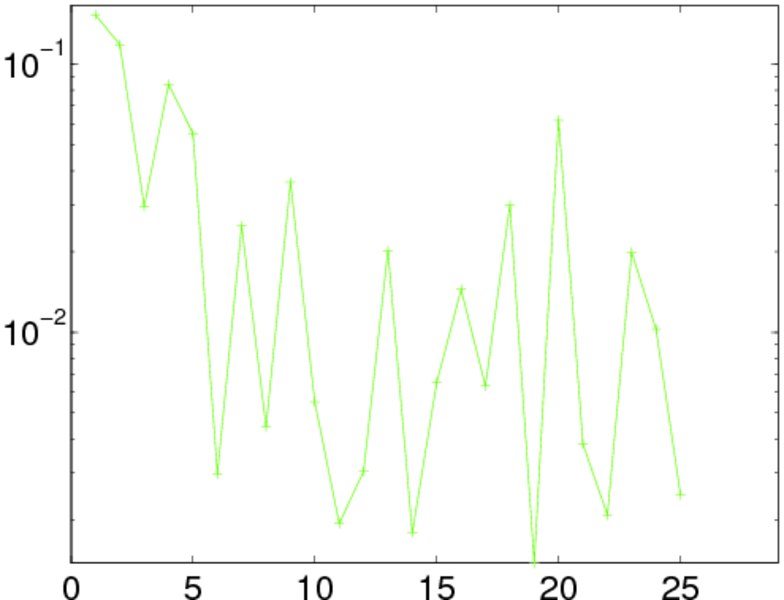
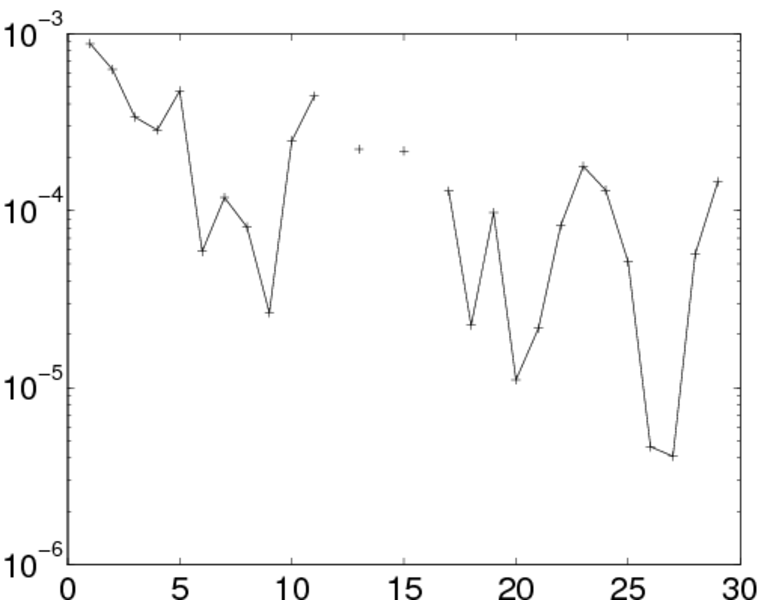
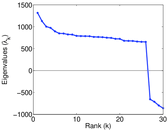
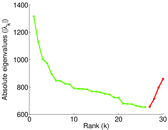
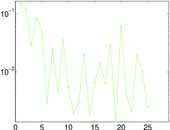
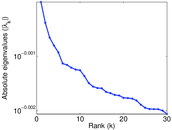
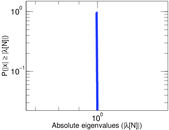
Matrix decompositions plots
Downloads
References
|
[1]
|
Jérôme Kunegis.
KONECT – The Koblenz Network Collection.
In Proc. Int. Conf. on World Wide Web Companion, pages
1343–1350, 2013.
[ http ]
|
|
[2]
|
Michael Ley.
The DBLP computer science bibliography: Evolution, research issues,
perspectives.
In Proc. Int. Symposium on String Process. and Inf. Retr.,
pages 1–10, 2002.
|
 KONECT ‣ Networks ‣
Buy Me a Coffee
KONECT ‣ Networks ‣
Buy Me a Coffee