DBpedia locations
This is the bipartite network of entities in Wikipedia and their locations. The
nodes of the network are entities and locations. Edges denote that an entity is
associated with a location. Entity can have multiple locations, for instance
cities associated with a company. The edges correspond to the
<http://dbpedia.org/ontology/location> relationships in DBpedia.
Metadata
Statistics
| Size | n = | 225,498
|
| Left size | n1 = | 172,091
|
| Right size | n2 = | 53,407
|
| Volume | m = | 293,697
|
| Wedge count | s = | 122,892,989
|
| Claw count | z = | 324,552,882,549
|
| Cross count | x = | 929,789,499,617,832
|
| Square count | q = | 3,761,594
|
| 4-Tour count | T4 = | 522,254,610
|
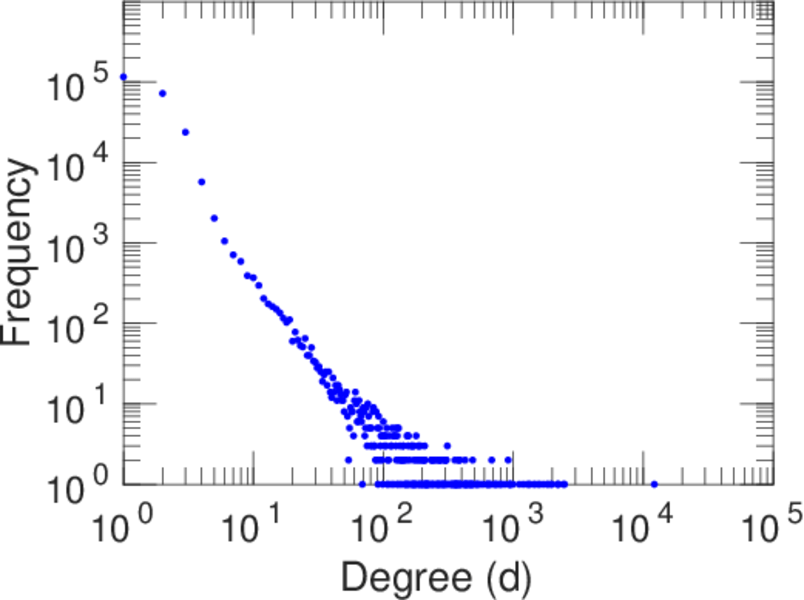
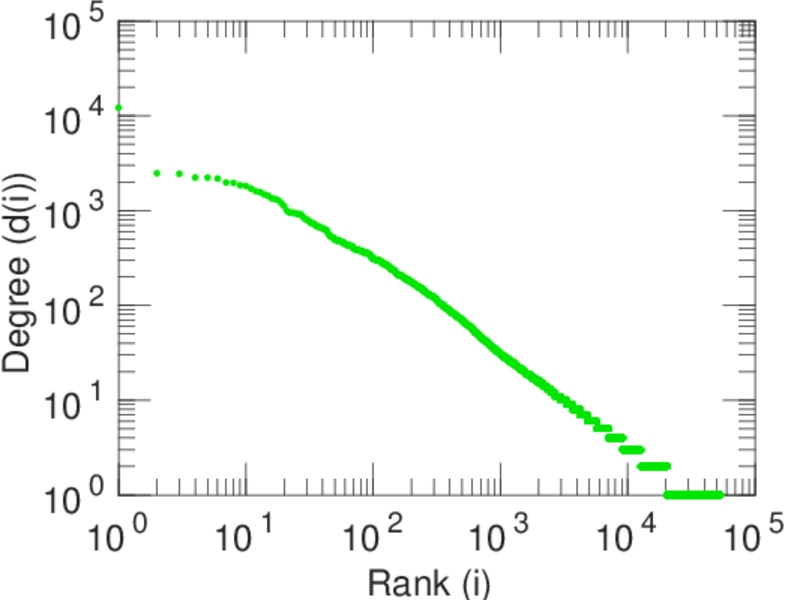
| Maximum degree | dmax = | 12,189
|
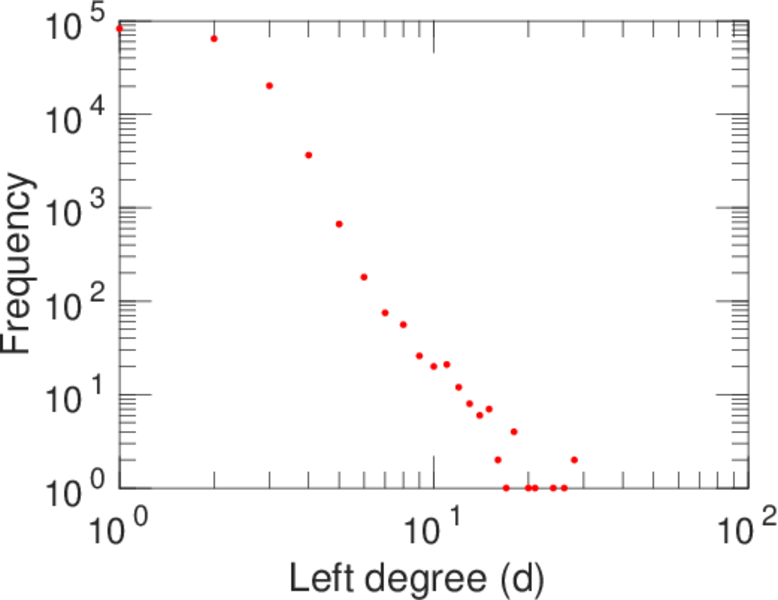
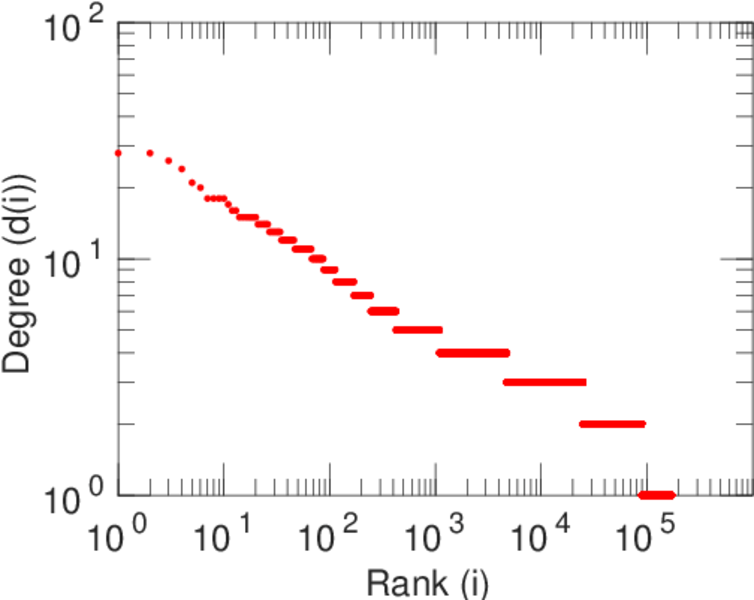
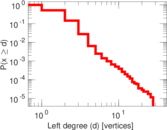
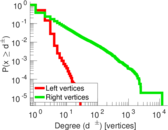
| Maximum left degree | d1max = | 28
|
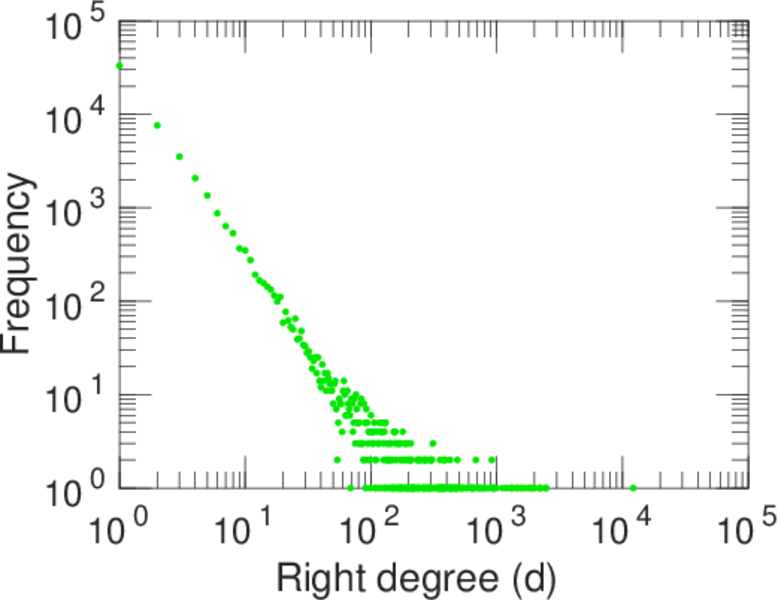
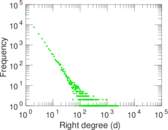
| Maximum right degree | d2max = | 12,189
|
| Average degree | d = | 2.604 87
|
| Average left degree | d1 = | 1.706 64
|
| Average right degree | d2 = | 5.499 22
|
| Fill | p = | 3.195 53 × 10−5
|
| Size of LCC | N = | 181,937
|
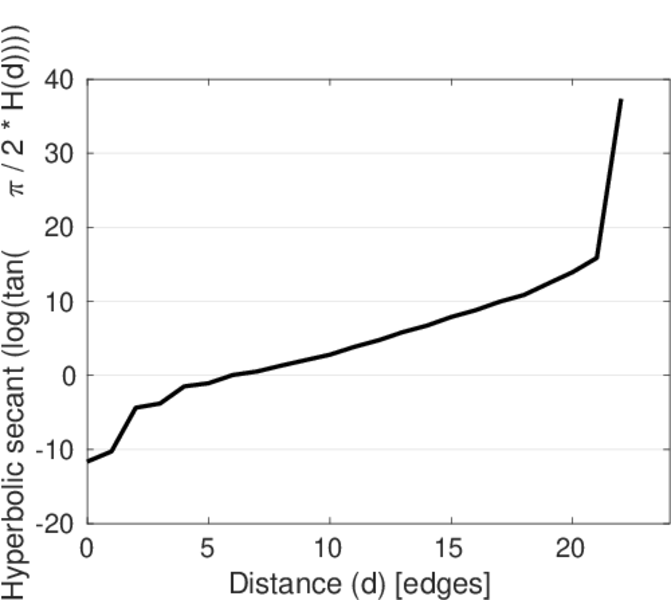
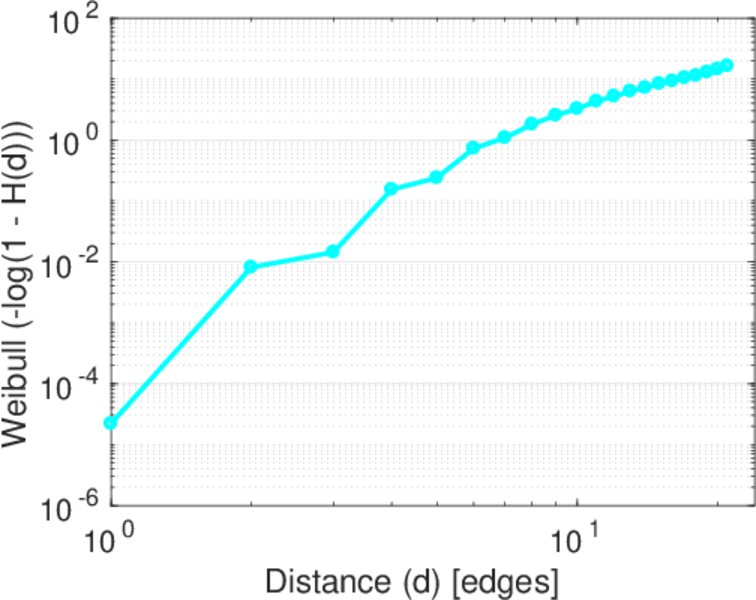
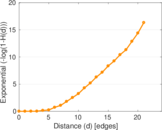
| Diameter | δ = | 27
|
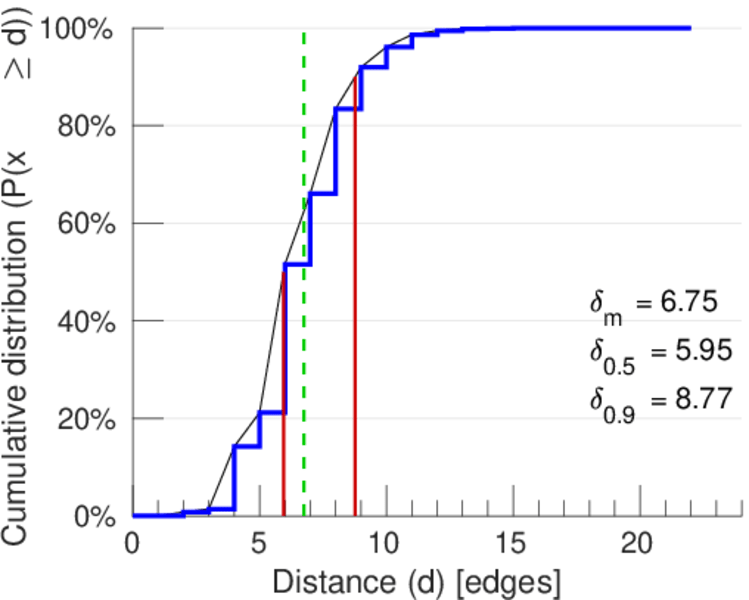
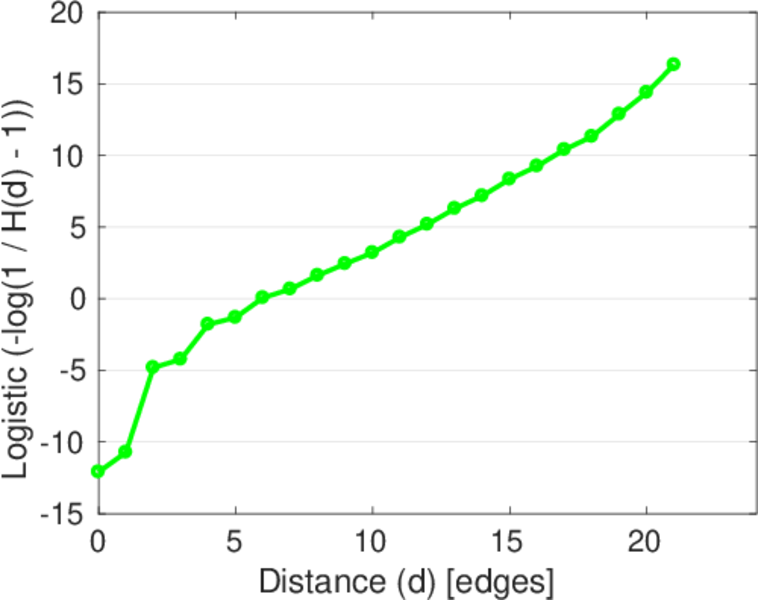
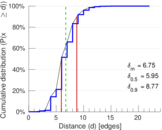
| 50-Percentile effective diameter | δ0.5 = | 5.948 20
|
| 90-Percentile effective diameter | δ0.9 = | 8.770 09
|
| Median distance | δM = | 6
|
| Mean distance | δm = | 6.754 43
|
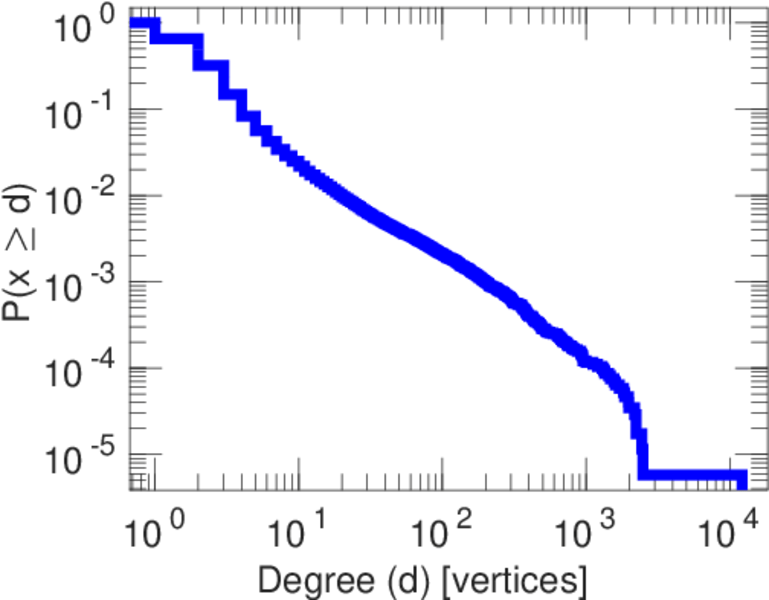
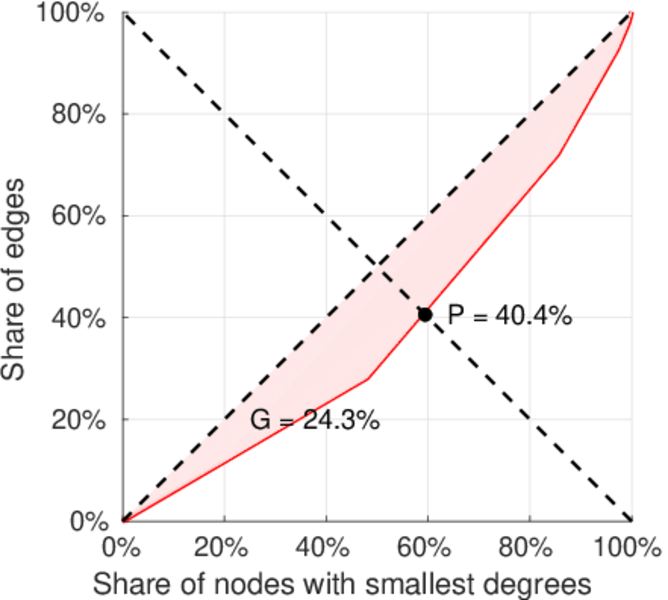
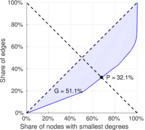
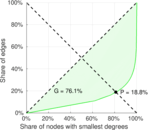
| Gini coefficient | G = | 0.540 934
|
| Balanced inequality ratio | P = | 0.305 049
|
| Left balanced inequality ratio | P1 = | 0.404 226
|
| Right balanced inequality ratio | P2 = | 0.187 612
|
| Relative edge distribution entropy | Her = | 0.888 942
|
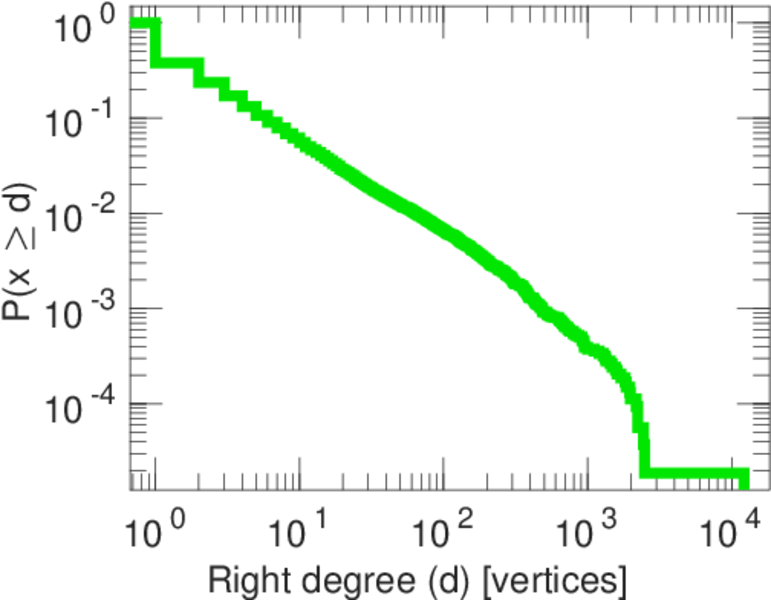
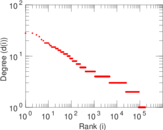
| Power law exponent | γ = | 3.176 22
|
| Tail power law exponent | γt = | 2.011 00
|
| Tail power law exponent with p | γ3 = | 2.011 00
|
| p-value | p = | 0.000 00
|
| Left tail power law exponent with p | γ3,1 = | 6.221 00
|
| Left p-value | p1 = | 0.000 00
|
| Right tail power law exponent with p | γ3,2 = | 2.021 00
|
| Right p-value | p2 = | 0.000 00
|
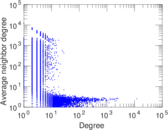
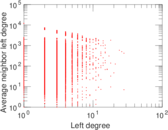
| Degree assortativity | ρ = | +0.082 583 3
|
| Degree assortativity p-value | pρ = | 0.000 00
|
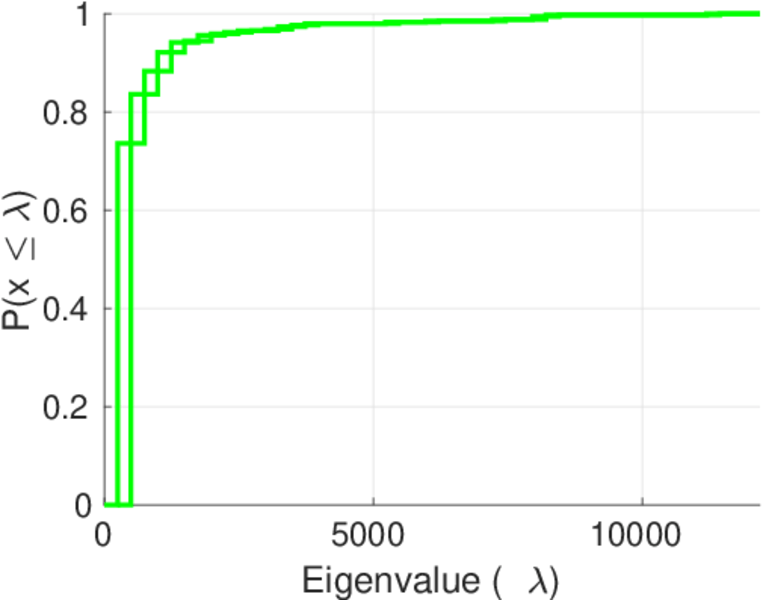
| Spectral norm | α = | 111.155
|
| Algebraic connectivity | a = | 0.000 760 771
|
| Spectral separation | |λ1[A] / λ2[A]| = | 1.917 68
|
| Controllability | C = | 124,316
|
| Relative controllability | Cr = | 0.551 325
|
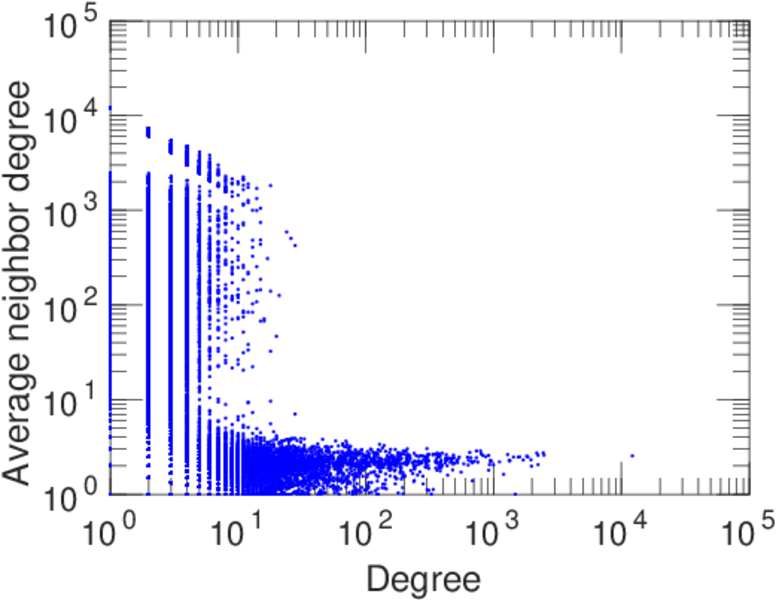
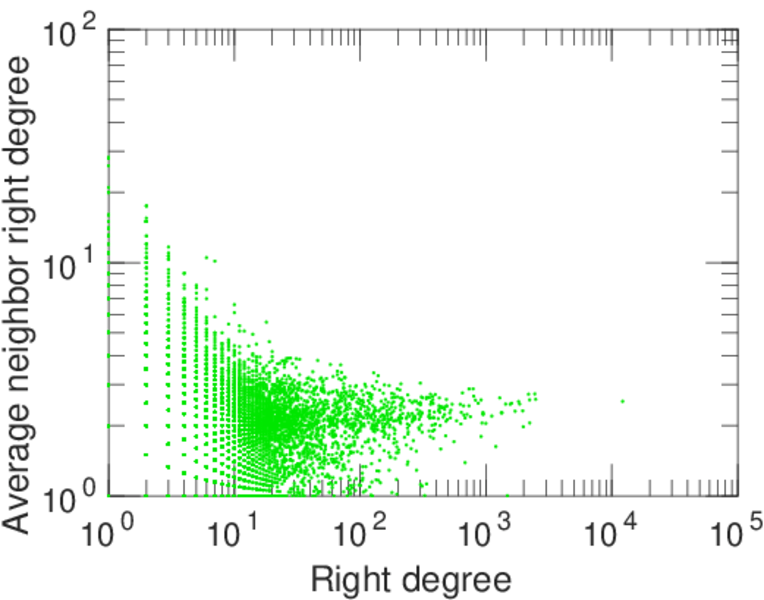
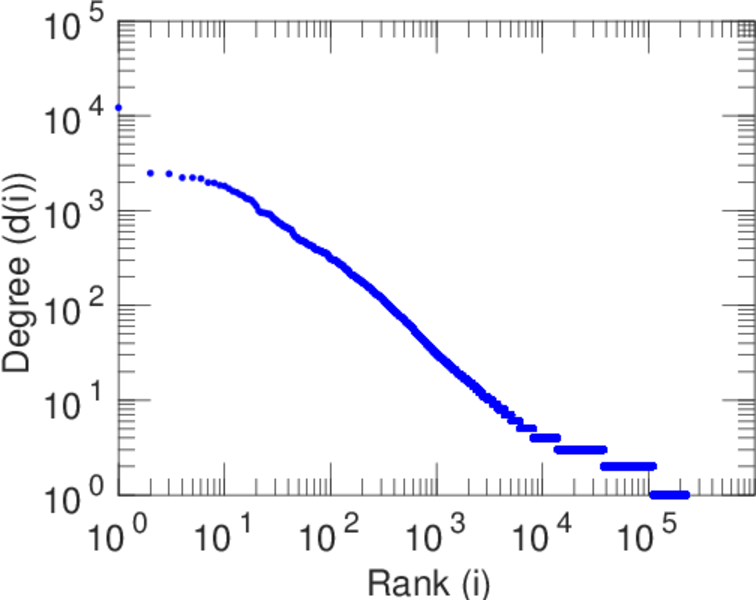
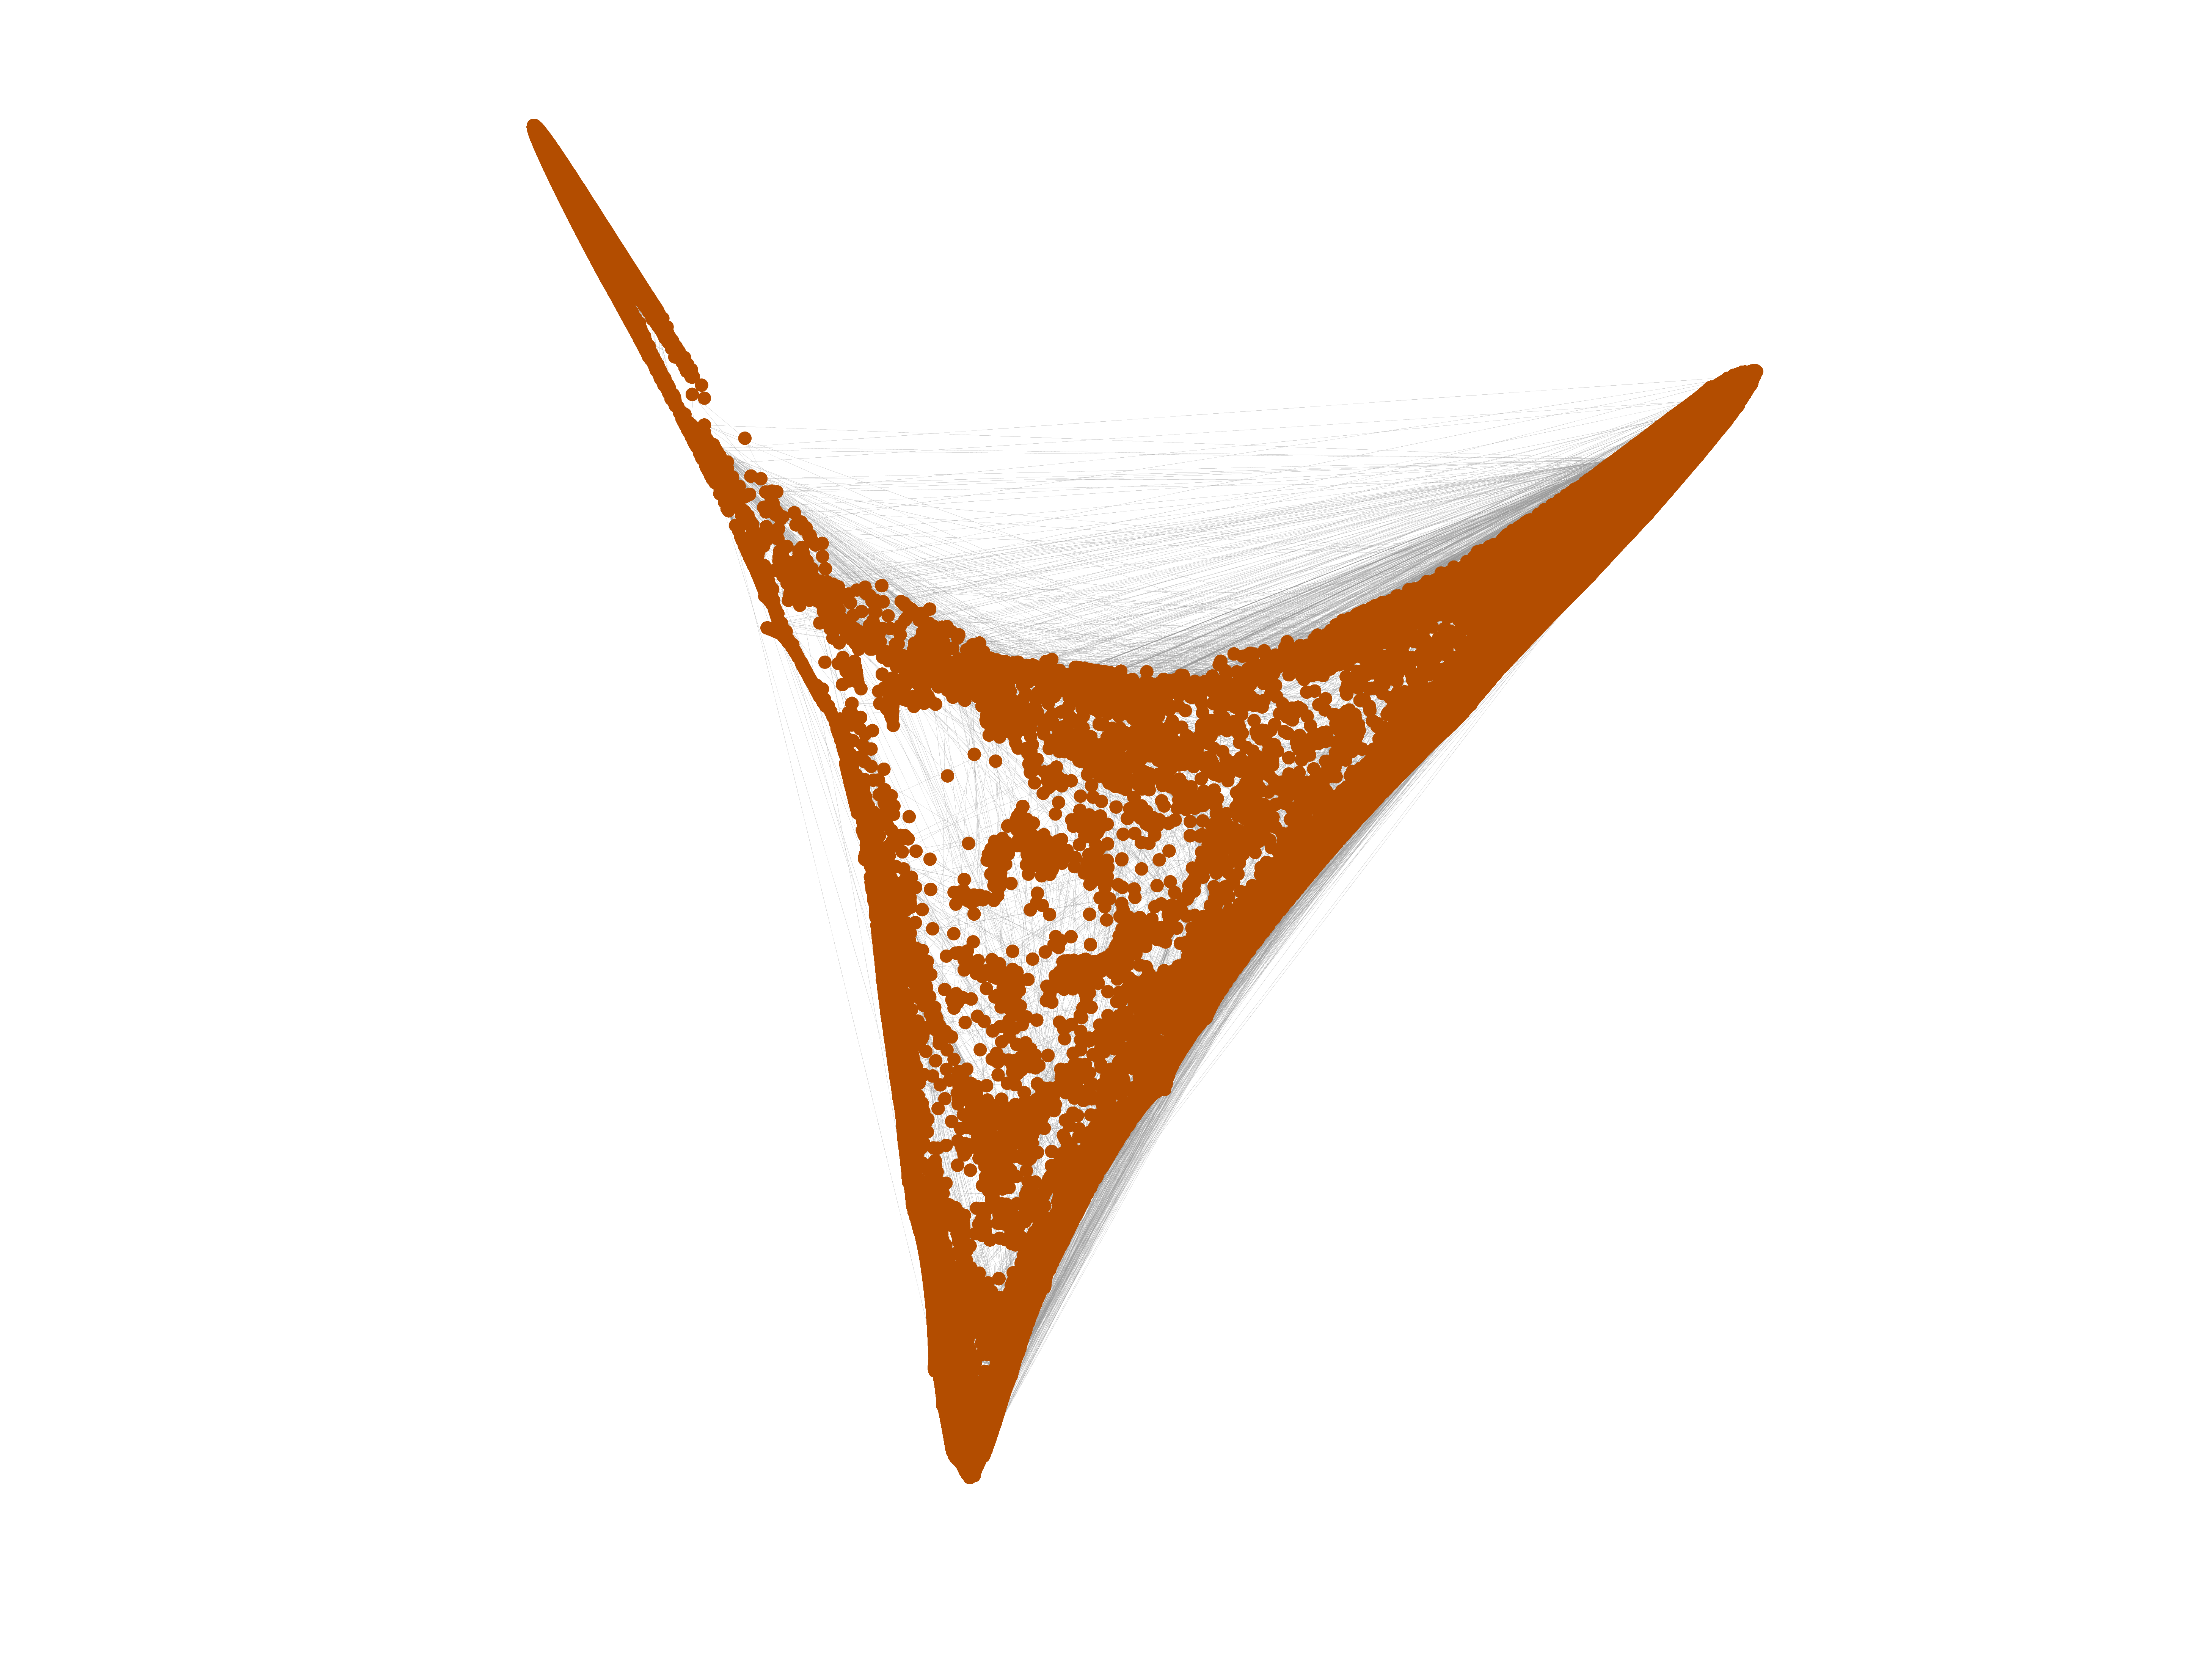
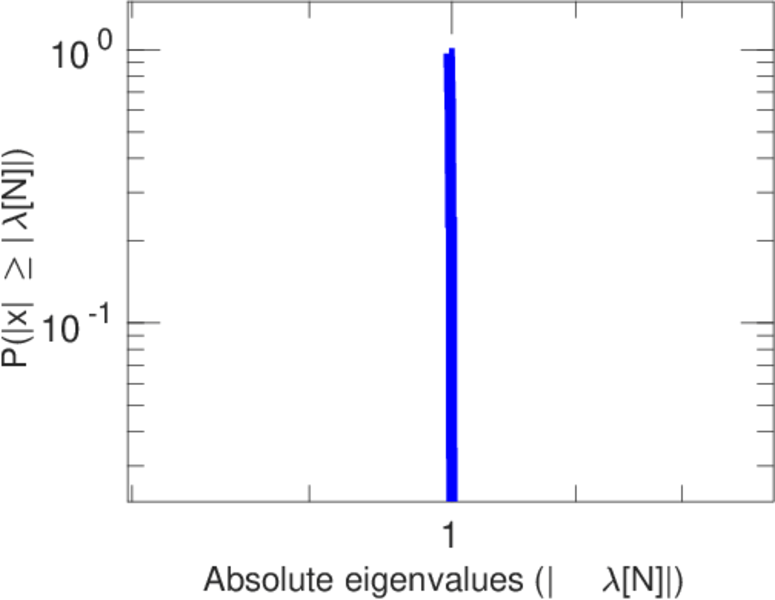
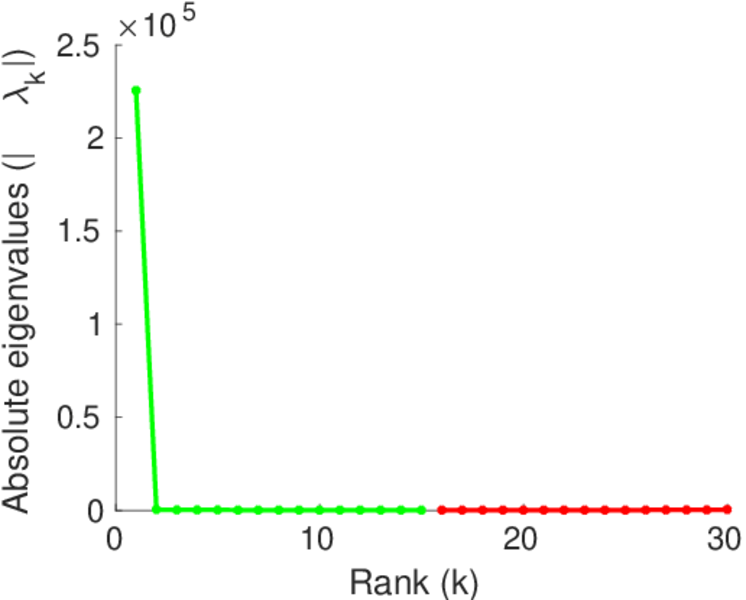
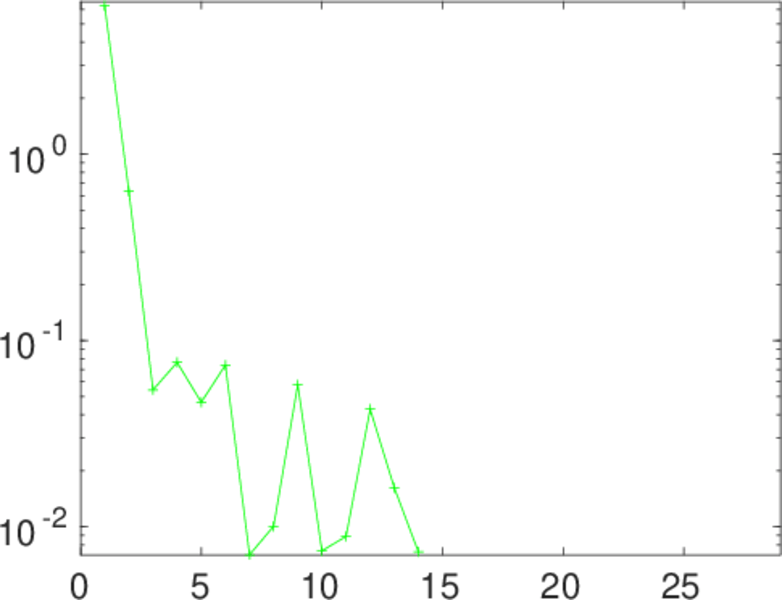
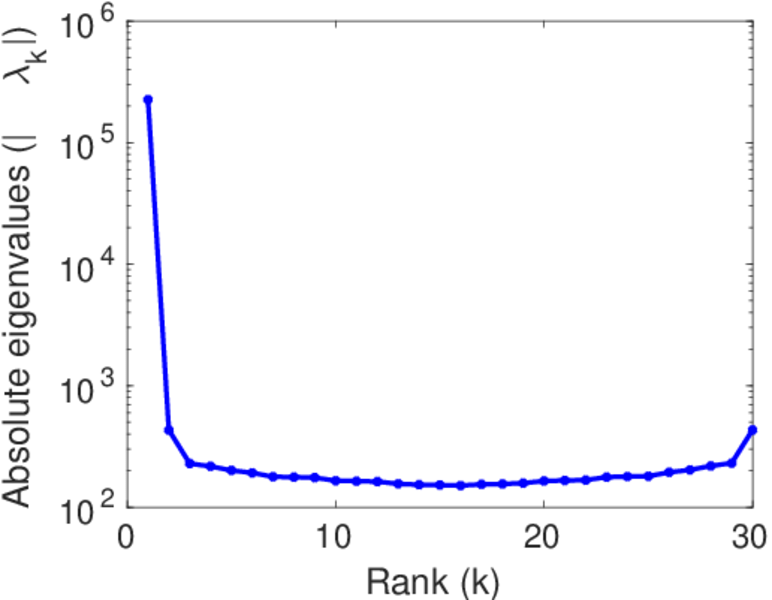
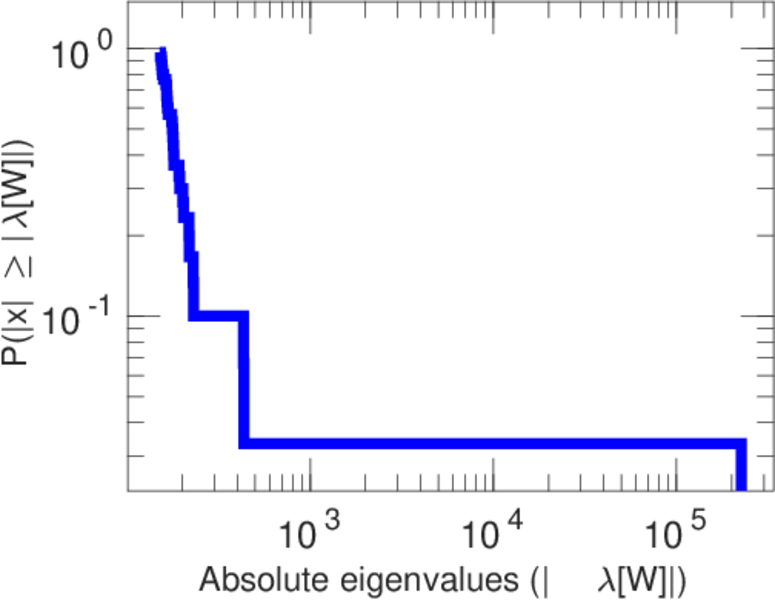
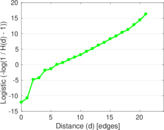
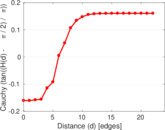
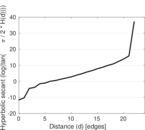
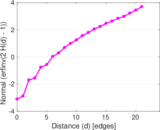
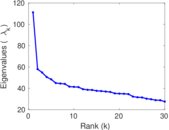
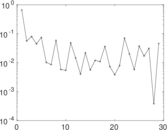
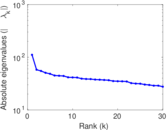
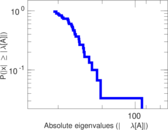
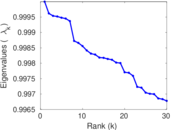
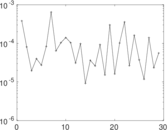
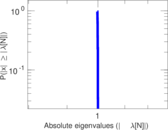
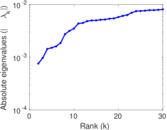
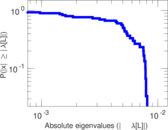
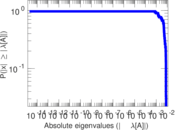
Plots


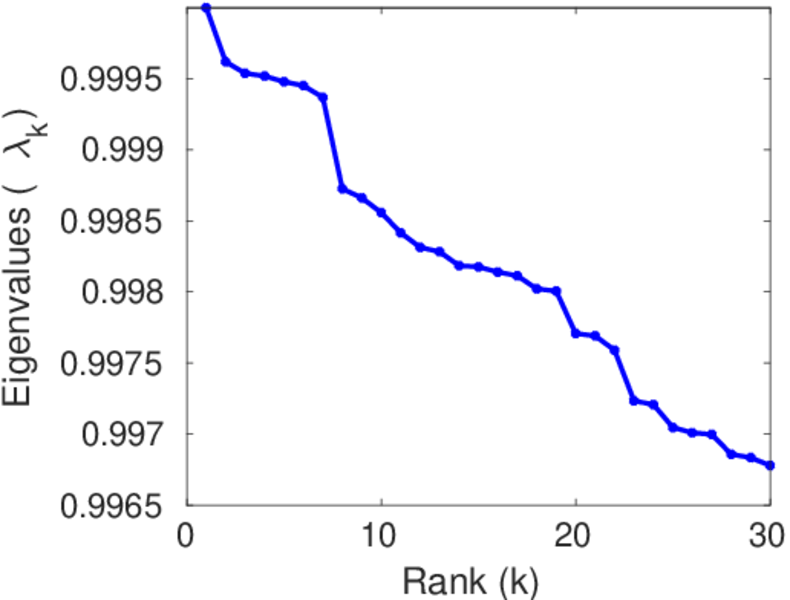
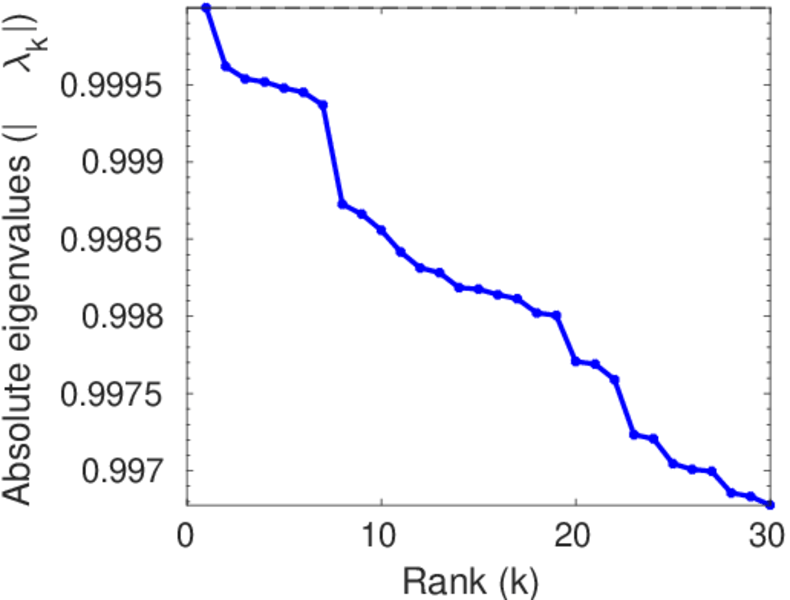
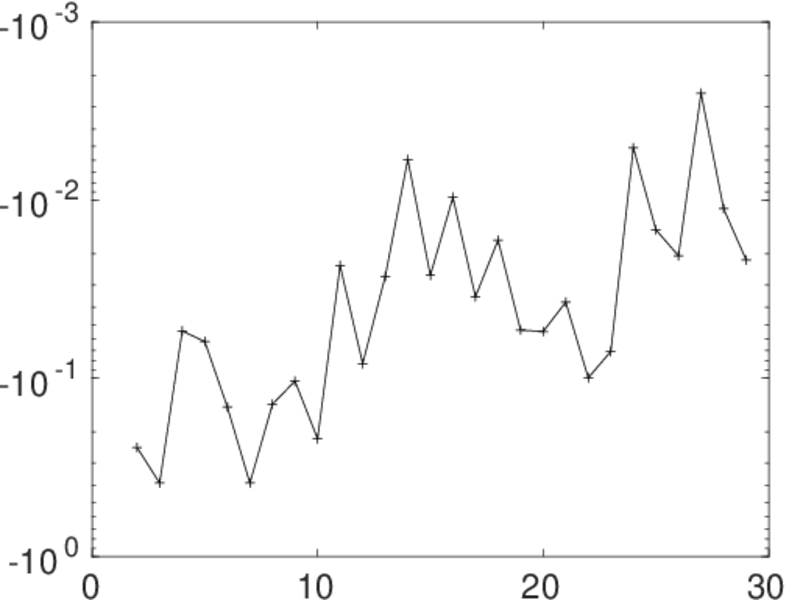
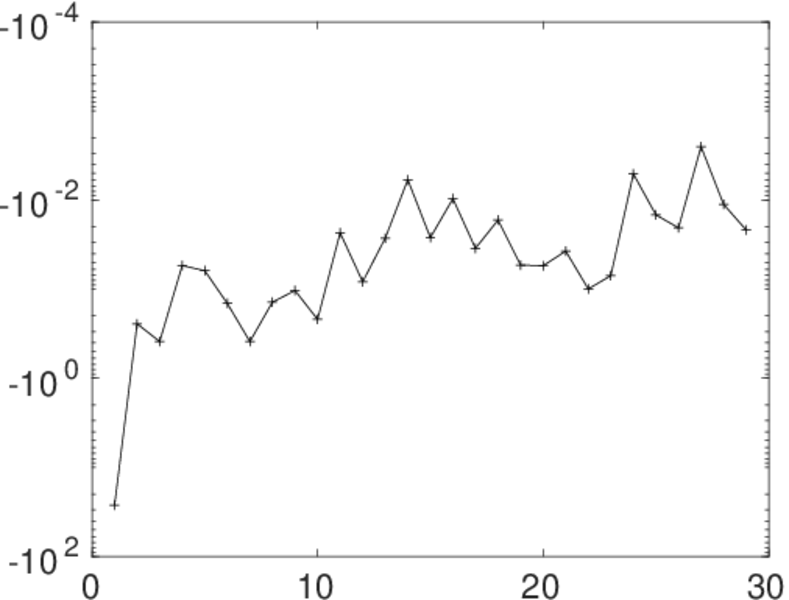
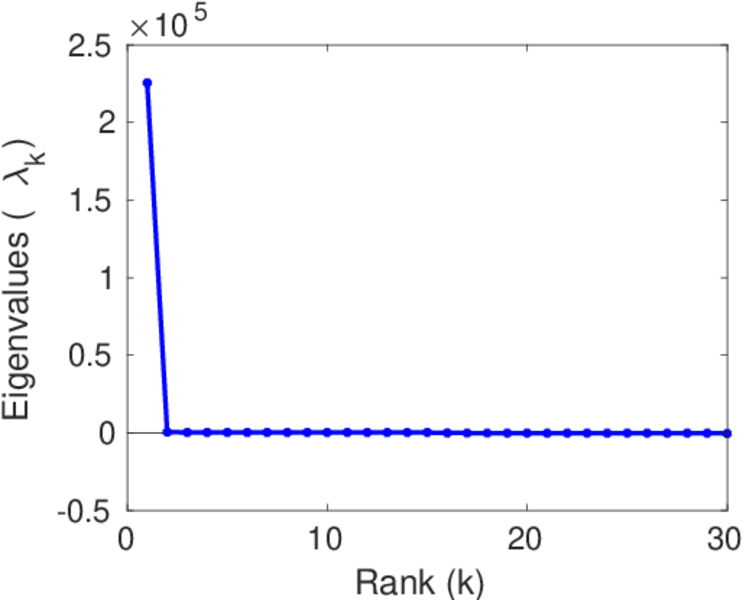
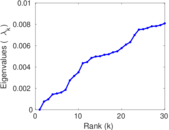
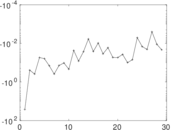
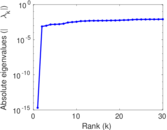
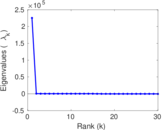
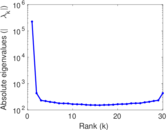
Matrix decompositions plots


Downloads
References
|
[1]
|
Jérôme Kunegis.
KONECT – The Koblenz Network Collection.
In Proc. Int. Conf. on World Wide Web Companion, pages
1343–1350, 2013.
[ http ]
|
|
[2]
|
Sören Auer, Christian Bizer, Georgi Kobilarov, Jens Lehmann, Richard Cyganiak,
and Zachary Ives.
DBpedia: A nucleus for a web of open data.
In Proc. Int. Semant. Web Conf., pages 722–735, 2008.
|
 KONECT ‣ Networks ‣
Buy Me a Coffee
KONECT ‣ Networks ‣
Buy Me a Coffee