Actors (DBpedia)
This is the bipartite network of movies and the actors that have played in
them, from the DBpedia project. The nodes in the network are movies and actors.
An edge connects a movie will an actor that has played in it. The dataset
corresponds to the <http://dbpedia.org/ontology/starring> relation in
DBpedia.
Metadata
Statistics
| Size | n = | 157,184
|
| Left size | n1 = | 76,099
|
| Right size | n2 = | 81,085
|
| Volume | m = | 281,396
|
| Wedge count | s = | 3,240,178
|
| Claw count | z = | 59,090,368
|
| Cross count | x = | 1,957,317,775
|
| Square count | q = | 221,363
|
| 4-Tour count | T4 = | 15,295,024
|
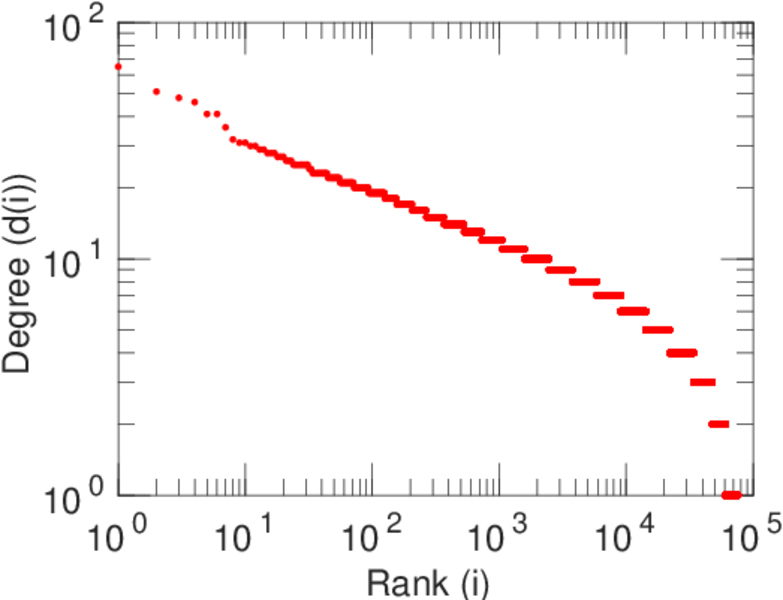
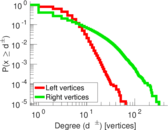
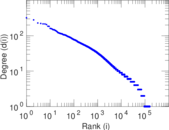
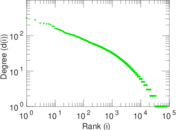
| Maximum degree | dmax = | 321
|
| Maximum left degree | d1max = | 65
|
| Maximum right degree | d2max = | 321
|
| Average degree | d = | 3.580 47
|
| Average left degree | d1 = | 3.697 76
|
| Average right degree | d2 = | 3.470 38
|
| Fill | p = | 4.560 35 × 10−5
|
| Size of LCC | N = | 134,015
|
| Diameter | δ = | 38
|
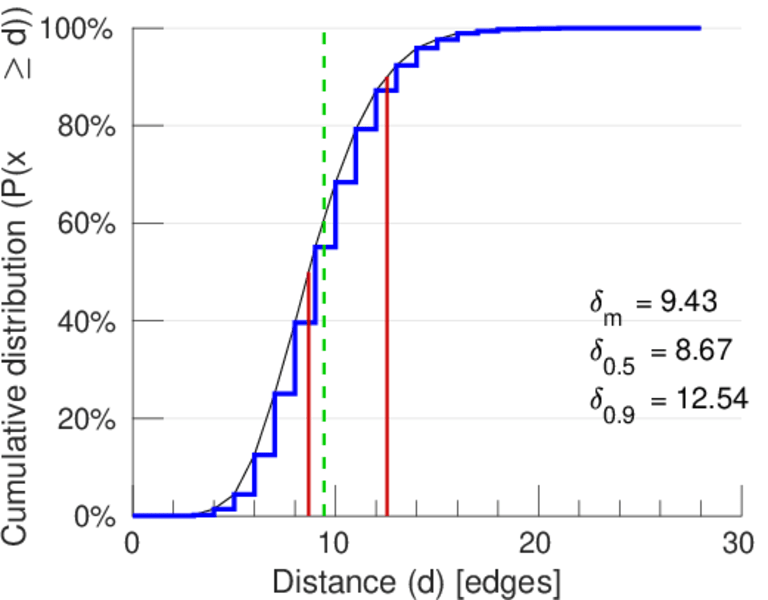
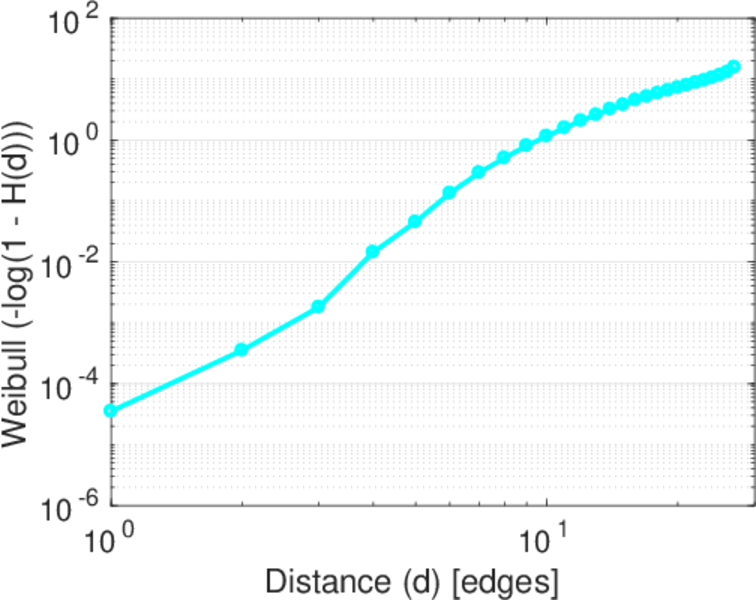
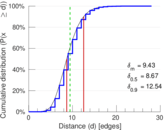
| 50-Percentile effective diameter | δ0.5 = | 8.669 53
|
| 90-Percentile effective diameter | δ0.9 = | 12.544 4
|
| Median distance | δM = | 9
|
| Mean distance | δm = | 9.432 82
|
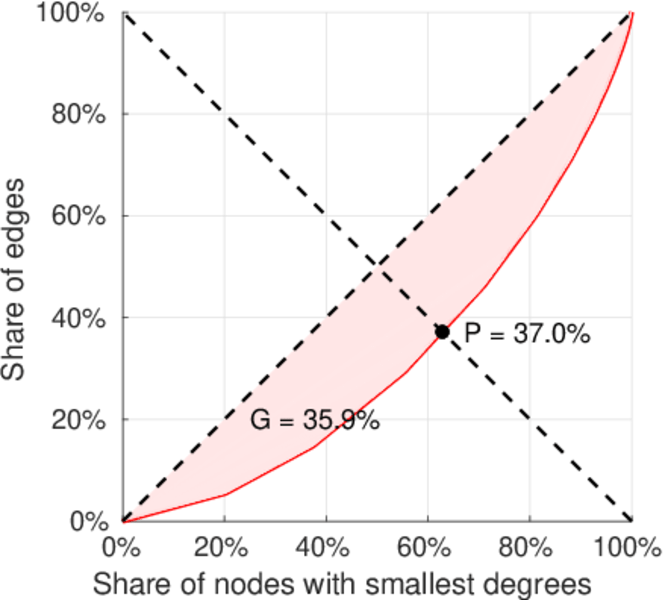
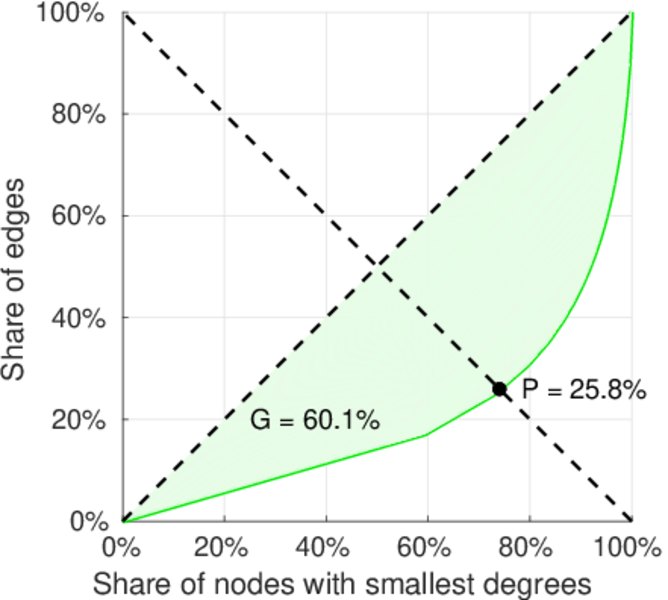
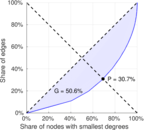
| Gini coefficient | G = | 0.437 649
|
| Balanced inequality ratio | P = | 0.343 072
|
| Left balanced inequality ratio | P1 = | 0.370 304
|
| Right balanced inequality ratio | P2 = | 0.258 223
|
| Relative edge distribution entropy | Her = | 0.955 531
|
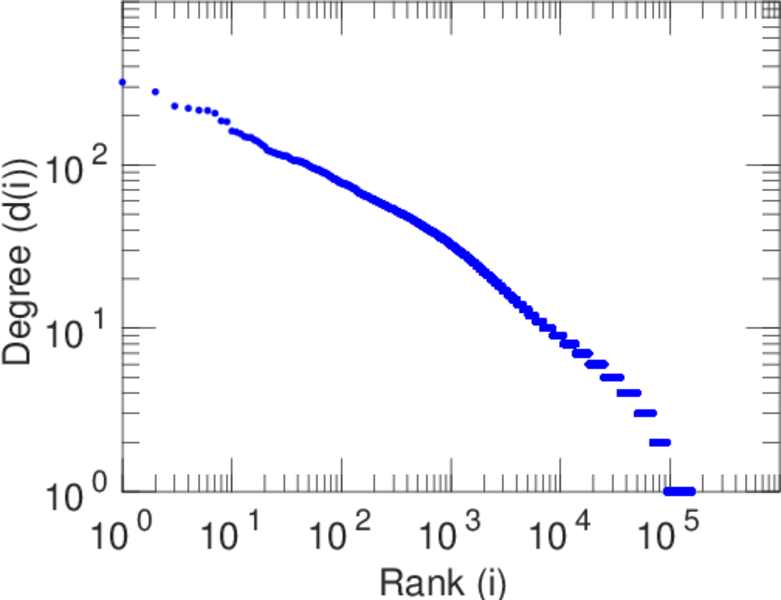
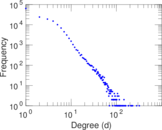
| Power law exponent | γ = | 2.199 29
|
| Tail power law exponent | γt = | 2.931 00
|
| Tail power law exponent with p | γ3 = | 2.931 00
|
| p-value | p = | 0.000 00
|
| Left tail power law exponent with p | γ3,1 = | 5.521 00
|
| Left p-value | p1 = | 0.573 000
|
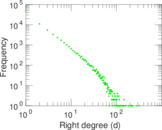
| Right tail power law exponent with p | γ3,2 = | 3.951 00
|
| Right p-value | p2 = | 0.794 000
|
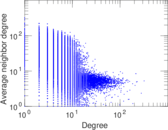
| Degree assortativity | ρ = | −0.076 644 6
|
| Degree assortativity p-value | pρ = | 0.000 00
|
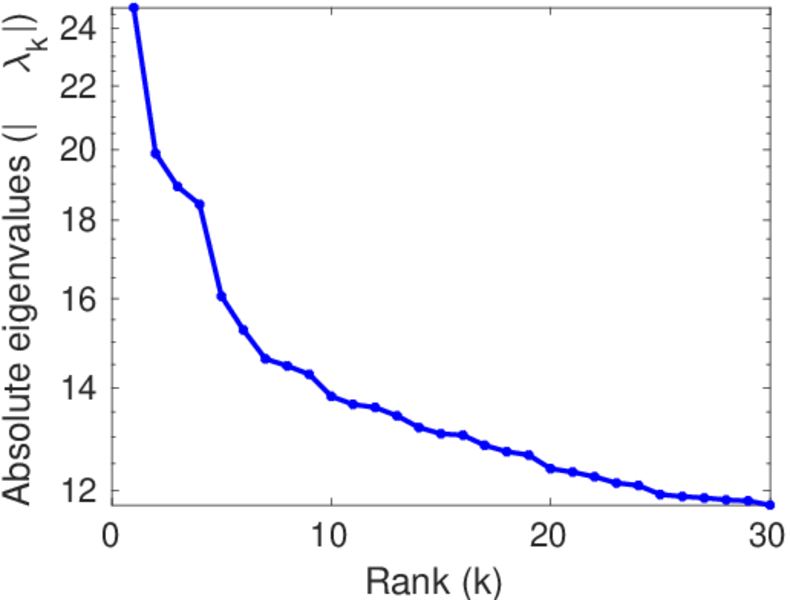
| Spectral norm | α = | 24.740 9
|
| Algebraic connectivity | a = | 0.002 628 42
|
| Spectral separation | |λ1[A] / λ2[A]| = | 1.244 23
|
| Controllability | C = | 56,054
|
| Relative controllability | Cr = | 0.356 616
|
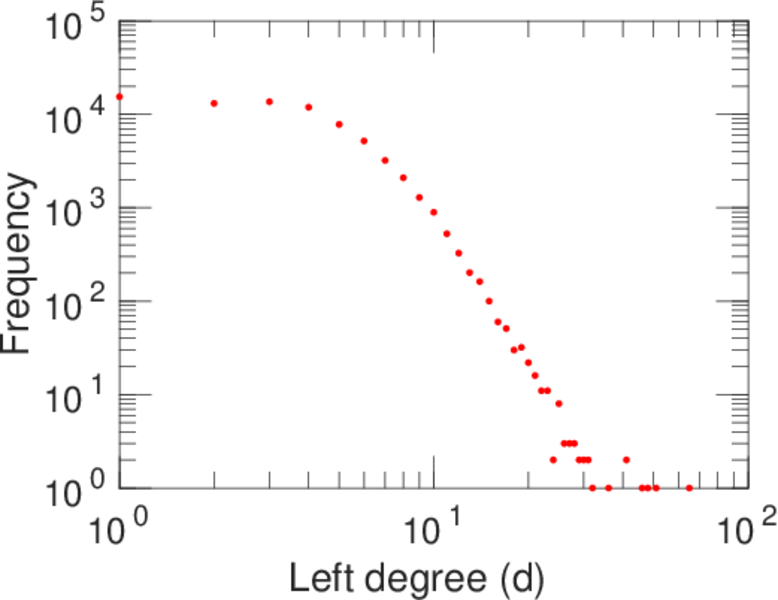
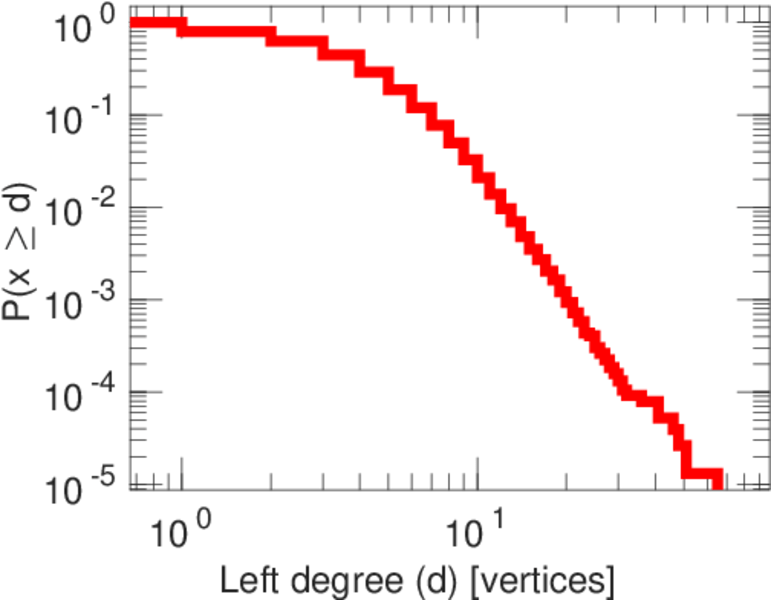
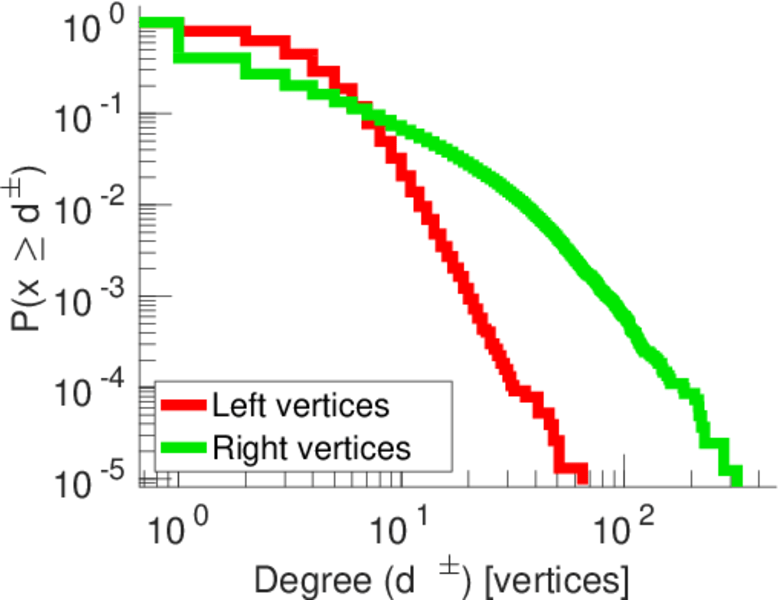
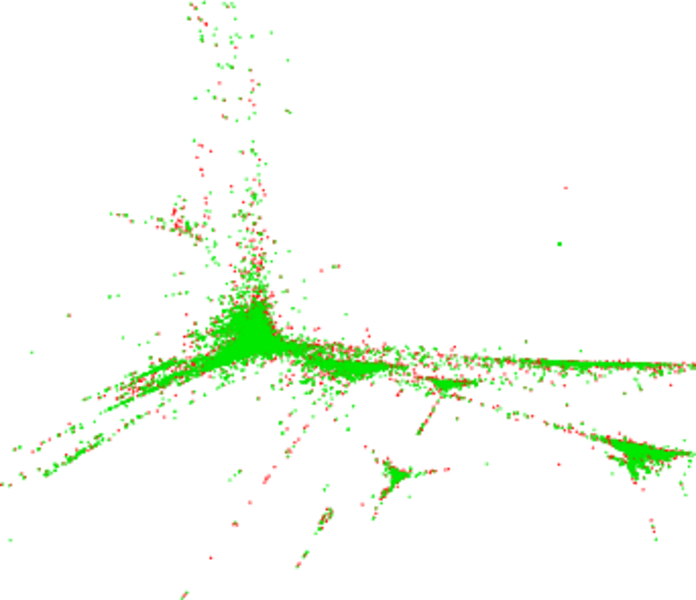
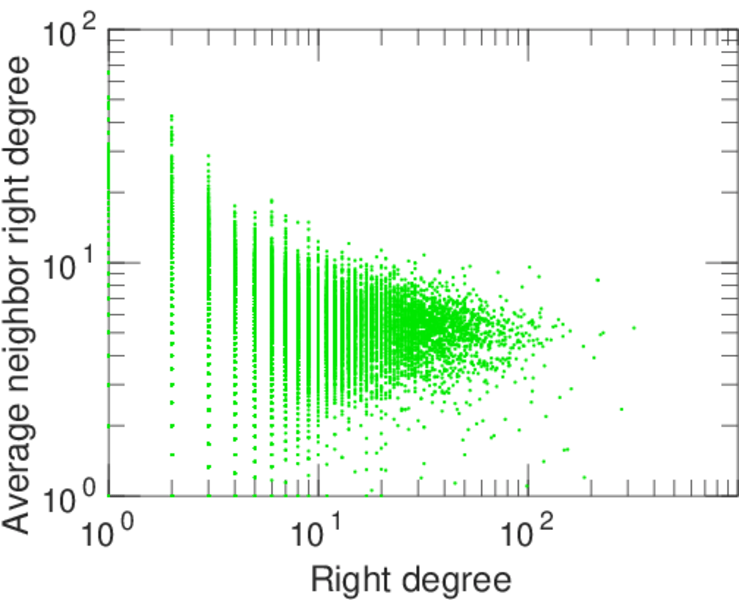
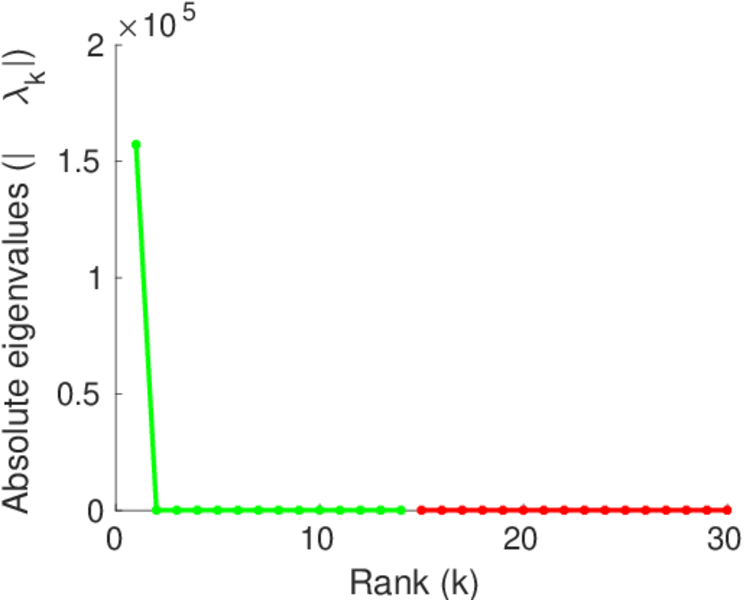
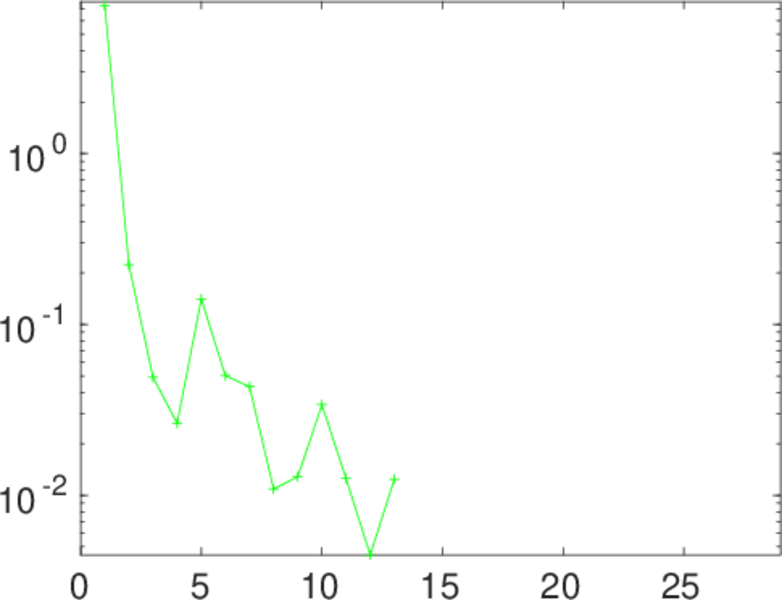
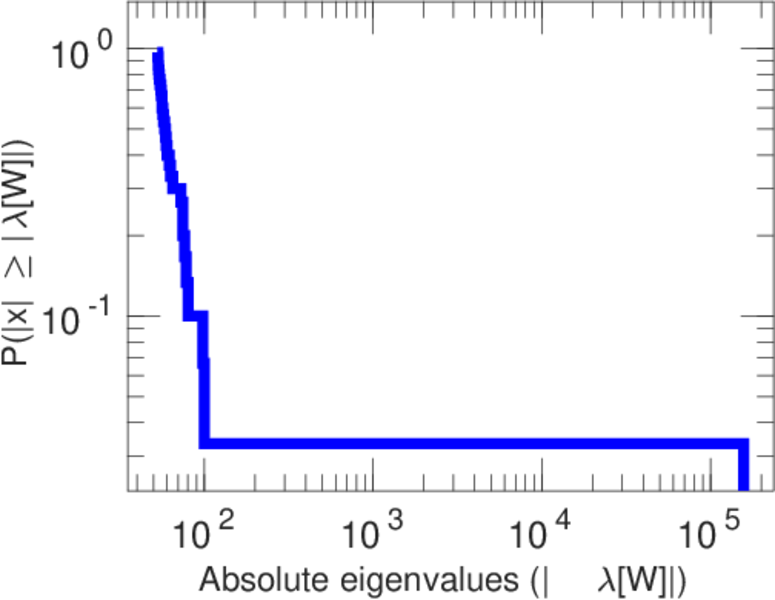
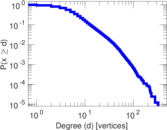
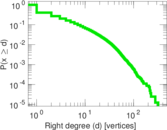
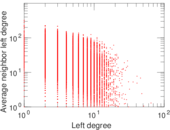
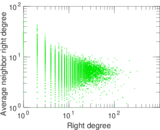
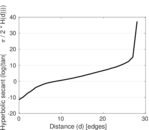
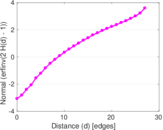
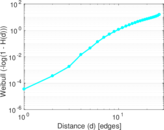
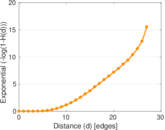
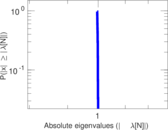
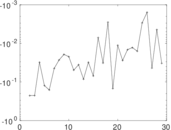
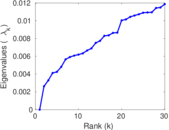
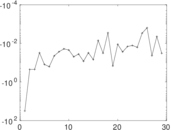
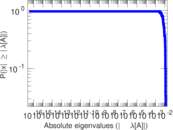
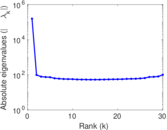
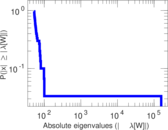
Plots


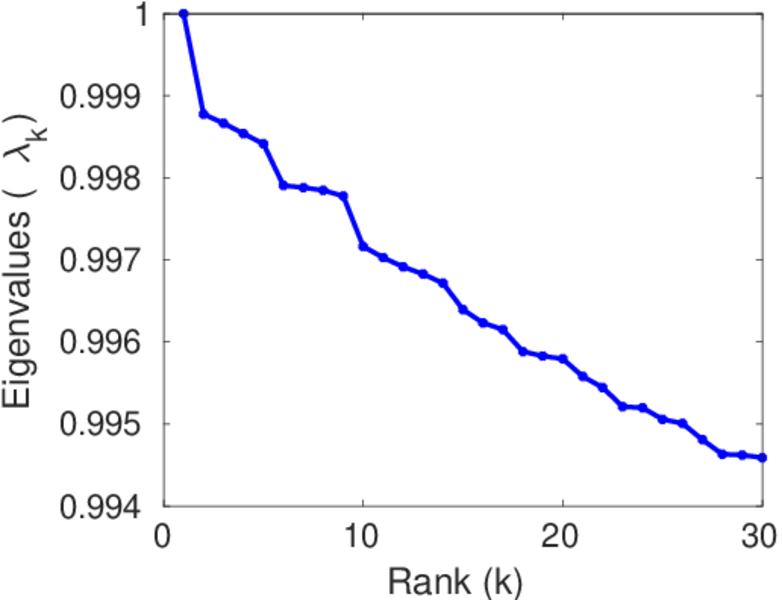
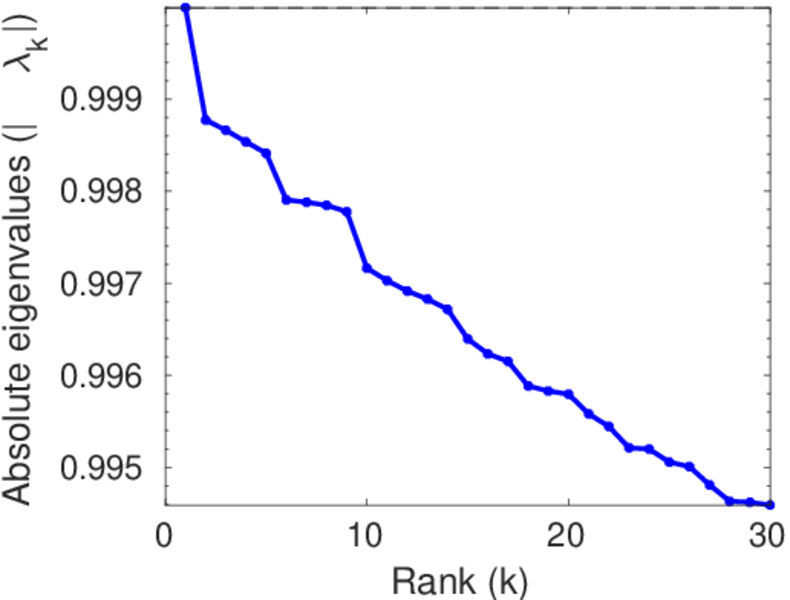
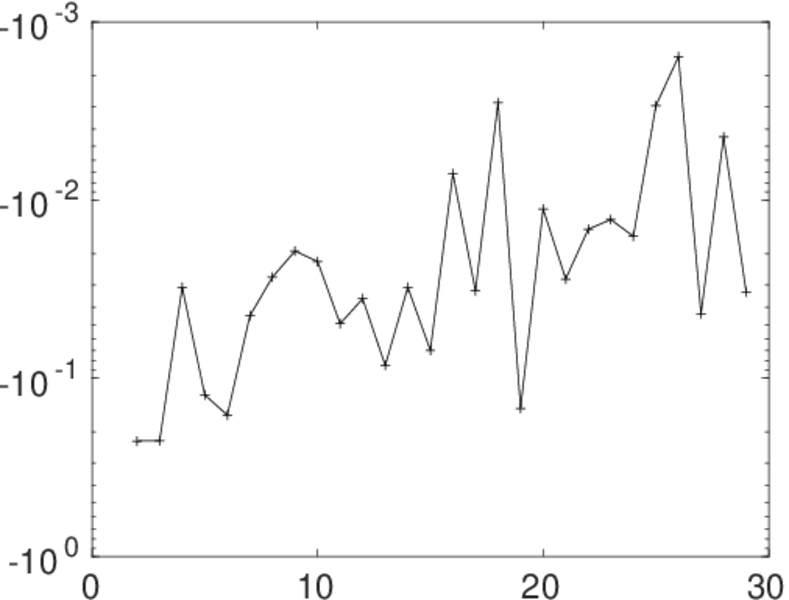
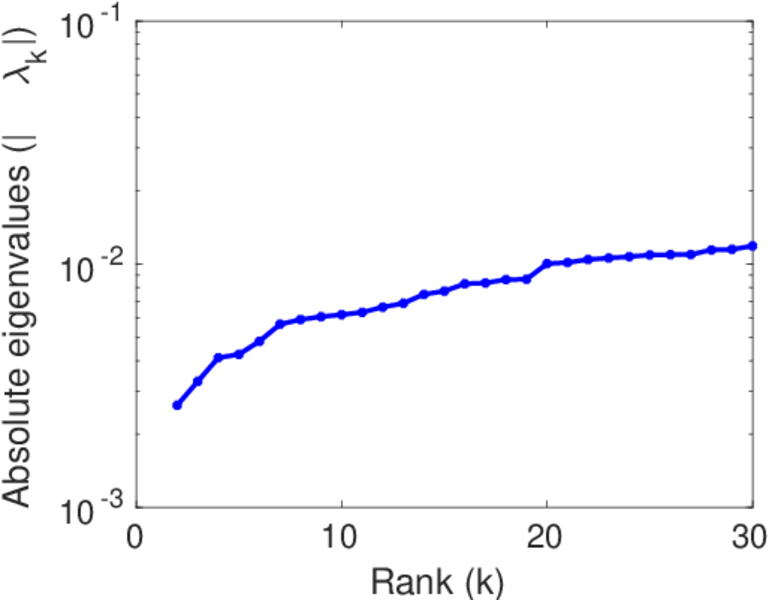
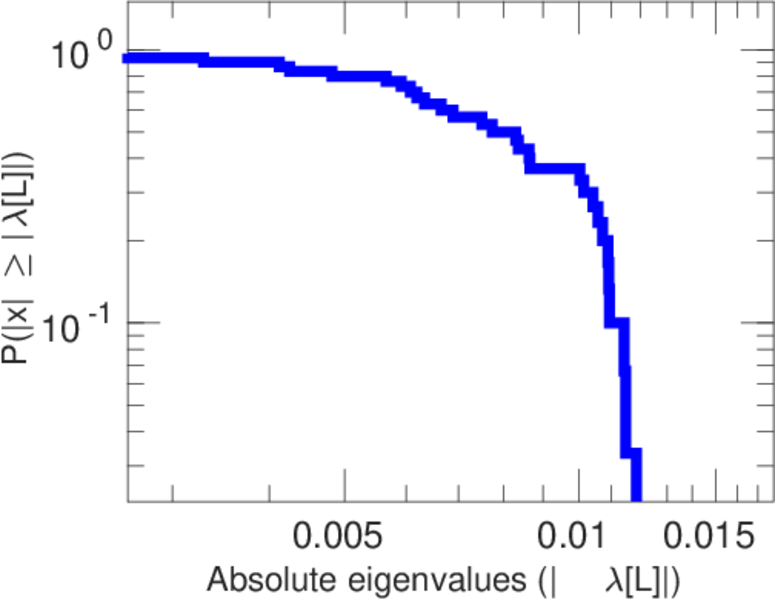
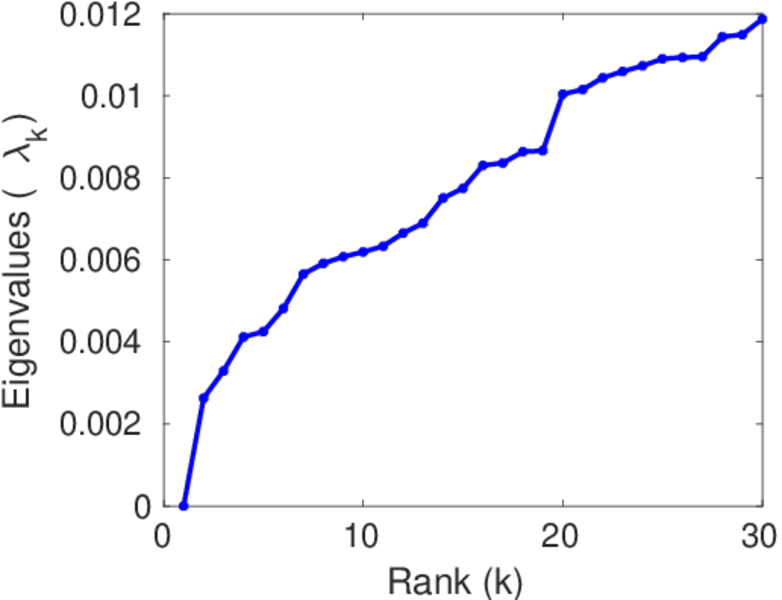
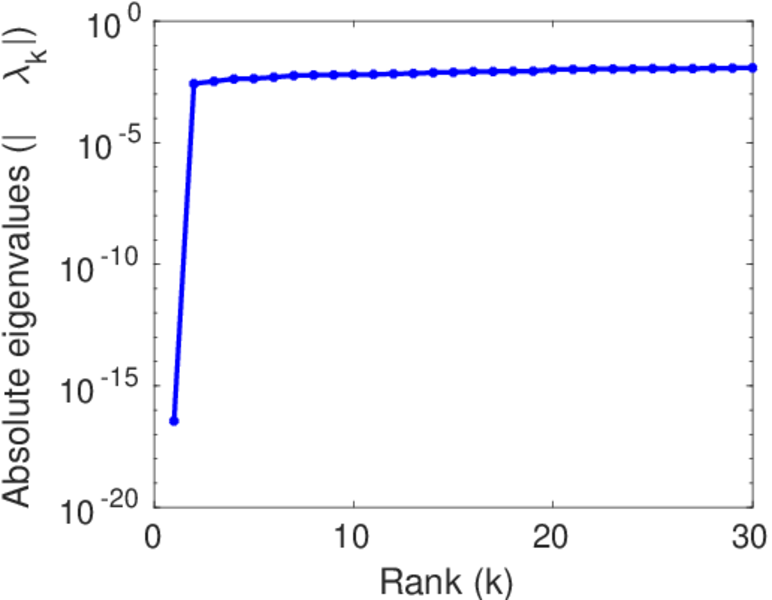
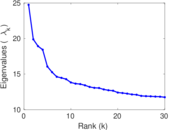
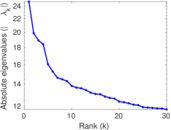
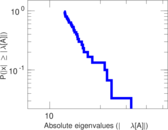
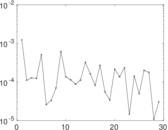
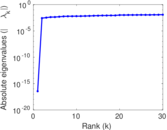
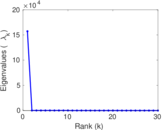
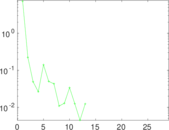
Matrix decompositions plots


Downloads
References
|
[1]
|
Jérôme Kunegis.
KONECT – The Koblenz Network Collection.
In Proc. Int. Conf. on World Wide Web Companion, pages
1343–1350, 2013.
[ http ]
|
|
[2]
|
Sören Auer, Christian Bizer, Georgi Kobilarov, Jens Lehmann, Richard Cyganiak,
and Zachary Ives.
DBpedia: A nucleus for a web of open data.
In Proc. Int. Semant. Web Conf., pages 722–735, 2008.
|
 KONECT ‣ Networks ‣
Buy Me a Coffee
KONECT ‣ Networks ‣
Buy Me a Coffee