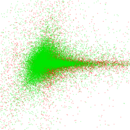
TV Tropes
This is the bipartite network of TV Tropes (tvtropes.org), characterising
artistic works by their tropes. Each edge connects a work (such as a movie, a
novel, etc.) to one trope (stylistic convention or device). The network was
extracted by the DBTropes project (dbtropes.org).
Metadata
Statistics
| Size | n = | 152,093
|
| Left size | n1 = | 64,415
|
| Right size | n2 = | 87,678
|
| Volume | m = | 3,232,134
|
| Wedge count | s = | 1,494,276,935
|
| Cross count | x = | 1,523,791,135,624,999
|
| Square count | q = | 4,209,628,681
|
| 4-Tour count | T4 = | 39,661,411,392
|
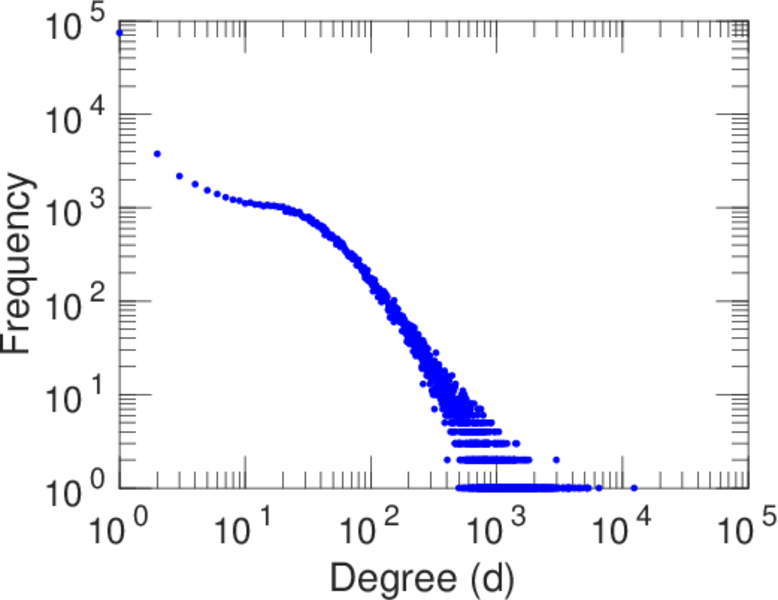
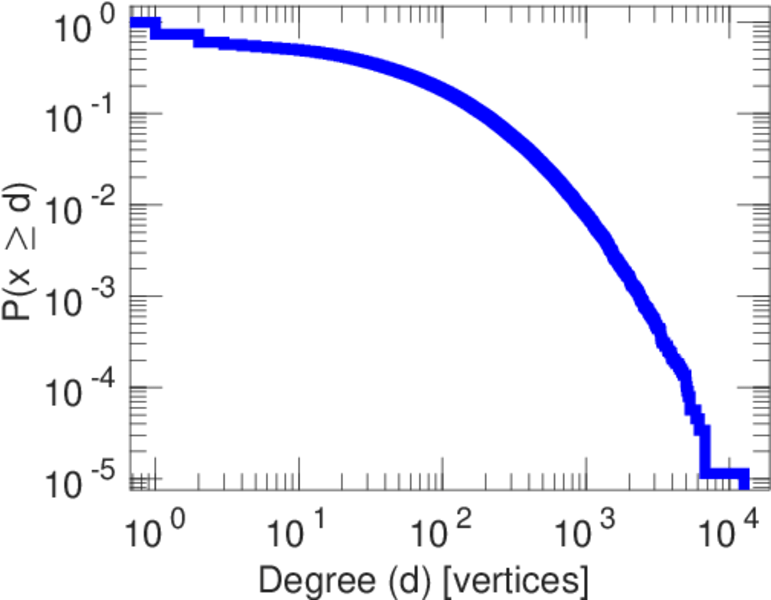
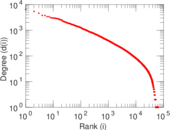
| Maximum degree | dmax = | 12,400
|
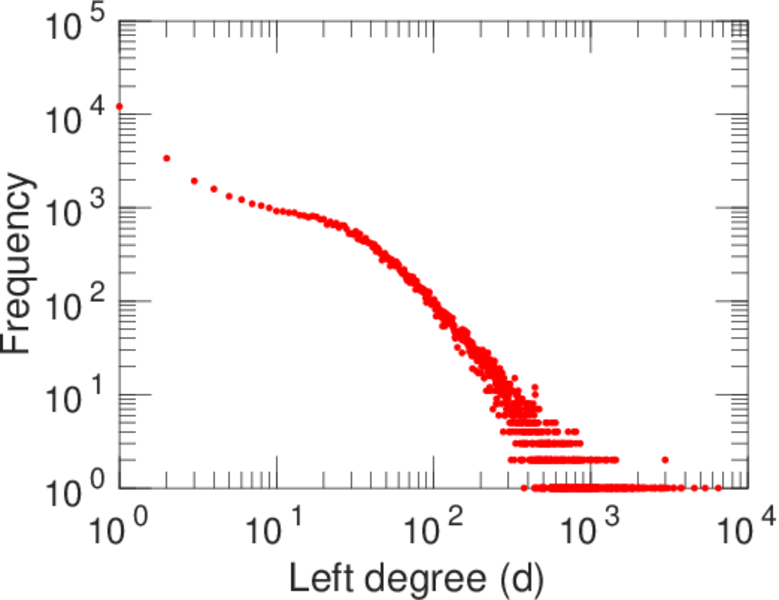
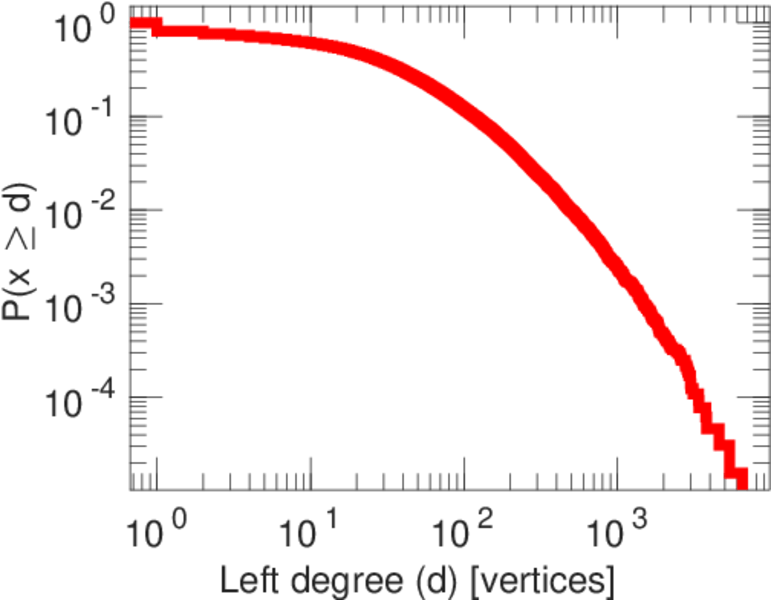
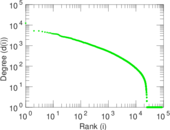
| Maximum left degree | d1max = | 6,507
|
| Maximum right degree | d2max = | 12,400
|
| Average degree | d = | 42.502 1
|
| Average left degree | d1 = | 50.176 7
|
| Average right degree | d2 = | 36.863 7
|
| Fill | p = | 0.000 572 284
|
| Size of LCC | N = | 128,728
|
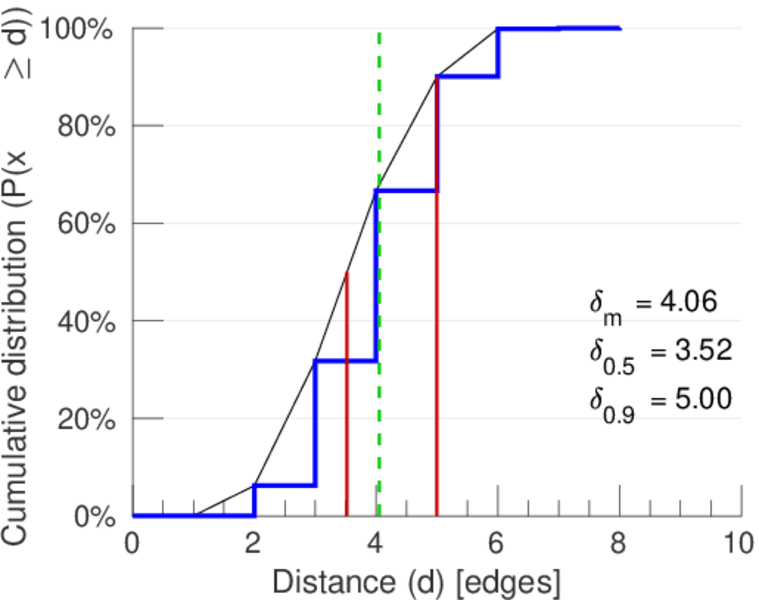
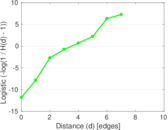
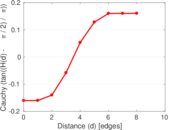
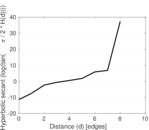
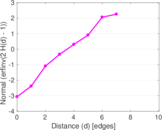
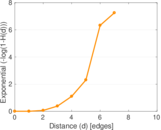
| Diameter | δ = | 10
|
| 50-Percentile effective diameter | δ0.5 = | 3.522 45
|
| 90-Percentile effective diameter | δ0.9 = | 4.998 47
|
| Median distance | δM = | 4
|
| Mean distance | δm = | 4.055 34
|
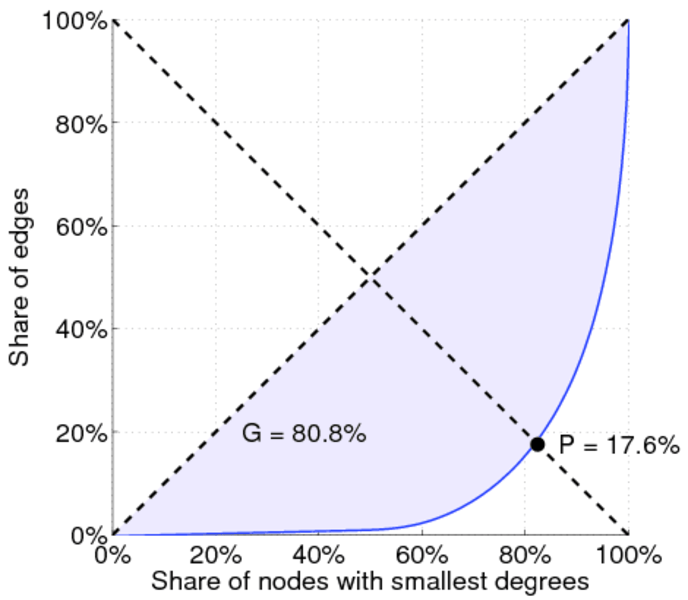
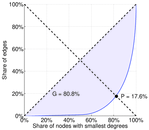
| Gini coefficient | G = | 0.794 974
|
| Balanced inequality ratio | P = | 0.182 434
|
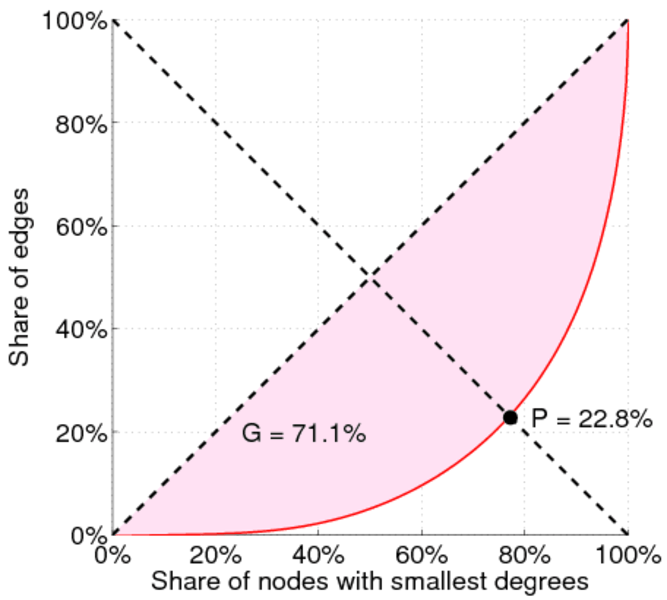
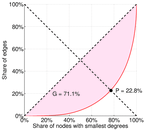
| Left balanced inequality ratio | P1 = | 0.227 735
|
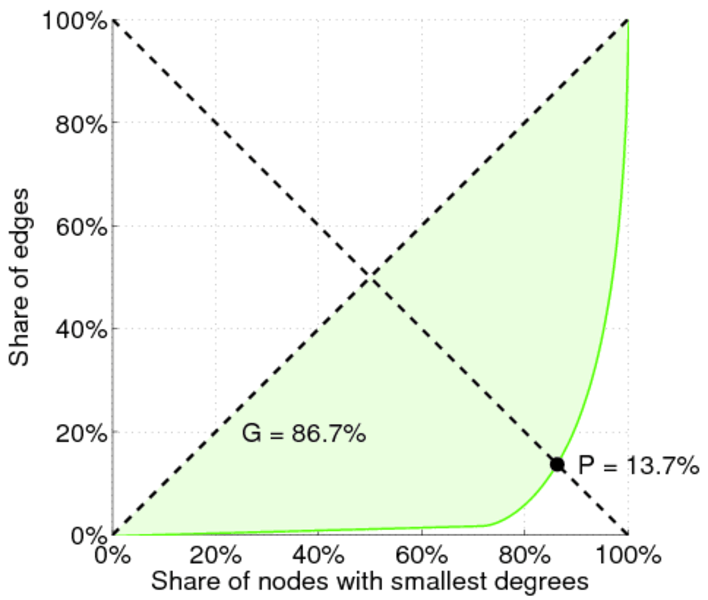
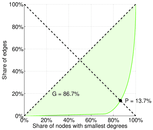
| Right balanced inequality ratio | P2 = | 0.136 828
|
| Relative edge distribution entropy | Her = | 0.875 374
|
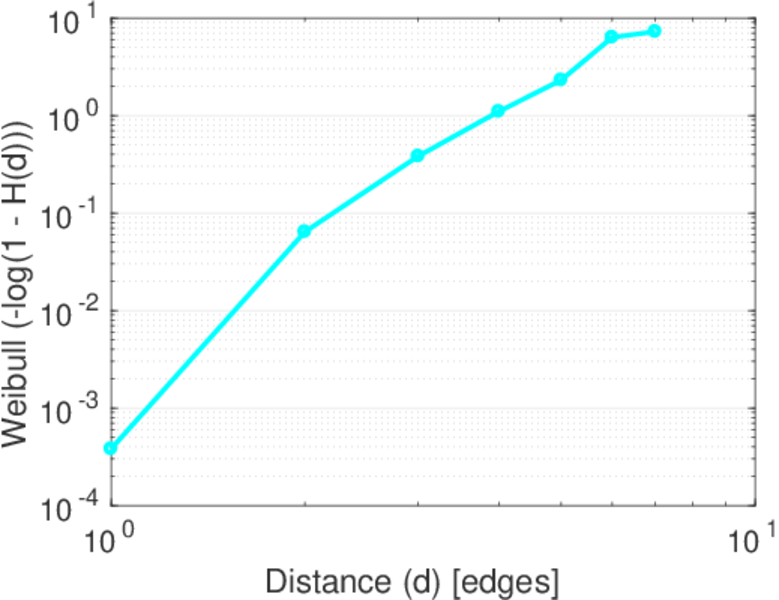
| Power law exponent | γ = | 1.561 25
|
| Tail power law exponent | γt = | 2.141 00
|
| Degree assortativity | ρ = | −0.096 367 3
|
| Degree assortativity p-value | pρ = | 0.000 00
|
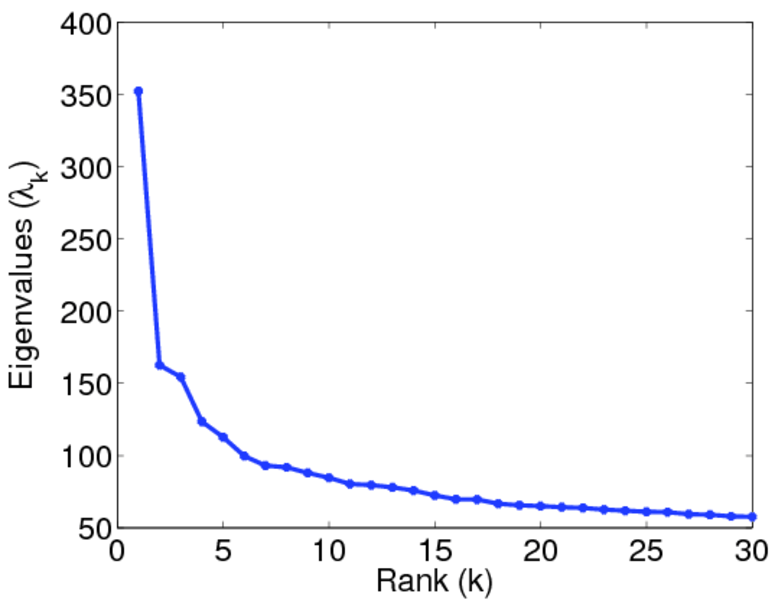
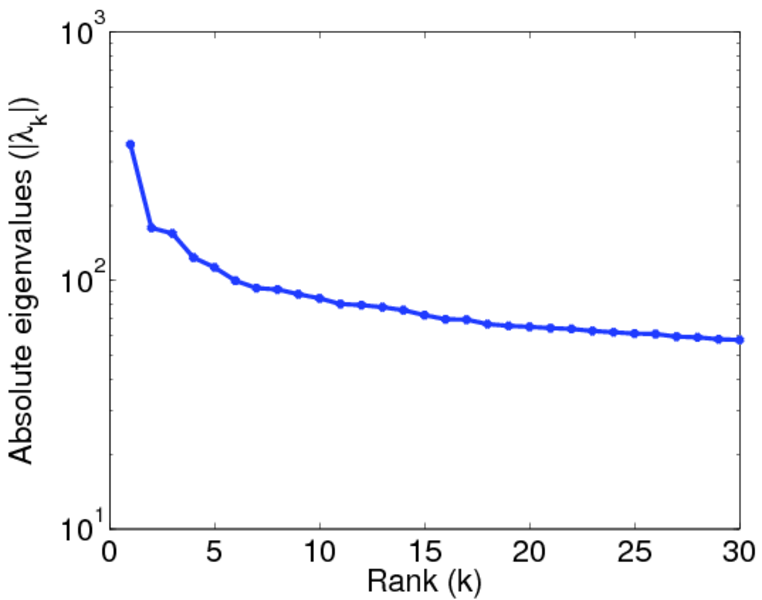
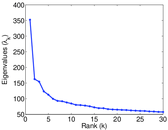
| Spectral norm | α = | 352.306
|
| Algebraic connectivity | a = | 0.195 693
|
| Controllability | C = | 23,400
|
| Relative controllability | Cr = | 0.153 853
|
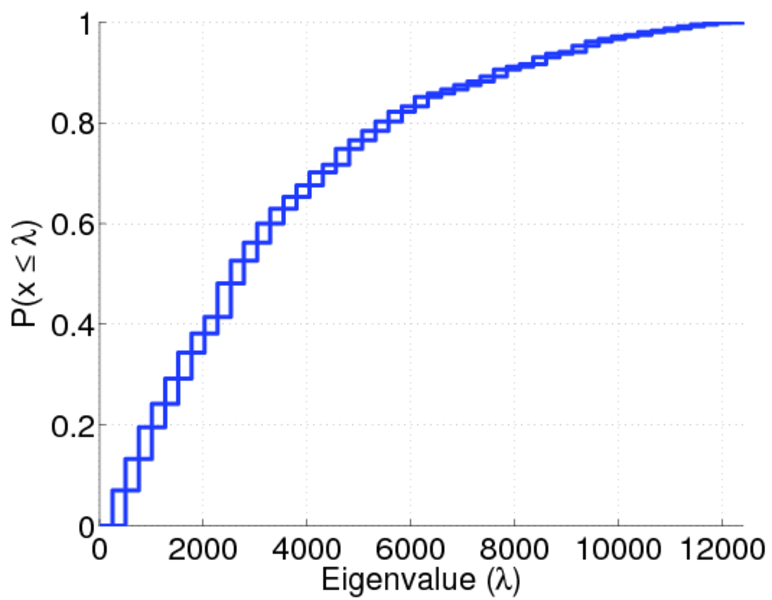
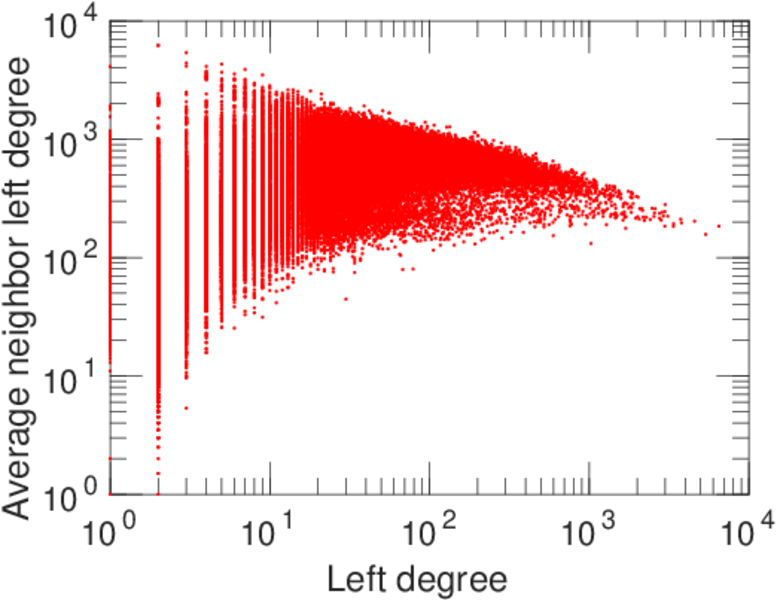
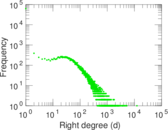
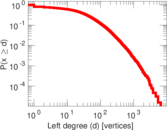
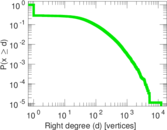
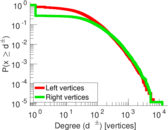
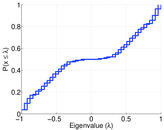
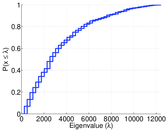
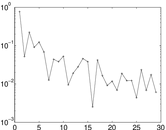
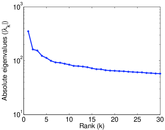
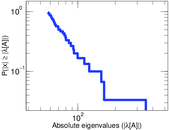
Plots


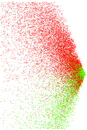
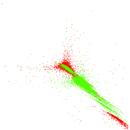


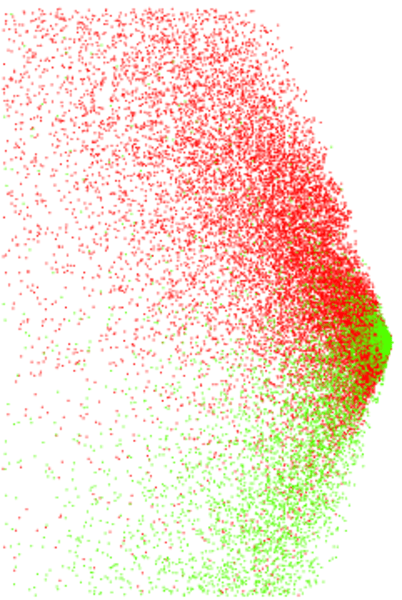
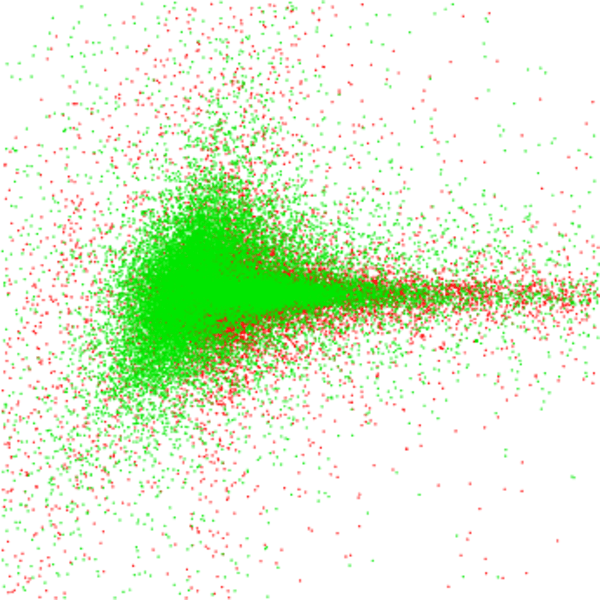
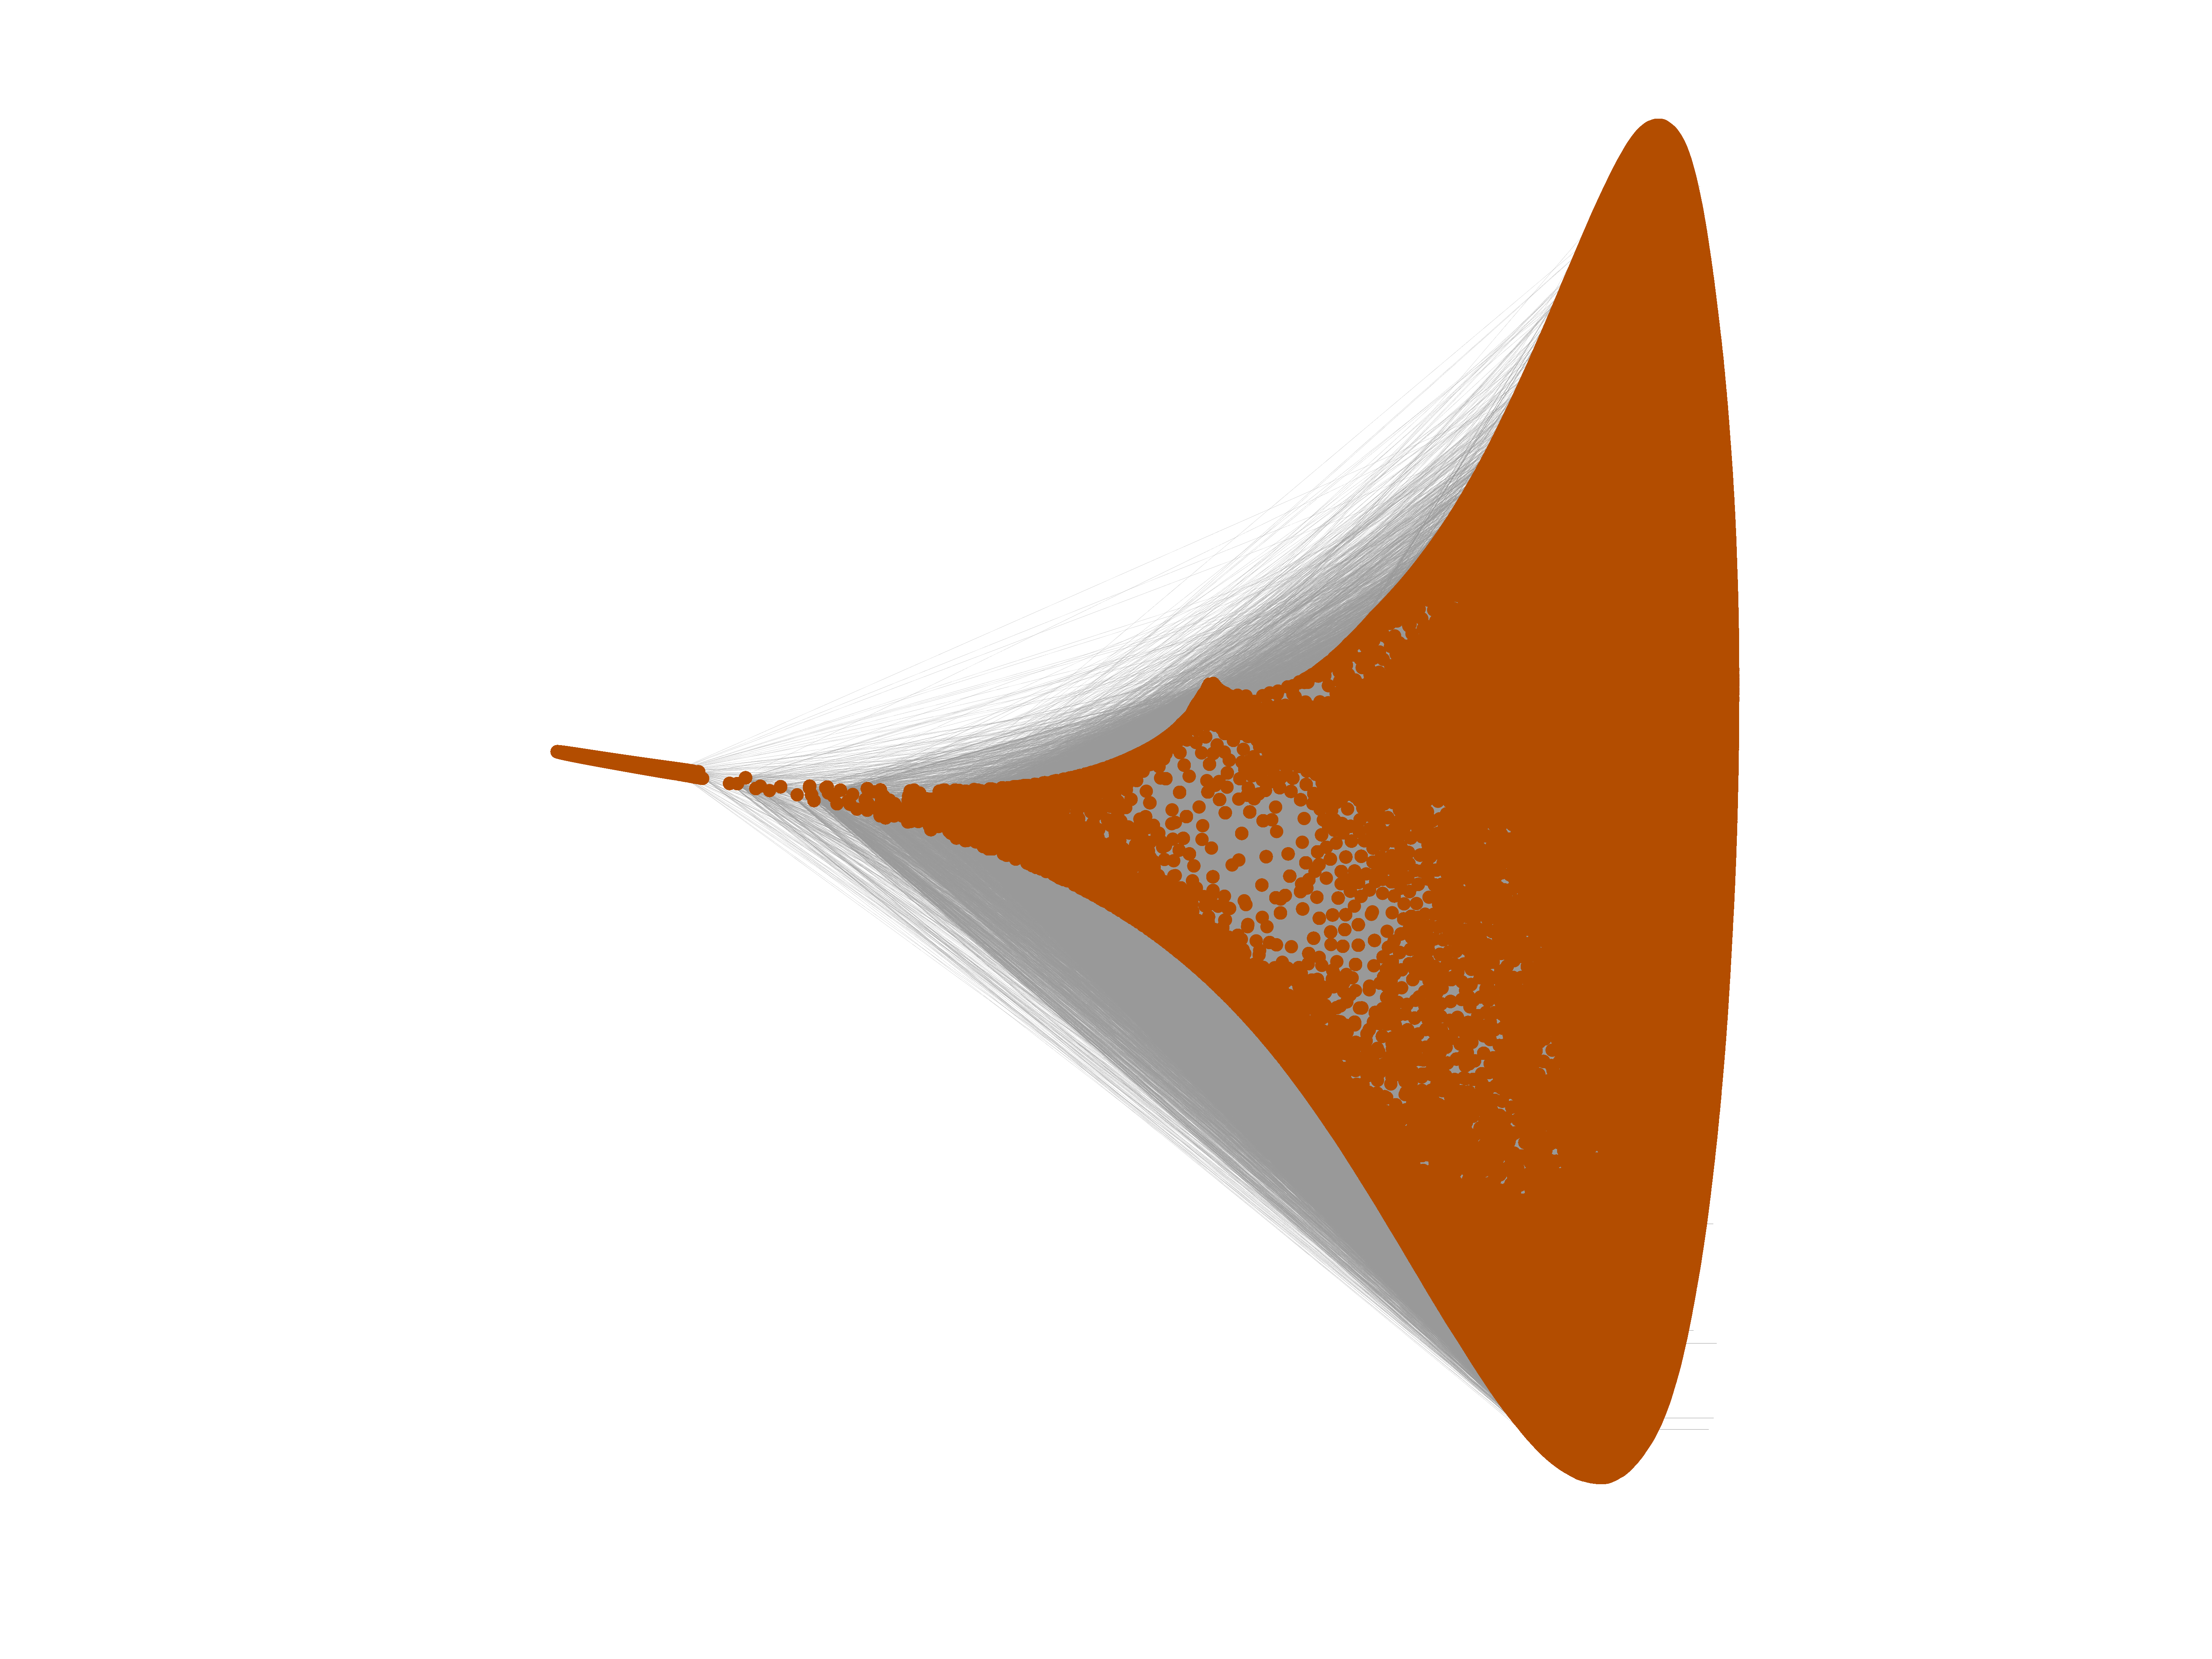
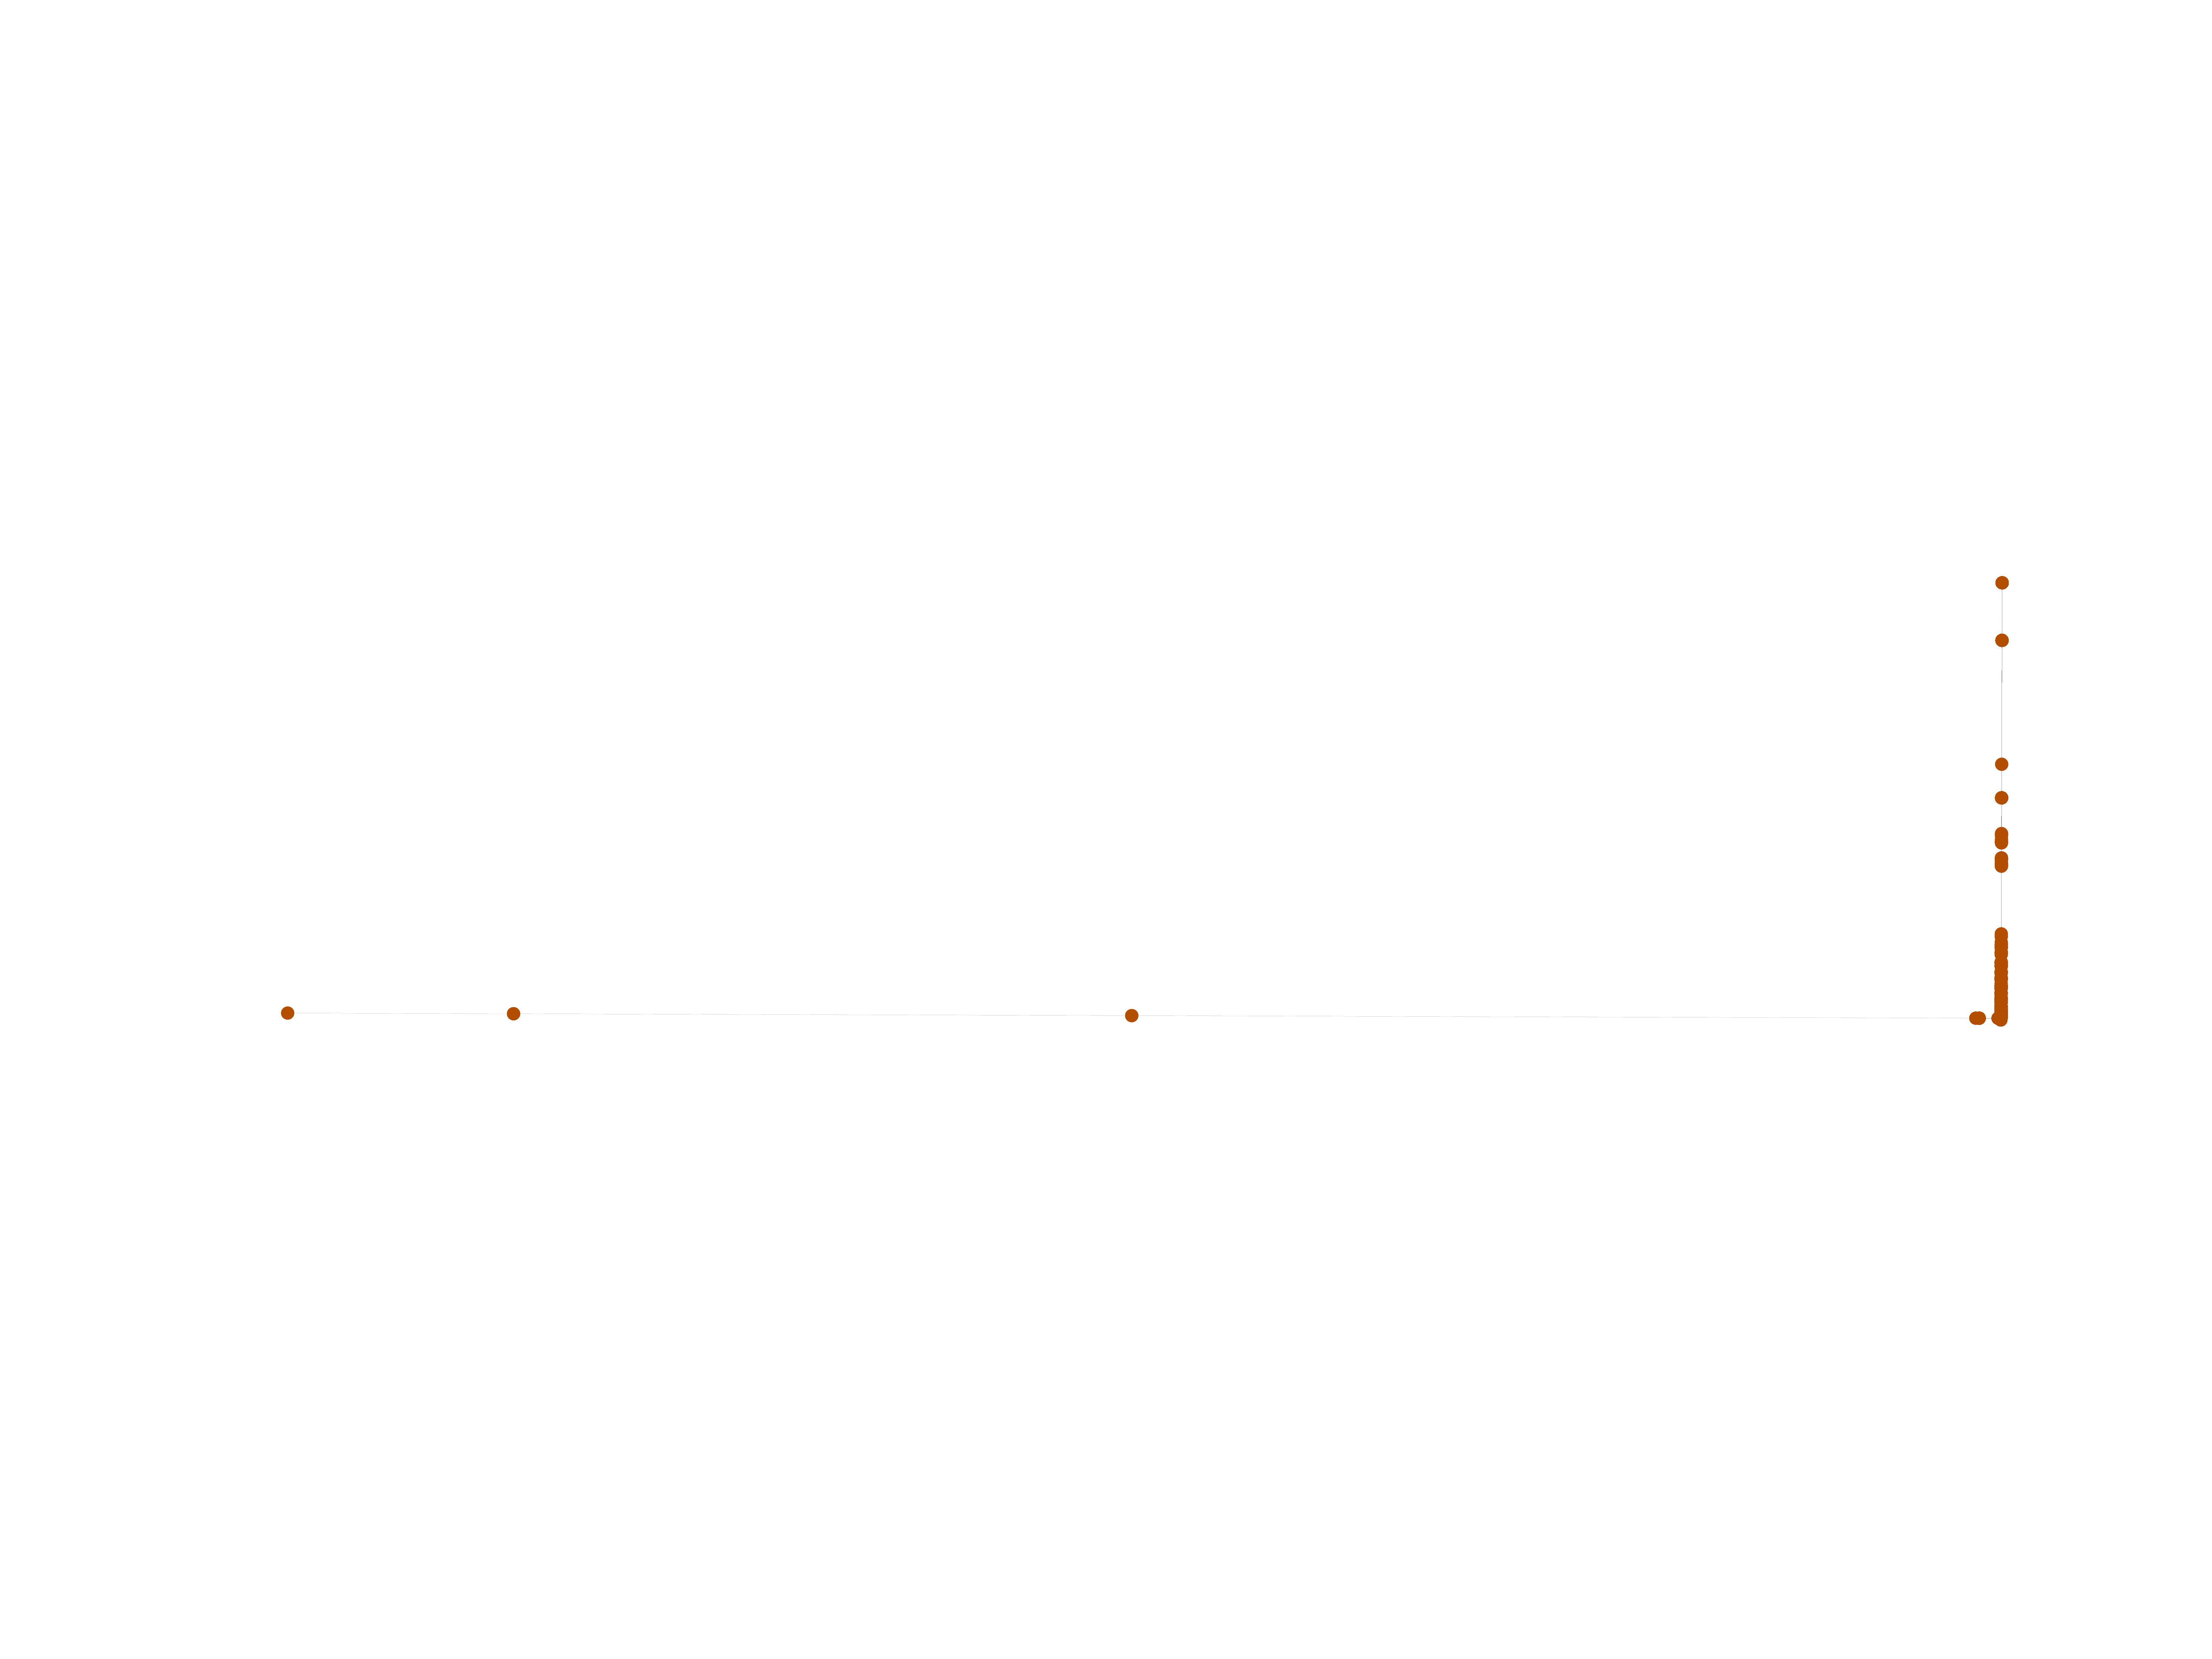
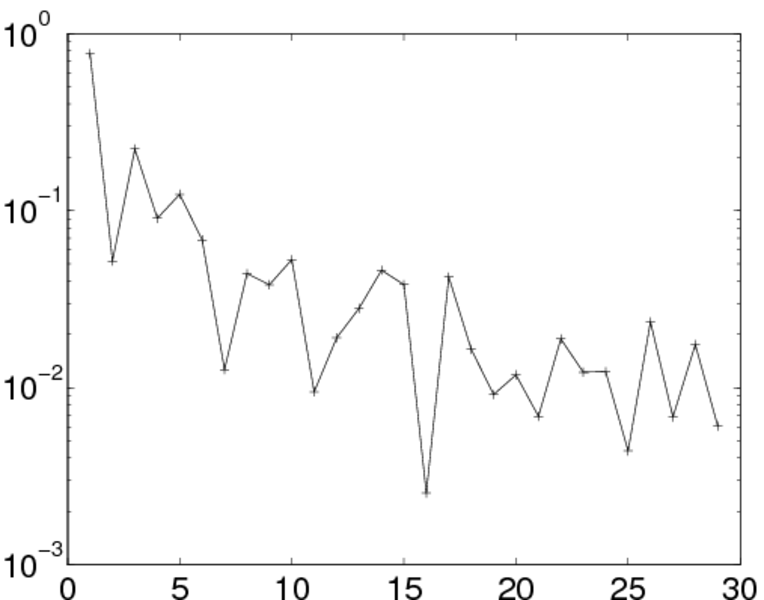
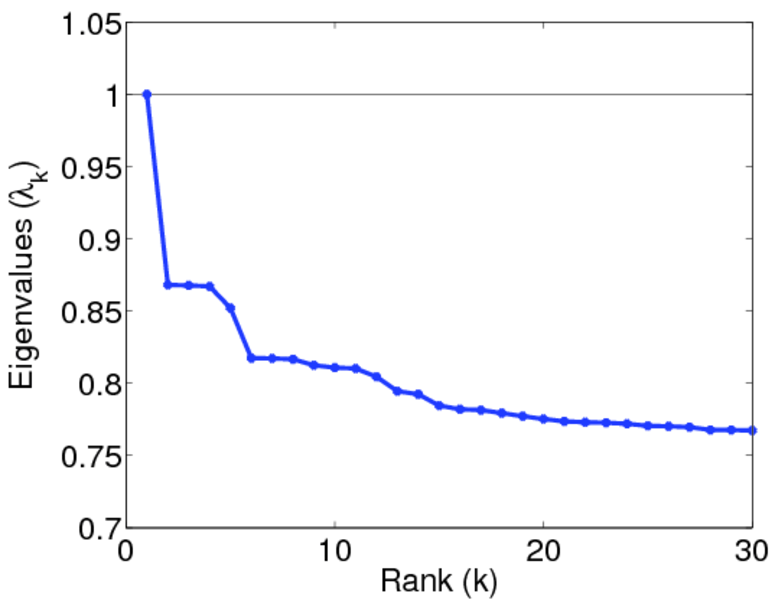
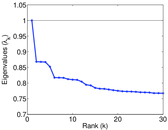
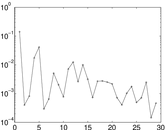
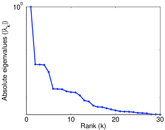
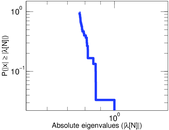
Matrix decompositions plots
Downloads
References
|
[1]
|
Jérôme Kunegis.
KONECT – The Koblenz Network Collection.
In Proc. Int. Conf. on World Wide Web Companion, pages
1343–1350, 2013.
[ http ]
|
 KONECT ‣ Networks ‣
Buy Me a Coffee
KONECT ‣ Networks ‣
Buy Me a Coffee