American football

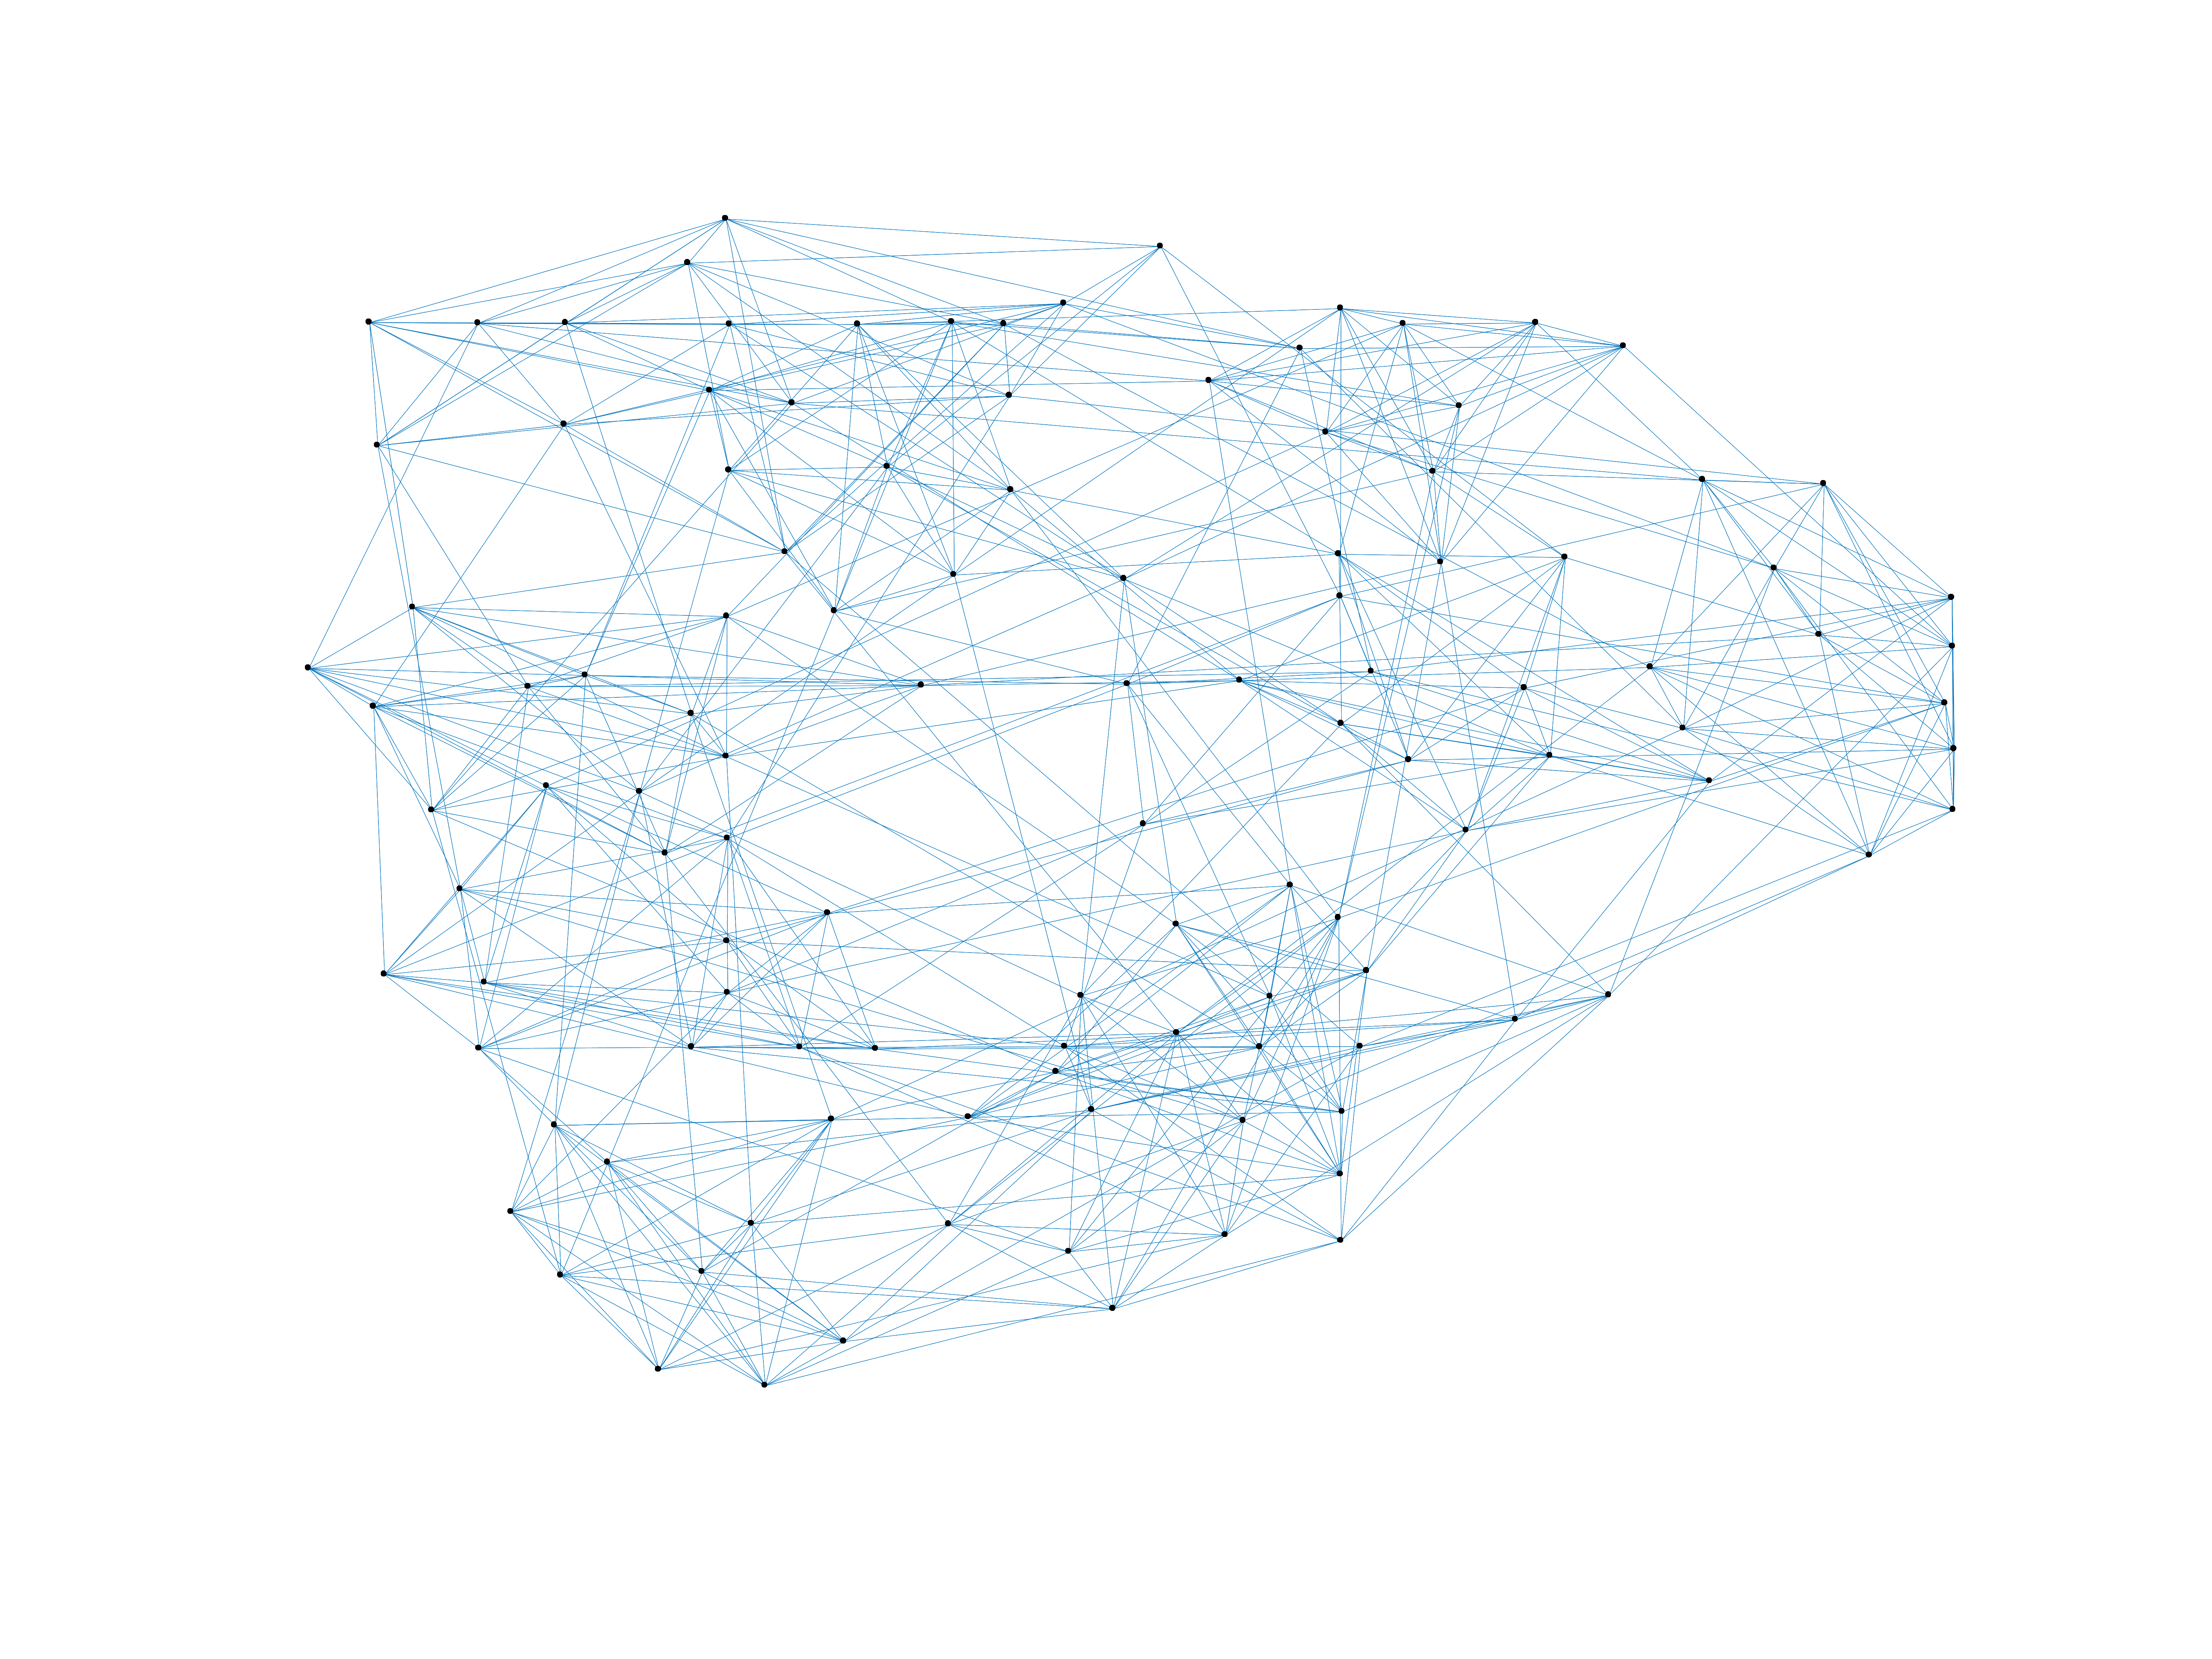
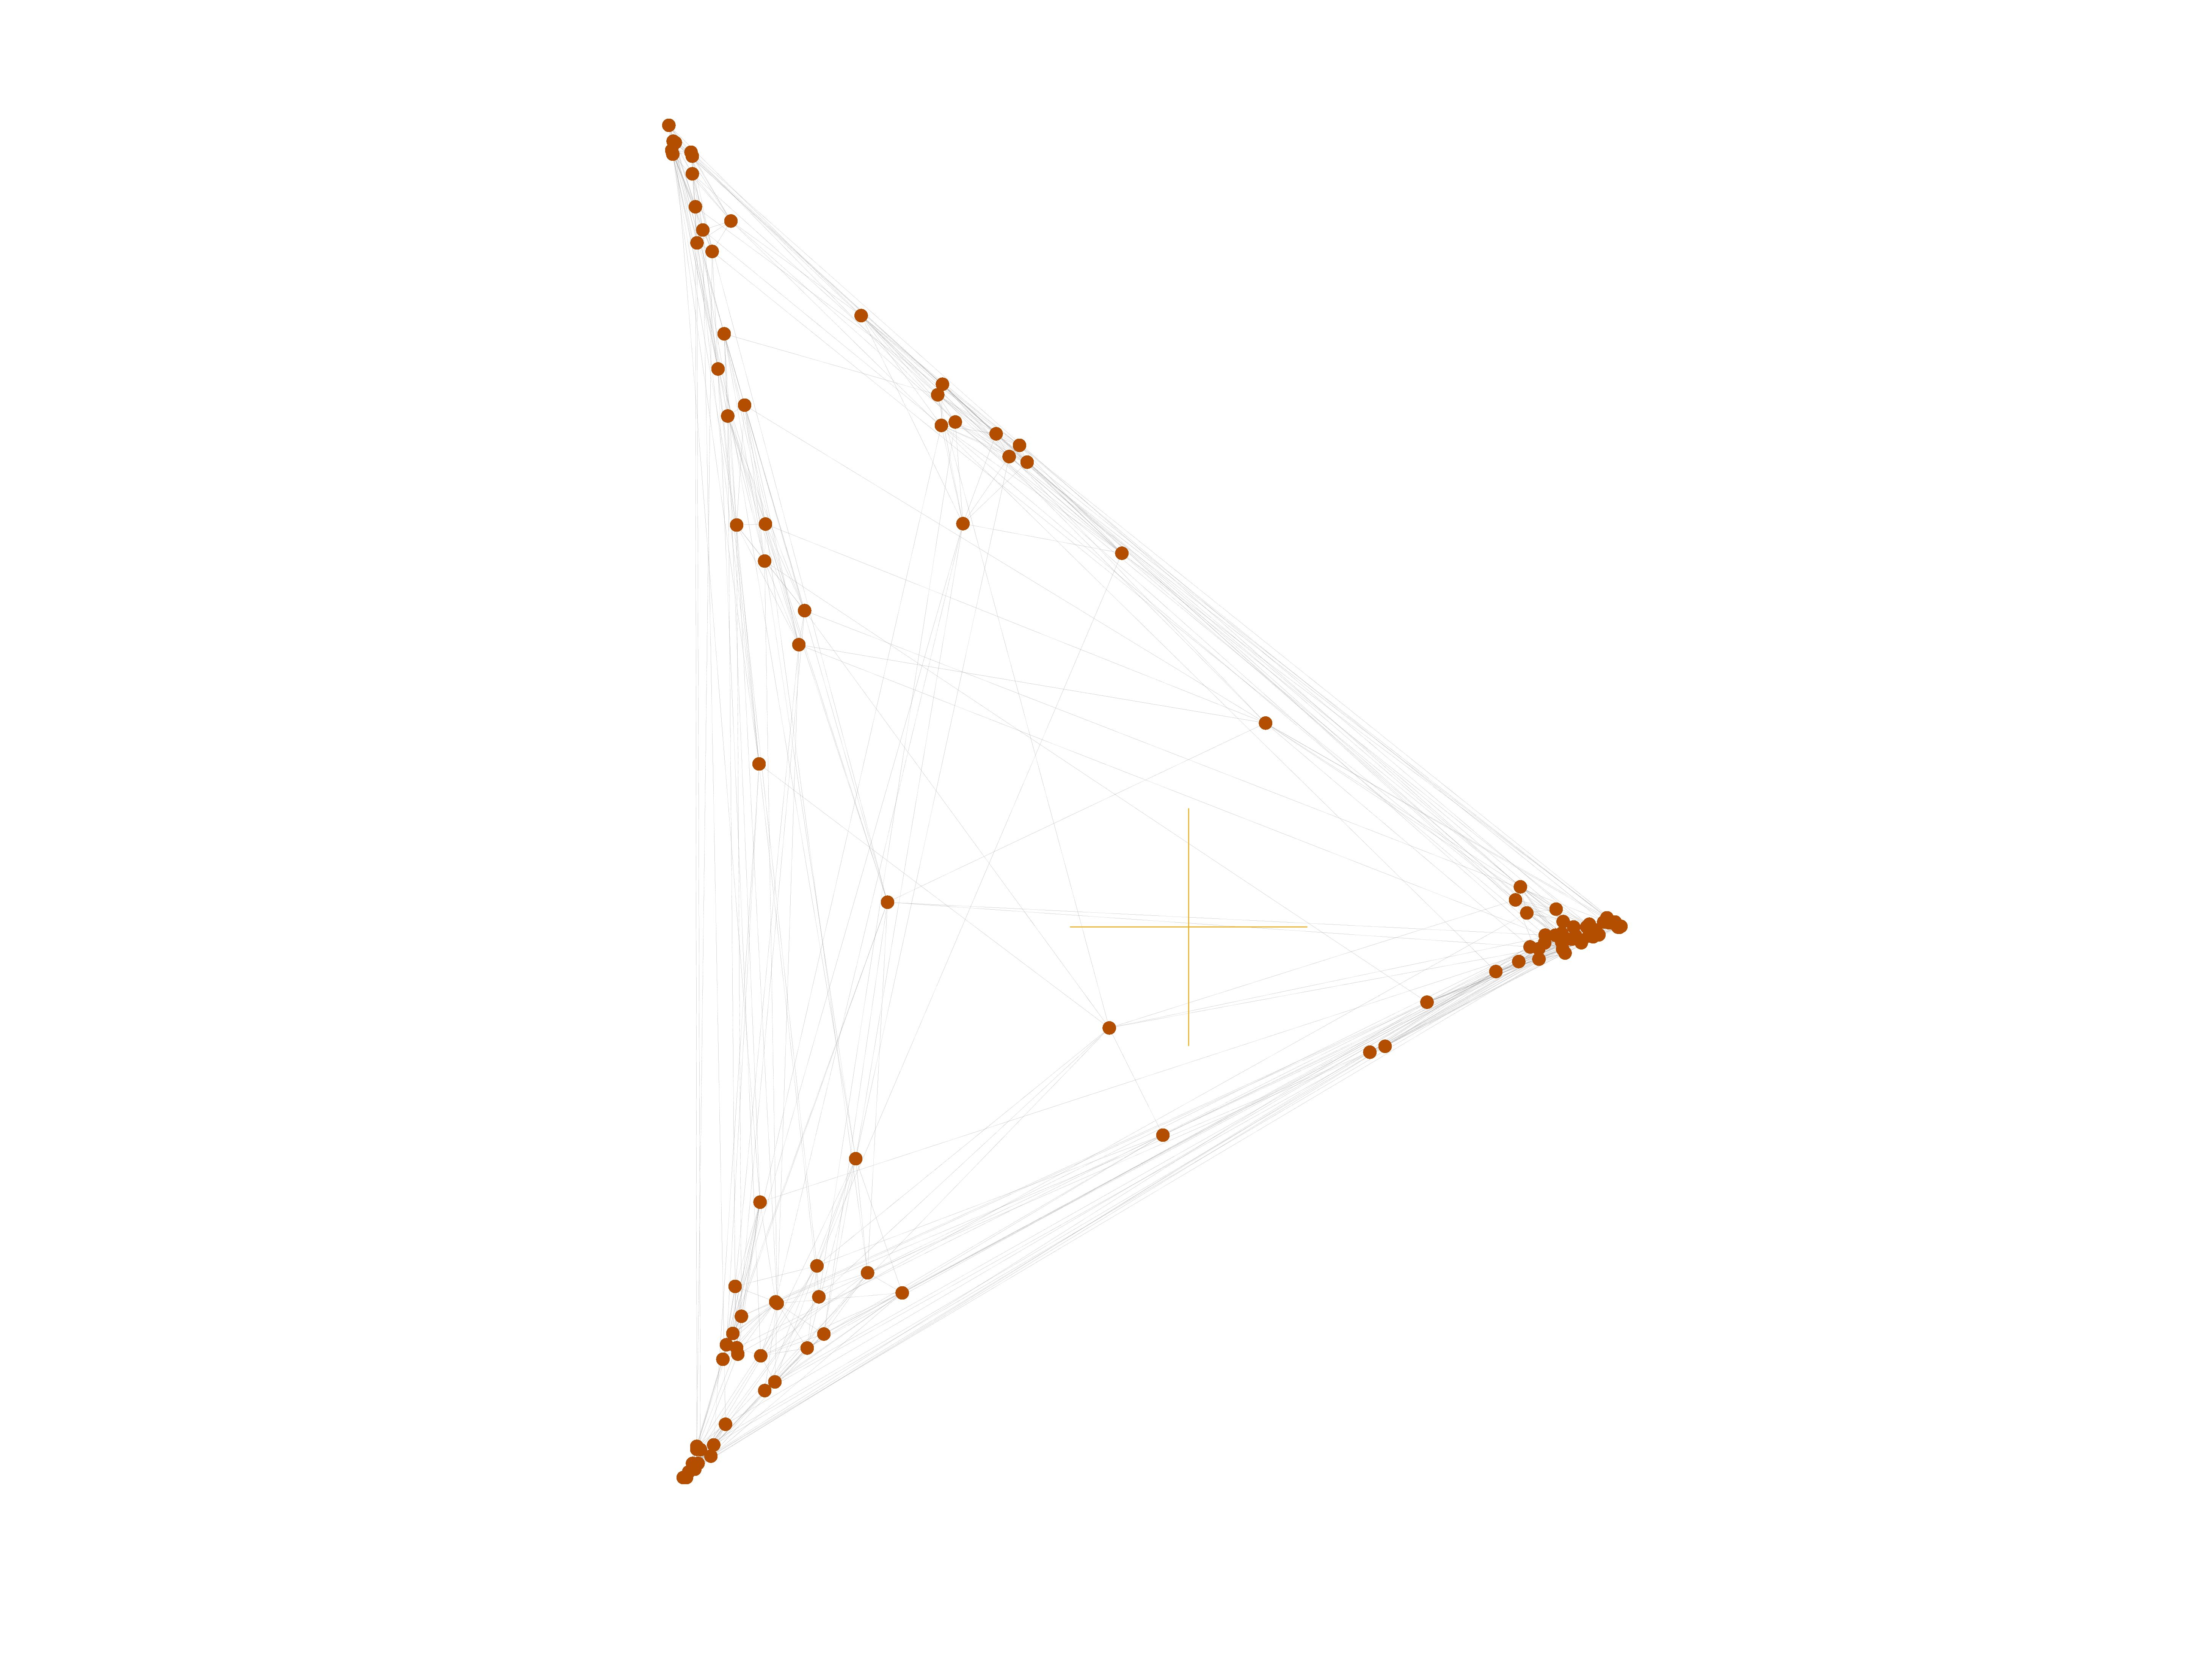
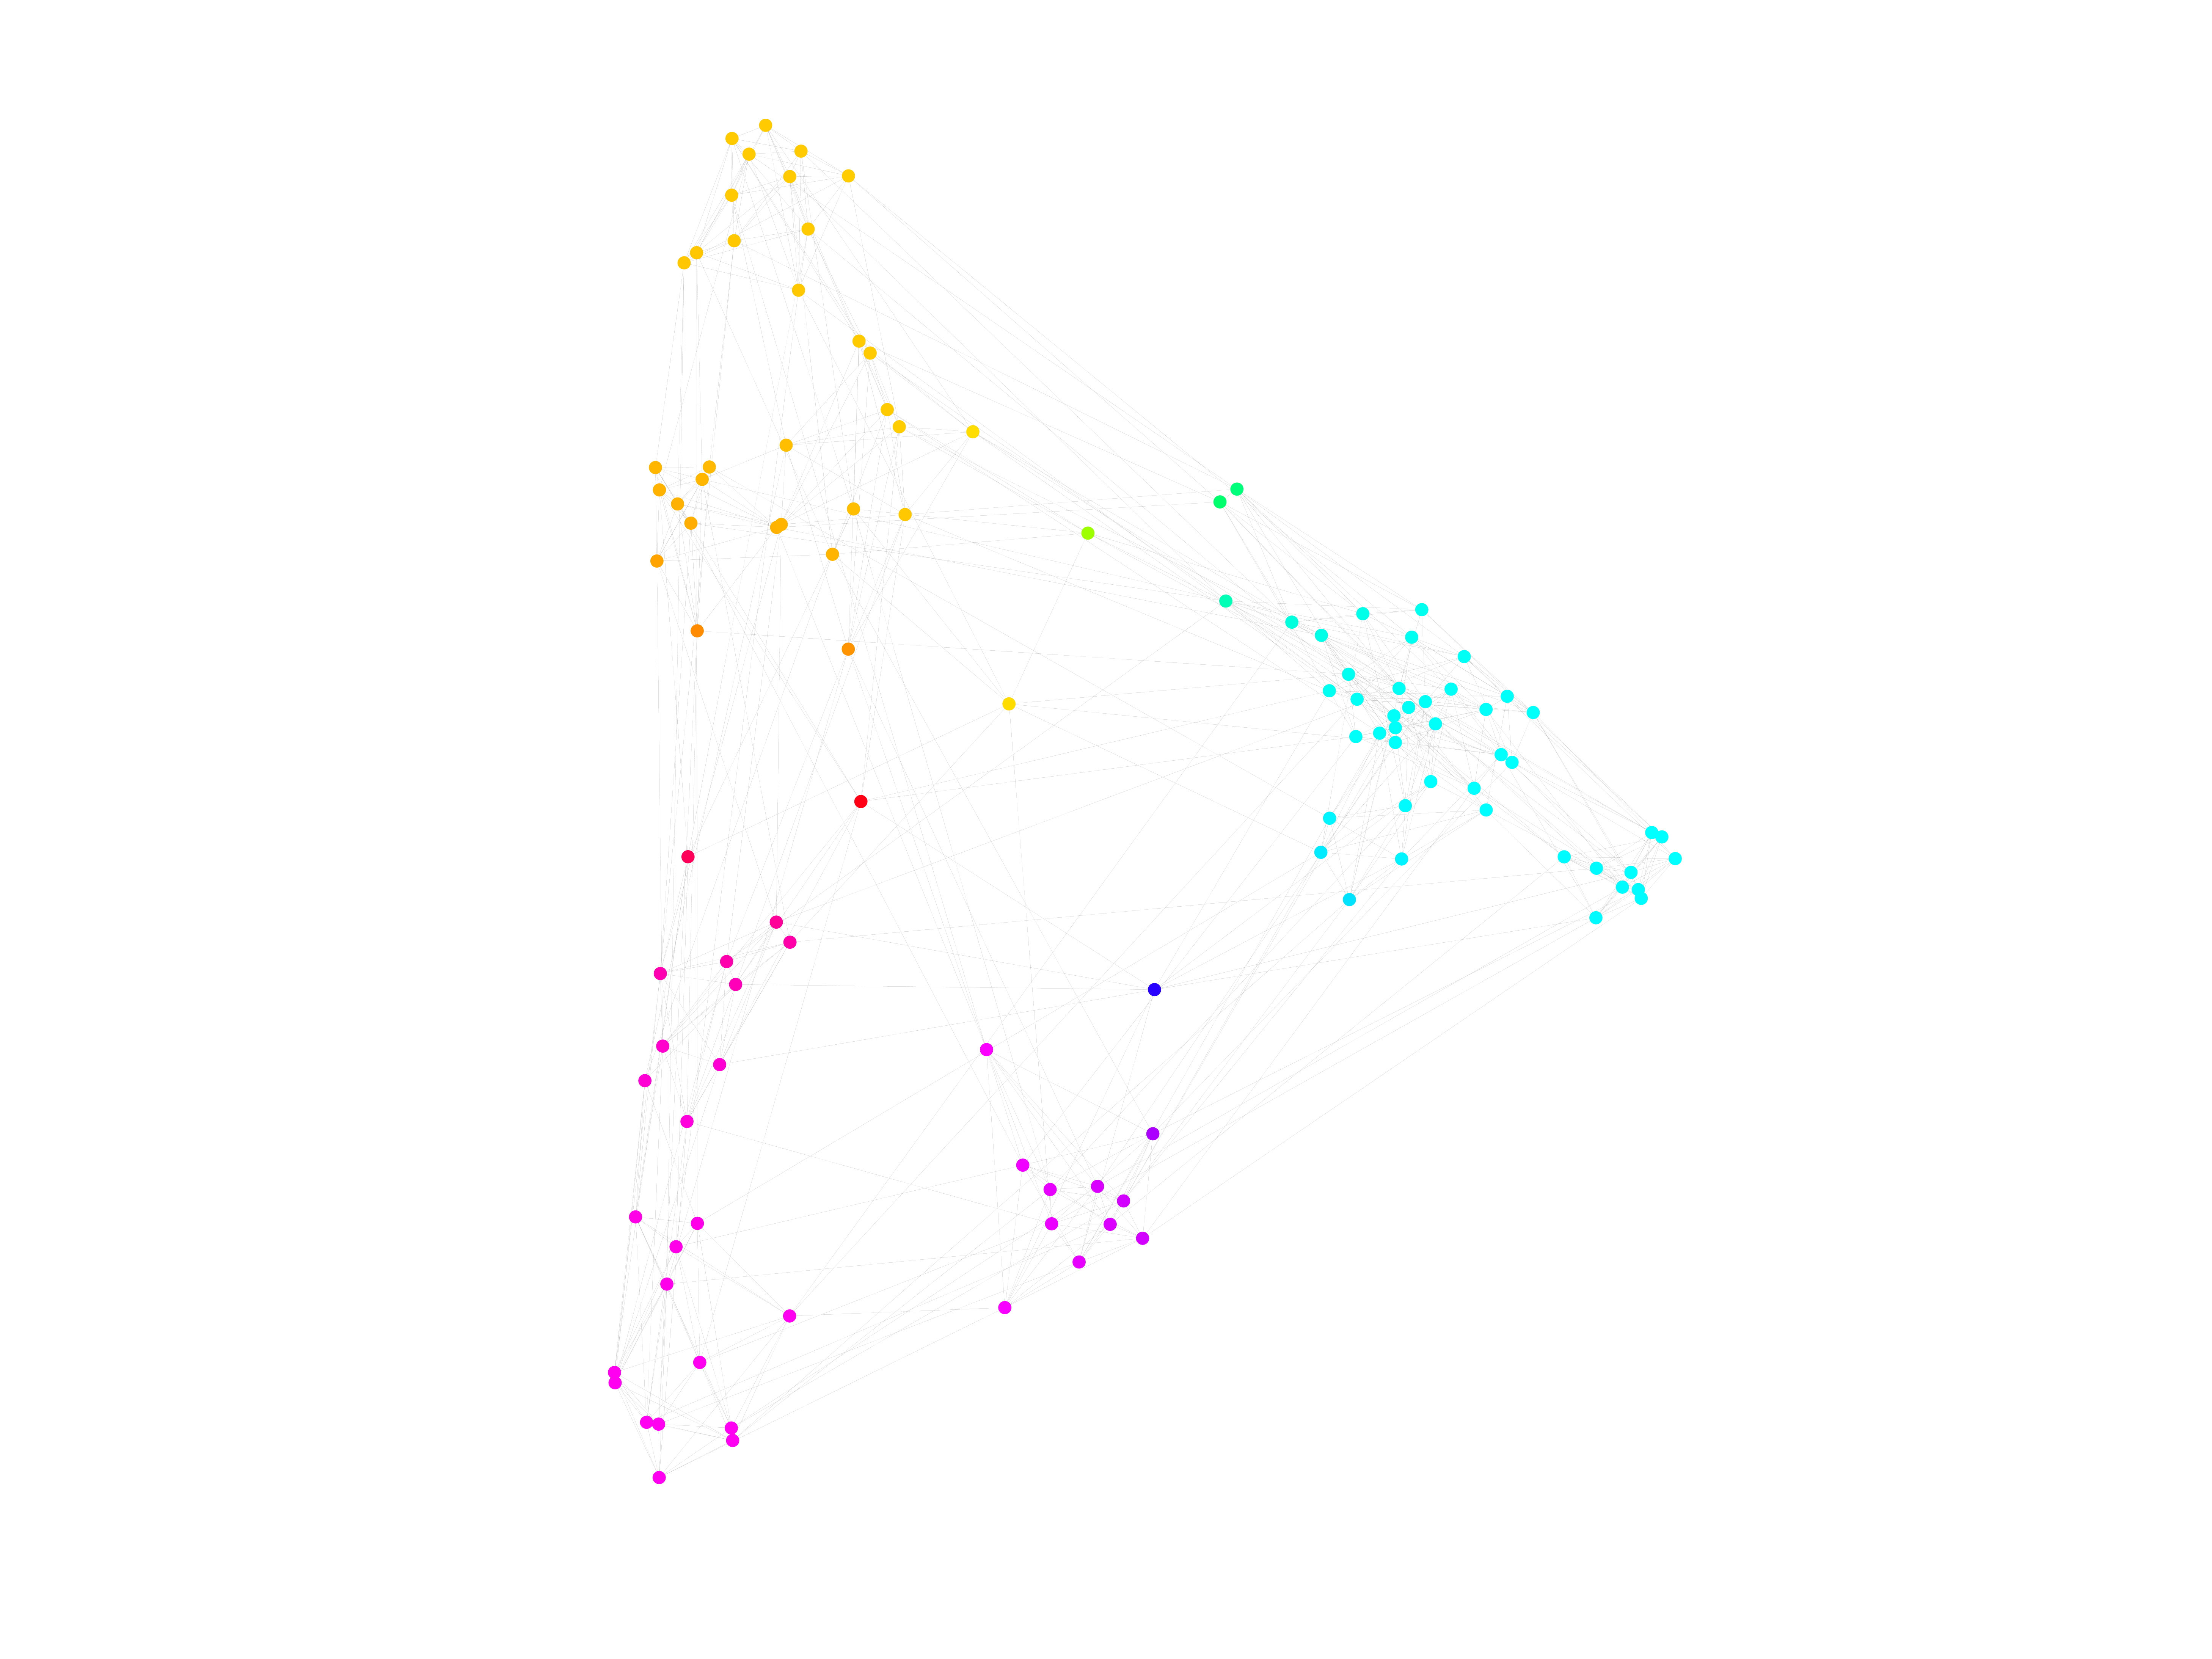
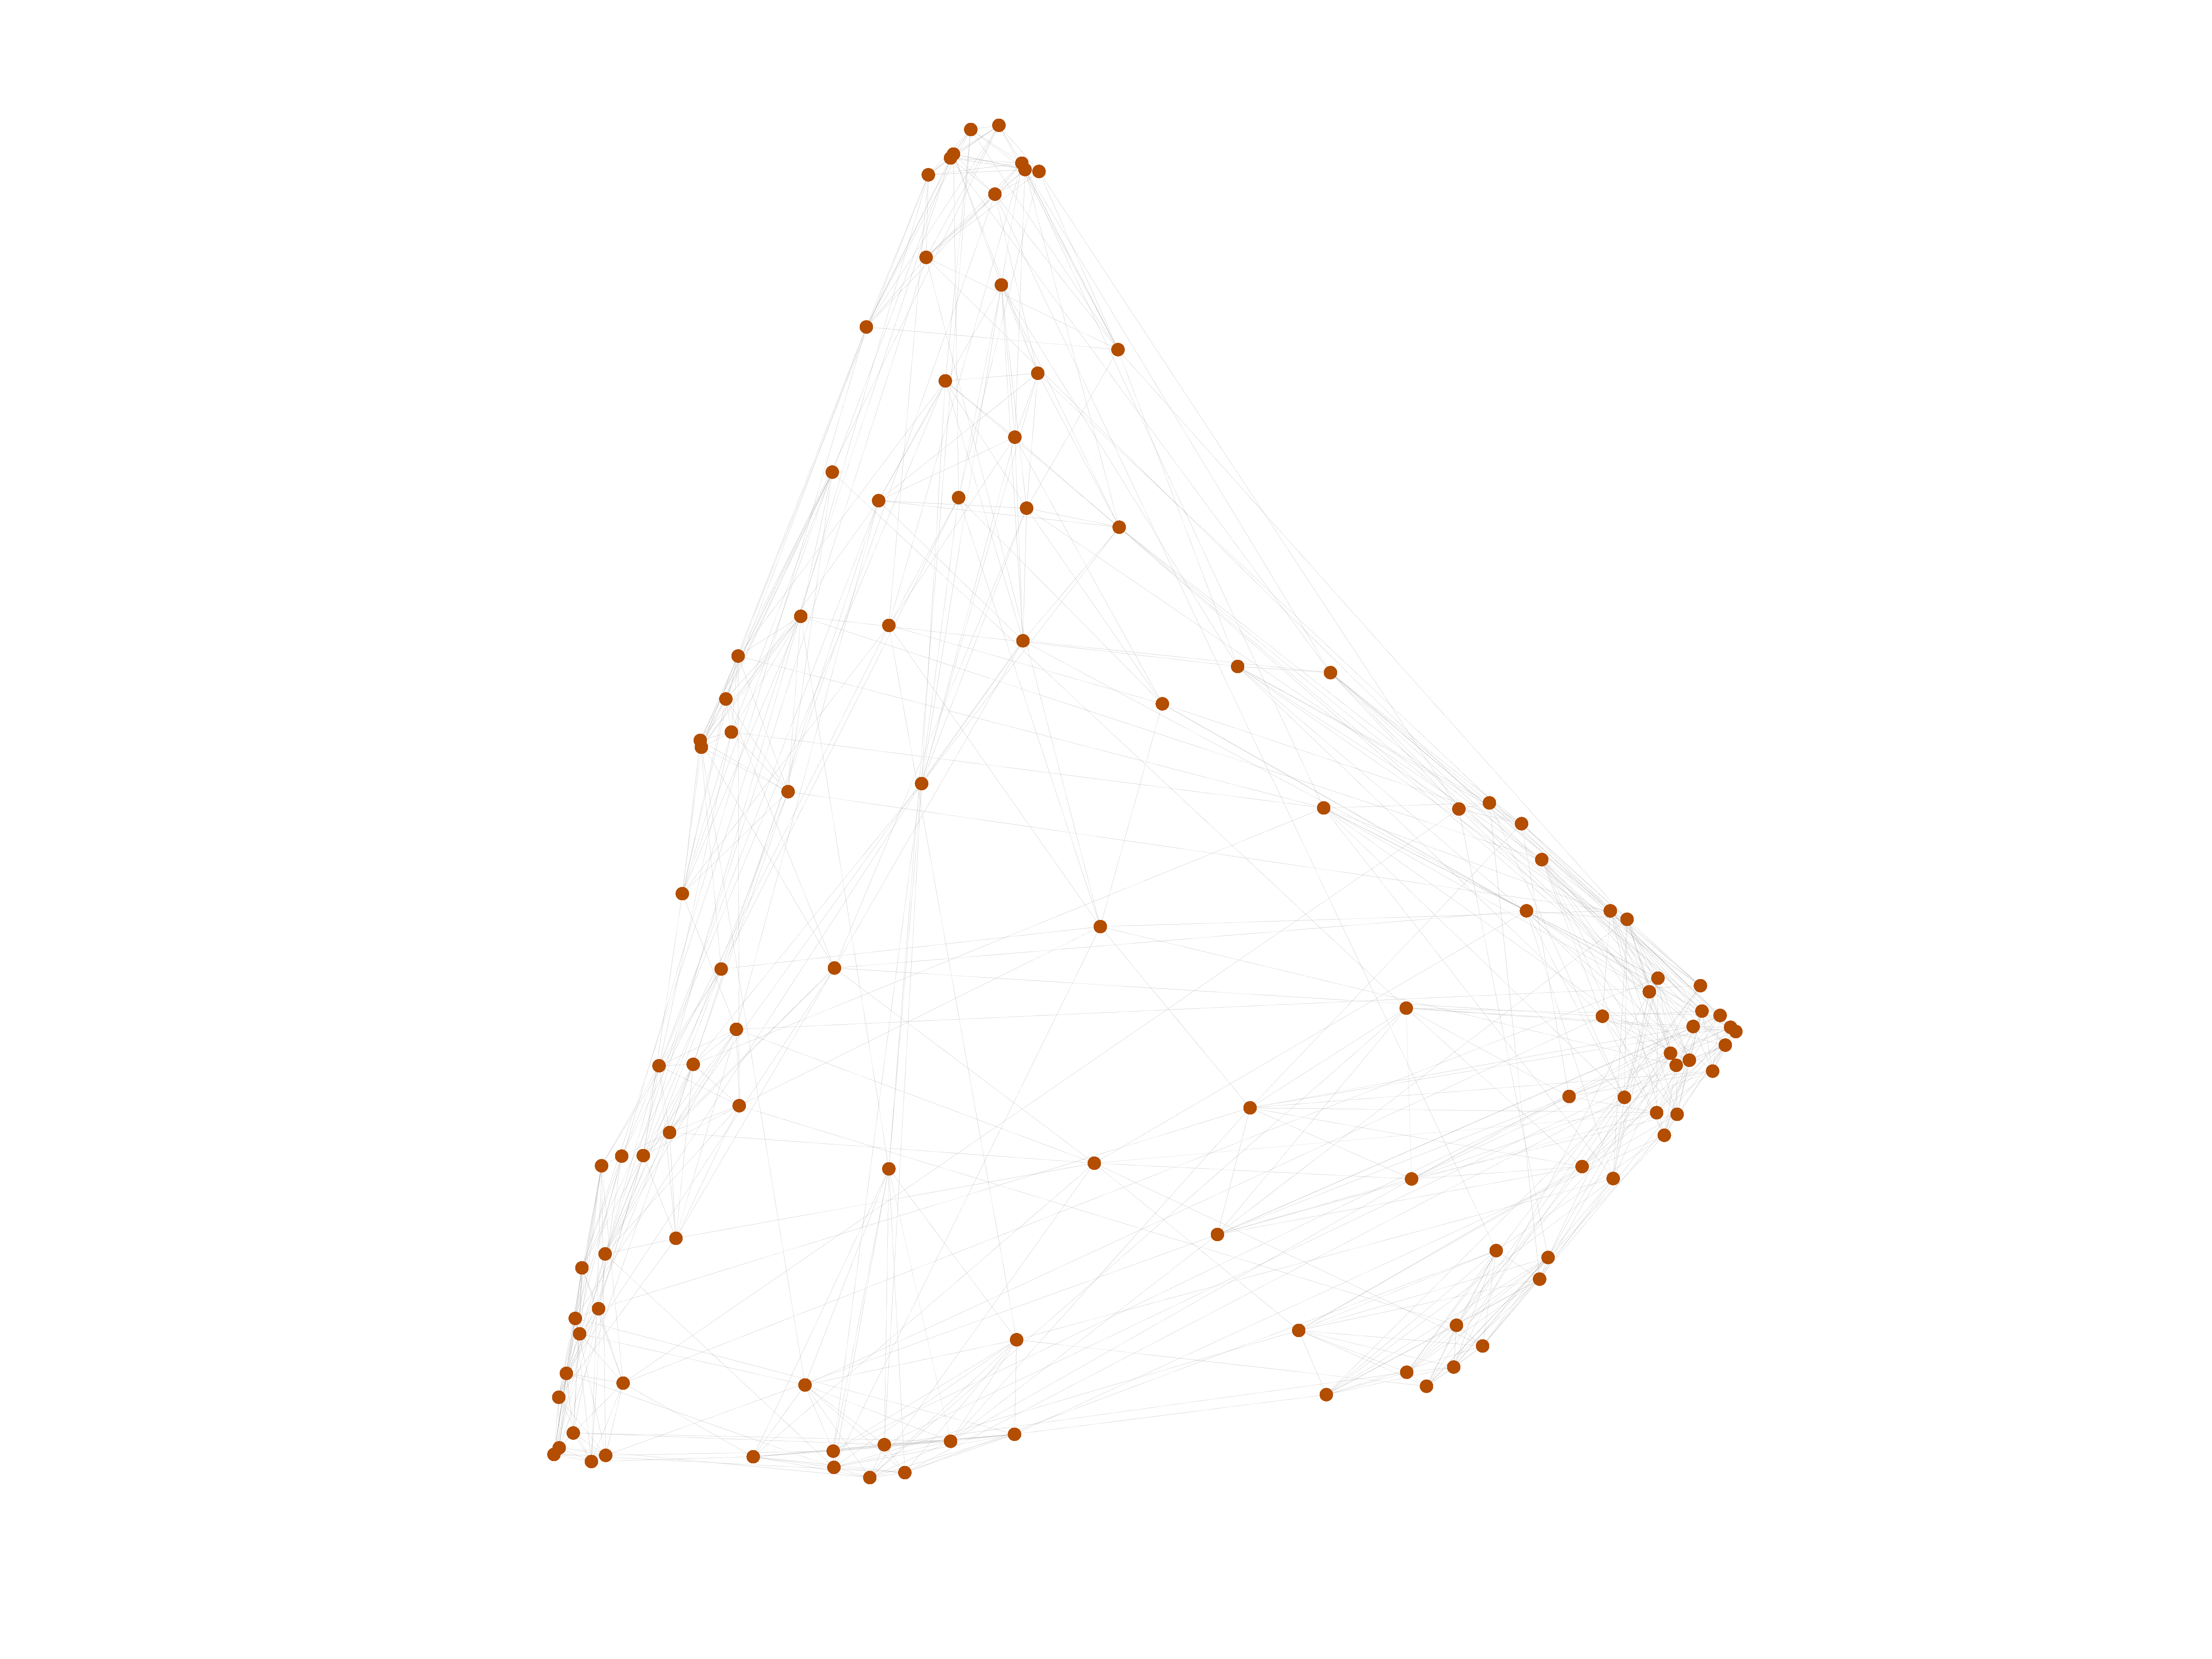
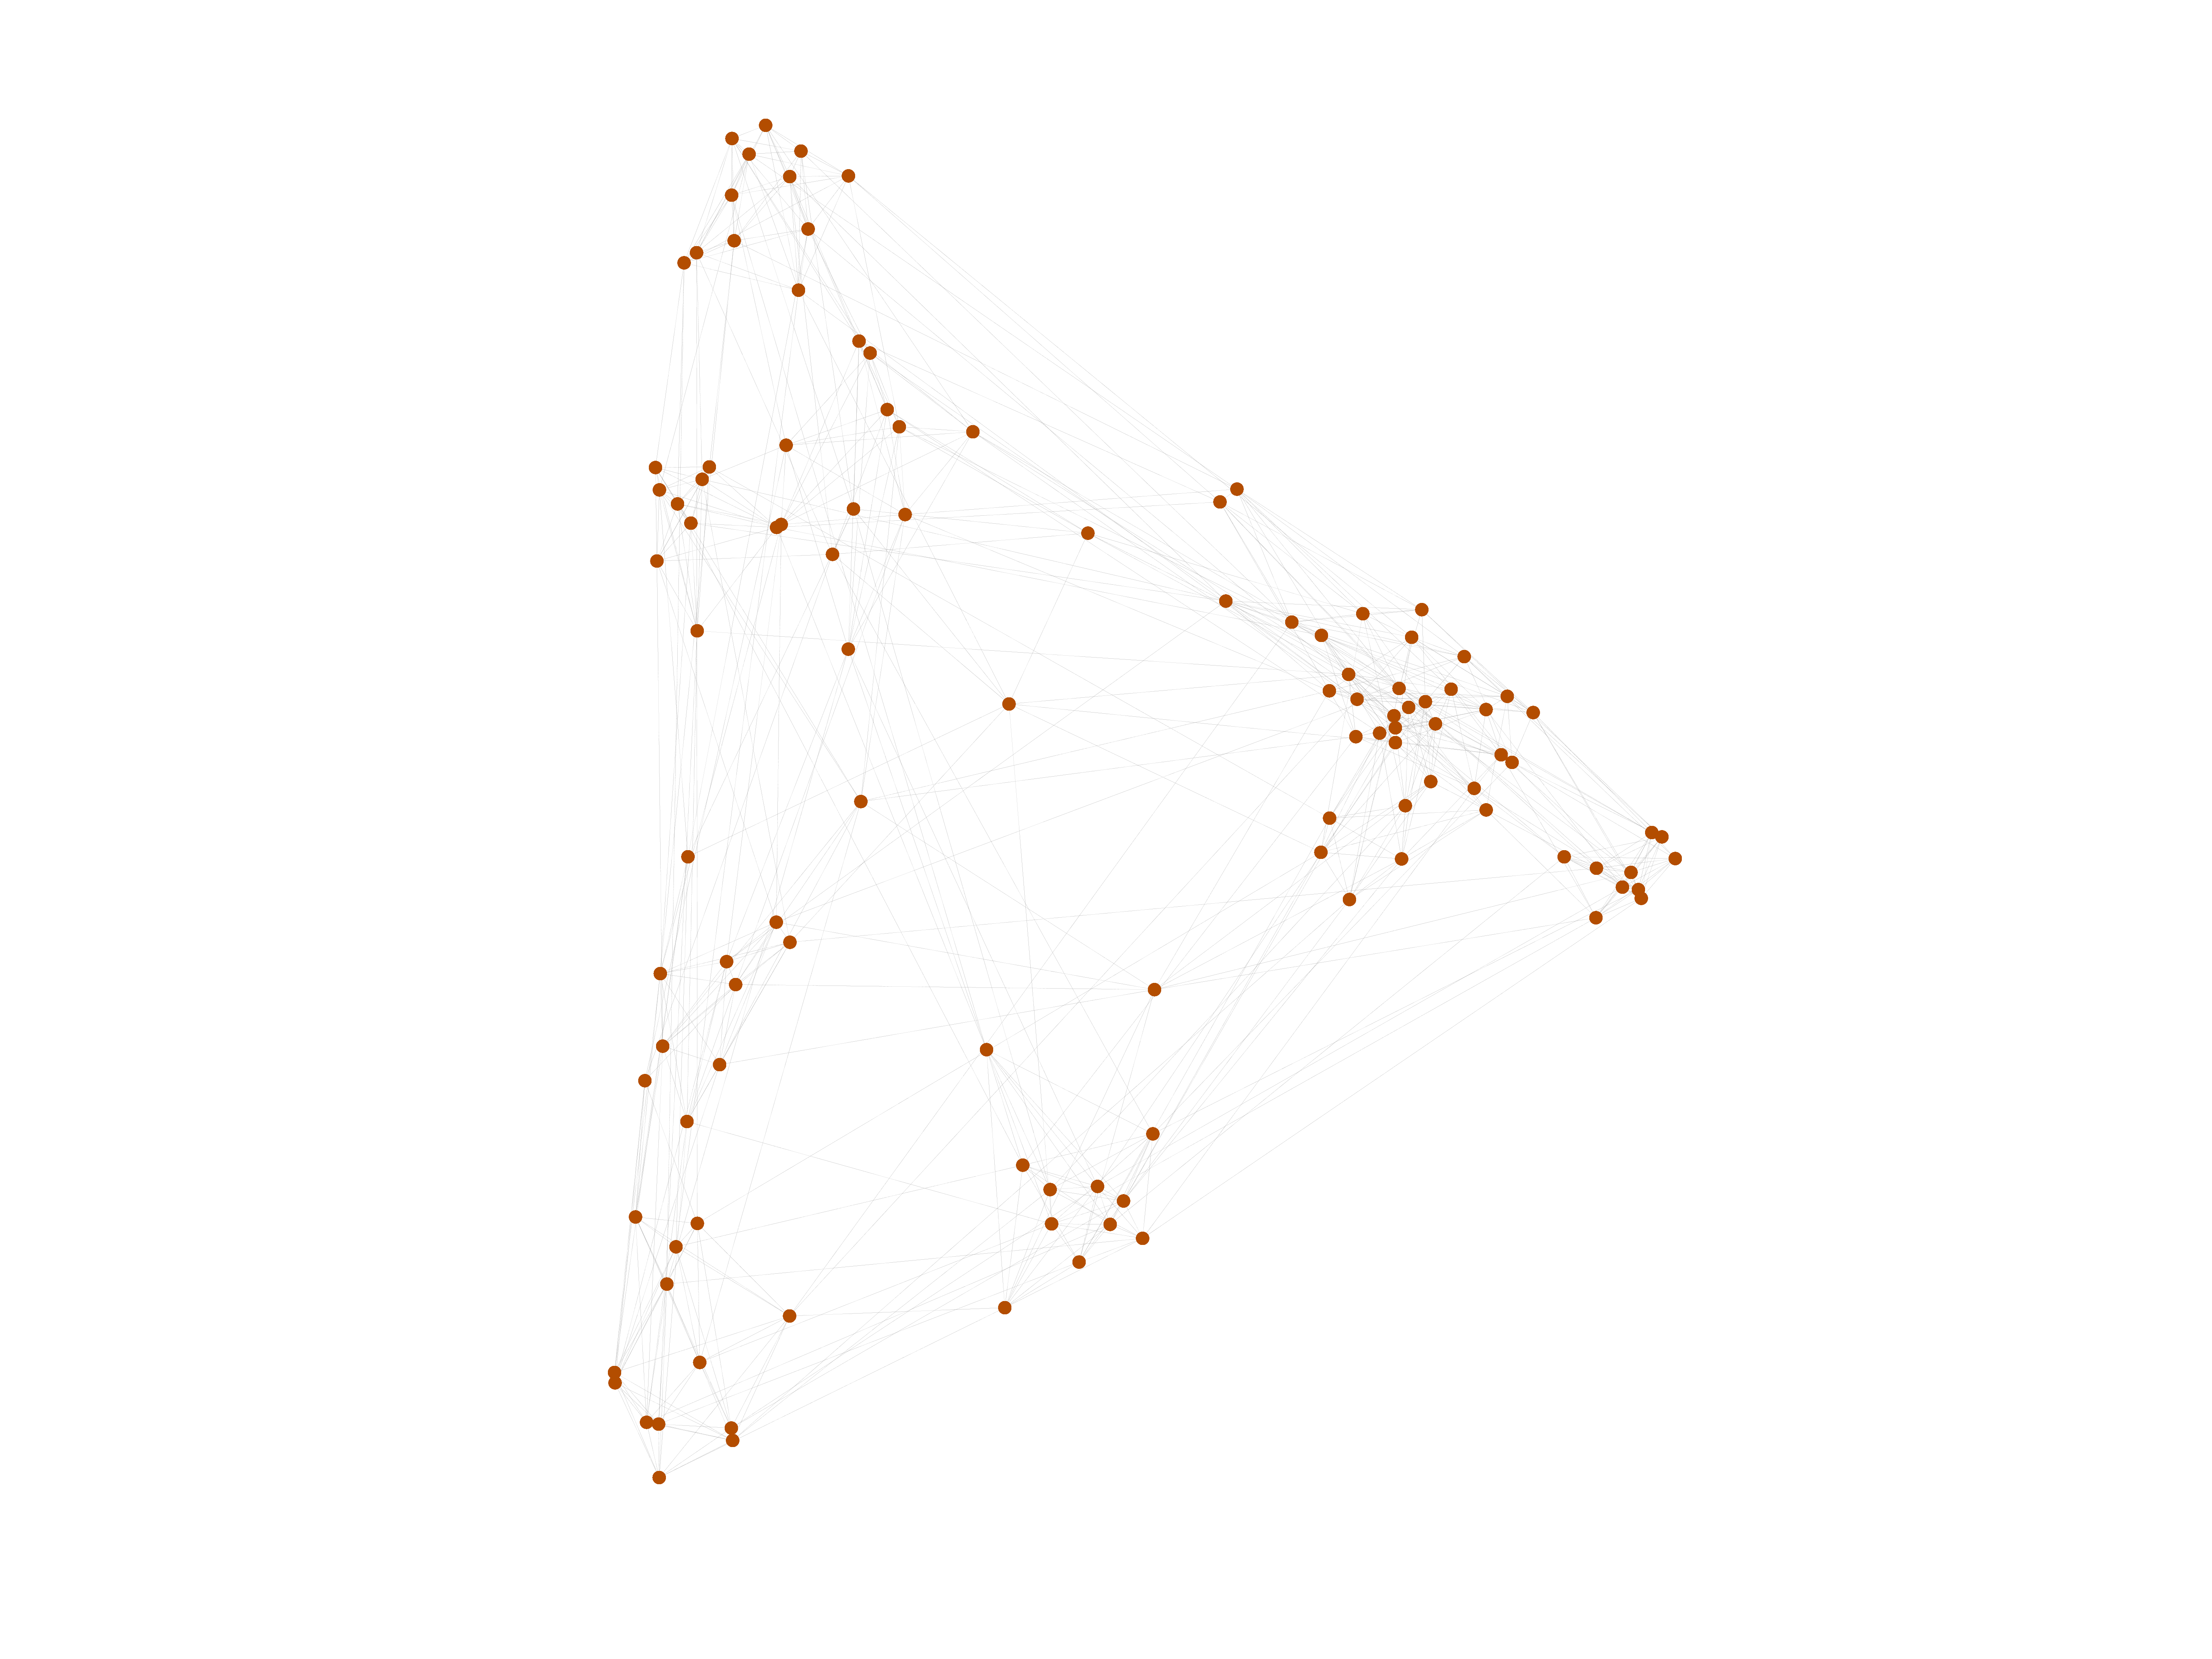
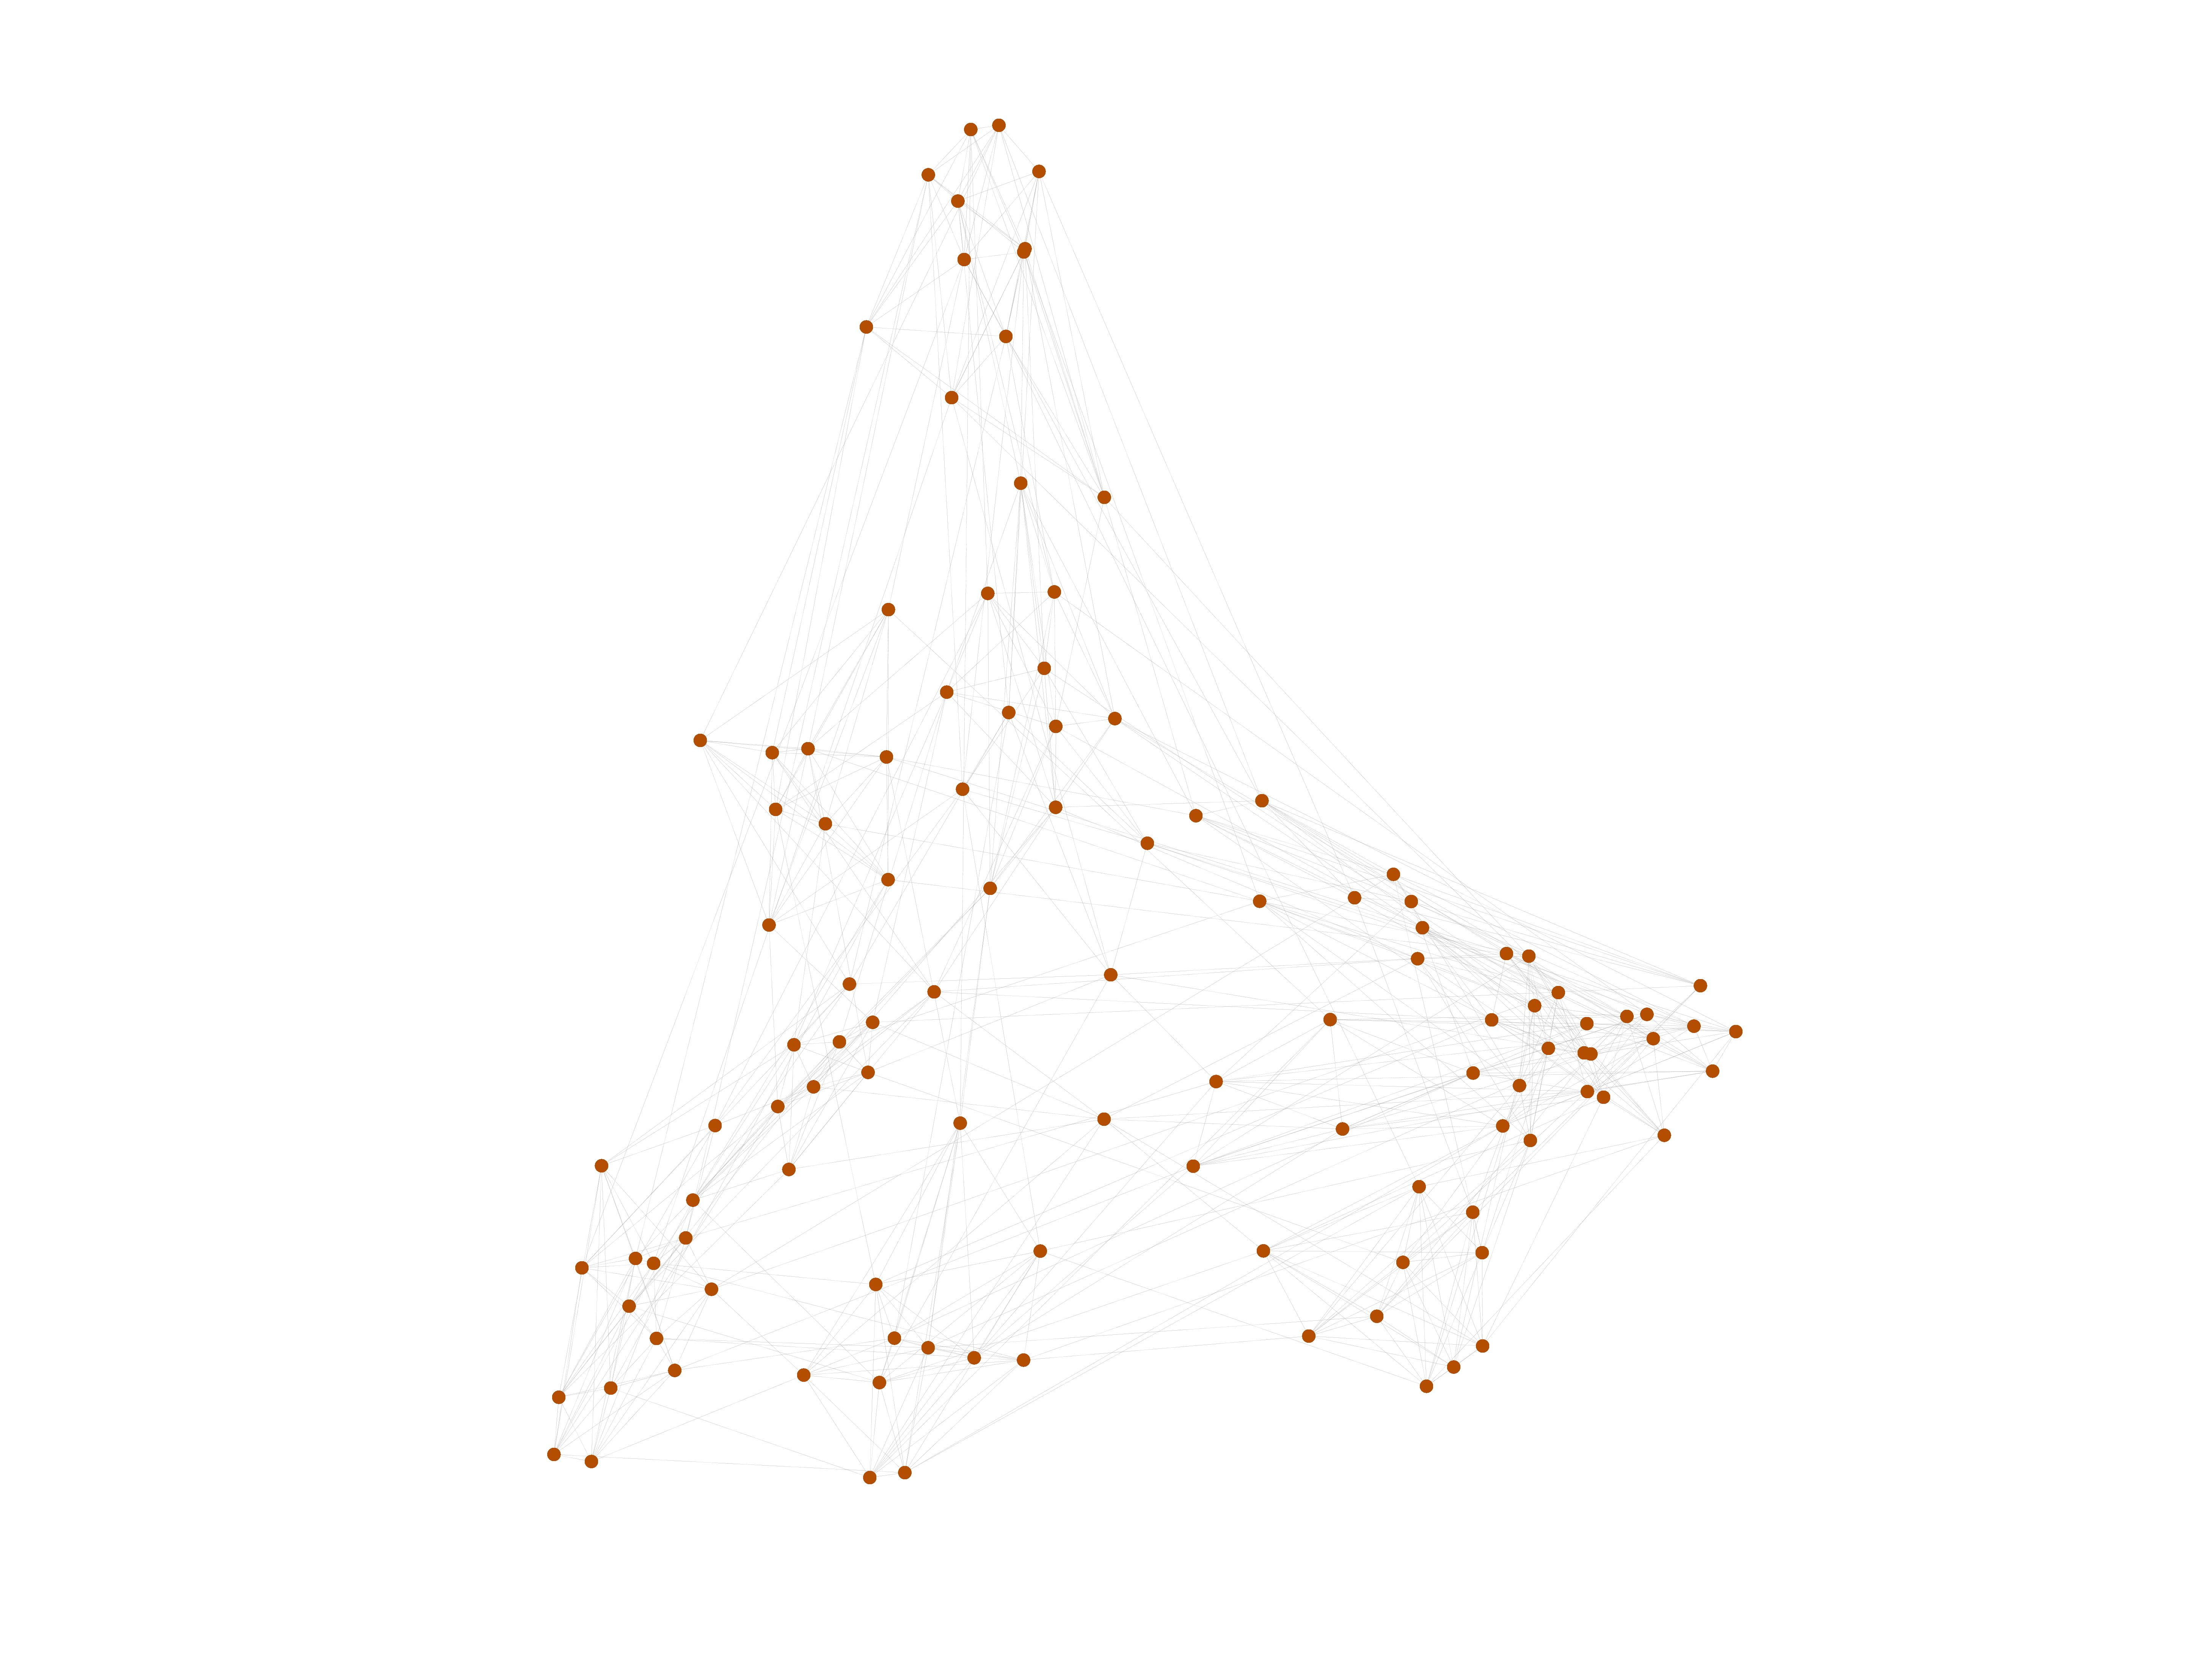
This network contains "American football games between Division IA colleges during regular season Fall 2000." Results are not included in the dataset, and neither is home/away information.

Metadata

CodeAF
Internal namedimacs10-football
NameAmerican football
Data sourcehttps://www.cc.gatech.edu/dimacs10/archive/clustering.shtml
AvailabilityDataset is available for download
Consistency checkDataset passed all tests
Category
Interaction network
Dataset timestamp 2000
Node meaningTeam
Edge meaningGame
Network formatUnipartite, undirected
Edge typeUnweighted, no multiple edges
LoopsDoes not contain loops
Orientation Is not directed, but the underlying data is
Multiplicity Does not have multiple edges, but the underlying data has

Statistics

Size n =115
Volume m =613
Loop count l =0
Wedge count s =5,967
Claw count z =17,513
Cross count x =34,475
Triangle count t =810
Square count q =3,915
4-Tour count T4 =56,414
Maximum degree dmax =12
Average degree d =10.660 9
Fill p =0.093 516 4
Size of LCC N =115
Diameter δ =4
50-Percentile effective diameter δ0.5 =2.004 48
90-Percentile effective diameter δ0.9 =2.828 14
Median distance δM =3
Mean distance δm =2.396 81
Gini coefficient G =0.039 960 3
Balanced inequality ratio P =0.478 793
Relative edge distribution entropy Her =0.999 244
Power law exponent γ =3.398 68
Tail power law exponent γt =8.991 00
Tail power law exponent with p γ3 =8.991 00
p-value p =0.000 00
Degree assortativity ρ =+0.162 442
Degree assortativity p-value pρ =1.065 06 × 10−8
Clustering coefficient c =0.407 240
Spectral norm α =10.780 6
Algebraic connectivity a =1.459 00
Spectral separation 1[A] / λ2[A]| =1.161 89
Non-bipartivity bA =0.579 913
Normalized non-bipartivity bN =0.557 894
Algebraic non-bipartivity χ =5.077 40
Spectral bipartite frustration bK =0.119 066
Controllability C =3
Relative controllability Cr =0.026 087 0

Plots

Fruchterman–Reingold graph drawing

Degree distribution

Cumulative degree distribution

Lorenz curve

Spectral distribution of the adjacency matrix

Spectral distribution of the normalized adjacency matrix

Spectral distribution of the Laplacian

Spectral graph drawing based on the adjacency matrix

Spectral graph drawing based on the Laplacian

Spectral graph drawing based on the normalized adjacency matrix

Degree assortativity

Zipf plot

Hop distribution

Double Laplacian graph drawing

Delaunay graph drawing

Clustering coefficient distribution

Average neighbor degree distribution

SynGraphy

Matrix decompositions plots

Downloads

References

[1] Jérôme Kunegis. KONECT – The Koblenz Network Collection. In Proc. Int. Conf. on World Wide Web Companion, pages 1343–1350, 2013. [ http ]
[2] Michelle Girvan and Mark E. J. Newman. Community structure in social and biological networks. Proc. Natl. Acad. Sci. U.S.A., 99(12):7821–7826, 2002.