Discogs artist–genre
Discogs (short for "discographies") is a large online music database that
provides information about audio records including information about artists,
labels and release details. Each edge of this bipartite network connects an
artist and a genre. An edge indicates that the artist was involved in the
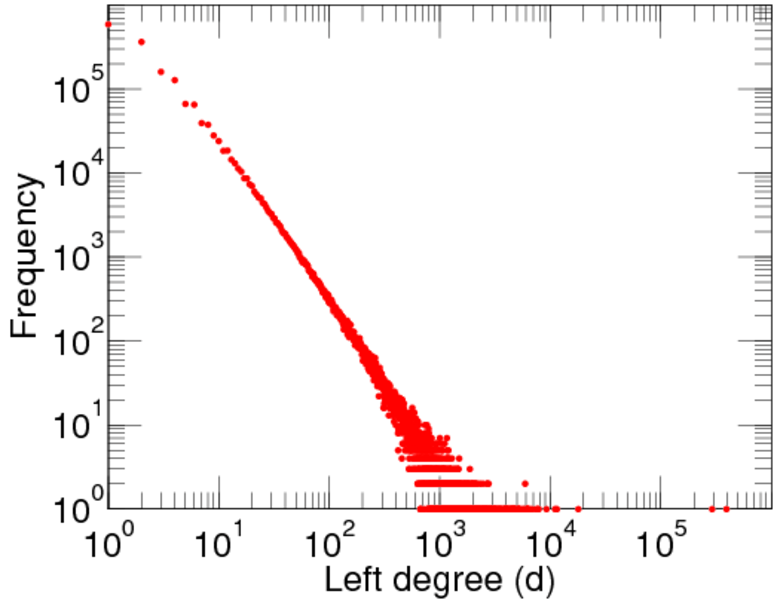
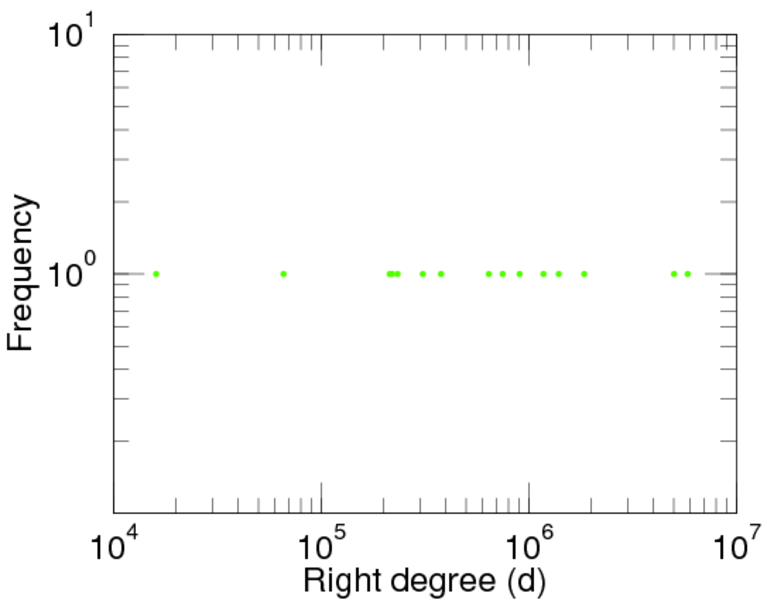
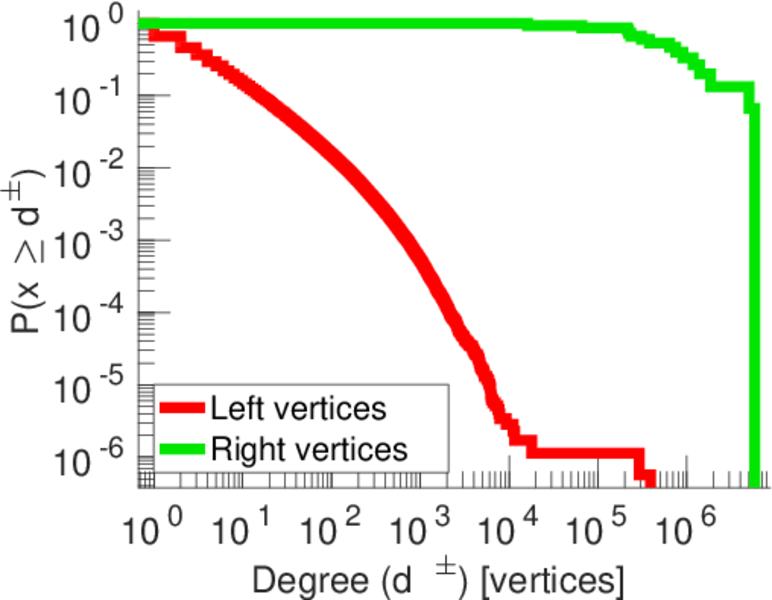
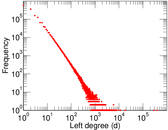
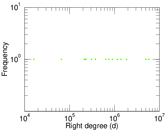
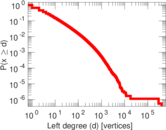
production of a release of this genre. The left nodes represent artists and the
right nodes represent genres.
Metadata
Statistics
| Size | n = | 1,754,838
|
| Left size | n1 = | 1,754,823
|
| Right size | n2 = | 15
|
| Volume | m = | 19,033,891
|
| Unique edge count | m̿ = | 3,142,059
|
| Wedge count | s = | 713,800,298,659
|
| Claw count | z = | 151,287,735,212,950,336
|
| Cross count | x = | 2.700 85 × 1022
|
| Square count | q = | 111,241,556,929
|
| 4-Tour count | T4 = | 3,745,144,849,158
|
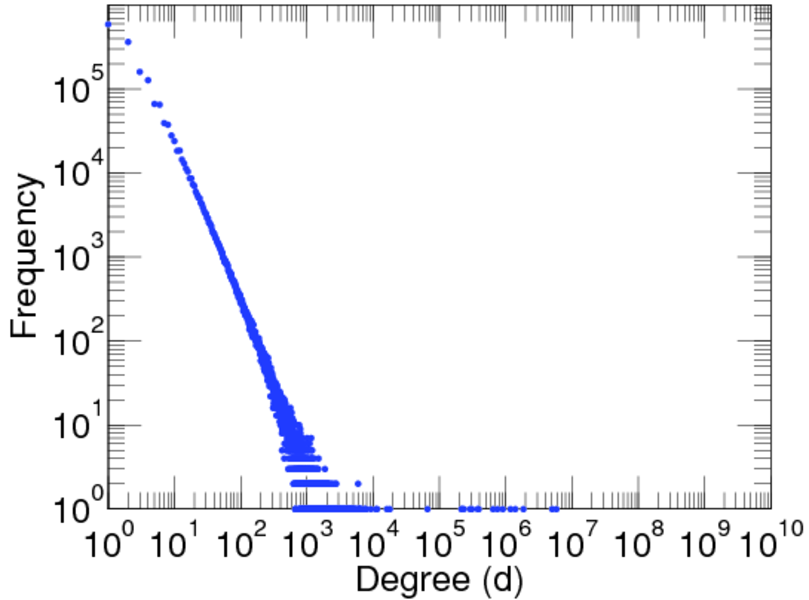
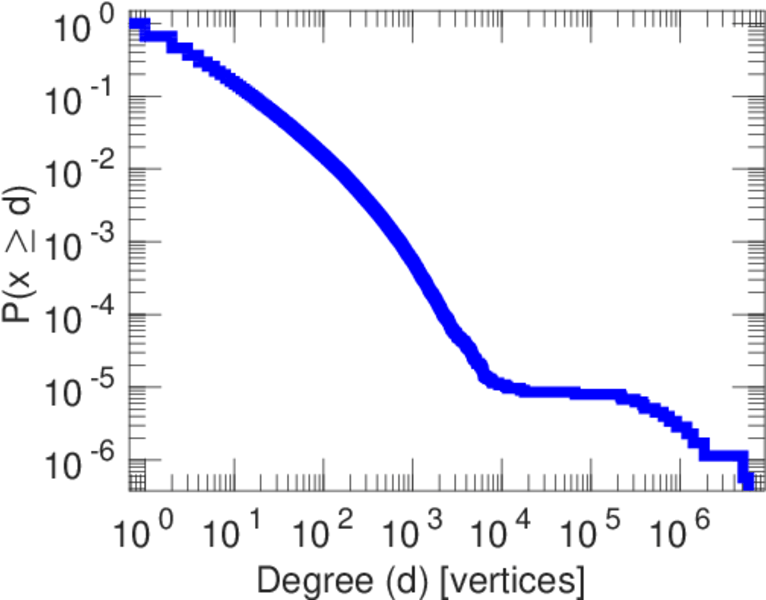
| Maximum degree | dmax = | 5,837,587
|
| Maximum left degree | d1max = | 392,118
|
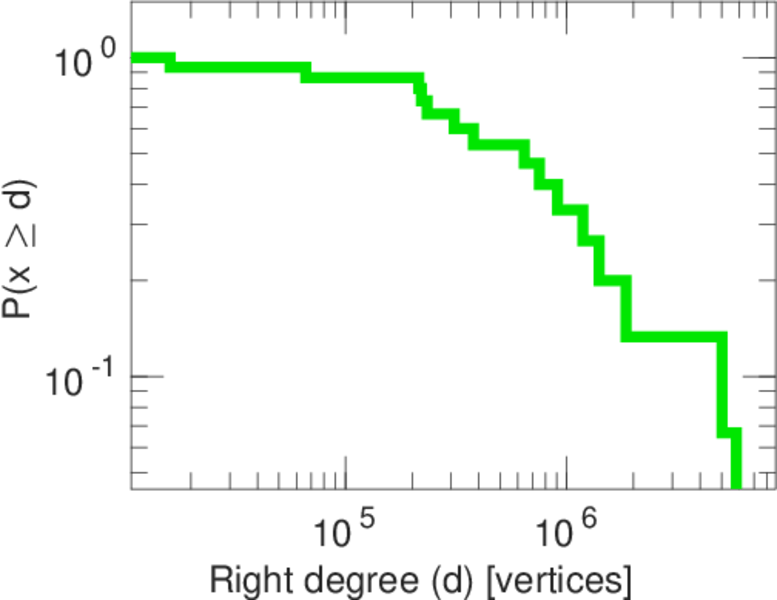
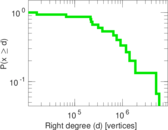
| Maximum right degree | d2max = | 5,837,587
|
| Average degree | d = | 21.693 0
|
| Average left degree | d1 = | 10.846 6
|
| Average right degree | d2 = | 1.268 93 × 106
|
| Fill | p = | 0.119 369
|
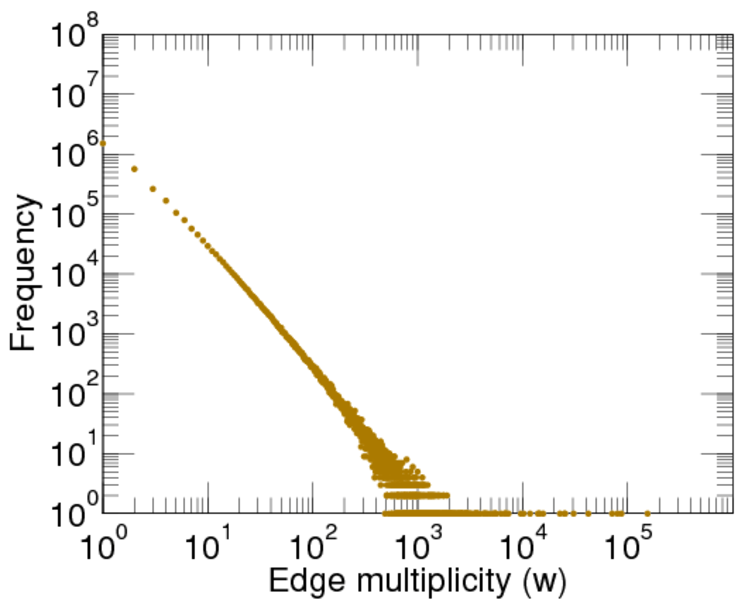
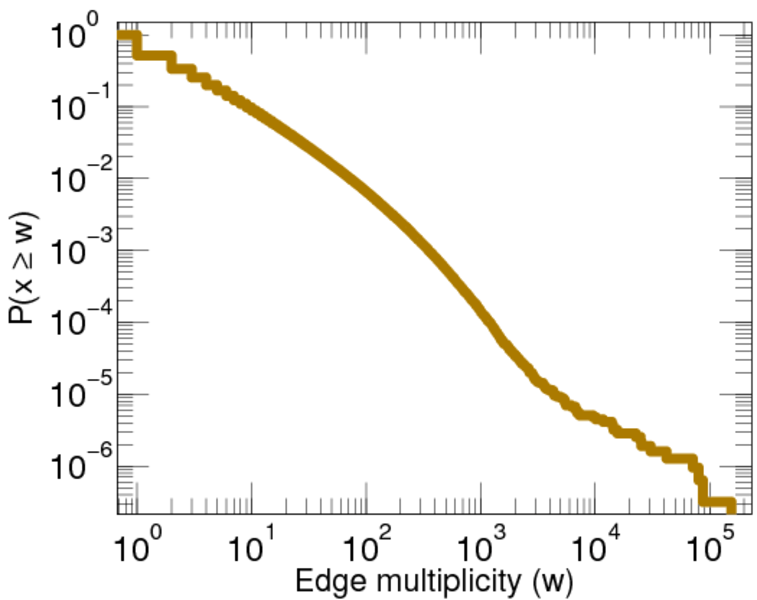
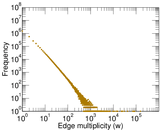
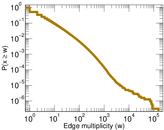
| Average edge multiplicity | m̃ = | 6.057 78
|
| Size of LCC | N = | 1,754,837
|
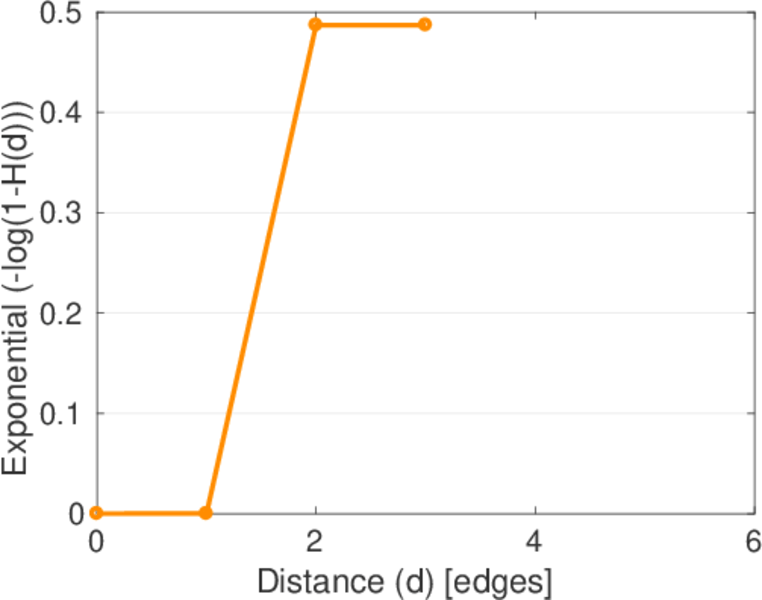
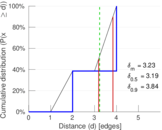
| Diameter | δ = | 4
|
| 50-Percentile effective diameter | δ0.5 = | 3.186 26
|
| 90-Percentile effective diameter | δ0.9 = | 3.837 25
|
| Median distance | δM = | 4
|
| Mean distance | δm = | 3.228 90
|
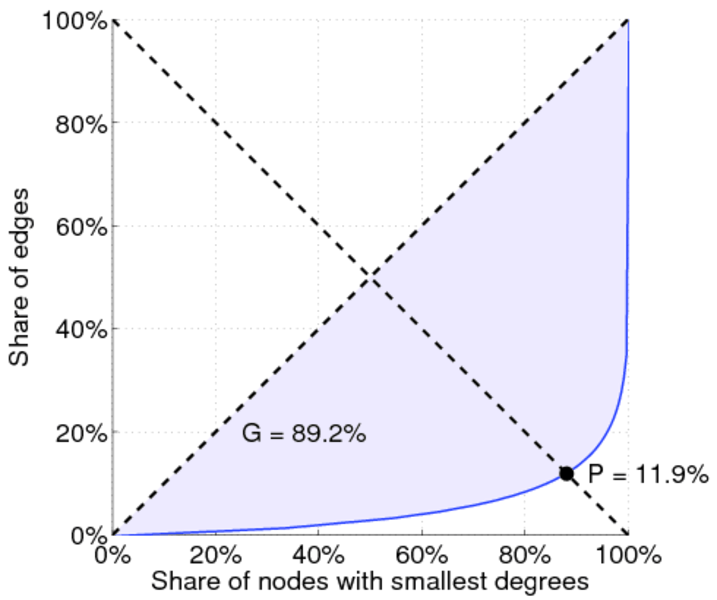
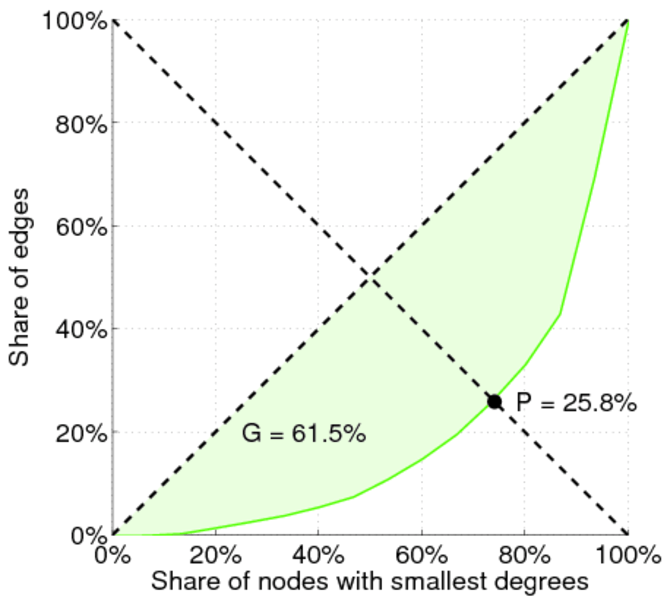
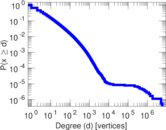
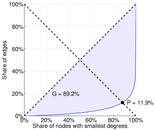
| Gini coefficient | G = | 0.892 468
|
| Balanced inequality ratio | P = | 0.118 928
|
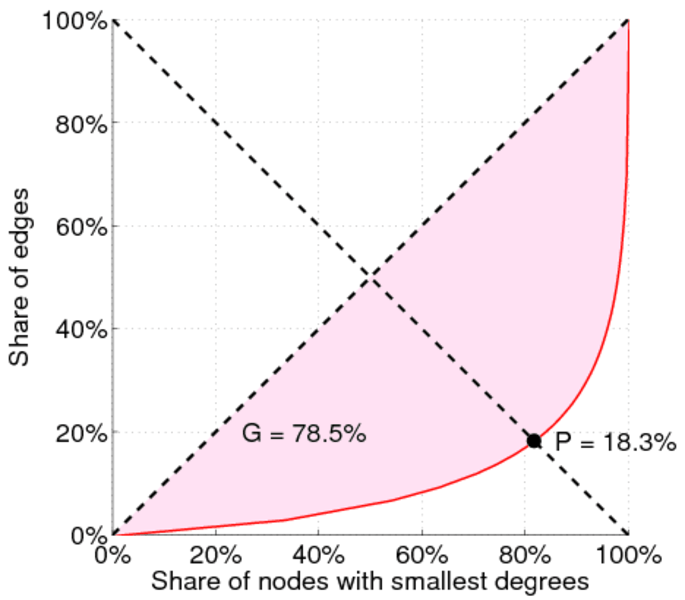
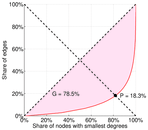
| Left balanced inequality ratio | P1 = | 0.182 595
|
| Right balanced inequality ratio | P2 = | 0.258 492
|
| Relative edge distribution entropy | Her = | 0.618 216
|
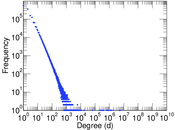
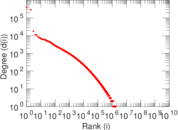
| Power law exponent | γ = | 3.536 90
|
| Tail power law exponent | γt = | 3.361 00
|
| Tail power law exponent with p | γ3 = | 3.361 00
|
| p-value | p = | 0.000 00
|
| Left tail power law exponent with p | γ3,1 = | 3.361 00
|
| Left p-value | p1 = | 0.000 00
|
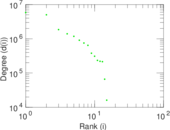
| Right tail power law exponent with p | γ3,2 = | 6.771 00
|
| Right p-value | p2 = | 0.000 00
|
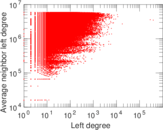
| Degree assortativity | ρ = | −0.284 127
|
| Degree assortativity p-value | pρ = | 0.000 00
|
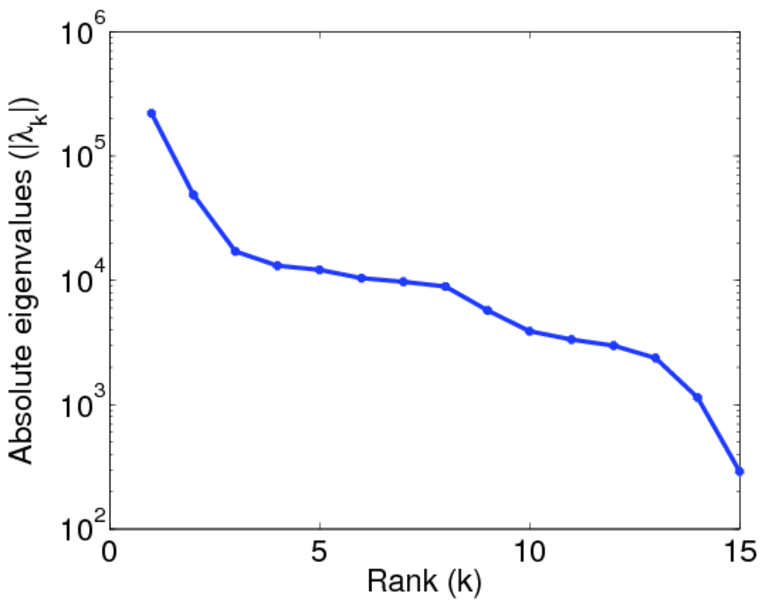
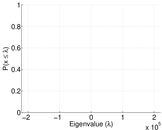
| Spectral norm | α = | 221,106
|
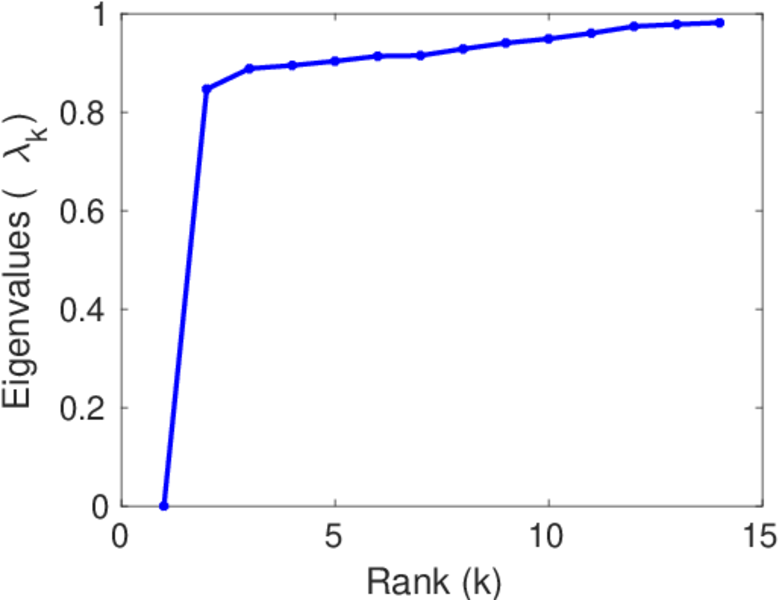
| Algebraic connectivity | a = | 0.846 666
|
| Spectral separation | |λ1[A] / λ2[A]| = | 4.534 39
|
| Controllability | C = | 1,754,808
|
| Relative controllability | Cr = | 0.999 983
|
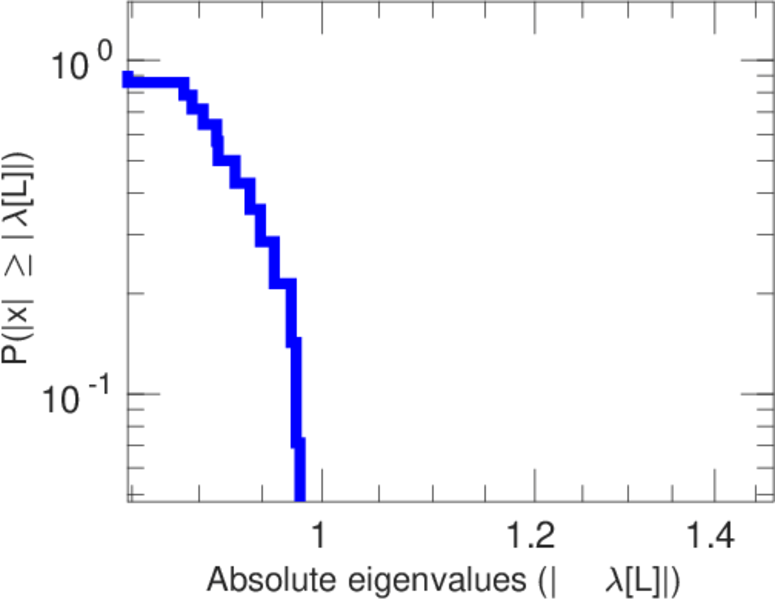
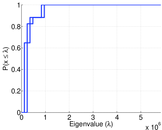
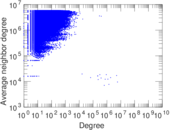
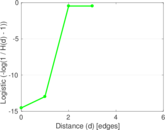
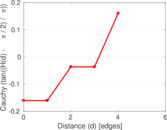
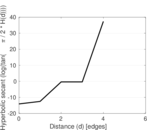
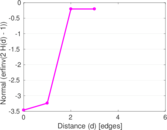
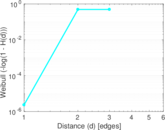
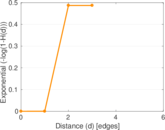
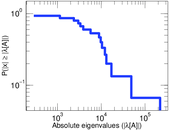
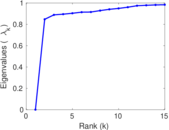
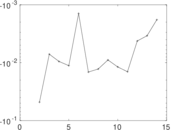
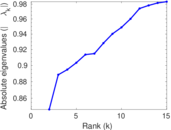
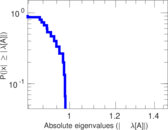
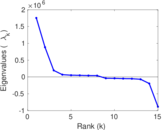
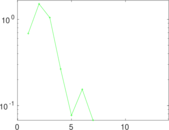
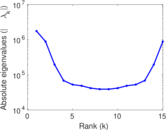
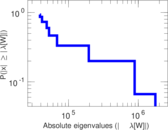
Plots


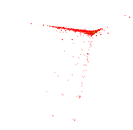
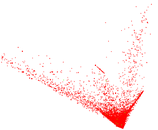


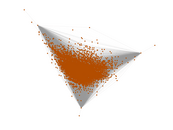
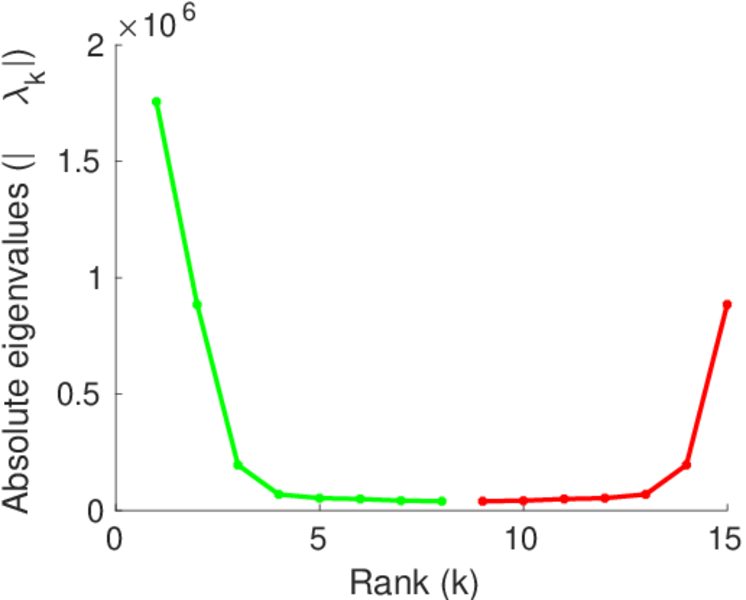
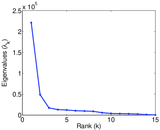
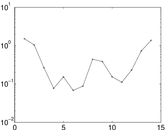
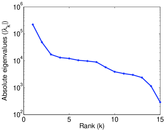
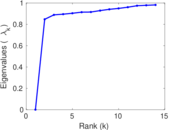
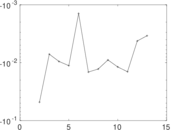
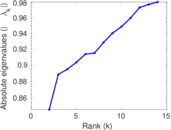
Matrix decompositions plots


Downloads
References
|
[1]
|
Jérôme Kunegis.
KONECT – The Koblenz Network Collection.
In Proc. Int. Conf. on World Wide Web Companion, pages
1343–1350, 2013.
[ http ]
|
 KONECT ‣ Networks ‣
Buy Me a Coffee
KONECT ‣ Networks ‣
Buy Me a Coffee