Discogs label–genre
Discogs (short for "discographies") is a large online music database that
provides information about audio records including information about artists,
labels and release details. Each edge of this bipartite network connects a
label and a genre. An edge indicates that the label was involved in the
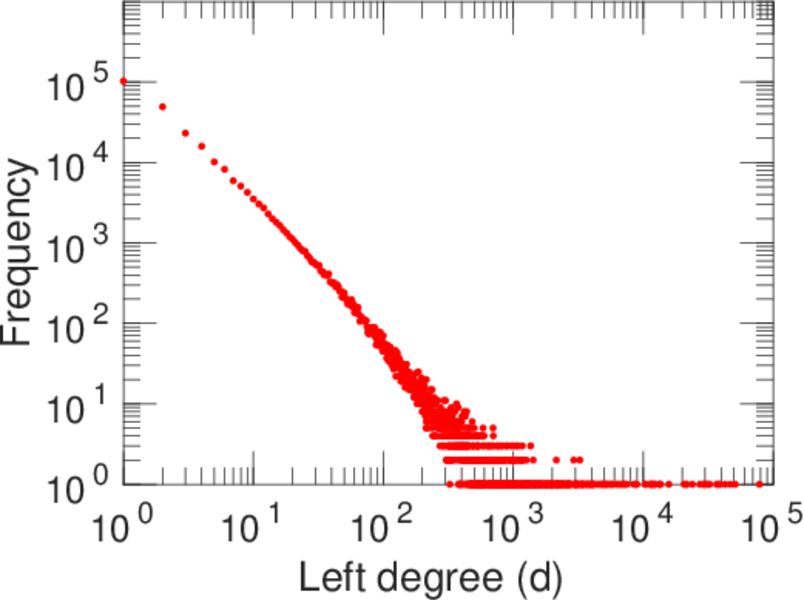
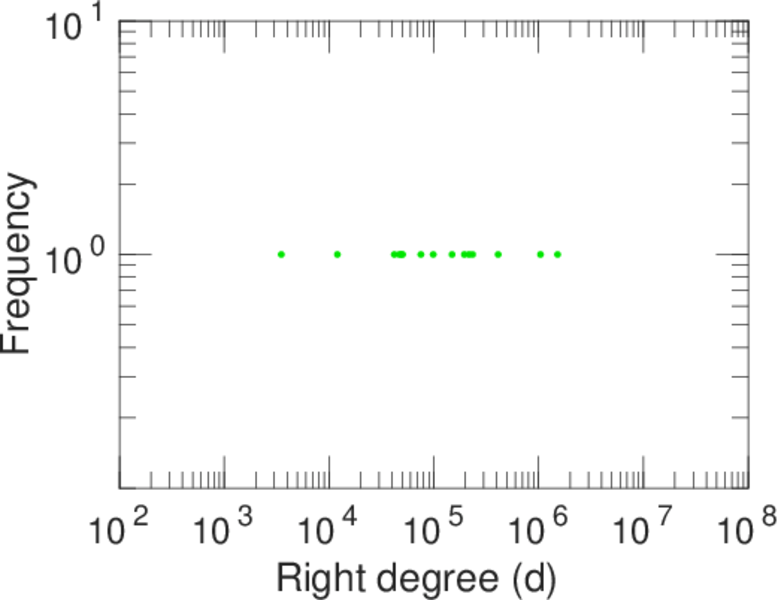
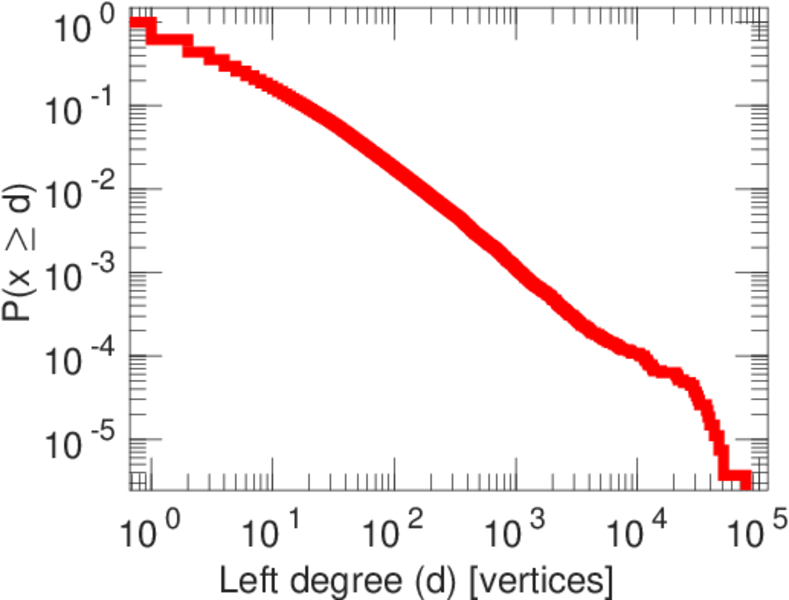
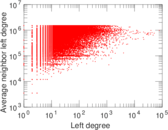
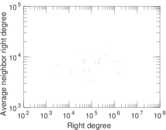
production of a release of this genre. The left nodes represent labels and the
right nodes represent genres.
Metadata
Statistics
| Size | n = | 270,786
|
| Left size | n1 = | 270,771
|
| Right size | n2 = | 15
|
| Volume | m = | 4,147,665
|
| Unique edge count | m̿ = | 481,661
|
| Wedge count | s = | 18,190,840,285
|
| Claw count | z = | 647,168,119,285,166
|
| Cross count | x = | 1.913 97 × 1019
|
| Square count | q = | 2,880,892,476
|
| 4-Tour count | T4 = | 95,812,257,190
|
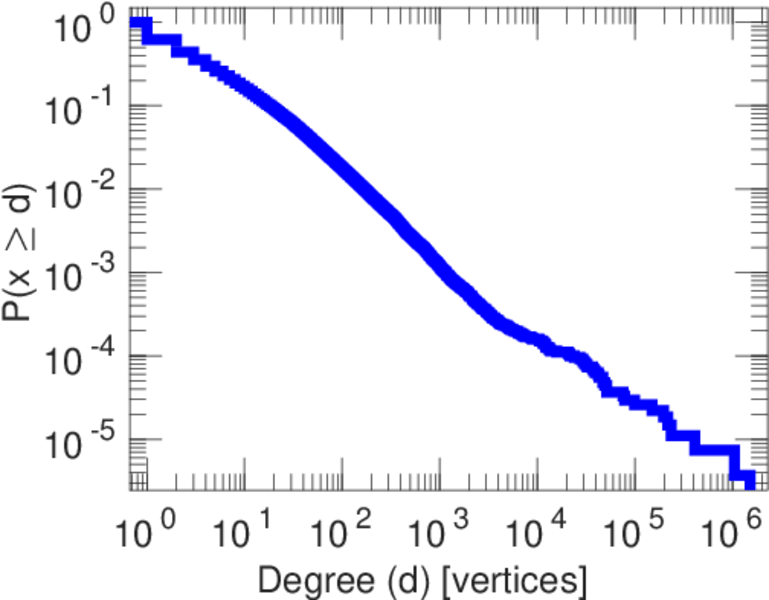
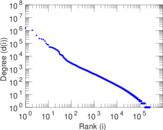
| Maximum degree | dmax = | 1,517,976
|
| Maximum left degree | d1max = | 78,434
|
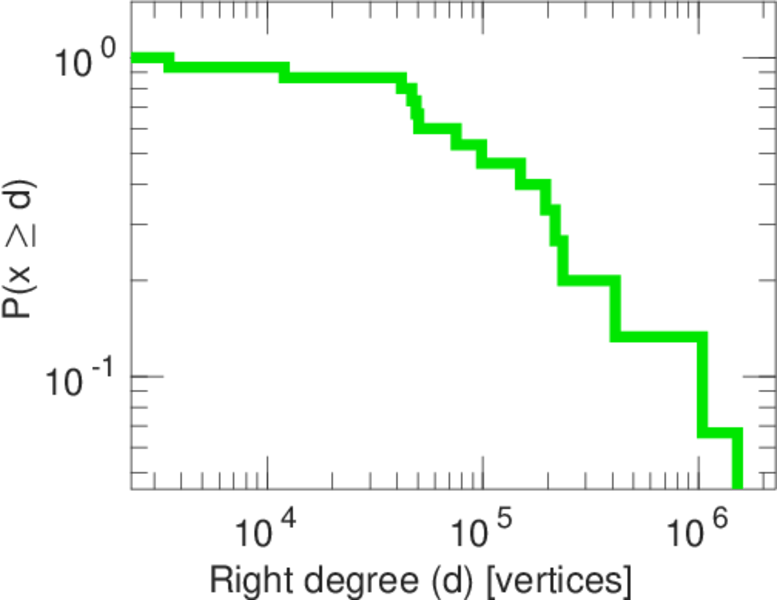
| Maximum right degree | d2max = | 1,517,976
|
| Average degree | d = | 30.634 3
|
| Average left degree | d1 = | 15.318 0
|
| Average right degree | d2 = | 276,511
|
| Fill | p = | 0.118 590
|
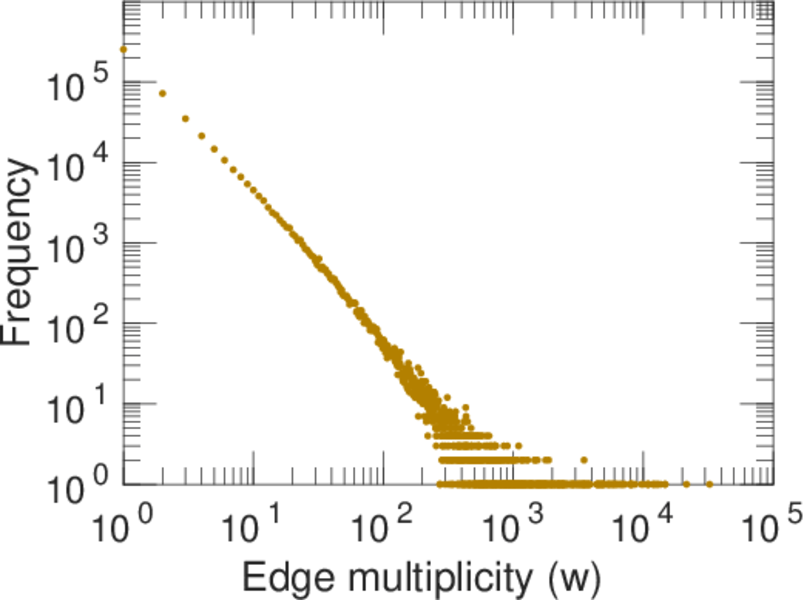
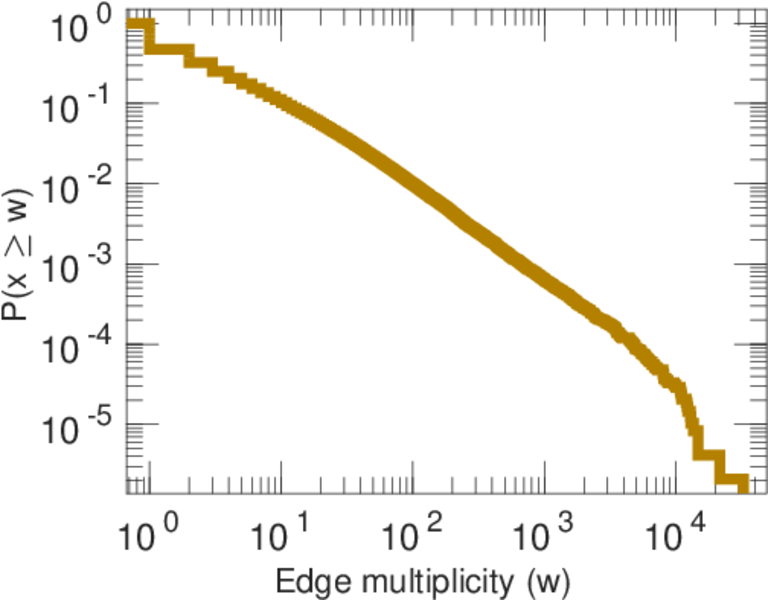
| Average edge multiplicity | m̃ = | 8.611 17
|
| Size of LCC | N = | 270,785
|
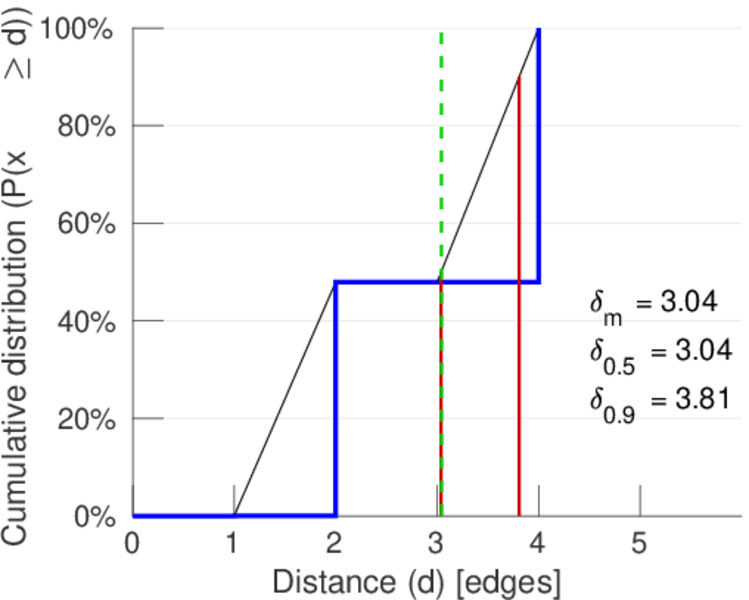
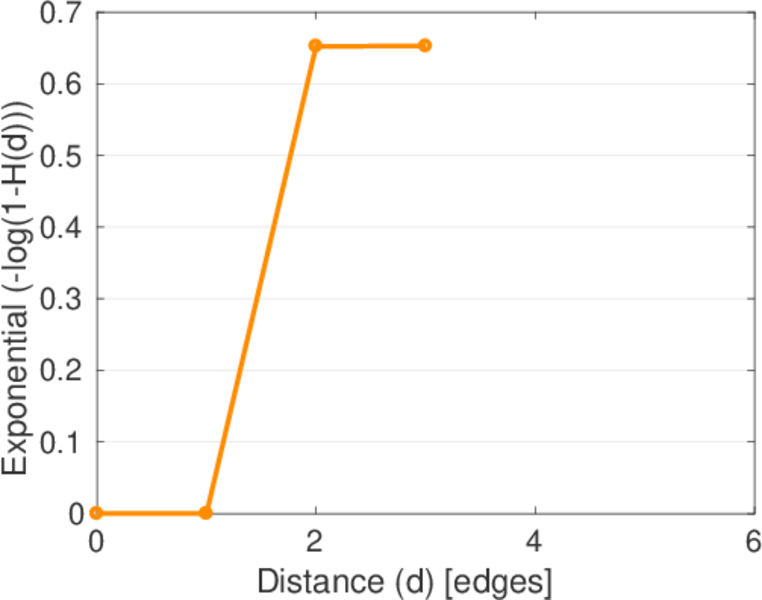
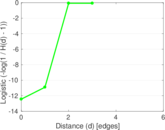
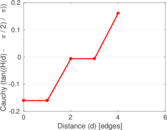
| Diameter | δ = | 4
|
| 50-Percentile effective diameter | δ0.5 = | 3.039 86
|
| 90-Percentile effective diameter | δ0.9 = | 3.807 97
|
| Median distance | δM = | 4
|
| Mean distance | δm = | 3.041 54
|
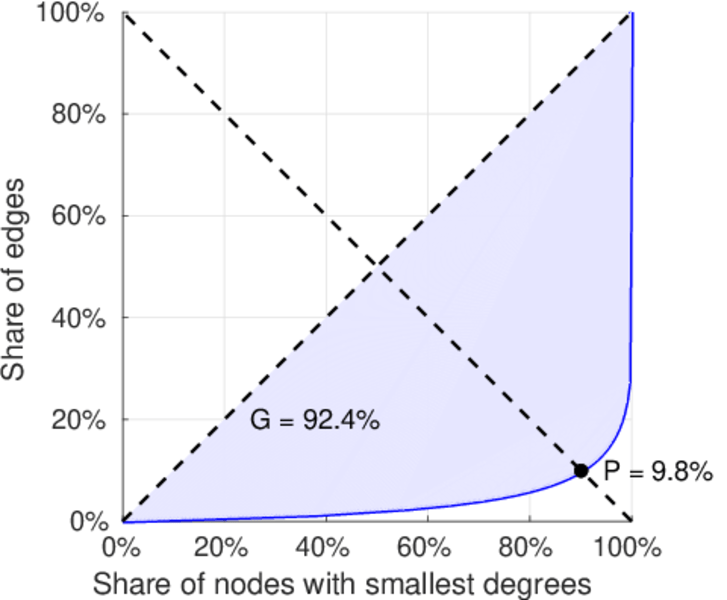
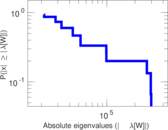
| Gini coefficient | G = | 0.923 545
|
| Balanced inequality ratio | P = | 0.097 669 0
|
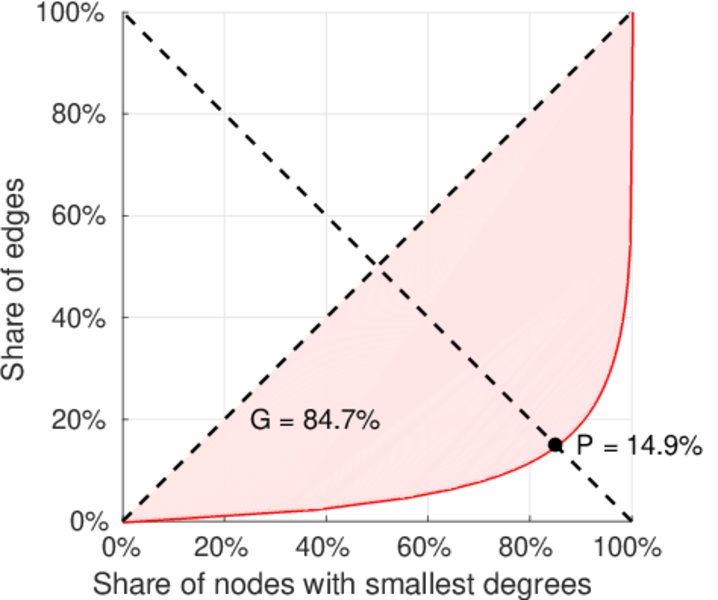
| Left balanced inequality ratio | P1 = | 0.148 640
|
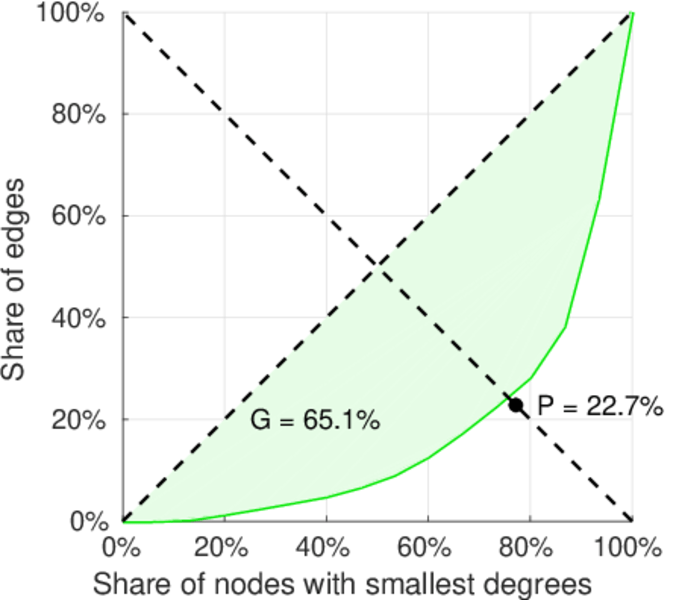
| Right balanced inequality ratio | P2 = | 0.226 562
|
| Relative edge distribution entropy | Her = | 0.632 470
|
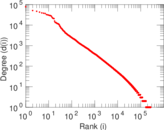
| Power law exponent | γ = | 3.698 21
|
| Tail power law exponent | γt = | 3.111 00
|
| Tail power law exponent with p | γ3 = | 3.111 00
|
| p-value | p = | 0.000 00
|
| Left tail power law exponent with p | γ3,1 = | 3.121 00
|
| Left p-value | p1 = | 0.000 00
|
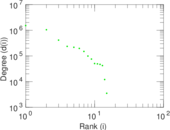
| Right tail power law exponent with p | γ3,2 = | 6.771 00
|
| Right p-value | p2 = | 0.000 00
|
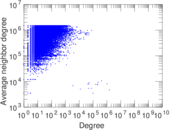
| Degree assortativity | ρ = | −0.351 885
|
| Degree assortativity p-value | pρ = | 0.000 00
|
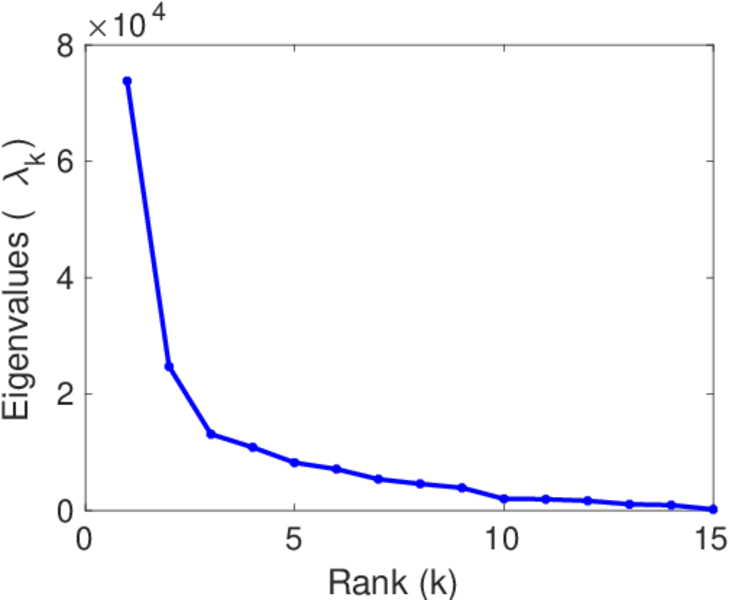
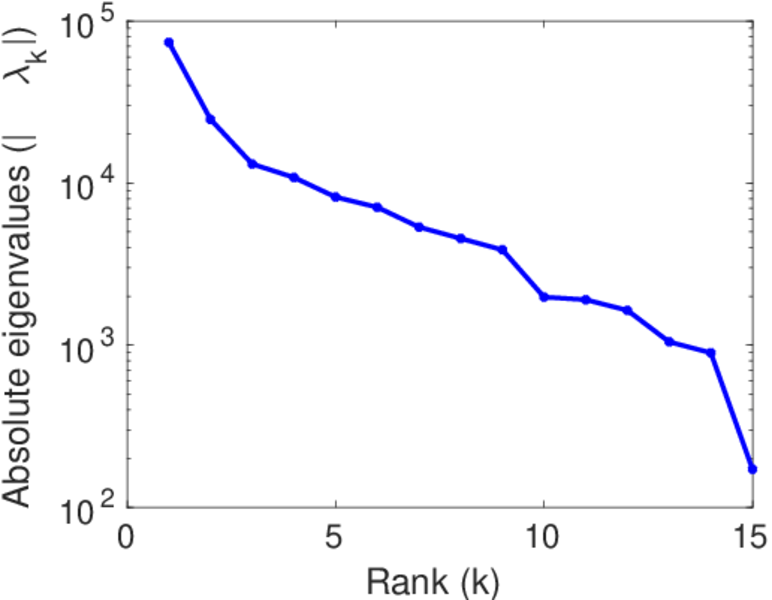
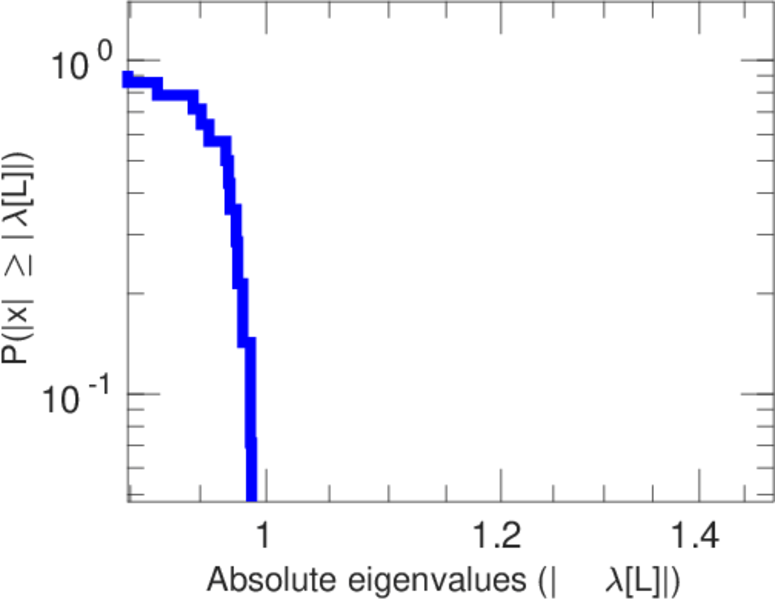
| Spectral norm | α = | 73,782.4
|
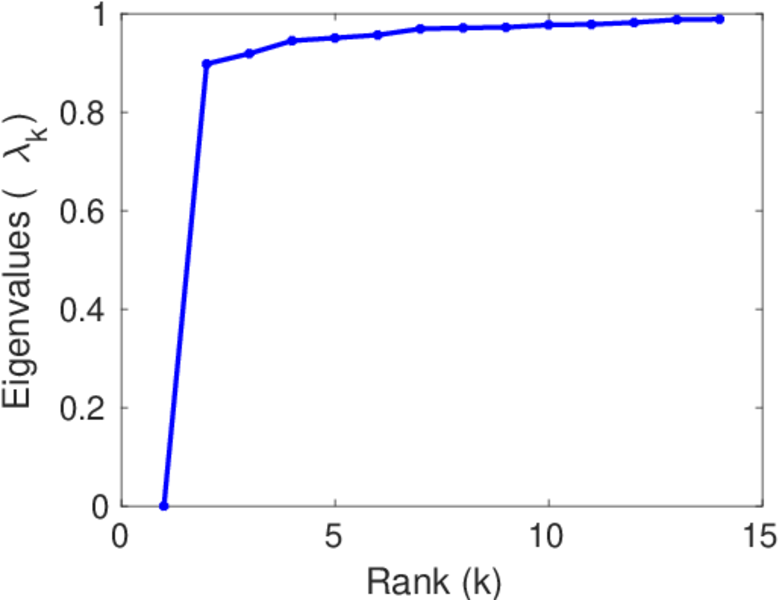
| Algebraic connectivity | a = | 0.897 895
|
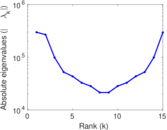
| Spectral separation | |λ1[A] / λ2[A]| = | 2.985 07
|
| Controllability | C = | 270,756
|
| Relative controllability | Cr = | 0.999 889
|
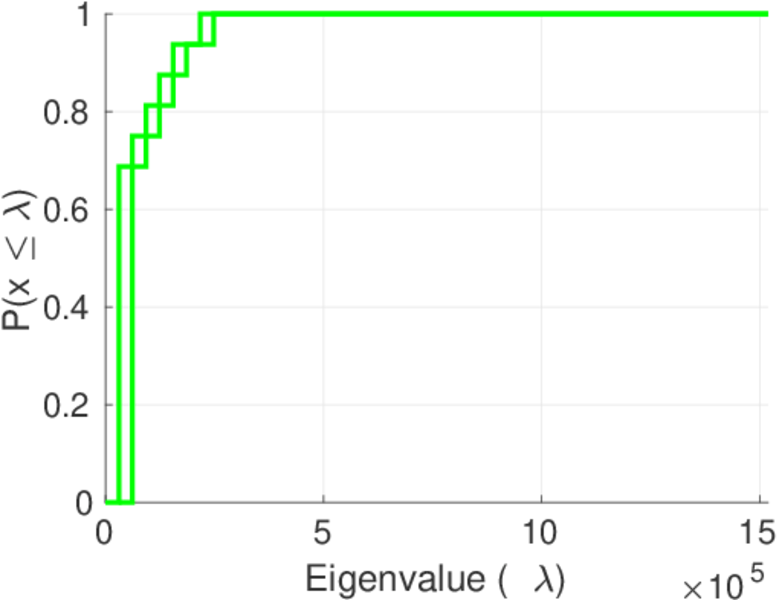
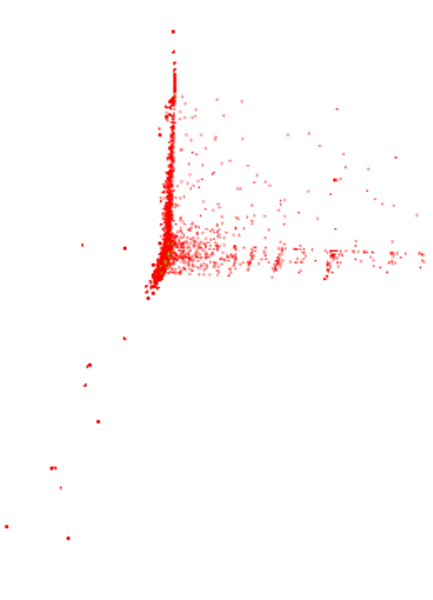
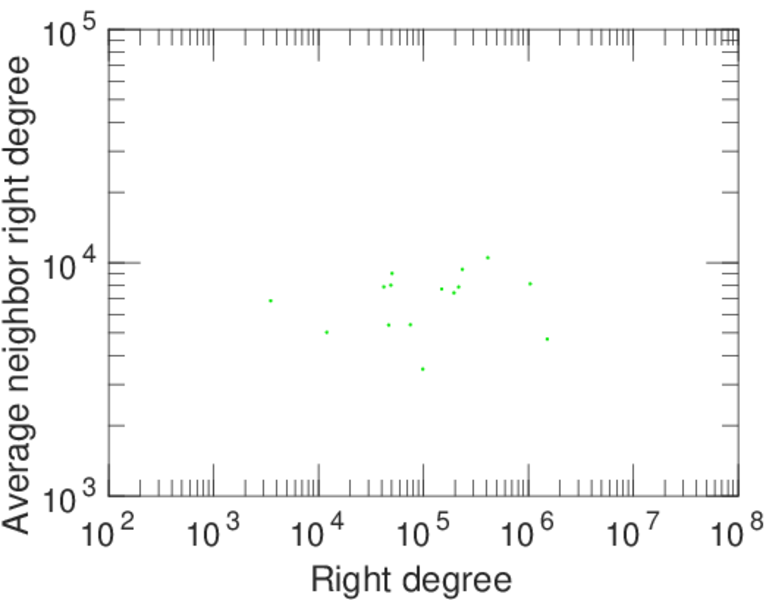
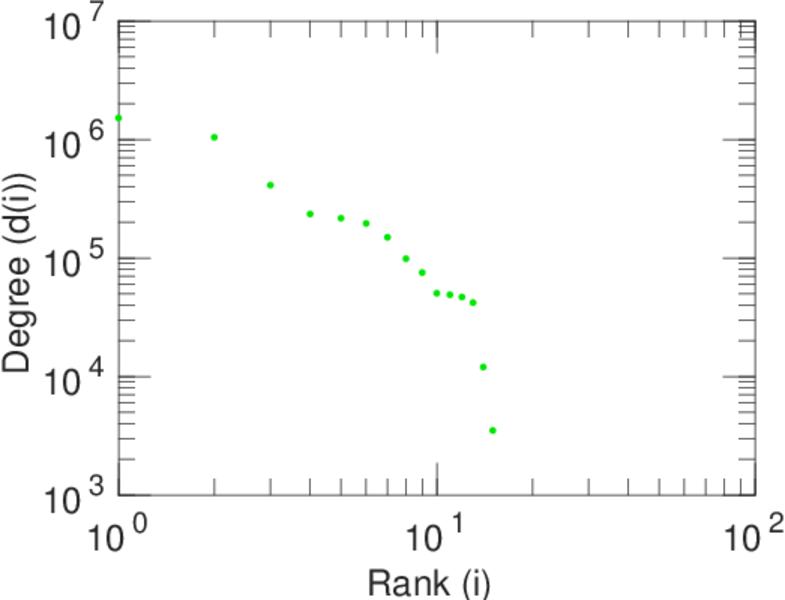
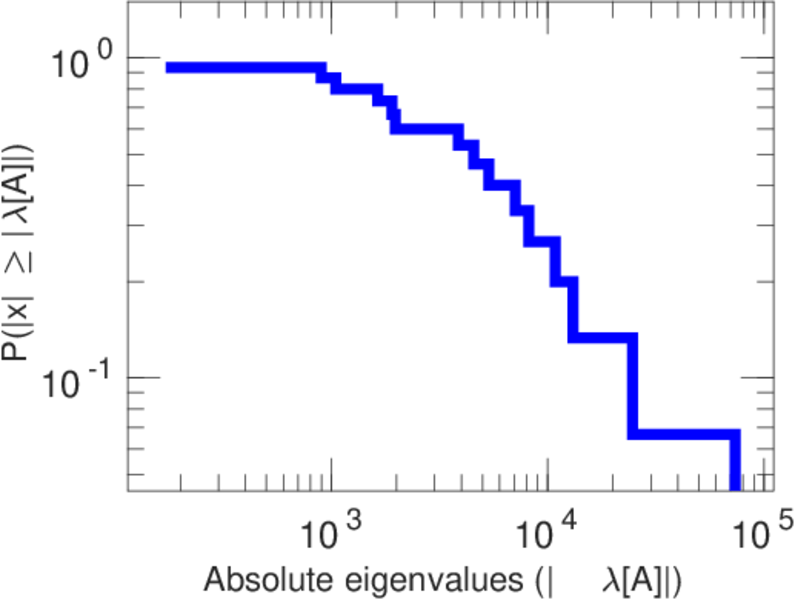
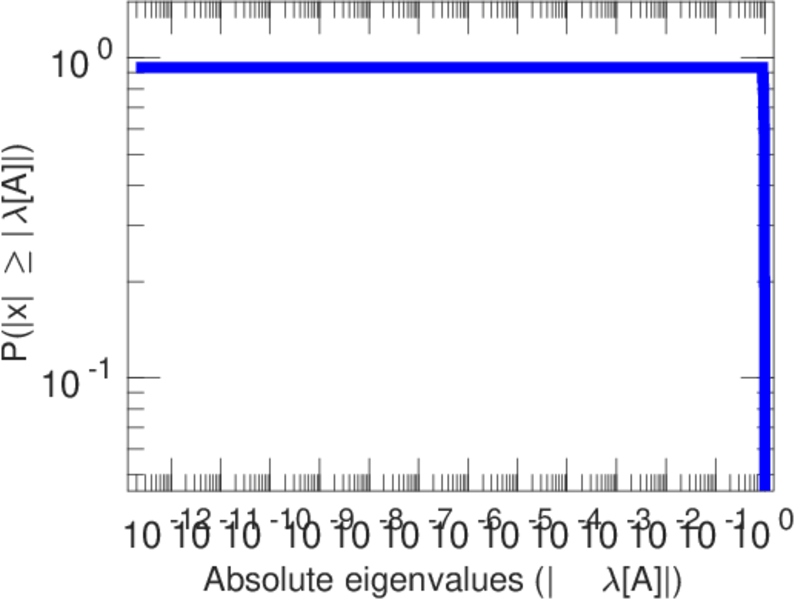
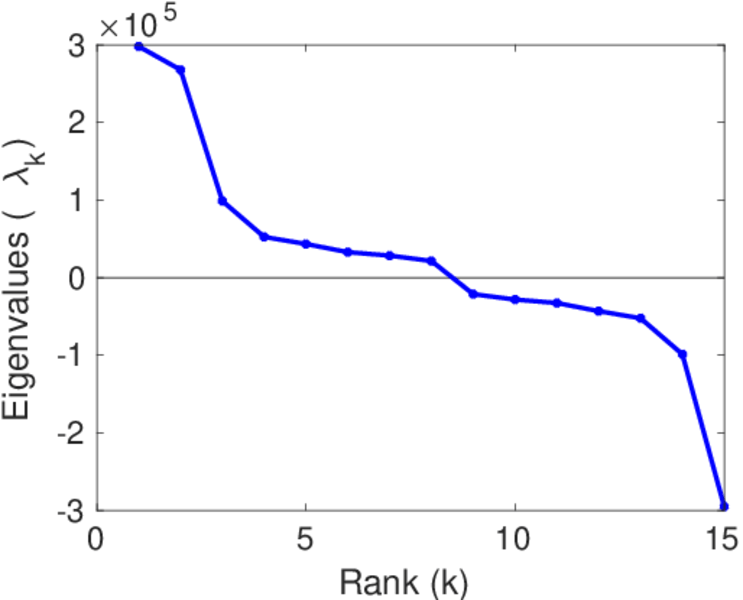
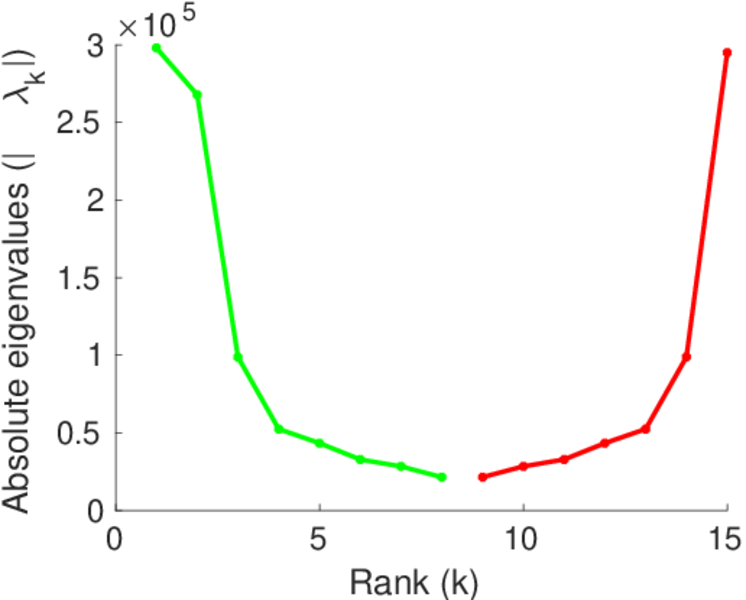
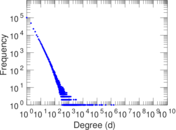
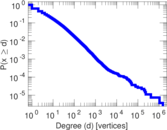
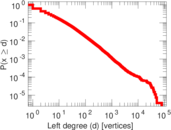
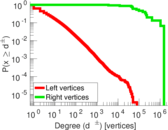
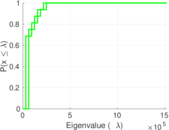
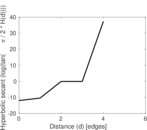
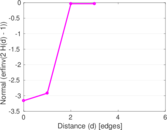
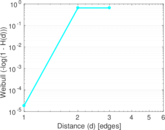
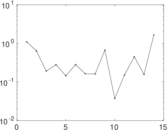
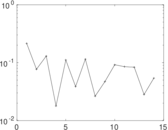
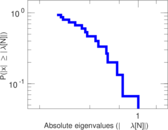
Plots


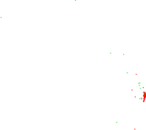
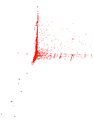


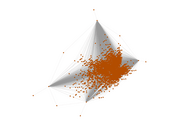


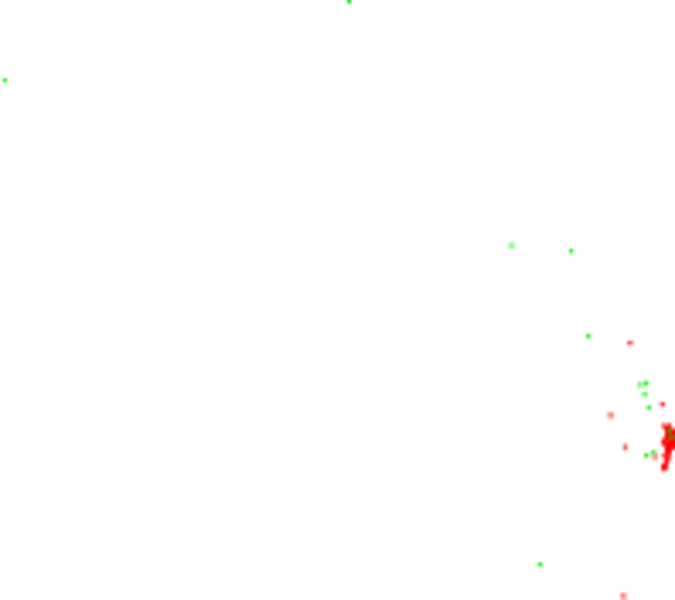
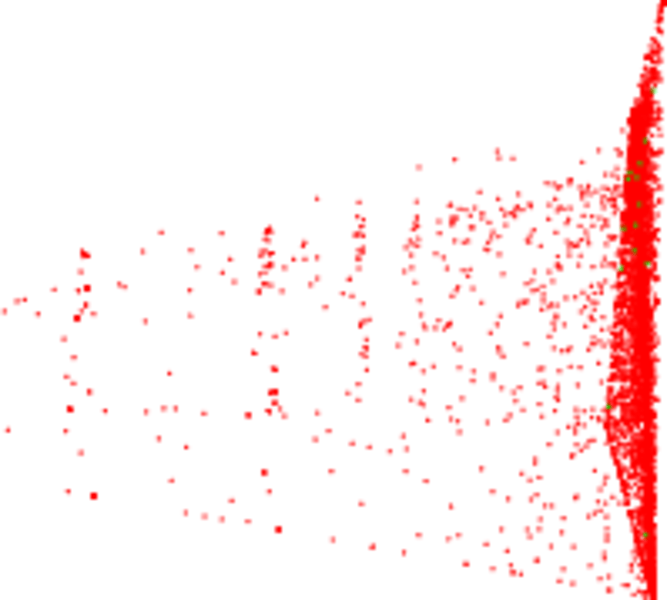
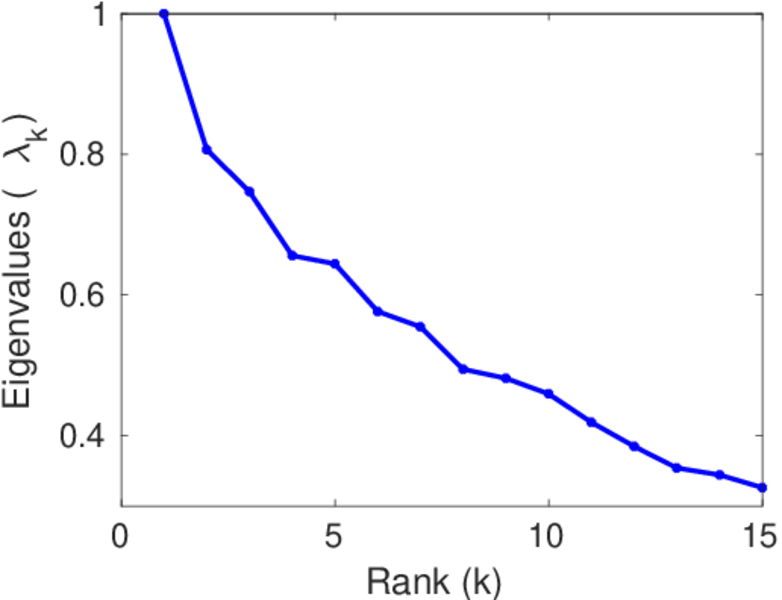
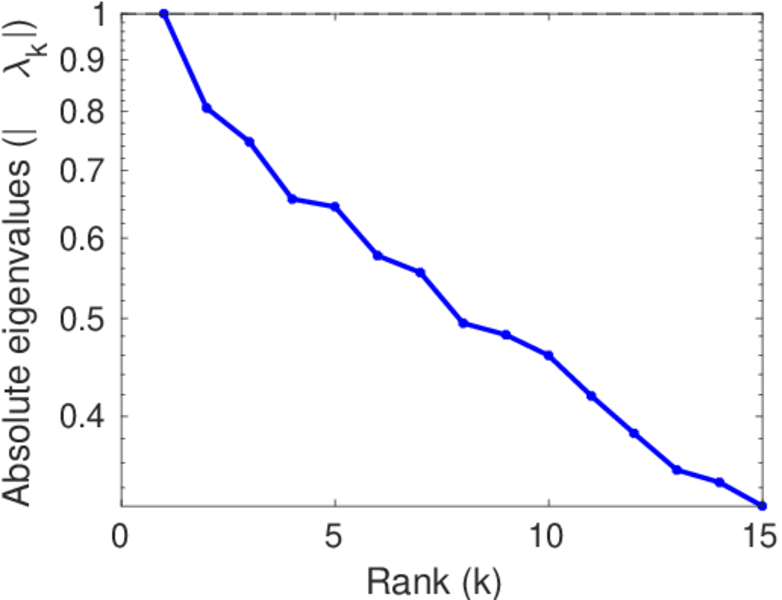
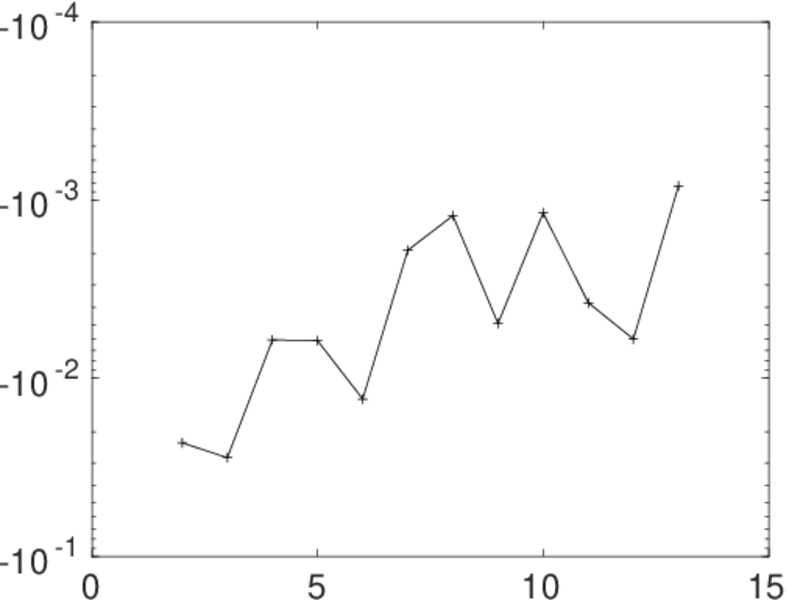
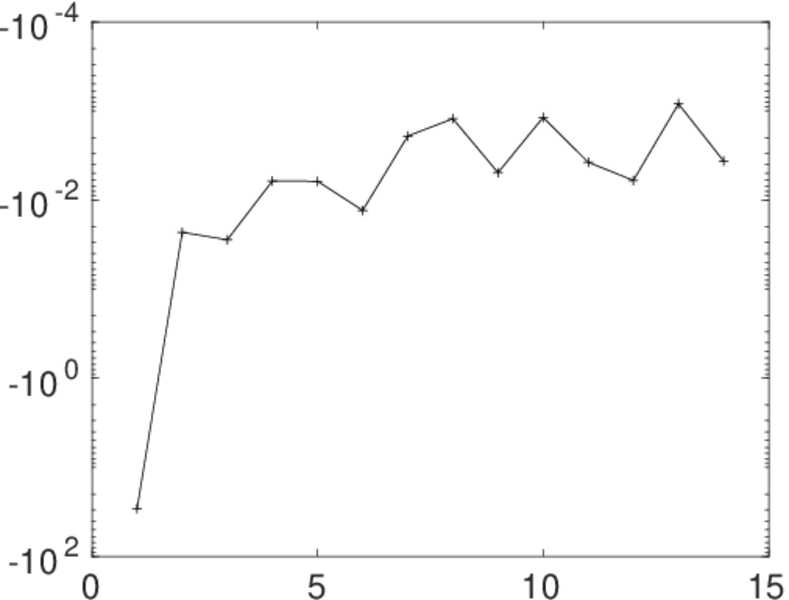
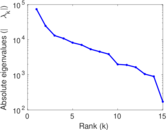
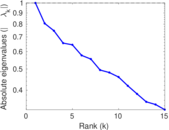
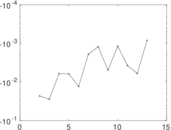
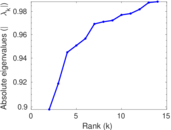
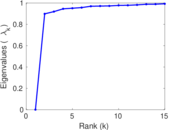
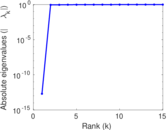
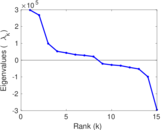
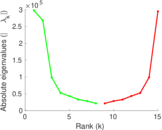
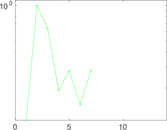
Matrix decompositions plots


Downloads
References
|
[1]
|
Jérôme Kunegis.
KONECT – The Koblenz Network Collection.
In Proc. Int. Conf. on World Wide Web Companion, pages
1343–1350, 2013.
[ http ]
|
 KONECT ‣ Networks ‣
Buy Me a Coffee
KONECT ‣ Networks ‣
Buy Me a Coffee