Discogs artist–style
Discogs (short for "discographies") is a large online music database that
provides information about audio records including information about artists,
labels and release details. Each edge of this bipartite network connects an
artist and a style. An edge indicates that the artist was involved in the
production of a release of the style. Releases can have multiple styles. The
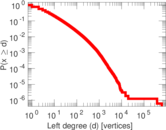
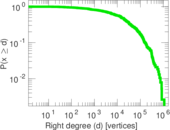
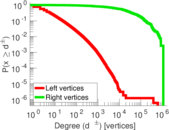
left nodes represent artists and the right nodes represent styles.
Metadata
Statistics
| Size | n = | 1,618,326
|
| Left size | n1 = | 1,617,943
|
| Right size | n2 = | 383
|
| Volume | m = | 24,085,580
|
| Unique edge count | m̿ = | 5,740,842
|
| Wedge count | s = | 166,393,512,911
|
| Claw count | z = | 5,367,492,614,640,449
|
| Cross count | x = | 1.617 65 × 1020
|
| Square count | q = | 77,383,418,076
|
| 4-Tour count | T4 = | 1,284,657,683,652
|
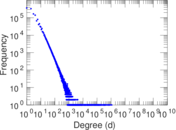
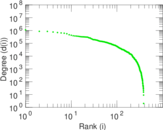
| Maximum degree | dmax = | 1,109,229
|
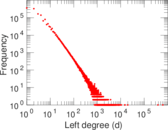
| Maximum left degree | d1max = | 621,250
|
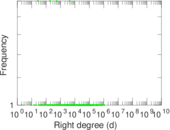
| Maximum right degree | d2max = | 1,109,229
|
| Average degree | d = | 29.766 0
|
| Average left degree | d1 = | 14.886 5
|
| Average right degree | d2 = | 62,886.6
|
| Fill | p = | 0.009 264 32
|
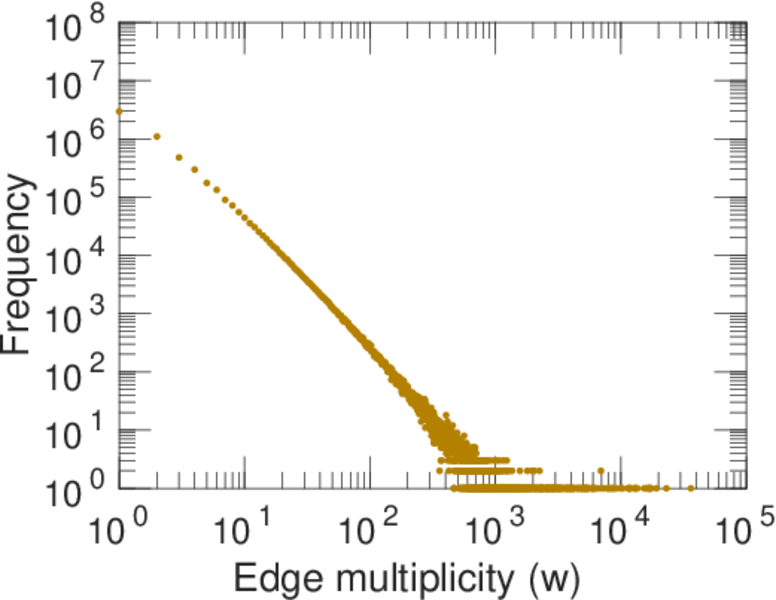
| Average edge multiplicity | m̃ = | 4.195 48
|
| Size of LCC | N = | 1,618,326
|
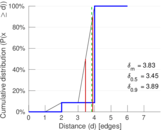
| Diameter | δ = | 6
|
| 50-Percentile effective diameter | δ0.5 = | 3.452 57
|
| 90-Percentile effective diameter | δ0.9 = | 3.890 52
|
| Median distance | δM = | 4
|
| Mean distance | δm = | 3.827 03
|
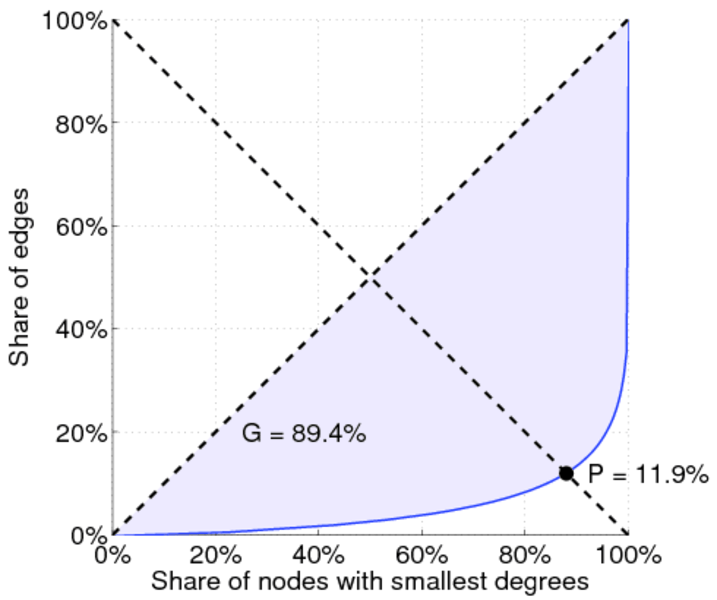
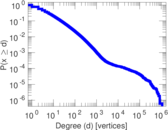
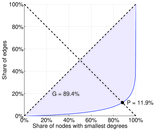
| Gini coefficient | G = | 0.894 557
|
| Balanced inequality ratio | P = | 0.119 342
|
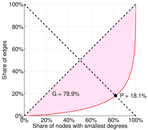
| Left balanced inequality ratio | P1 = | 0.181 377
|
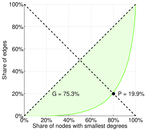
| Right balanced inequality ratio | P2 = | 0.198 666
|
| Relative edge distribution entropy | Her = | 0.707 633
|
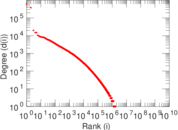
| Power law exponent | γ = | 2.161 07
|
| Tail power law exponent | γt = | 2.891 00
|
| Degree assortativity | ρ = | −0.100 821
|
| Degree assortativity p-value | pρ = | 0.000 00
|
| Spectral norm | α = | 89,274.1
|
| Algebraic connectivity | a = | 0.377 225
|
| Spectral separation | |λ1[A] / λ2[A]| = | 4.222 26
|
| Controllability | C = | 1,617,560
|
| Relative controllability | Cr = | 0.999 527
|
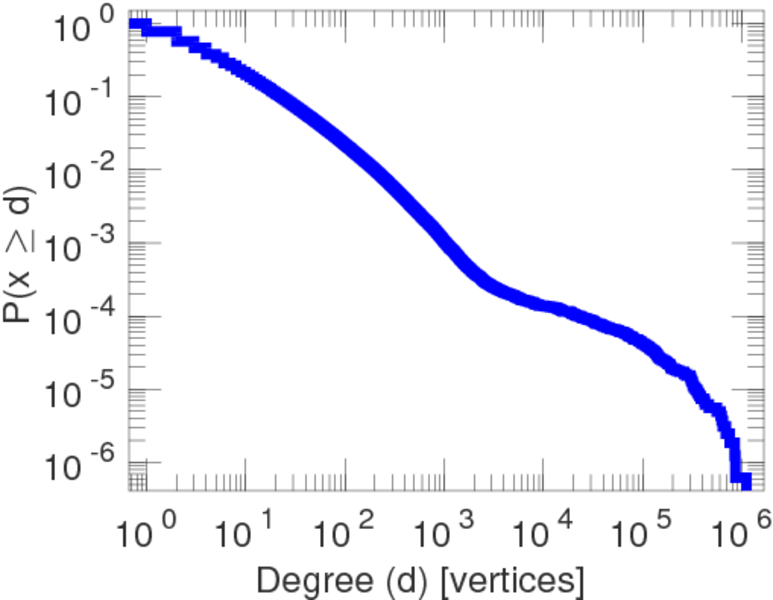
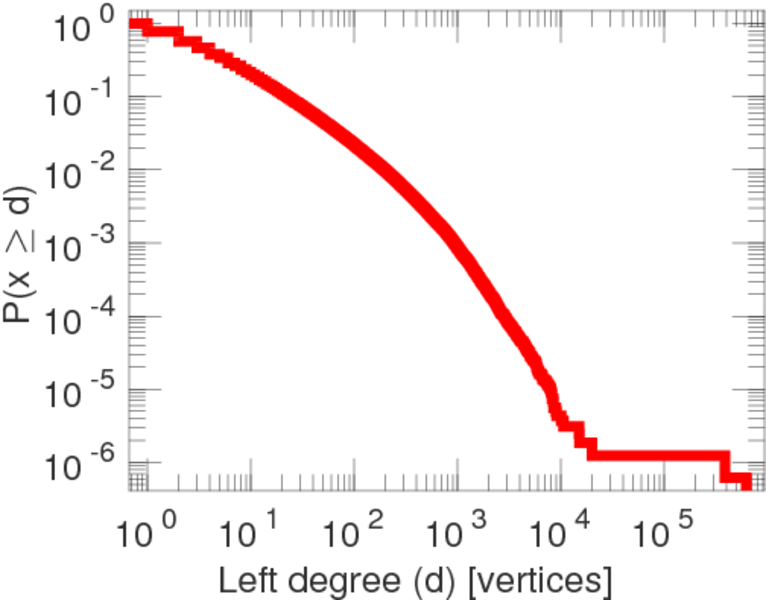
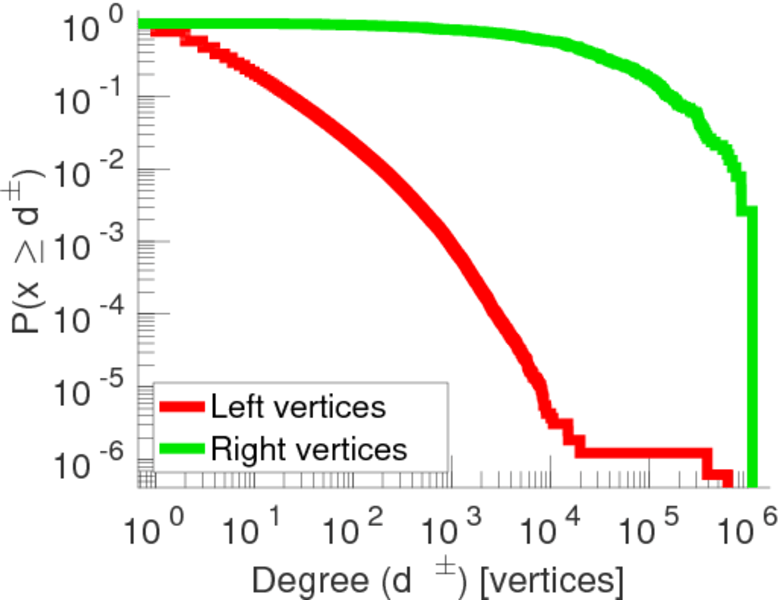
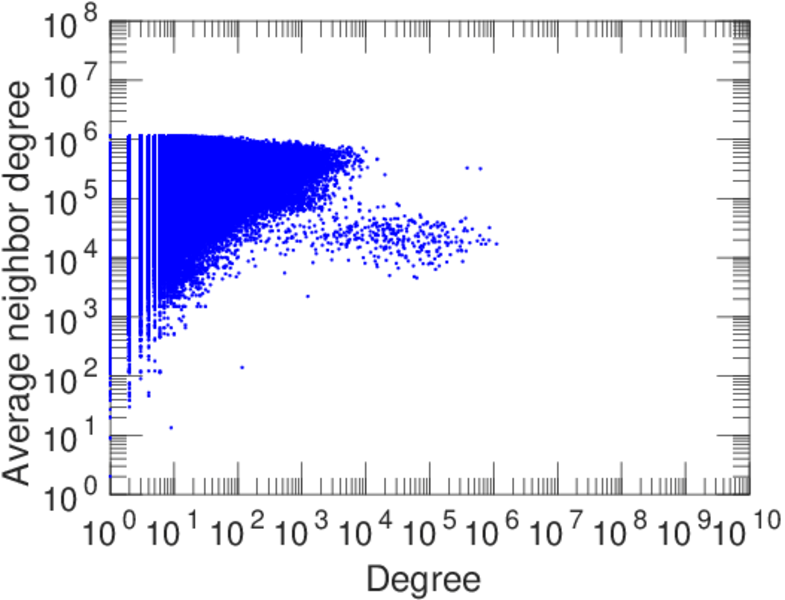
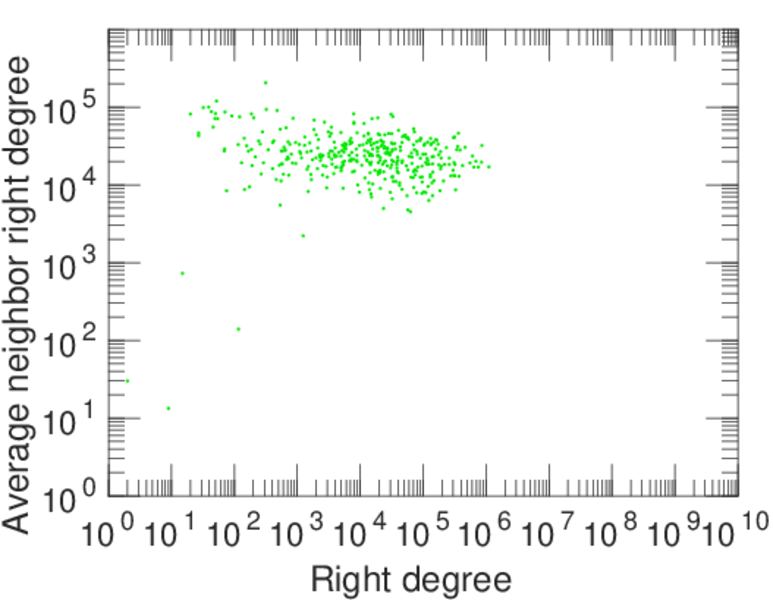
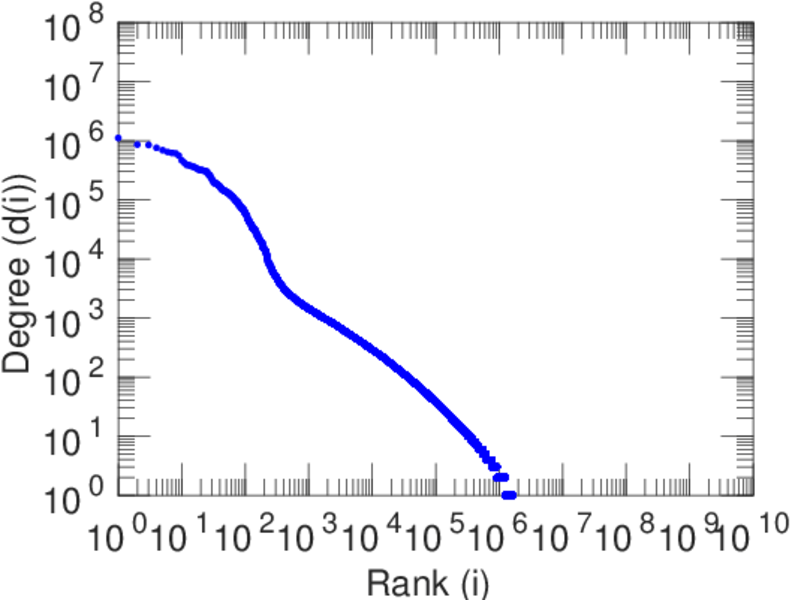
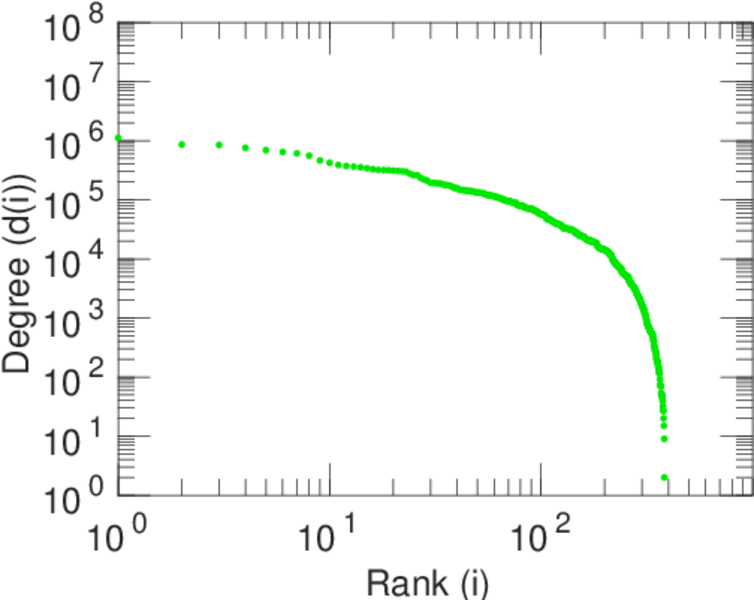
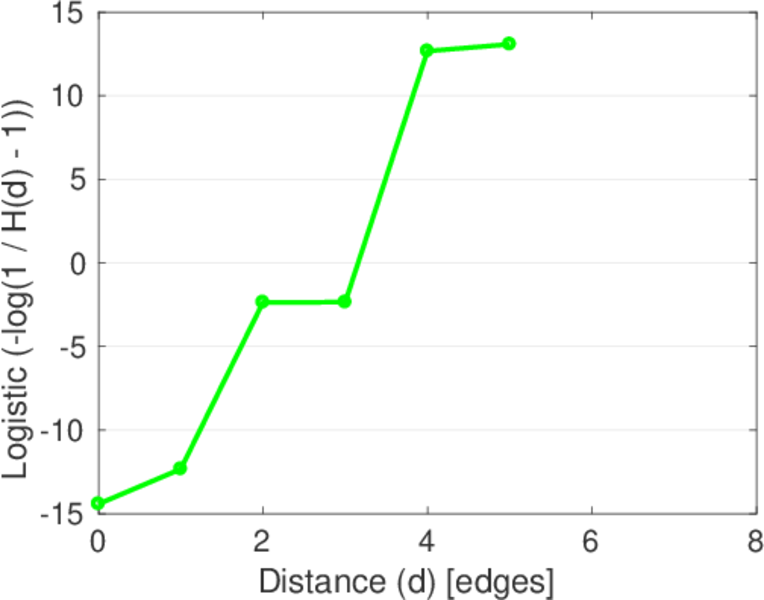
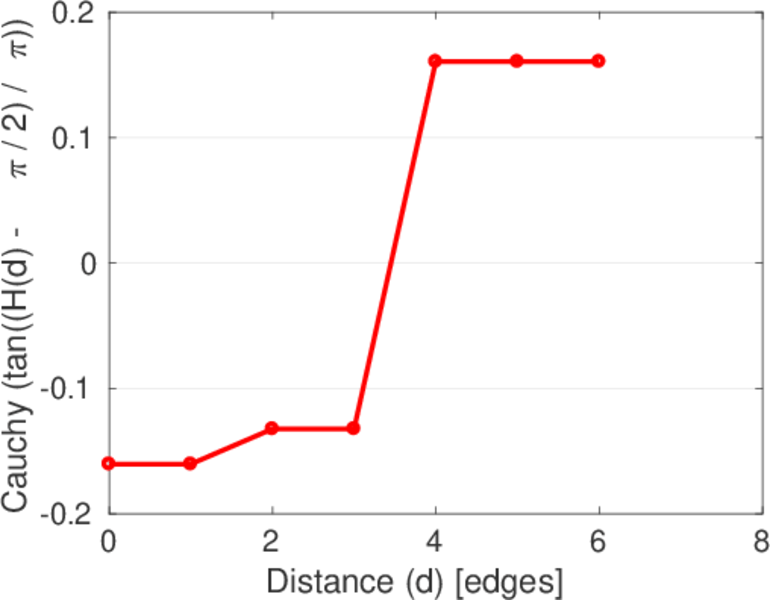
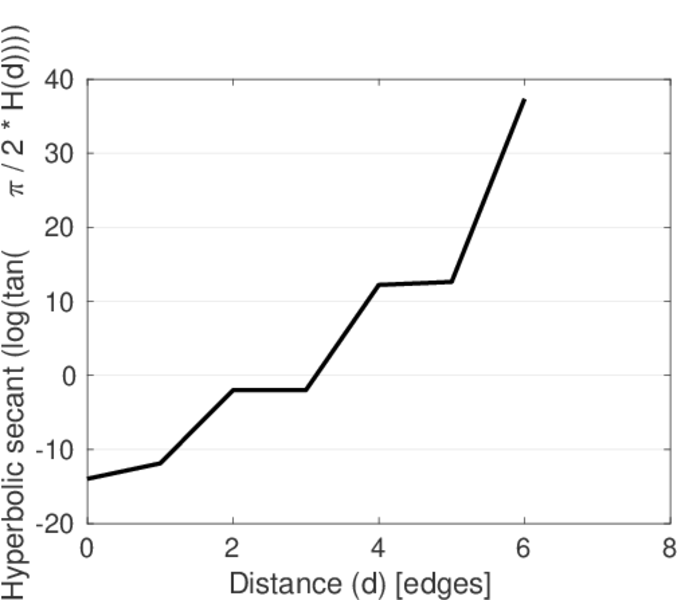
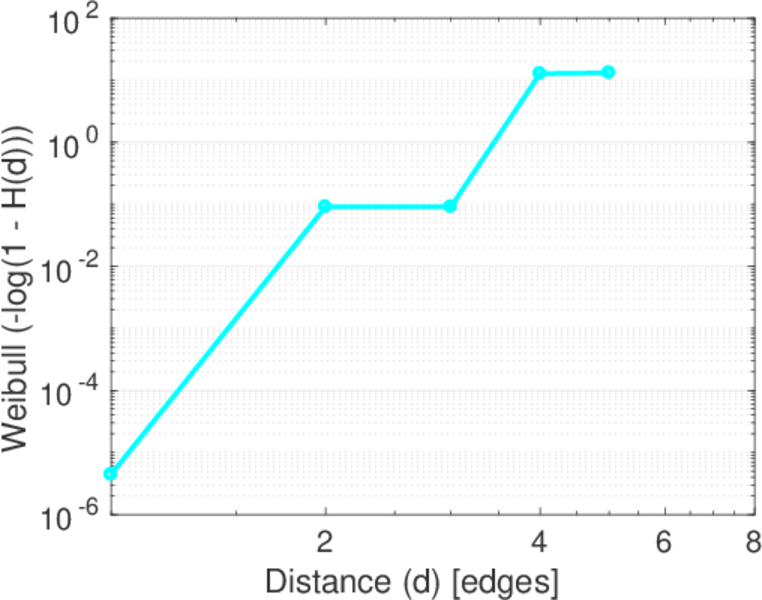
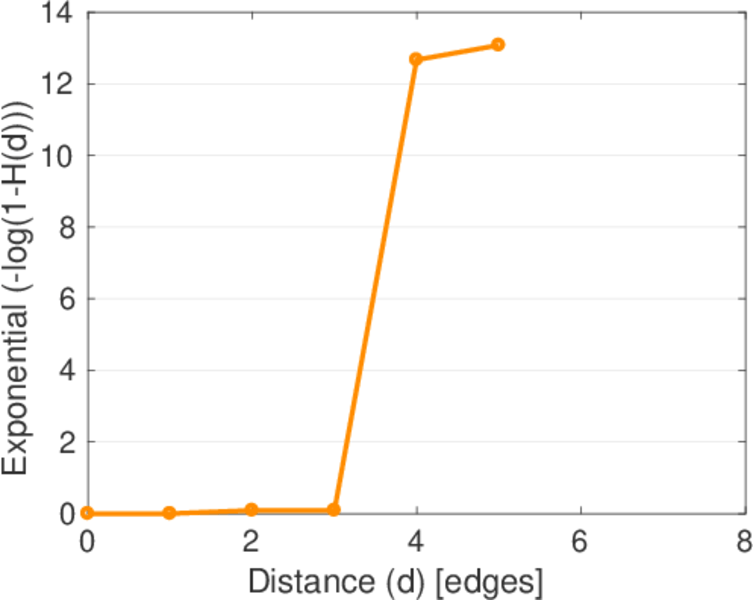
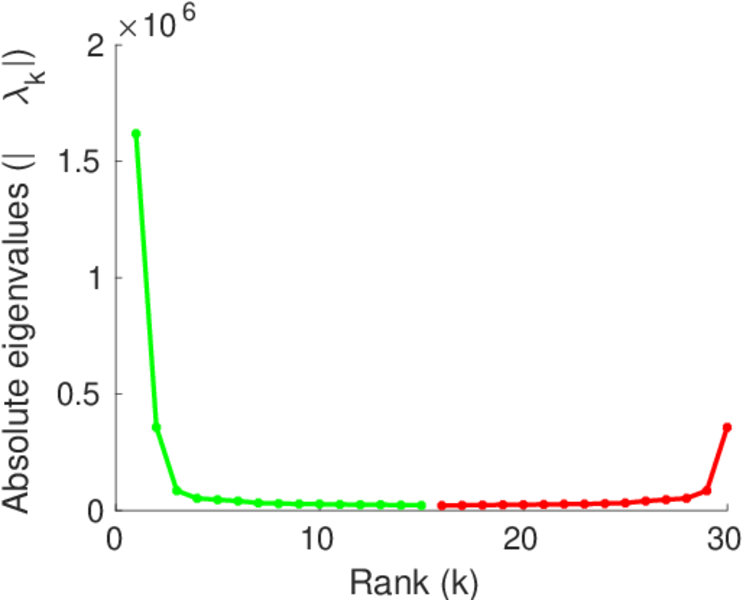
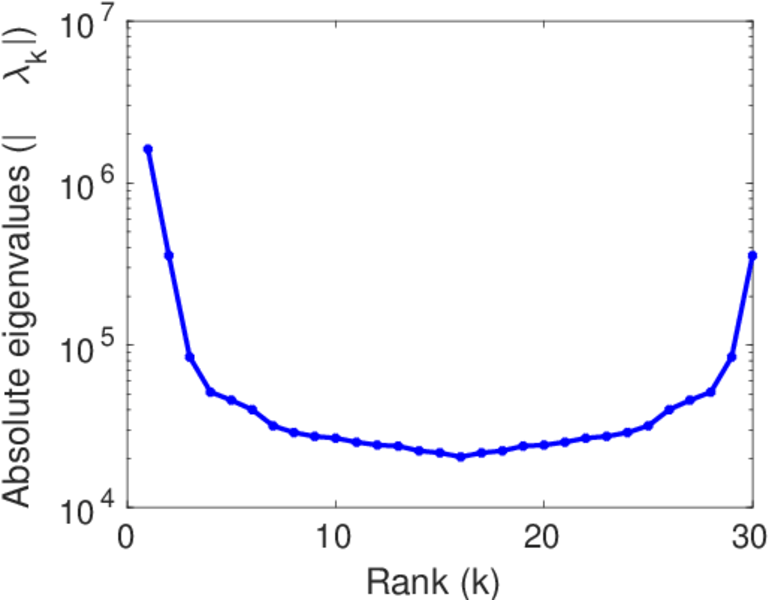
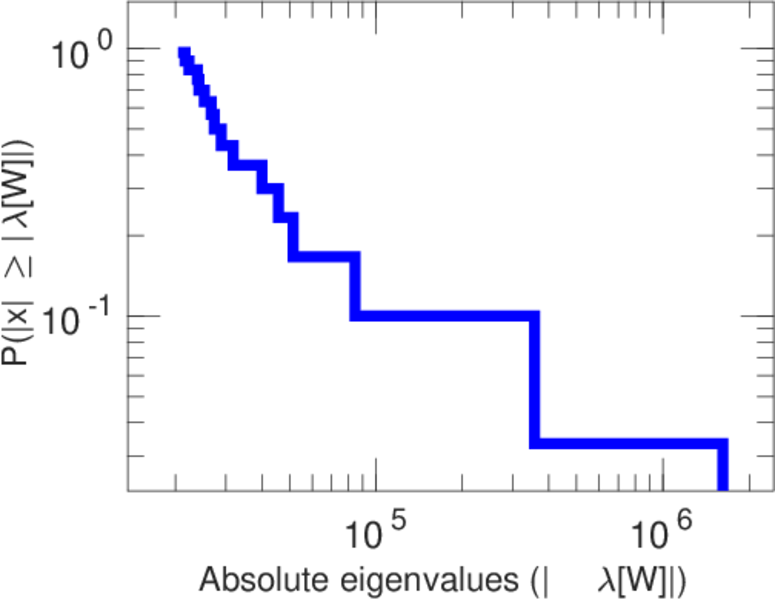
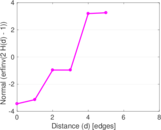
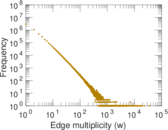
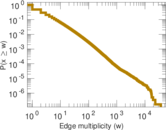
Plots


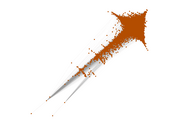
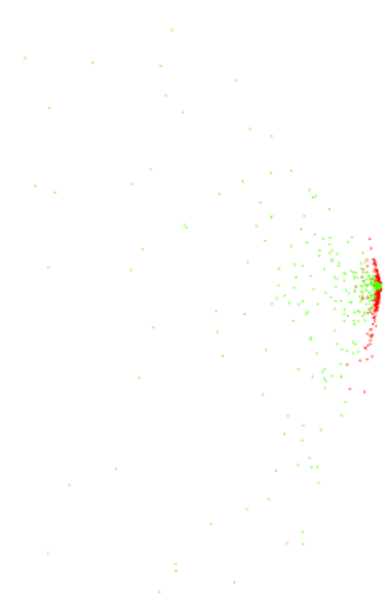
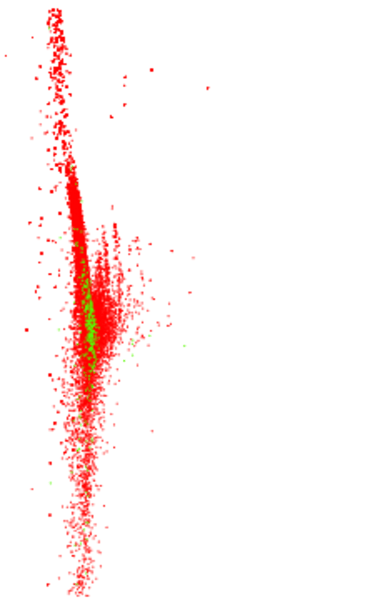
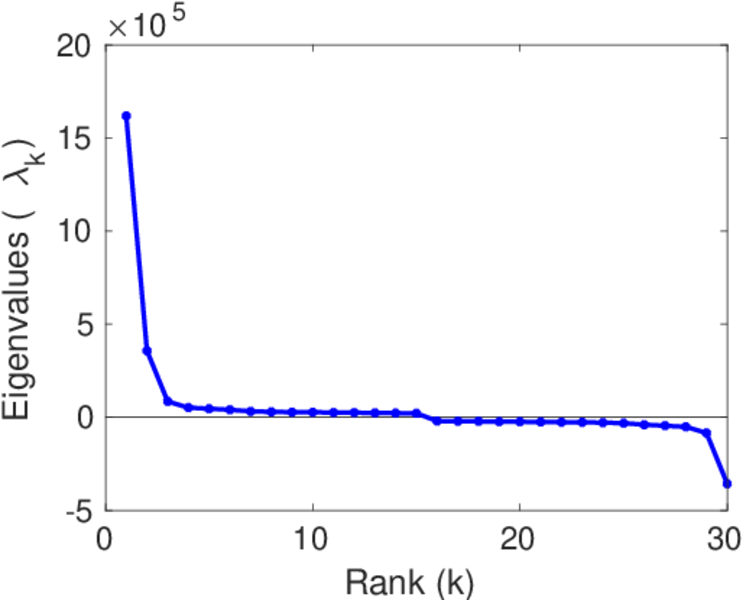
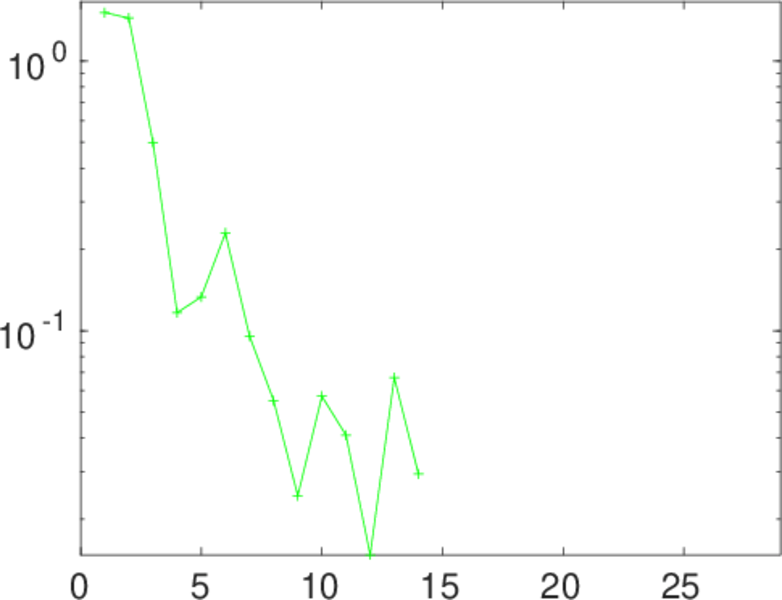
Matrix decompositions plots


Downloads
References
|
[1]
|
Jérôme Kunegis.
KONECT – The Koblenz Network Collection.
In Proc. Int. Conf. on World Wide Web Companion, pages
1343–1350, 2013.
[ http ]
|
 KONECT ‣ Networks ‣
Buy Me a Coffee
KONECT ‣ Networks ‣
Buy Me a Coffee