Wikiquote edits (en)
This is the bipartite edit network of the English Wikisource. It contains users
and pages from the English Wikisource, connected by edit events. Each edge
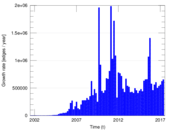
represents an edit. The dataset includes the timestamp of each edit.
Metadata
Statistics
| Size | n = | 2,210,887
|
| Left size | n1 = | 18,038
|
| Right size | n2 = | 2,192,849
|
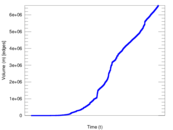
| Volume | m = | 6,561,379
|
| Unique edge count | m̿ = | 4,129,231
|
| Wedge count | s = | 192,477,058,220
|
| Claw count | z = | 11,964,977,906,617,664
|
| Cross count | x = | 7.080 63 × 1020
|
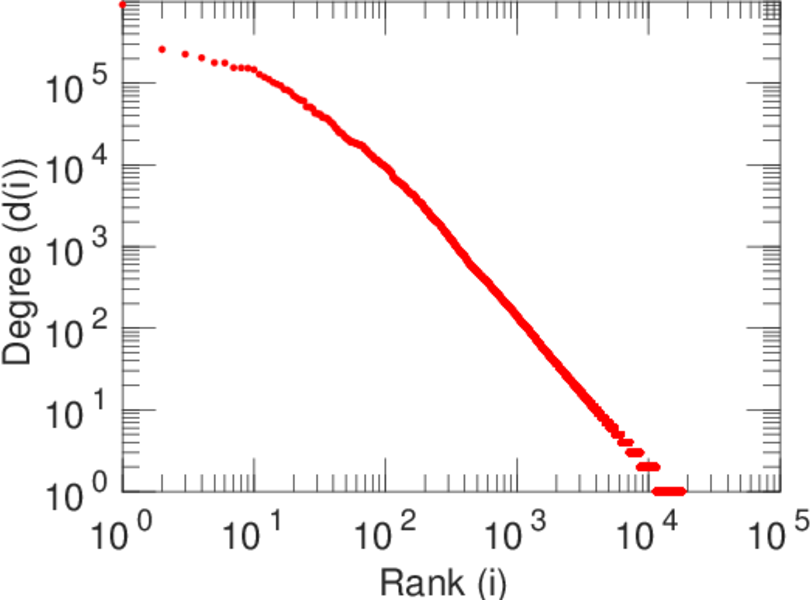
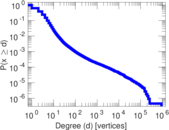
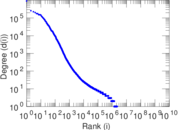
| Maximum degree | dmax = | 916,505
|
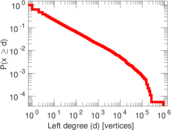
| Maximum left degree | d1max = | 916,505
|
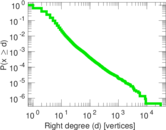
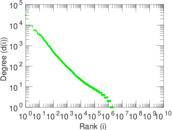
| Maximum right degree | d2max = | 30,606
|
| Average degree | d = | 5.935 52
|
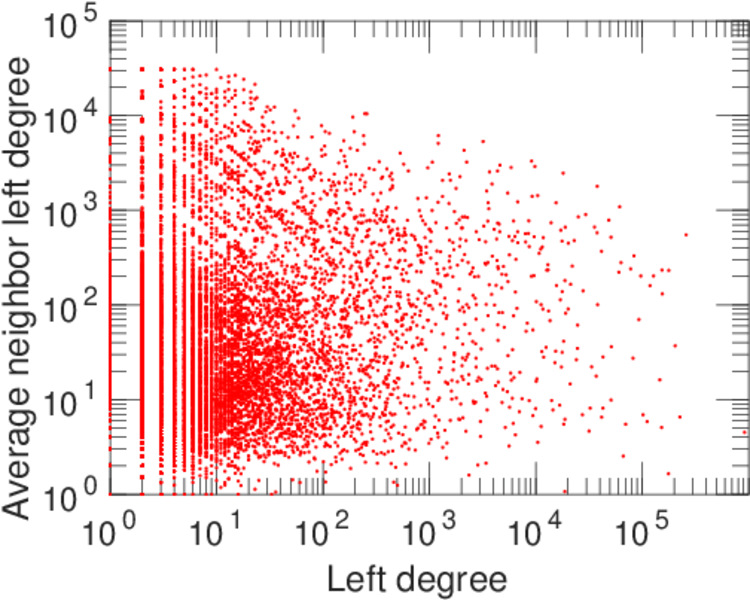
| Average left degree | d1 = | 363.753
|
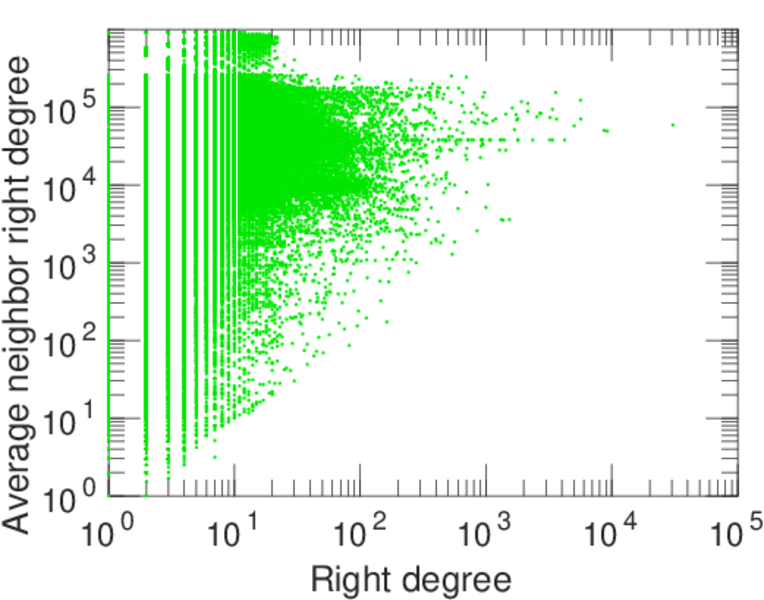
| Average right degree | d2 = | 2.992 17
|
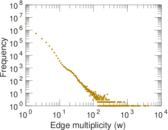
| Average edge multiplicity | m̃ = | 1.589 01
|
| Size of LCC | N = | 2,203,707
|
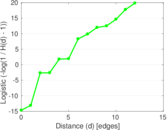
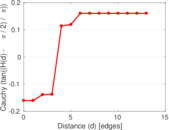
| Diameter | δ = | 15
|
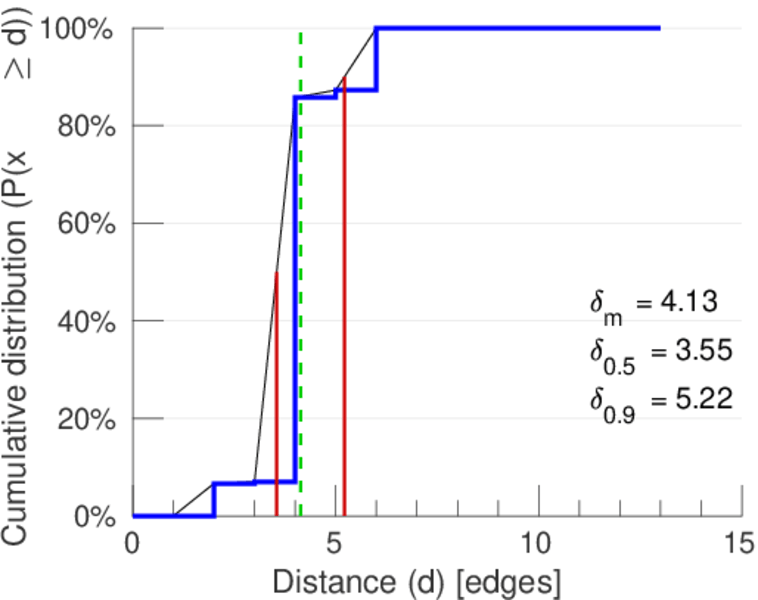
| 50-Percentile effective diameter | δ0.5 = | 3.546 28
|
| 90-Percentile effective diameter | δ0.9 = | 5.215 17
|
| Median distance | δM = | 4
|
| Mean distance | δm = | 4.134 17
|
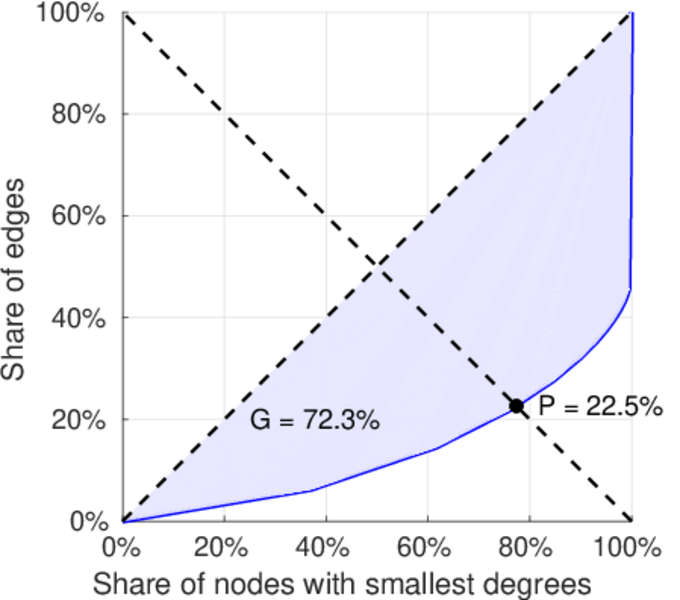
| Gini coefficient | G = | 0.725 227
|
| Balanced inequality ratio | P = | 0.222 712
|
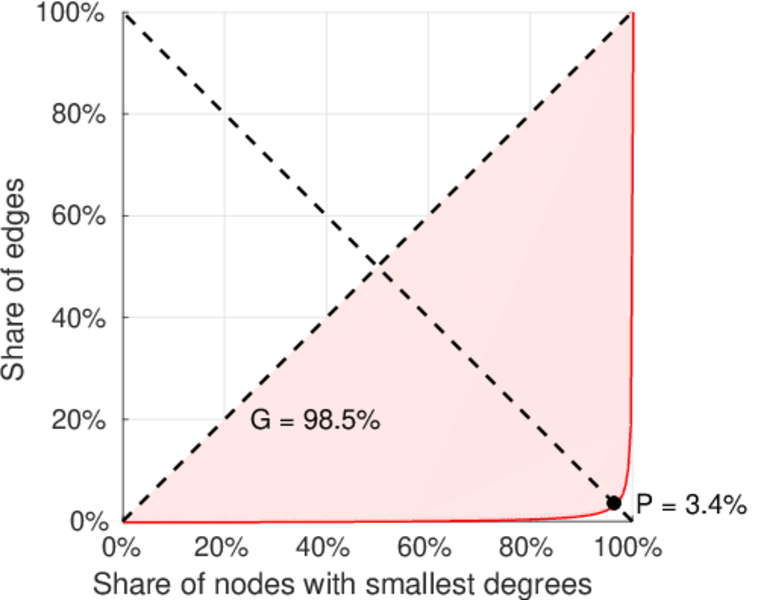
| Left balanced inequality ratio | P1 = | 0.033 994 1
|
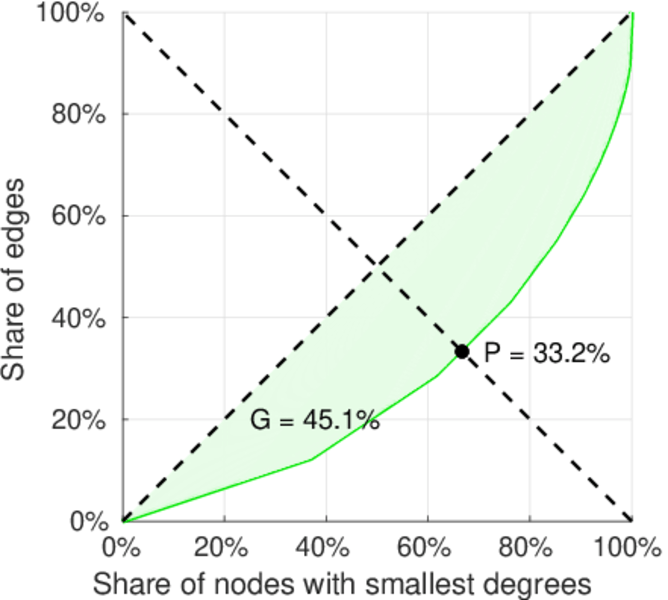
| Right balanced inequality ratio | P2 = | 0.331 631
|
| Power law exponent | γ = | 3.170 76
|
| Tail power law exponent | γt = | 1.571 00
|
| Tail power law exponent with p | γ3 = | 1.571 00
|
| p-value | p = | 0.170 000
|
| Left tail power law exponent with p | γ3,1 = | 1.541 00
|
| Left p-value | p1 = | 0.462 000
|
| Right tail power law exponent with p | γ3,2 = | 3.381 00
|
| Right p-value | p2 = | 0.003 000 00
|
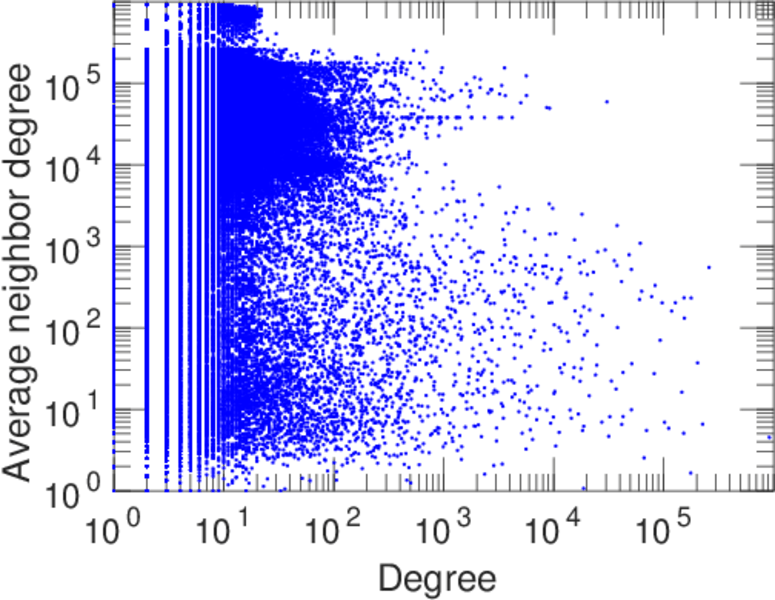
| Degree assortativity | ρ = | −0.060 458 0
|
| Degree assortativity p-value | pρ = | 0.000 00
|
| Controllability | C = | 2,178,890
|
| Relative controllability | Cr = | 0.986 758
|
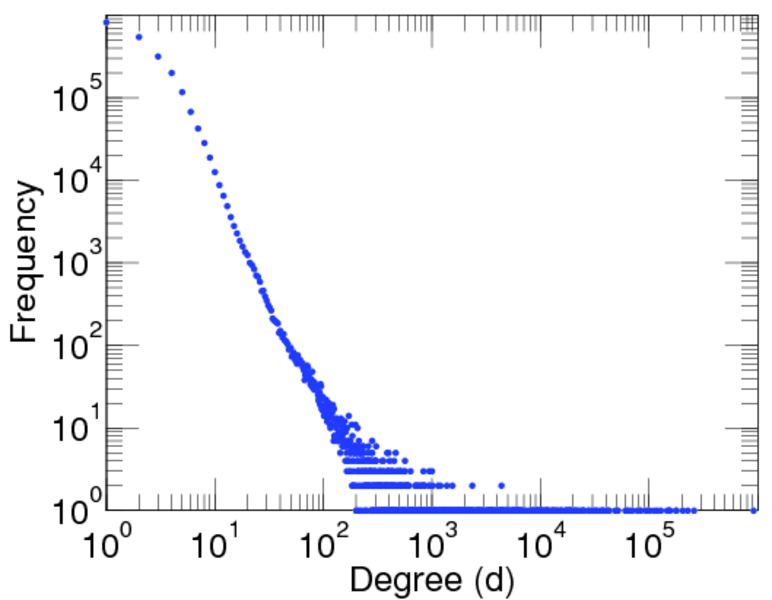
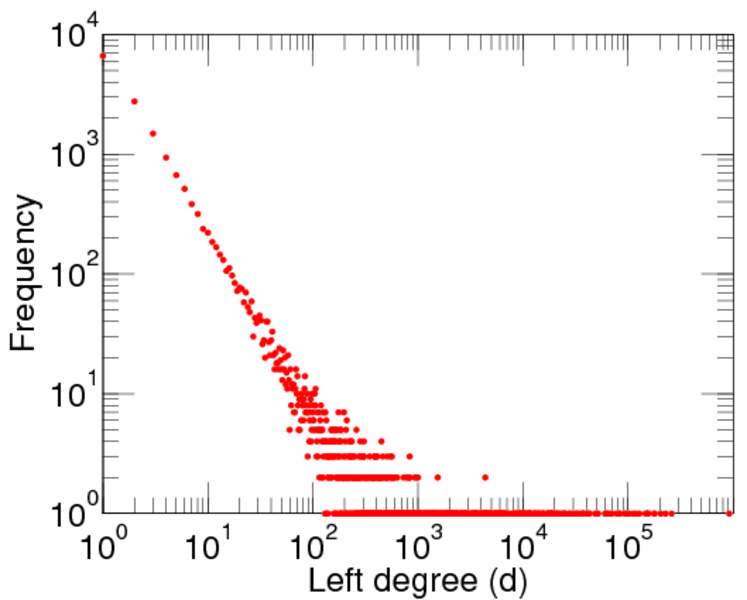
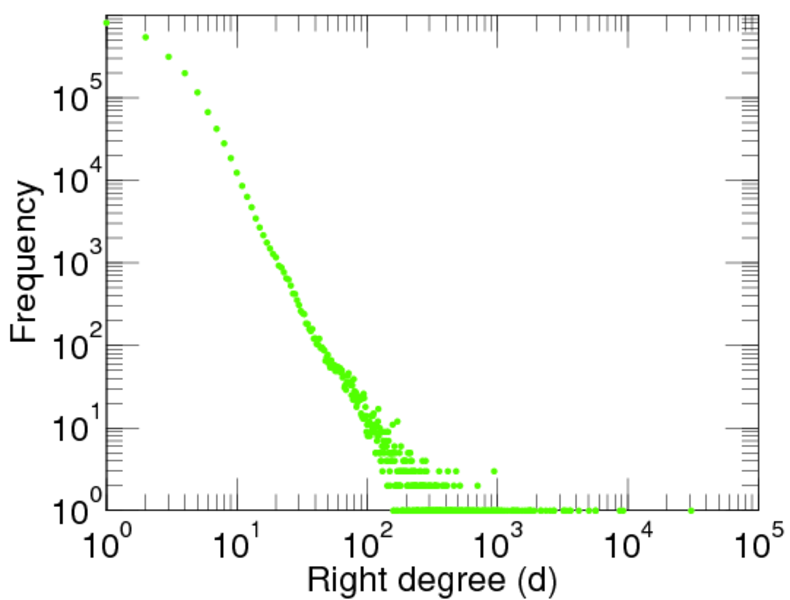
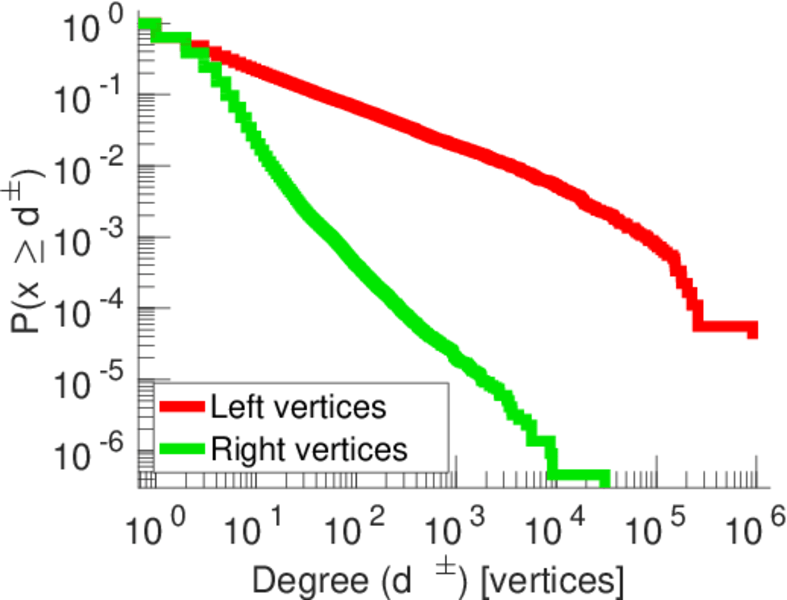
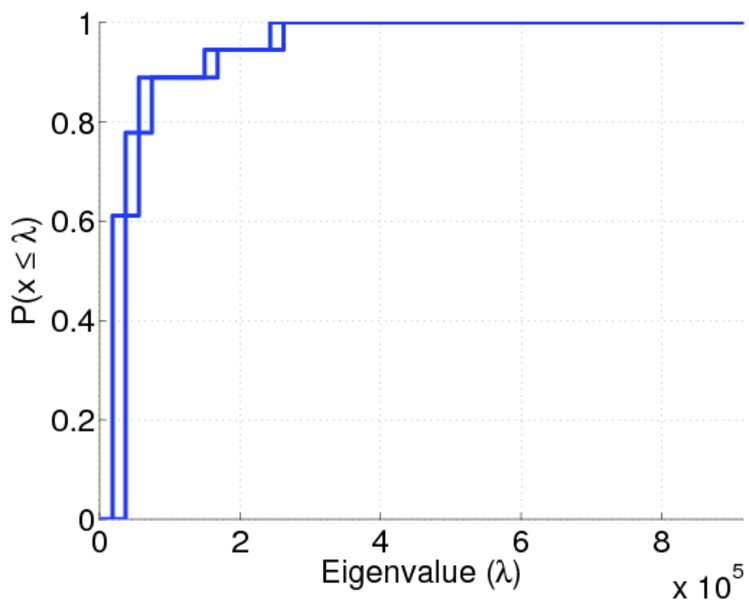
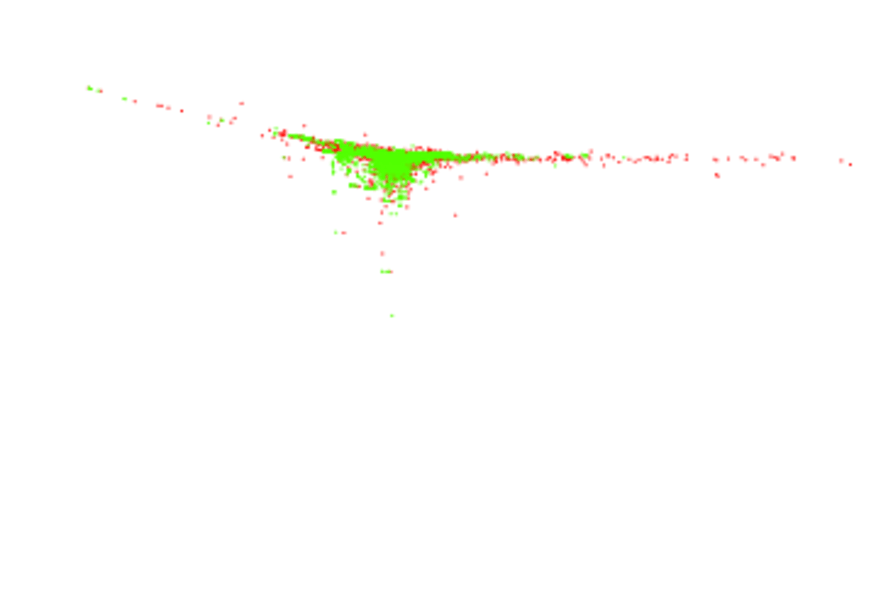
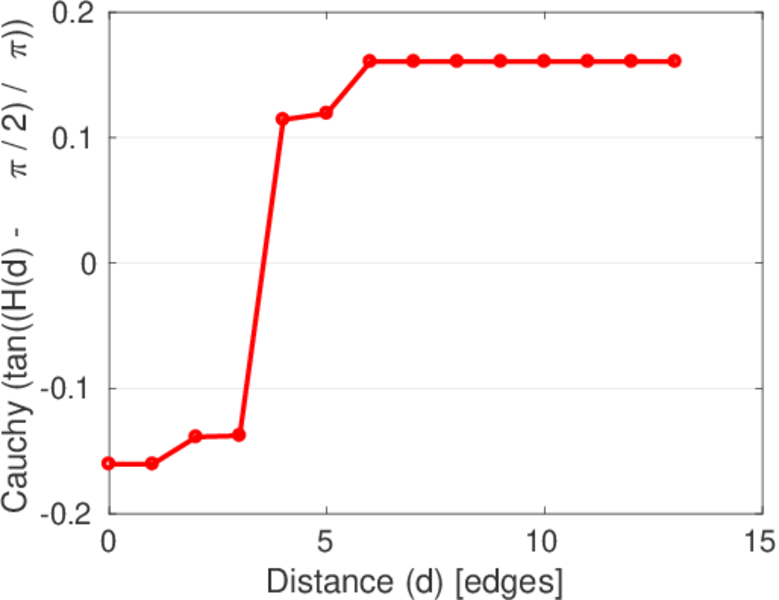
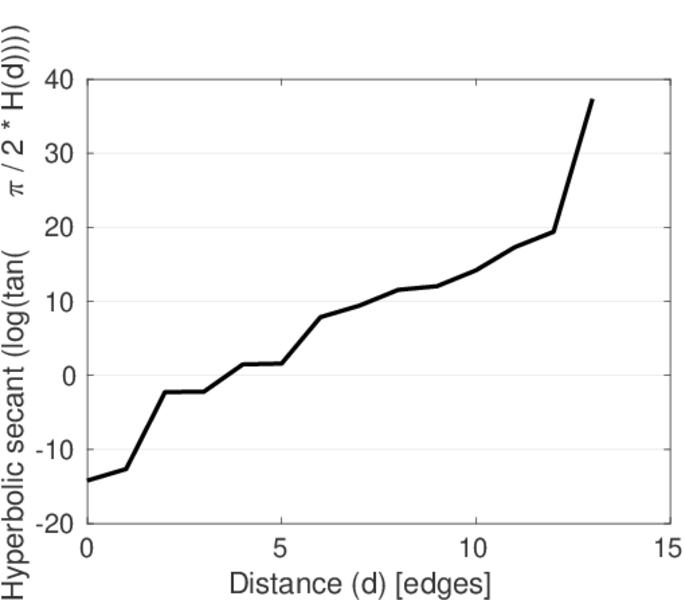
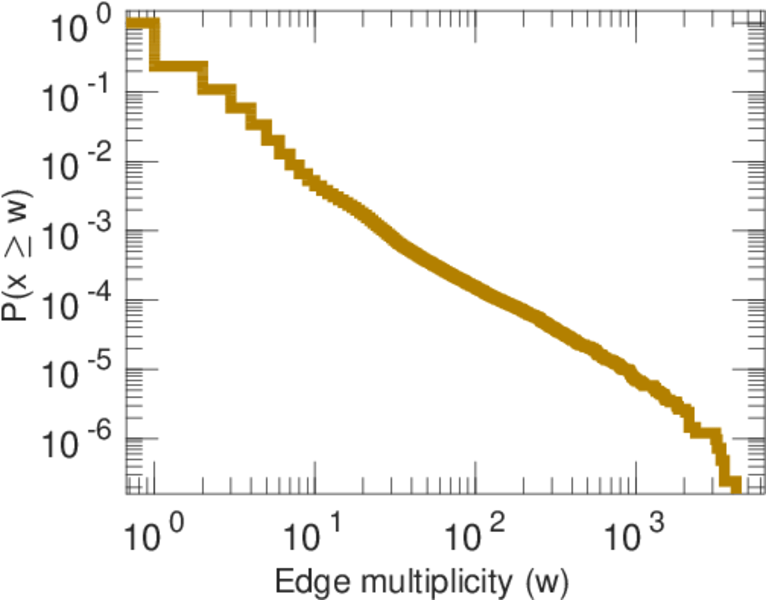
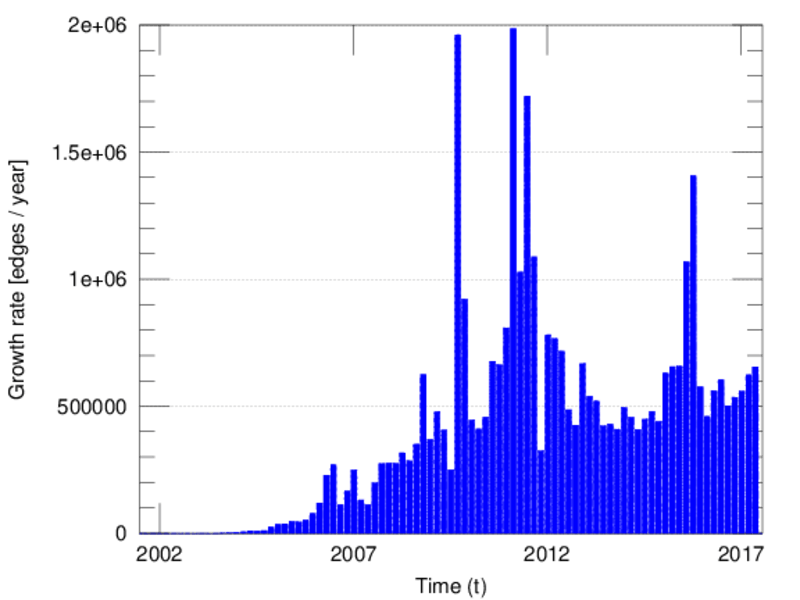
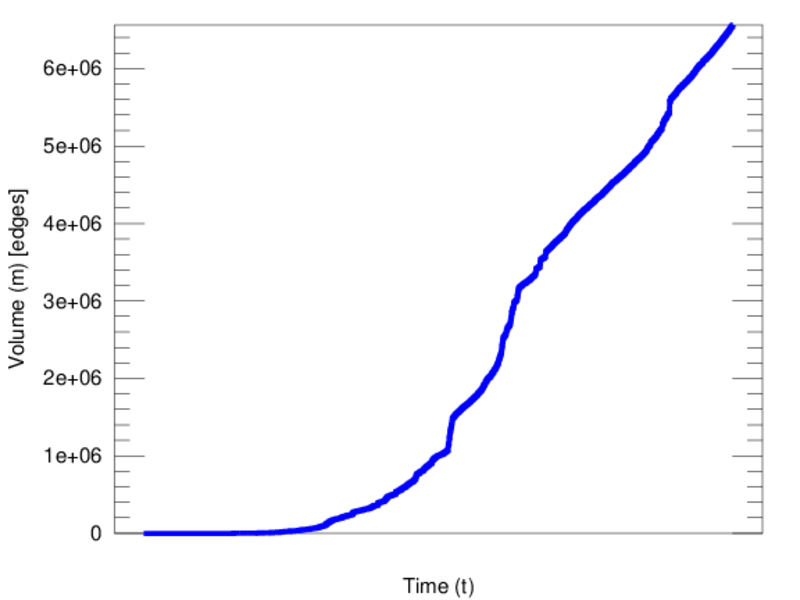
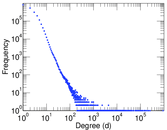
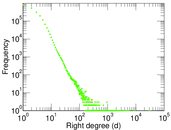
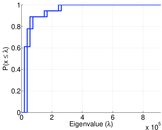
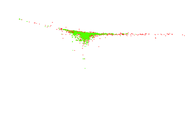
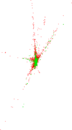
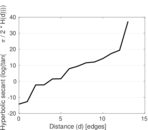
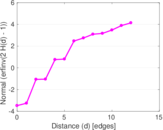
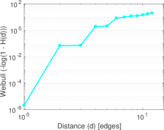
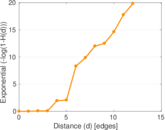
Plots


Downloads
References
|
[1]
|
Jérôme Kunegis.
KONECT – The Koblenz Network Collection.
In Proc. Int. Conf. on World Wide Web Companion, pages
1343–1350, 2013.
[ http ]
|
|
[2]
|
Wikimedia Foundation.
Wikimedia downloads.
http://dumps.wikimedia.org/, January 2010.
|
 KONECT ‣ Networks ‣
Buy Me a Coffee
KONECT ‣ Networks ‣
Buy Me a Coffee