Wikipedia edits (es)
This is the bipartite edit network of the Spanish Wikipedia. It contains users
and pages from the Spanish Wikipedia, connected by edit events. Each edge
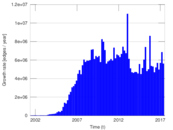
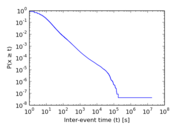
represents an edit. The dataset includes the timestamp of each edit.
Metadata
Statistics
| Size | n = | 6,888,897
|
| Left size | n1 = | 953,483
|
| Right size | n2 = | 5,935,414
|
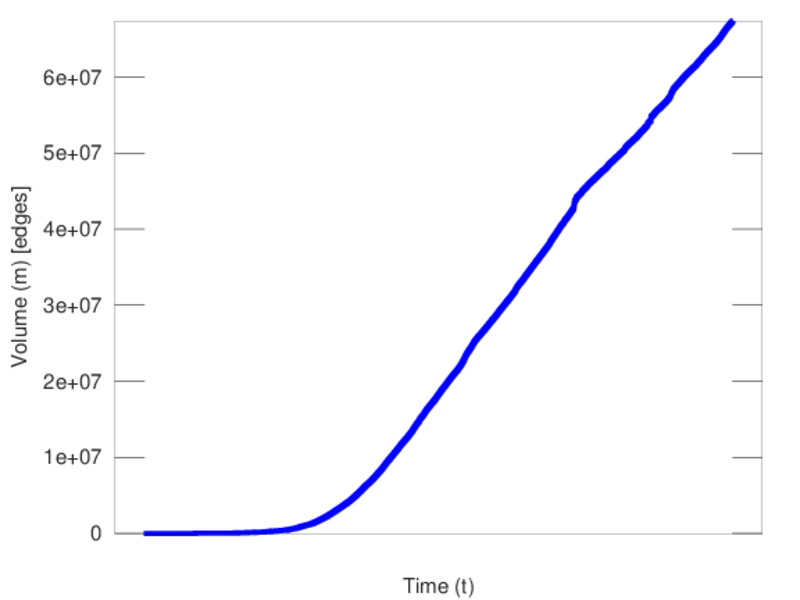
| Volume | m = | 67,426,422
|
| Unique edge count | m̿ = | 30,591,134
|
| Wedge count | s = | 2,126,236,949,528
|
| Claw count | z = | 364,321,571,344,455,360
|
| Cross count | x = | 4.084 55 × 1022
|
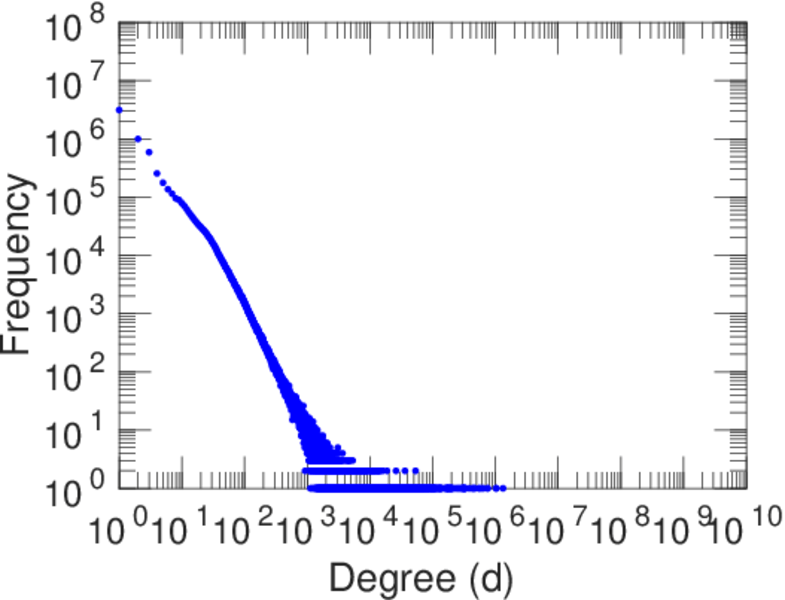
| Maximum degree | dmax = | 1,321,626
|
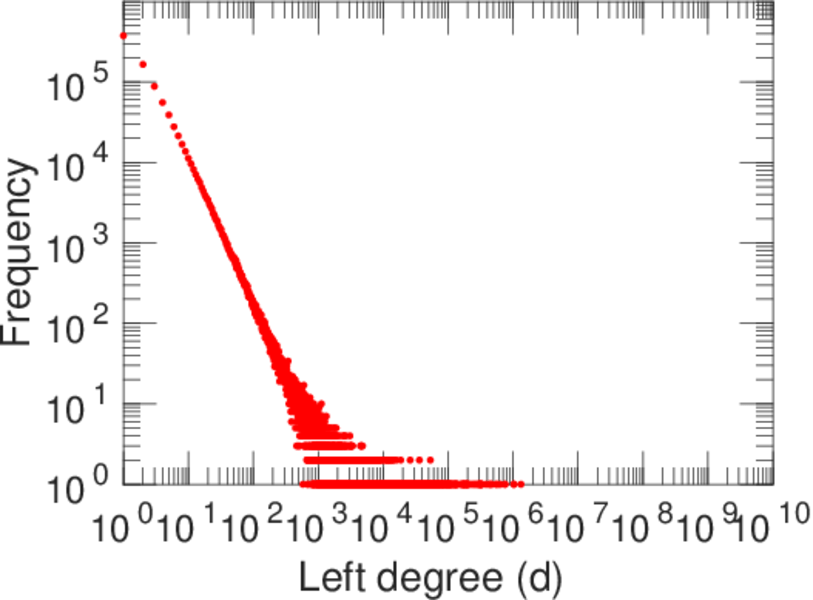
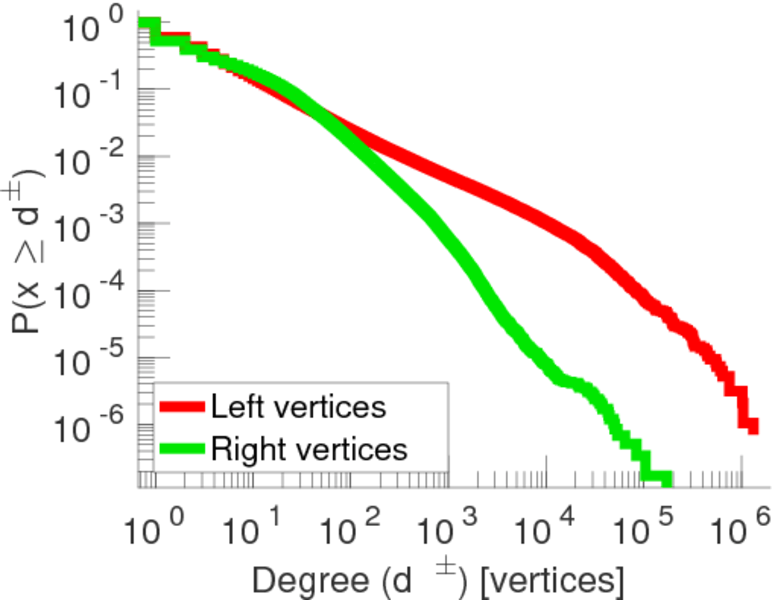
| Maximum left degree | d1max = | 1,321,626
|
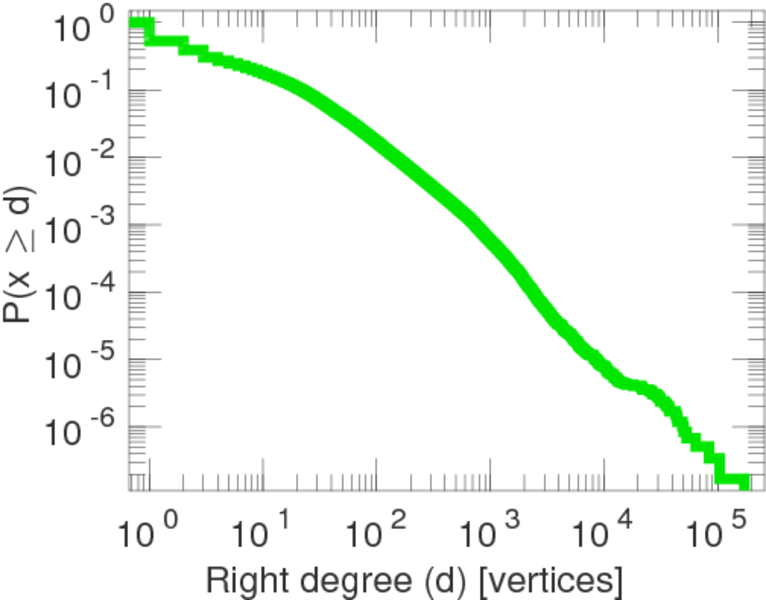
| Maximum right degree | d2max = | 172,327
|
| Average degree | d = | 19.575 4
|
| Average left degree | d1 = | 70.715 9
|
| Average right degree | d2 = | 11.360 0
|
| Fill | p = | 5.405 45 × 10−6
|
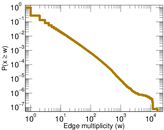
| Average edge multiplicity | m̃ = | 2.204 12
|
| Size of LCC | N = | 6,659,818
|
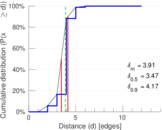
| Diameter | δ = | 15
|
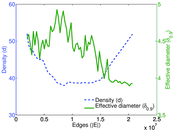
| 50-Percentile effective diameter | δ0.5 = | 3.466 83
|
| 90-Percentile effective diameter | δ0.9 = | 4.165 93
|
| Median distance | δM = | 4
|
| Mean distance | δm = | 3.907 39
|
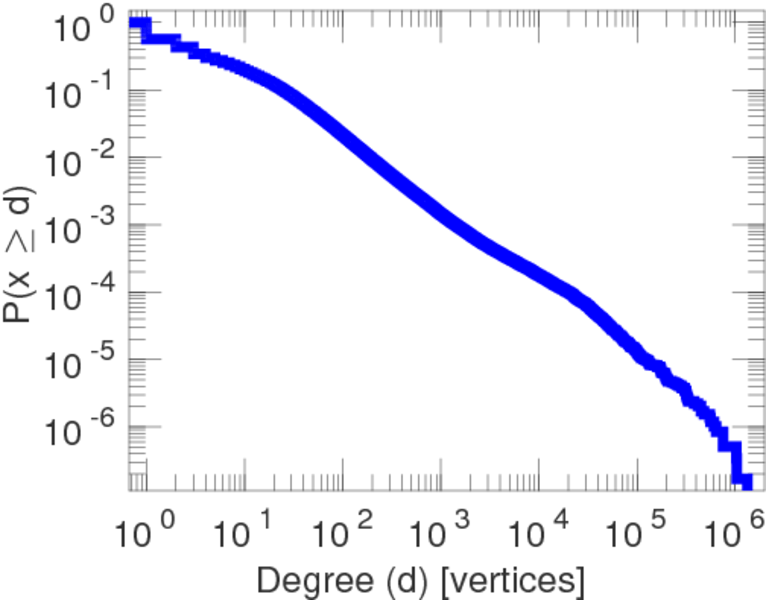
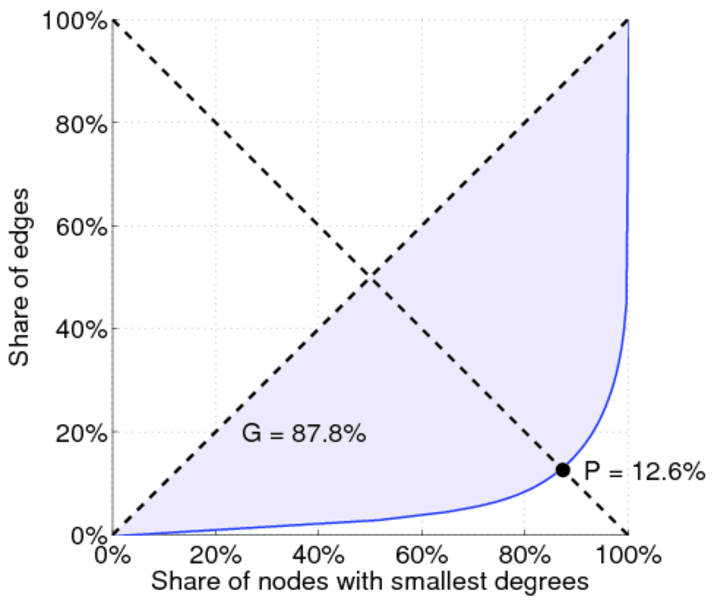
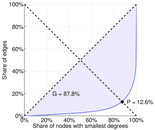
| Gini coefficient | G = | 0.884 540
|
| Balanced inequality ratio | P = | 0.124 369
|
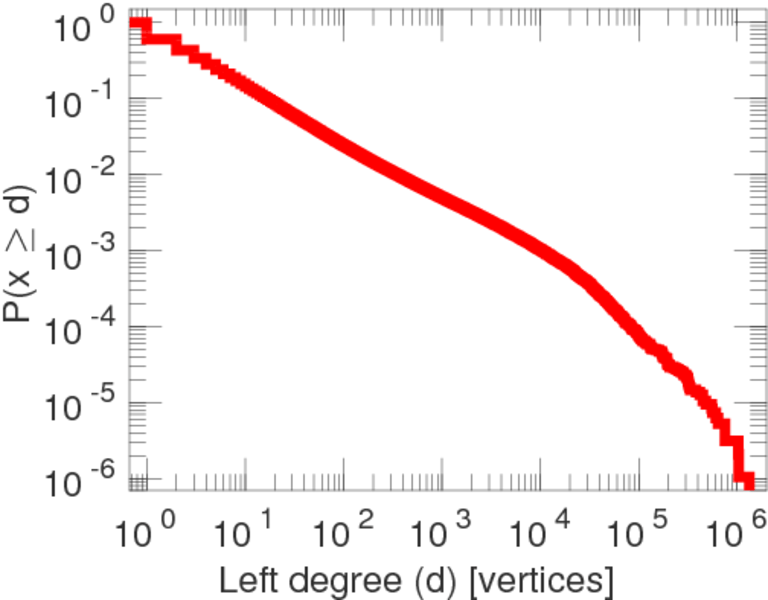
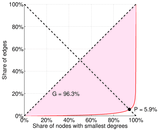
| Left balanced inequality ratio | P1 = | 0.054 286 2
|
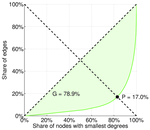
| Right balanced inequality ratio | P2 = | 0.162 370
|
| Relative edge distribution entropy | Her = | 0.746 216
|
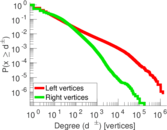
| Power law exponent | γ = | 2.471 10
|
| Tail power law exponent | γt = | 2.451 00
|
| Degree assortativity | ρ = | −0.029 906 0
|
| Degree assortativity p-value | pρ = | 0.000 00
|
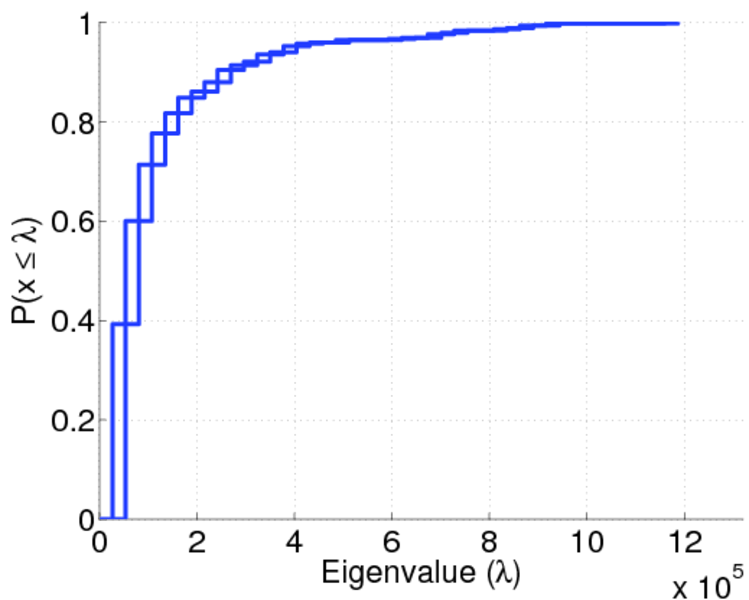
| Spectral norm | α = | 86,629.9
|
| Spectral separation | |λ1[A] / λ2[A]| = | 1.846 50
|
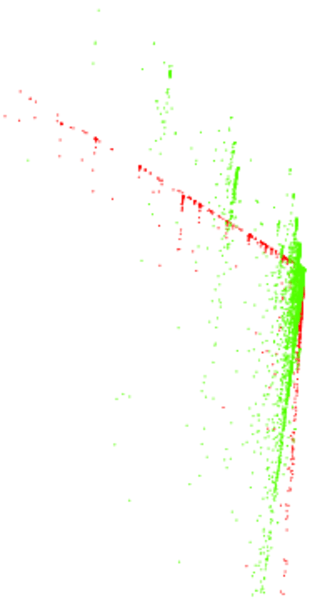
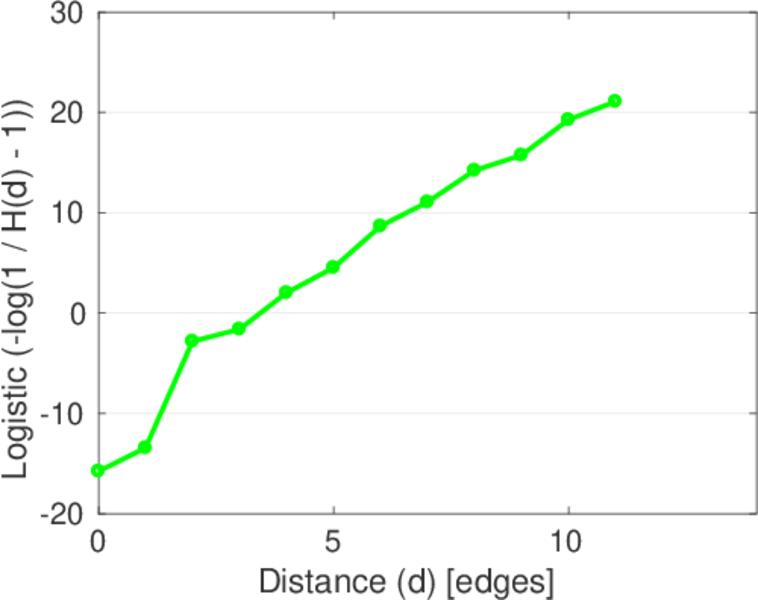
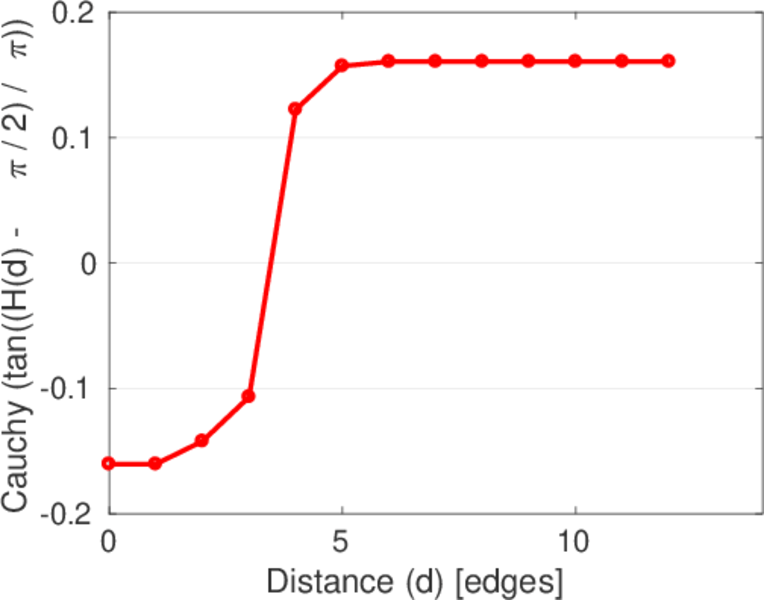
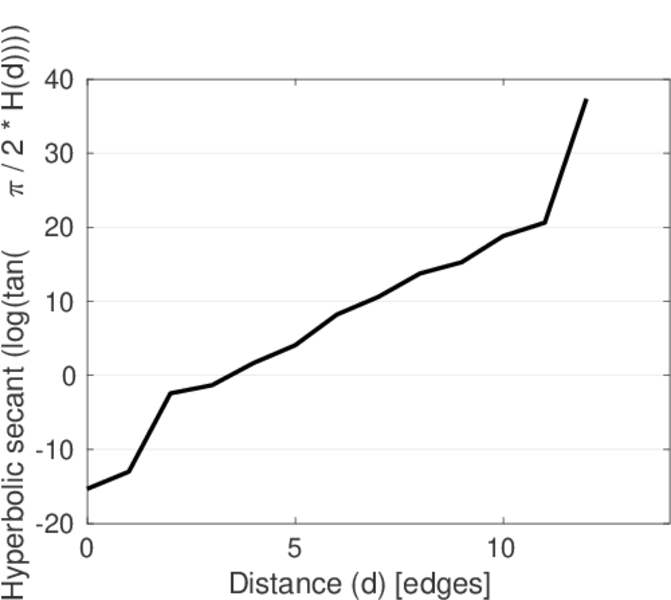
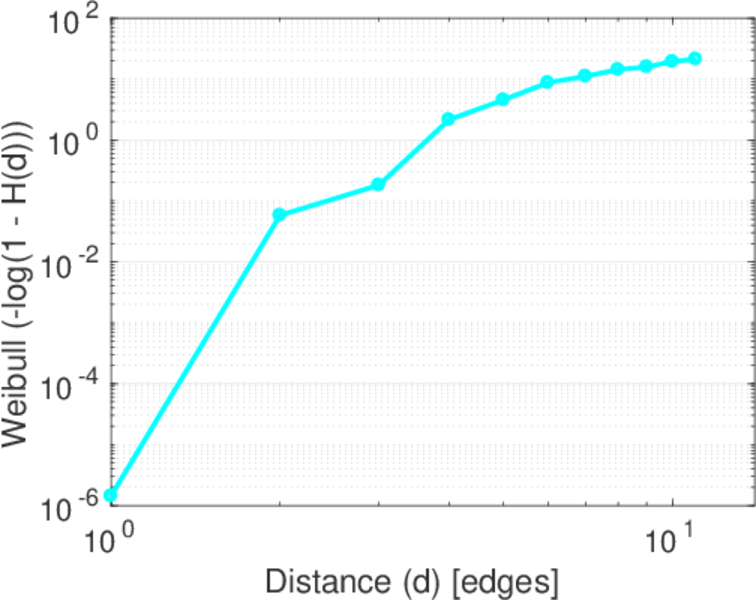
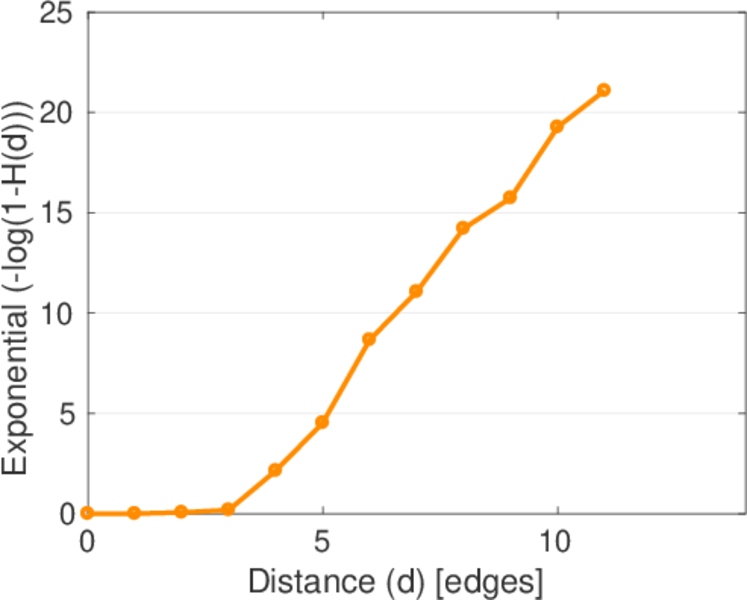
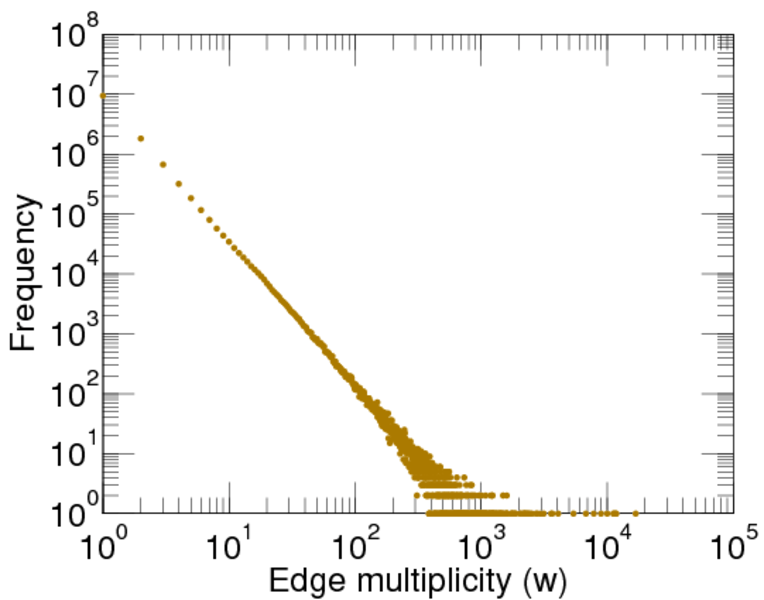
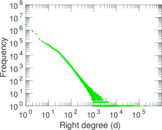
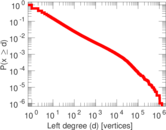
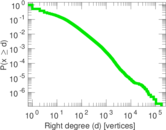
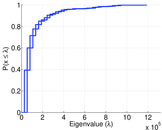
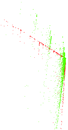
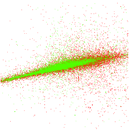
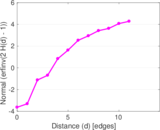
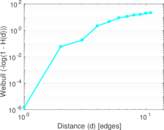
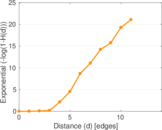
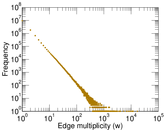
Plots


Downloads
References
|
[1]
|
Jérôme Kunegis.
KONECT – The Koblenz Network Collection.
In Proc. Int. Conf. on World Wide Web Companion, pages
1343–1350, 2013.
[ http ]
|
|
[2]
|
Wikimedia Foundation.
Wikimedia downloads.
http://dumps.wikimedia.org/, January 2010.
|
 KONECT ‣ Networks ‣
Buy Me a Coffee
KONECT ‣ Networks ‣
Buy Me a Coffee